Multiscale water diffusivity prediction of plain woven composites considering void defects
-
Meng Wang


Abstract
To reveal the effects of void defects on the diffusivities of plain woven composites, a multiscale analysis framework considering the microscale and mesoscale voids is developed in this study. Different void modeling methods and analysis strategies are used to reveal the effects of void size, void shape, and void modeling assumptions on the equivalent diffusivities of the tows and plain woven composites. The analysis results show that the transverse or longitudinal diffusivities of tows predicted with an element-based modeling method are larger than those with void shapes considered. Considering void shape results in the variation of the predicted diffusivities. Based on the uniform assumption used for modeling the voids in the tows, the through-thickness and in-plane diffusivities are found to be dependent on the transverse and longitudinal diffusivities, respectively. Based on the element-based void modeling method for the tows, the predicted values are larger than those based on the uniform assumption. These tow void modeling methods cannot result in variation within predicted values. The effects of void shapes in the pure matrix on the diffusivities are also revealed, and the variation is observed.
1 Introduction
Composites have very large potential for the construction of ships due to their superior corrosion resistance property. However, the water can ingress into the composite and result in the degradation of mechanical properties. To understand the mechanisms of water absorption and mechanical property degradation, the first step is to obtain the diffusivities of composites.
Many studies are focusing on predicting the diffusivities of unidirectional composites [1–3]. Compared with unidirectional composites, woven composites have more complex internal structures. To predict the diffusivities of the woven composites with the diffusivities of the constituents, both numerical and analytical methods have been developed. In the study of Tang et al. [4], an idealized mesoscale representative volume element (RVE) was established to predict the water diffusion process within the woven composites. Then, the developed numerical analysis procedures were used to evaluate the tow architectural effects. Pasupuleti et al. also tried to analyze the water ingression within woven composites numerically [5]. Based on the mixed integral point element model, Yuan and Zhou analyzed the water diffusion processes in the braided composites, and the effects of the mesoscale structure characters were evaluated [6]. Besides the numerical methods, the analytical method was developed in the study of Heide-Jørgensen et al. [7,8] to predict the through-thickness diffusivity of plain woven composites based on the idealized mesoscale RVE.
In the aforementioned studies, only idealized mesoscale RVE is adopted. However, there are many structural characteristics in woven/braided composites. Among them, void defects are critical to composite properties, and they are inevitable due to the manufacturing process [9]. Many studies have evaluated the effects of void defects on the elastic and non-elastic properties of unidirectional composites, woven and braided composites with numerical methods. To consider the voids during the numerical analysis, different void modeling methods have been developed, such as the matrix element-based modeling method [10] and the geometry-based modeling method [11]. With the matrix element-based modeling method, Huang and Gong [12] evaluated the effects of void volume fraction on the equivalent elastic parameters of woven composite. With the method, Zhang et al. [13] analyzed the effects of voids on the progressive damage behaviors of polymer composites, and Xu et al. [14] analyzed the effects of voids on the damage behaviors of ceramic composites. With the geometry-based modeling method, Nikopour [15] analyzed the effects of voids on the transverse elastic properties of unidirectional composites. Ge et al. [16] analyzed the influences of voids on the equivalent elastic properties of braided composites. However, too many elements are needed to discretize the 3D model with void geometry considered. A void modeling method with void geometry considered based on the finite-element method (FEM) was established in the study of Wang [10]. With that, the effects of the voids on the damage behaviors of woven composites can be evaluated efficiently.
To reveal the effects of voids on the properties of woven or braided composites, in which the tows are regarded as unidirectional composites, multiscale methods should be used. There are also different void modeling methods developed for the tows. One is based on the uniform assumption [16,17]. It means that the void volume fraction in each tow element is set to be the same, and the properties of the tows are derived through the microscale RVE with the same void volume fraction. Another one is realized by randomly choosing some tows’ elements [18,19]. Within the chosen tow elements, it is assumed that there is no matrix bonding with the fibers. Based on this assumption, the properties of the chosen elements are changed to evaluate the effects of voids within tows.
Some studies focus on evaluating the effects of voids on the water diffusivity of unidirectional composites. In the study of Bourennane et al. [20], the effects of the void shape on the water absorption process have been described with the FEM. Besides, the coupling effects of the voids and water absorption on the transverse progressive damage behaviors of unidirectional composites were analyzed [21]. In the study of Wang and Hang [22], different microstructure characteristics at the microscale including void volume fraction, void shape, and void distribution patterns on the transverse diffusivities of unidirectional composites have been analyzed. It was found that the characteristics of voids contribute to the increase of the transverse diffusivities.
From the aforementioned review, it can be found that the voids have significant influences on the properties of the composite including the water diffusivity. Different void modeling methods and multiscale analysis strategies have been developed for evaluating the effects of voids on mechanical properties. However, fewer studies focus on revealing the influences of voids on the water diffusivity values of woven composites across the microscale and mesoscale. In this study, the effects will be evaluated with the multiscale methods. Besides, different void modeling methods and different multiscale analysis strategies will be compared. In Section 2, based on the multiscale analysis framework, RVEs at the microscale and mesoscale are introduced with voids considered. In Section 3, the diffusivity prediction methods are presented including numerical and analytical methods. In Section 4, the effects of the voids on the diffusivities are discussed at the microscale and mesoscale, respectively.
2 Finite-element models
2.1 Microscale RVE
The constituents’ properties and geometrical parameters adopted in this study will be referred from the study of Pasupuleti et al. [5]. The fiber volume fraction at the microscale is set to be 78% as that in the study of Pasupuleti et al. [5]. As the fiber volume fraction is very large, instead of using the fiber random distribution model, the fiber hexagonal distribution model is adopted to describe the microstructure. This assumption is widely adopted for the damage analysis of the woven composite with a high local fiber volume fraction at the microscale [23]. The fiber radius is set to be 7 μm, and the established geometrical microscale model is shown in Figure 1(a) with the detailed RVE size values. The corresponding FEM model is shown in Figure 1(b). The FEM is established with commercial software ABAQUS, and the following diffusion analysis will also be analyzed with the software. In Figure 1(b), the DC3D10 element is adopted to discretize the geometrical model, and the approximate mesh size is set to be 0.2 μm.

Microscale RVE. (a) Geometrical model and (b) FEM model.
To establish the microscale model considering voids, different methods have been developed [10]. The first void modeling method is based on finite-element models. To establish the FEM model considering voids with this method, the matrix element label and element volume in Figure 1(b) need to be extracted first. Then, the matrix elements are randomly chosen until the volume fraction is reached. At last, the properties of the matrix elements are changed to those of the voids to model the voids. One established model with element voids is shown in Figure 2. The highlighted elements within the matrix regions are the selected void elements.
Microscale RVE with element voids.
To consider the void shape at the microscale, the void modeling process developed in the study of Wang [10] is adopted in this study. During the modeling process, the first step is to extract the element label, element volume, and Gauss point coordinates of matrix elements. Then, a matrix element is randomly chosen, and it is set as the center of a void. Thereafter, based on the geometrical parameter of the void, the matrix elements around the void center are chosen. The void volume fraction needs to be checked after any one matrix element is chosen. If it is satisfied, the choosing process needs to be stopped. At last, the chosen matrix elements are set to be the void regions by changing the diffusion properties. A model with circular voids is shown in Figure 3(a), and the void radius is set to be 0.4 μm.

Microscale RVE considering void shapes. (a) Spherical voids and (b) ellipsoidal voids.
Models with ellipsoidal voids are also established to evaluate the effects of void shapes and the ratio between the long axis and short axis. An example is shown in Figure 3(b) and the ratio is set to be 2. In the study of Mehdikhani et al. [9], it was found that the voids at the microscale are along the longitudinal direction due to the constraints of the fibers. Thus, in this study, the ellipsoidal voids are all assumed to be along the fiber direction. It should be noted that the volume of a single void is set to be the same for the two models shown in Figure 3.
2.2 Mesoscale RVE
The mesoscale RVE of plain woven composites is established with the commercial software Texgen, and the size of the mesoscale RVE is shown in Figure 4. The total thickness of the RVE (h), the maximum thickness of the tow (b), tow spacing (l), and the width of the gap (g) are 0.814, 0.37, 6.36, and 1.36 mm, respectively. The tetrahedron elements are used to discretize the geometrical model due to the complexity of the model. The established FEM is exported to the ABAQUS for the diffusion analysis. To realize the diffusion analysis, the element type C3D4 from Texgen should be changed to the element type DC3D4 in ABAQUS. A total of 213,362 elements are adopted to discretize the mesoscale RVE. It should be noted that the voids are the only internal structure characteristics considered in this study. Effects of many other influence factors on the diffusivities are not analyzed in this study, such as the layer shift [24], nesting [25], yarn cross-section variation [26], manufacturing conditions [27,28], and so on.

Geometrical size of the mesoscale RVE.
To consider the effects of the voids in the pure matrix region on the diffusivity, both the void modeling methods listed above for microscale RVE are adopted to model the matrix voids. The two methods have been used to evaluate the effects of the pure matrix voids on the damage behaviors of woven composites under external loadings [11]. The established mesoscale RVE with the element voids is shown in Figure 5(a). The RVE considering void shape is shown in Figure 5(b), and the void diameter is set to be 0.2 mm. The chosen void size is within the ranges obtained in the study of Zhao et al. [29].

Voids in the pure matrix region: (a) element void and (b) 0.2 mm voids.
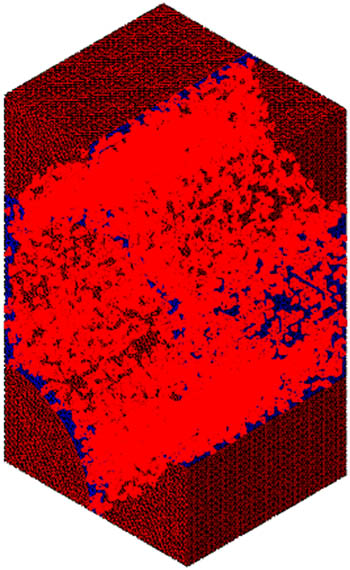
Besides the voids in the pure matrix region, the voids can also be located in the tows. In the studies conducted for mechanical analyses, different void modeling methods have been considered for the tows [16–19]. The first one is based on the uniform assumption, which means that the void volume fraction in each tow element is the same. Based on this assumption, for each void volume fraction, the tow elements’ parameters are all replaced with the diffusivity values predicted from the microscale RVE with the certain void volume fraction. Another method is based on the first void modeling method used at the microscale. With the element-based modeling method, some tows’ elements are randomly chosen. In the elements, it is assumed that there is no matrix bonding with fibers. Thus, the properties of the chosen elements are predicted with the microscale RVE, in which the matrix region is replaced with the voids. The mesoscale RVE with randomly chosen voids is shown in Figure 6. In both methods, one important assumption that the void volume fractions in the tow and pure matrix region are the same is adopted in this study [17,18].

Randomly chosen tow element considering voids.
3 Diffusivity prediction method
3.1 Numerical method
The numerical method for predicting the diffusivities of the woven composites is based on Fick’s first law. Isotropic diffusivity was used for matrix with equation (1). As the carbon fiber is adopted in this study, it is assumed that no water transport is occurring in the fiber. Orthotropic diffusivity was used for the tow
where J, D, and C are the rate of transfer per unit area, the diffusion coefficient, and the concentration of the substance, respectively.
To predict the diffusivities, certain boundary conditions should be applied. A prescribed concentration one is applied on the surface perpendicular to the water transfer direction. Meanwhile, on the opposite surface, the concentration is set to zero, providing a known concentration gradient. With the boundary conditions, steady water distribution patterns can be obtained. The certain boundary conditions for the diffusivity prediction can be found in Figure 7 along different directions at the microscale and mesoscale, respectively.

Illustration of the boundary conditions used for the diffusivity prediction: (a) transverse direction at the microscale, (b) longitudinal direction at the microscale, (c) in plain direction at the mesoscale, and (d) through thickness directional at the mesoscale.
During post-processing, the nodal reaction fluxes on a certain surface were summed up to give the total flow. Then, the diffusion coefficient was calculated using the following equation:
where q, A, t, and ∆C are the diffusion flow, the cross-sectional area, the thickness of the region, and the concentration difference. The diffusivity values of the constituents are shown in Table 1, which are also referred from the study of Pasupuleti et al. [5]. For the voids, the diffusivity is assumed to be ten times larger than that of the matrix, which was adopted in previous studies [21,22].
Diffusivities for the constituents
| Constituents | Fiber | Matrix | Void |
|---|---|---|---|
| Diffusivity (10−6 mm2/s) | 0 | 2.8 | 28 |
3.2 Analytical method
The analytical methods will be adopted in this study to demonstrate the numerical results. The analytical method from the study of Yuan and Zhou [6] is adopted in this study to predict the diffusivities of unidirectional composites. The equations for transverse and longitudinal diffusivities are shown in equations (3) and (4), respectively,
where D t is the transverse diffusivity, D l is the longitudinal diffusivity, V f is the fiber volume fraction, and D m is the diffusivity of the matrix.
In the study of Heide-Jørgensen et al. [7,8], an analytical method is developed to predict the through-thickness diffusivity of plain woven composites, and it is also adopted in this study to demonstrate the numerical results. In the method, the mesoscale RVE is divided into three regions, including the interface region, bridge region, and gap region (Figure 8). It should be noted that the geometrical parameters in Figure 7 are the same as those shown in Figure 4.

Illustration for the three regions.
In the gap region, there are no fibers, so the tow volume fraction is zero, and the diffusivity of the region is the same as that of the matrix (equation 5)
In the bridge region, the tow volume fraction is calculated with equation (6). After considering the orthotropic properties of the tows, the diffusivity of the region along through thickness direction is calculated with equation (7)
where
As the warp and weft tows interact at the interlace regions, the calculation of the tow volume fraction is more complicated (equation (8)). The equivalent diffusivity of that region is obtained with equation (9). With these equations, the through-thickness diffusivity of the plain woven composite can be obtained with equation (10)
where
4 Results and discussion
4.1 Model verification
The results from the microscale RVE without considering voids and from the analytical method are listed in Table 2 along the longitudinal and transverse directions, respectively. The similarity between them demonstrates the accuracy of the numerical prediction method at the microscale.
Predicted diffusivities values of the tows with different methods
| Diffusivity (mm2/s) | Numerical | Analytical |
|---|---|---|
| Transverse | 3.03 × 10⁻⁷ | 3.461 × 10⁻⁷ |
| Longitudinal | 5.8961 × 10⁻⁷ | 6.17 × 10⁻⁷ |
With the diffusivity values predicted from the microscale RVE, the diffusivity values of the woven composites are obtained with the mesoscale RVE and shown in Table 3. To demonstrate the accuracy of the predicted results, the analytical method developed in the study of Heide-Jørgensen et al. [7] is adopted. With the analytical method, the diffusivity value through the thickness is also shown in Table 3. It can be found that the result from the analytical method is a little smaller than the result from the numerical result. This conclusion is consistent with that obtained in the study of Heide-Jørgensen et al. [7], which results from the larger fiber volume fraction in the tows. Thus, the numerical method can be proved to be effective.
Predicted diffusivity values of the woven composites with different methods
| Diffusivity (mm2/s) | Numerical | Analytical |
|---|---|---|
| Through thickness | 7.1296 × 10⁻⁷ | 5.9823 × 10⁻⁷ |
| In-plane | 1.4391 × 10⁻⁶ | — |
4.2 Effects of void at the microscale
To reveal the effects of the void defects on the diffusivities of the plain woven composite, the effects of void defects at the microscale on the diffusivities of tows should be evaluated first. The two void modeling methods at the microscale will be compared here. As the random distribution of voids could contribute to the randomness of the predicted diffusivities of tows, the Monte-Carlo method is adopted. For each modeling case, one hundred models are established and analyzed.
The transverse diffusivities predicted with the microscale RVEs considering different void modeling methods and void sizes are shown in Figure 9. It can be found that no matter which kind of void modeling method, with the increase of the void volume fraction, the average diffusivity values all increase linearly. With the same void volume fraction, the values predicted with the element voids are much larger than those with void geometry characteristics considered. This is different from the conclusion obtained for the effects of the void shape on the equivalent elastic parameters of microscale RVE [17]. It should attribute to the fluid channel induced by the random distribution of void elements (Figure 10). Besides, from Figure 9, it can be found that the variation of results from the models considering void shape is much larger than that from the models with element voids. It should attribute to the consideration of the void geometrical characteristics and void random distribution patterns. With the increase of the void volume fraction and void size, the variation becomes larger.

Predicted transverse diffusivities of the tows.

Mass flow rate distribution patterns in the matrix and voids: (a) matrix and (b) void.
The transverse diffusivities from the models with different void sizes and void shapes are shown in Figure 11. Under the condition that the volume of a single void is the same, it can be found that the average transverse diffusivities of the models with spherical voids are larger than those from the models with ellipsoidal voids. Similar to the effects of the spherical voids, with the same void volume fraction, the increase of the ellipsoidal void size contributes to the decrease of the predicted average transverse diffusivity values and the increase of the diffusivity values’ variation.

Predicted transverse diffusivities considering different void shapes.
Under the condition that the volume of a single void is the same, models with different voids’ ratios between long axial (a) and short axial (b) are analyzed, and the results are shown in Figure 12. Compared with the spherical voids, with the increase of ratio, the void size along the transverse direction becomes shorten, which contributes to the decrease of average transverse diffusivities. Besides, it can be found that with the same void volume fraction, the variation of the results from models with different void shapes is similar to each other.

Predicted transverse diffusivities considering different ratios.
The longitudinal diffusivities predicted from the models with different void modeling methods are shown in Figure 13. The average longitudinal diffusivity values also increase linearly with the increase of the void volume fraction. The values from the models with the element voids are much larger than those from the models considering void shapes. For the models with spherical voids, the increase of the void size results in the decrease of the average longitudinal diffusivities and the increase of variation of the results. However, compared with the transverse diffusivities, the variation is much smaller.

Predicted longitudinal diffusivities of the tows.
The models with different void shapes are also analyzed, and the results are shown in Figure 14. It can be found that, under the condition that the volume of a single void is the same, the average longitudinal values from the models with ellipsoidal voids are larger than those from the models with spherical voids, which is different from the transverse diffusivities. From the results of the ellipsoidal void models with different ratios, it can be found that the longer the void size along the longitudinal direction, the larger the average longitudinal diffusivity. Thus, it can be concluded that the diffusivity values are dependent on the void size along the water diffusion direction. Besides, from Figure 14(b), it can be found that when the volume of a single void is the same, with the increase of the ratio, the variation is increased.

Predicted longitudinal diffusivities considering different void shapes. (a) Effects of void size and (b) effects of ratios between long axial and short axial.
4.3 Effects of voids in the tows
To reveal the effects of voids in the tows on the diffusivities of plain woven composites, different tows’ void modeling methods and analysis strategies are adopted and compared in this study. The element-based void modeling method is adopted to consider the voids in the pure matrix regions.
Based on the uniform assumption of first tows’ void modeling method, the average transverse and longitudinal diffusivities predicted from the microscale RVEs are used for the mesoscale analyses. It should be noted that as the larger void size results in more obvious variation, the average diffusivities from the microscale RVEs with larger void sizes are adopted to conduct the mesoscale analysis. The through-thickness diffusivities predicted from the mesoscale RVEs are shown in Table 4. It can be found that the existence of voids contributes to the increase of the through-thickness diffusivity. The increasing degree of the diffusivities predicted with element voids is much larger than that from the microscale RVEs considering void shapes, which is similar to the effects of voids at the microscale. With the same void volume fraction, the predicted through-thickness diffusivity values considering micro-spherical voids are also larger than those predicted based on the values considering ellipsoidal voids. This means that the changing trends of the through-thickness diffusivity follow the changing trends of the transverse diffusivity at the microscale. Thus, it can be concluded that the transverse diffusivity of tows is more important for the through-thickness diffusivity of plain woven composites.
Through-thickness diffusivities predicted with average microscale diffusivities
| Volume fraction | 1% (10−7 mm2/s) | 2% (10−7 mm2/s) | 3% (10−7 mm2/s) | ||||||
|---|---|---|---|---|---|---|---|---|---|
| Modeling method | Element void | Spherical voids | Ellipsoidal voids | Element void | Spherical voids | Ellipsoidal voids | Element void | Spherical voids | Ellipsoidal voids |
| Model-1 | 8.166 | 7.821 | 7.71 | 9.255 | 8.433 | 8.326 | 10.36 | 9.071 | 8.871 |
| Model-2 | 8.1898 | 7.844 | 7.733 | 9.251 | 8.428 | 8.321 | 10.357 | 9.0654 | 8.865 |
| Model-3 | 8.176 | 7.83 | 7.718 | 9.2541 | 8.4321 | 8.32475 | 10.394 | 9.1037 | 8.9036 |
| Average | 8.1773 | 7.832 | 7.721 | 9.2534 | 8.4311 | 8.3239 | 10.37 | 9.08 | 8.8799 |
In the analyses above, only the average values are considered. To reveal the effects of variation induced by the microscale void shapes and distribution patterns (Figures 11 and 14(a)) on the diffusivities of woven composites, a random field is created to consider the variation of the diffusivities. To generate the field, the predicted diffusivity data set from the Monte-Carlo analyses is divided into a certain number of groups, and the probability of each central diffusivity value can be obtained (Figure 15). In this study, five groups for each data set are adopted. Then, the cross probability of each transverse and longitudinal diffusivity pair can be obtained. Based on the probability of each diffusivity pair, the tows’ elements are randomly classified into 25 groups. Each group corresponds to a property pair. As a larger void size results in a larger variation of diffusivities, the predicted diffusivity values from the models with 0.8 μm spherical voids are adopted to show the effect of this developed analysis strategy.

Relative frequency of each diffusivity value.
An illustration of the established random field for the tows is shown in Figure 16, and the predicted diffusivities considering different void volume fractions are shown in Table 5. It can be found that the average result is a little larger than those predicted from the corresponding average diffusivities. The variation of the predicted diffusivities is also very small.

Random field for the diffusivity property.
Through-thickness diffusivities predicted with microscale diffusivity variation considered
| Void volume fraction | 1% (10−7 mm2/s) | 2% (10−7 mm2/s) | 3% (10−7 mm2/s) |
|---|---|---|---|
| Model-1 | 7.9198 | 8.6055 | 9.28176 |
| Model-2 | 7.9193 | 8.6057 | 9.28413 |
| Model-3 | 7.9177 | 8.6041 | 9.28589 |
| Average | 7.9189 | 8.6051 | 9.28393 |
The through-thickness diffusivities of the models with the second tows’ void modeling method are shown in Table 6. It should be noted that the transverse and longitudinal diffusivities predicted from the microscale RVE with all matrices replaced with voids are 3.03 × 10⁻⁷ and 5.8961 × 10⁻⁷ mm2/s, respectively. Compared with the results from Table 4, it can be found that this kind of void modeling method results in a larger diffusivity value with the same void volume fraction. With the same void volume fraction, the difference between the results in Table 6 is also very small. Thus, it can be concluded that based on this tow void modeling method, the variation induced by microscale voids can also be ignored.
Through-thickness diffusivity values predicted based on the element-based void modeling method
| Void volume fraction | 1% (10−7 mm2/s) | 2% (10−7 mm2/s) | 3% (10−7 mm2/s) |
|---|---|---|---|
| Model-1 | 8.839 | 10.48 | 12.011 |
| Model-2 | 8.870 | 10.46 | 12.008 |
| Model-3 | 8.821 | 10.412 | 12.023 |
| Average | 8.8435 | 10.452 | 12.014 |
With average diffusivities from microscale results, the in-plane diffusivities predicted from the mesoscale RVE are shown in Table 7. The effects of the voids on the average values obey the change trends of the effects of voids on the longitudinal diffusivities at the microscale. It means that the results predicted based on the element voids are the largest, the next are the results based on the microscale ellipsoidal voids, and the results from the spherical voids are the smallest.
In-plane diffusivity values of the mesoscale RVE based on average microscale results
| Volume fraction | 1% (10−6 mm2/s) | 2% (10−6 mm2/s) | 3% (10−6 mm2/s) | ||||||
|---|---|---|---|---|---|---|---|---|---|
| Modeling method | Element void | Spherical voids | Ellipsoidal voids | Element void | Spherical voids | Ellipsoidal voids | Element void | Spherical voids | Ellipsoidal voids |
| Model-1 | 1.55397 | 1.5316 | 1.53617 | 1.6742 | 1.6239 | 1.638 | 1.796 | 1.717 | 1.736 |
| Model-2 | 1.55312 | 1.53074 | 1.5353 | 1.6729 | 1.6226 | 1.6376 | 1.799 | 1.7199 | 1.7388 |
| Model-3 | 1.55316 | 1.53077 | 1.53534 | 1.674 | 1.6238 | 1.6389 | 1.798 | 1.718 | 1.737 |
| Average | 1.5534 | 1.531 | 1.5356 | 1.6737 | 1.6234 | 1.6382 | 1.7977 | 1.7183 | 1.73727 |
With the developed property field such as shown in Figure 16, the predicted in-plane diffusivities are shown in Table 8. Compared with the results predicted with the average values, the values are a little larger. The variation of the results shown both in Tables 7 and 8 can be ignored as the through-thickness diffusivities.
In-plane diffusivity values of the mesoscale RVE considering the variation of microscale results
| Void volume fraction | 1% (10−6 mm2/s) | 2% (10−6 mm2/s) | 3% (10−6 mm2/s) |
|---|---|---|---|
| Model-1 | 1.53471 | 1.6292 | 1.72388 |
| Model-2 | 1.53476 | 1.6293 | 1.72386 |
| Model-3 | 1.53473 | 1.6292 | 1.72399 |
| Average | 1.53473 | 1.62923 | 1.72391 |
With the second tow void modeling method, the predicted in-plane diffusivities are shown in Table 9. They are also larger than those predicted based on the uniform assumption with the same void volume fraction. However, the increasing degree is smaller compared with the through-thickness diffusivities. Comparing the results shown in Tables 7–9, it can be found that for each void modeling method, the predicted diffusivities with the same void volume fraction are close to each other, which means that there is also no obvious variation induced by the voids.
In-plane diffusivity values of the mesoscale RVE with the element-based void modeling method
| Void volume fraction | 1% (10−6 mm2/s) | 2% (10−6 mm2/s) | 3% (10−6 mm2/s) |
|---|---|---|---|
| Model-1 | 1.5858 | 1.736 | 1.884 |
| Model-2 | 1.585 | 1.7363 | 1.889 |
| Model-3 | 1.5846 | 1.738 | 1.886 |
| Average | 1.5851 | 1.7369 | 1.8861 |
4.4 Effects of void shapes in the pure matrix
To reveal the effects of the void shape in the pure matrix region on the diffusivities of woven composites, the models with spherical matrix voids are analyzed. The properties of the tows are set to be those predicted from the microscale RVE with element voids. To consider the randomness induced by the voids, 100 models are established and analyzed for each modeling condition. The predicted through-thickness results are shown in Table 10. For the through-thickness diffusivities, it can be found that with the increase of the void volume fraction, both the average diffusivity values and variation increase. With the same void volume fraction, it can be found that the increase of void size results in the increase of both the average and deviation values. This is different from the effects of spherical matrix voids on transverse and longitudinal diffusivities of tows. However, the effects of the void size on the average diffusivity values are very small compared with the effects at the microscale.
Through-thickness diffusivities predicted considering spherical matrix voids
| Void volume fraction (%) | Void size (mm) | Average (10−7 mm2/s) | Standard deviation (10−9 mm2/s) |
|---|---|---|---|
| 0 | 0 | 7.1296 | — |
| 1 | 0.2 | 8.1415 | 4.28309 |
| 0.3 | 8.15985 | 6.68669 | |
| 0.4 | 8.16438 | 12.1215 | |
| 2 | 0.2 | 9.11654 | 5.85496 |
| 0.3 | 9.12896 | 10.6471 | |
| 0.4 | 9.13814 | 16.5555 | |
| 3 | 0.2 | 10.1614 | 7.38689 |
| 0.3 | 10.1821 | 14.3967 | |
| 0.4 | 10.2164 | 21.5851 |
The predicted in-plane diffusivities of the models are shown in Table 11. It can be found that the in-plane diffusivity values also increase linearly with the increase of the void volume fraction. However, the change tendency of the diffusivities is different from that of the through-thickness diffusivities. The average diffusivity values decrease with the increase of the void size, although the differences between them are very small. The variation increases with the increase of the void size as the through-thickness values.
In-plane diffusivities predicted considering spherical matrix voids
| Void volume fraction (%) | Void size (mm) | Average (10−6 mm2/s) | Standard deviation (10−9 mm2/s) |
|---|---|---|---|
| 0 | 0 | 1.4391 | — |
| 1 | 0.2 | 1.52406 | 2.55317 |
| 0.3 | 1.52103 | 4.31883 | |
| 0.4 | 1.52079 | 5.6863 | |
| 2 | 0.2 | 1.61339 | 4.44269 |
| 0.3 | 1.60684 | 5.76583 | |
| 0.4 | 1.60569 | 7.96456 | |
| 3 | 0.2 | 1.70839 | 4.99426 |
| 0.3 | 1.69795 | 8.35103 | |
| 0.4 | 1.69541 | 10.0303 |
5 Conclusion
To reveal the effects of void defects on the diffusivities of plain woven composites, heterogeneous multiscale method is adopted to evaluate the effects of the microscale and mesoscale voids on diffusivities consequently. Besides, different void modeling methods are compared at different scales. Two void modeling methods for microscale are compared in this study. The first one is through randomly choosing matrix elements, and the second one is through choosing matrix elements considering void shapes. Based on the uniform assumption, two analysis strategies are compared to reveal the effects of voids in tows. The first one is using the average values predicted from the microscale RVEs as the properties of tows, and the second one is through establishing one random property distribution field based on the variation of tows’ diffusivities. Besides, the element-based void modeling method is also adopted to consider the voids in the tows. From the simulation results, the following conclusions can be obtained:
The values predicted based on the element voids are much larger than those from the models considering the void shape. This is different from the effects of void shapes on the elastic parameters. The simulation results also show that the diffusivity values at the microscale are highly dependent on the void shapes at the microscale. With the increase of the void size, the average values decrease, and the variation of results increases. Under the condition that the void volume fraction and a single void volume are the same, the diffusivities increase with the increase of voids’ size value along a certain direction.
The predicted mesoscale diffusivities show that with the first tow void analysis strategy, the effects of the voids in the tows on the through-thickness diffusivities and in-plane diffusivities follow the trends of the effects of microscale voids on the transverse and longitudinal diffusivities, respectively. With the second modeling strategy, the predicted through thickness and in-plane values are a little larger than those predicted with the corresponding average values.
With the element-based tow void modeling method, the predicted mesoscale diffusivities are larger than those predicted based on uniform assumption. The variation induced by all the tow void methods can be ignored. If the void shape is considered in the pure matrix regions, the variation of the mesoscale diffusivities becomes obvious. However, the effects are less compared with the effects at the microscale.
-
Funding information: The authors acknowledge the support received from the Natural Science Foundation of Jiangsu Province (BK20210487) and Fundamental Research Funds for the Central Universities (2021QN1024).
-
Conflict of interest: The authors declare that they have no known competing financial interests or personal relationships that could have appeared to influence the work reported in this article.
-
Data availability statement: The data presented in this study are available on request from the corresponding author.
References
[1] Subramaniyan SP, Imam MA, Prabhakar P. Fiber packing and morphology driven water diffusion mechanics in reinforced composites. Compos Part B: Eng. 2021;226:109259.10.1016/j.compositesb.2021.109259Search in Google Scholar
[2] Pan Y, Xian G, Li H. Numerical modeling of water diffusion in an unidirectional fiber‐reinforced polymer composite. Polym Compos. 2019;40(1):401–13.10.1002/pc.24664Search in Google Scholar
[3] Jain D, Vats S, Bera TK, Mukherjee A. A framework for three-dimensional finite element analysis of unidirectional and cross-ply composite layups through localized microstructures under hygromechanical conditions. J Braz Soc Mech Sci Eng. 2020;42:1–12.10.1007/s40430-020-02424-0Search in Google Scholar
[4] Tang X, Whitcomb JD, Li Y, Sue HJ. Micromechanics modeling of water diffusion in woven composites. Compos Sci Technol. 2005;65(6):817–26.10.1016/j.compscitech.2004.01.015Search in Google Scholar
[5] Pasupuleti R, Wang Y, Shabalin I, Li LY, Liu Z, Grove S. Modelling of water diffusion in multilayer woven fabric composites. Comput Mater Sci. 2011;50(5):1675–80.10.1016/j.commatsci.2010.12.028Search in Google Scholar
[6] Yuan Y, Zhou C. Meso-scale modeling to characterize water absorption of 3D woven composite. Appl Compos Mater. 2016;23:719–38.10.1007/s10443-016-9482-7Search in Google Scholar
[7] Heide-Jørgensen S, Ibsen CH, Budzik MK. Effective through-the-thickness diffusivity of plain-woven composite from analytical homogenization. Compos Sci Technol. 2021;202:108552.10.1016/j.compscitech.2020.108552Search in Google Scholar
[8] Heide-Jørgensen S, Ibsen CH, Budzik MK. Temperature dependence of moisture diffusion in woven epoxy-glass composites: A theoretical and experimental study. Mater Today Commun. 2021;29:102844.10.1016/j.mtcomm.2021.102844Search in Google Scholar
[9] Mehdikhani M, Gorbatikh L, Verpoest I, Lomov SV. Voids in fiber-reinforced polymer composites: A review on their formation, characteristics, and effects on mechanical performance. J Compos Mater. 2019;53(12):1579–669.10.1177/0021998318772152Search in Google Scholar
[10] Wang M. Computational evaluation of the effect of defects on the tensile properties of 2D woven composite considering thermal residual stress. Compos Struct. 2022;299:116042.10.1016/j.compstruct.2022.116042Search in Google Scholar
[11] Wang M, Zhang P, Fei Q, Guo F. Computational evaluation of the effects of void on the transverse tensile strengths of unidirectional composites considering thermal residual stress. Compos Struct. 2019;227:111287.10.1016/j.compstruct.2019.111287Search in Google Scholar
[12] Huang T, Gong Y. A multiscale analysis for predicting the elastic properties of 3D woven composites containing void defects. Compos Struct. 2018;185:401–10.10.1016/j.compstruct.2017.11.046Search in Google Scholar
[13] Zhang C, Li A, Gu Y, Mao C, Xu X. Investigation on off-axial tensile properties of 3D braided composites considering void defects. J Ind Text. 2022;51(3_suppl):5389S–408S.10.1177/15280837211068204Search in Google Scholar
[14] Xu J, Lu X, Zhu X. Effect of random void defects on the mechanical behavior of C/C braided composites. Adv Eng Mater. 2018;20(8):1701164.10.1002/adem.201701164Search in Google Scholar
[15] Nikopour H. A virtual frame work for predication of effect of voids on transverse elasticity of a unidirectionally reinforced composite. Comput Mater Sci. 2013;79:25–30.10.1016/j.commatsci.2013.05.049Search in Google Scholar
[16] Ge L, Li H, Gao Y, Lou R, Liu K, Zhong J, et al. Parametric analyses on multiscale elastic behavior of 3D braided composites with pore defects. Compos Struct. 2022;287:115332.10.1016/j.compstruct.2022.115332Search in Google Scholar
[17] Ge L, Li H, Liu B, Fang D. Multi-scale elastic property prediction of 3D five-directional braided composites considering pore defects. Compos Struct. 2020;244:112287.10.1016/j.compstruct.2020.112287Search in Google Scholar
[18] Xu K, Qian X. An FEM analysis with consideration of random void defects for predicting the mechanical properties of 3D braided composites. Adv Mater Sci Eng. 2014;2014:1–13.10.1155/2014/439819Search in Google Scholar
[19] Liu T, Wu X, Sun B, Fan W, Han W, Yi H. Investigations of defect effect on dynamic compressive failure of 3D circular braided composite tubes with numerical simulation method. Thin-Walled Struct. 2021;160:107381.10.1016/j.tws.2020.107381Search in Google Scholar
[20] Bourennane H, Gueribiz D, Fréour S, Jacquemin F. Modeling the effect of damage on diffusive behavior in a polymeric matrix composite material. J Reinf Plast Compos. 2019;38(15):717–33.10.1177/0731684419845479Search in Google Scholar
[21] Liu Z, Lei Y, Zhang X, Kang Z, Zhang J. Effect mechanism and simulation of voids on hygrothermal performances of composites. Polymers. 2022;14(5):901.10.3390/polym14050901Search in Google Scholar PubMed PubMed Central
[22] Wang M, Hang X. Effects of microstructure characteristics on the transverse water diffusivity of unidirectional composite. Sci Eng Compos Mater. 2023;30(1):20220201.10.1515/secm-2022-0201Search in Google Scholar
[23] Han X, Xu C, Xie W, Meng S. Multiscale computational homogenization of woven composites from microscale to mesoscale using data-driven self-consistent clustering analysis. Compos Struct. 2019;220:760–8.10.1016/j.compstruct.2019.03.053Search in Google Scholar
[24] Doitrand A, Fagiano C, Leroy FH, Mavel A, Hirsekorn M. On the influence of fabric layer shifts on the strain distributions in a multi-layer woven composite. Compos Struct. 2016;145:15–25.10.1016/j.compstruct.2016.02.054Search in Google Scholar
[25] Varandas LF, Catalanotti G, Melro AR, Falzon BG. On the importance of nesting considerations for accurate computational damage modelling in 2D woven composite materials. Comput Mater Sci. 2020;172:109323.10.1016/j.commatsci.2019.109323Search in Google Scholar
[26] Zhang X, Zhang S, Jia Y, Liu C, Gao X, Wang F, et al. A parameterized and automated modelling method for 3D orthogonal woven composite RVEs considering yarn geometry variations. Compos Struct. 2023;305:116496.10.1016/j.compstruct.2022.116496Search in Google Scholar
[27] Bazyar MM, Tabary SAAB, Rahmatabdi D, Mohammadi K, Hashemi R. A novel practical method for the production of Functionally Graded Materials by varying exposure time via photo-curing 3D printing. J Manuf Process. 2023;103:136–43.10.1016/j.jmapro.2023.08.018Search in Google Scholar
[28] Rahmatabadi D, Soltanmohammadi K, Pahlavani M, Aberoumand M, Soleyman E, Ghasemi I, et al. Shape memory performance assessment of FDM 3D printed PLA-TPU composites by Box-Behnken response surface methodology. Int J Adv Manuf Technol. 2023;127:1–16.10.1007/s00170-023-11571-2Search in Google Scholar
[29] Zhao C, Yang B, Wang S, Ma C, Wang S, Bi F. Three-dimensional numerical simulation of meso-scale-void formation during the mold-filling process of LCM. Appl Compos Mater. 2019;26:1121–37.10.1007/s10443-019-09770-wSearch in Google Scholar
© 2024 the author(s), published by De Gruyter
This work is licensed under the Creative Commons Attribution 4.0 International License.
Articles in the same Issue
- Regular Articles
- Research on damage evolution mechanisms under compressive and tensile tests of plain weave SiCf/SiC composites using in situ X-ray CT
- Structural optimization of trays in bolt support systems
- Continuum percolation of the realistic nonuniform ITZs in 3D polyphase concrete systems involving the aggregate shape and size differentiation
- Multiscale water diffusivity prediction of plain woven composites considering void defects
- The application of epoxy resin polymers by laser induction technologies
- Analysis of water absorption on the efficiency of bonded composite repair of aluminum alloy panels
- Experimental research on bonding mechanical performance of the interface between cementitious layers
- A study on the effect of microspheres on the freeze–thaw resistance of EPS concrete
- Influence of Ti2SnC content on arc erosion resistance in Ag–Ti2SnC composites
- Cement-based composites with ZIF-8@TiO2-coated activated carbon fiber for efficient removal of formaldehyde
- Microstructure and chloride transport of aeolian sand concrete under long-term natural immersion
- Simulation study on basic road performance and modification mechanism of red mud modified asphalt mixture
- Extraction and characterization of nano-silica particles to enhance mechanical properties of general-purpose unsaturated polyester resin
- Roles of corn starch and gellan gum in changing of unconfined compressive strength of Shanghai alluvial clay
- A review on innovative approaches to expansive soil stabilization: Focussing on EPS beads, sand, and jute
- Experimental investigation of the performances of thick CFRP, GFRP, and KFRP composite plates under ballistic impact
- Preparation and characterization of titanium gypsum artificial aggregate
- Characteristics of bulletproof plate made from silkworm cocoon waste: Hybrid silkworm cocoon waste-reinforced epoxy/UHMWPE composite
- Experimental research on influence of curing environment on mechanical properties of coal gangue cementation
- Multi-objective optimization of machining variables for wire-EDM of LM6/fly ash composite materials using grey relational analysis
- Synthesis and characterization of Ag@Ni co-axial nanocables and their fluorescent and catalytic properties
- Beneficial effect of 4% Ta addition on the corrosion mitigation of Ti–12% Zr alloy after different immersion times in 3.5% NaCl solutions
- Study on electrical conductive mechanism of mayenite derivative C12A7:C
- Fast prediction of concrete equivalent modulus based on the random aggregate model and image quadtree SBFEM
- Research on uniaxial compression performance and constitutive relationship of RBP-UHPC after high temperature
- Experimental analysis of frost resistance and failure models in engineered cementitious composites with the integration of Yellow River sand
- Influence of tin additions on the corrosion passivation of TiZrTa alloy in sodium chloride solutions
- Microstructure and finite element analysis of Mo2C-diamond/Cu composites by spark plasma sintering
- Low-velocity impact response optimization of the foam-cored sandwich panels with CFRP skins for electric aircraft fuselage skin application
- Research on the carbonation resistance and improvement technology of fully recycled aggregate concrete
- Study on the basic properties of iron tailings powder-desulfurization ash mine filling cementitious material
- Preparation and mechanical properties of the 2.5D carbon glass hybrid woven composite materials
- Improvement on interfacial properties of CuW and CuCr bimetallic materials with high-entropy alloy interlayers via infiltration method
- Investigation properties of ultra-high performance concrete incorporating pond ash
- Effects of binder paste-to-aggregate ratio and polypropylene fiber content on the performance of high-flowability steel fiber-reinforced concrete for slab/deck overlays
- Interfacial bonding characteristics of multi-walled carbon nanotube/ultralight foamed concrete
- Classification of damping properties of fabric-reinforced flat beam-like specimens by a degree of ondulation implying a mesomechanic kinematic
- Influence of mica paper surface modification on the water resistance of mica paper/organic silicone resin composites
- Impact of cooling methods on the corrosion behavior of AA6063 aluminum alloy in a chloride solution
- Wear mechanism analysis of internal chip removal drill for CFRP drilling
- Investigation on acoustic properties of metal hollow sphere A356 aluminum matrix composites
- Uniaxial compression stress–strain relationship of fully aeolian sand concrete at low temperatures
- Experimental study on the influence of aggregate morphology on concrete interfacial properties
- Intelligent sportswear design: Innovative applications based on conjugated nanomaterials
- Research on the equivalent stretching mechanical properties of Nomex honeycomb core considering the effect of resin coating
- Numerical analysis and experimental research on the vibration performance of concrete vibration table in PC components
- Assessment of mechanical and biological properties of Ti–31Nb–7.7Zr alloy for spinal surgery implant
- Theoretical research on load distribution of composite pre-tightened teeth connections embedded with soft layers
- Coupling design features of material surface treatment for ceramic products based on ResNet
- Optimizing superelastic shape-memory alloy fibers for enhancing the pullout performance in engineered cementitious composites
- Multi-scale finite element simulation of needle-punched quartz fiber reinforced composites
- Thermo-mechanical coupling behavior of needle-punched carbon/carbon composites
- Influence of composite material laying parameters on the load-carrying capacity of type IV hydrogen storage vessel
- Review Articles
- Effect of carbon nanotubes on mechanical properties of aluminum matrix composites: A review
- On in-house developed feedstock filament of polymer and polymeric composites and their recycling process – A comprehensive review
- Research progress on freeze–thaw constitutive model of concrete based on damage mechanics
- A bibliometric and content analysis of research trends in paver blocks: Mapping the scientific landscape
- Bibliometric analysis of stone column research trends: A Web of Science perspective