Influence of flowering plants in maize crop on the interaction network of Tetragonula laeviceps colonies
-
Windra Priawandiputra
 ,
Rosyid Amrulloh
,
Rosyid Amrulloh

Abstract
Land-use changes have increasingly threatened bee populations by reducing the availability of floral resources and nesting sites. Habitat loss and fragmentation have been identified as major drivers of bee decline, affecting their foraging behavior and pollination services. This study investigated the foraging behavior, and pollen preferences of Tetragonula laeviceps were assessed across four different locations, comparing treatment plots featuring nine species of flowering plants with control plots that lacked floral diversity and contained only maize (Zea mays). A total of 48 pollen species were identified, with 14 species common across all sites, indicating ecological overlap. In total, 50% of the identified pollen species were found both on bee bodies and in the hive, with 20.8% exclusive to bee bodies and 29.2% only in the hive. Bees in treatment plots exhibited more selective foraging, focusing on a limited range of plant species, while control plots showed more generalized foraging behavior. Dominant pollen sources included Carica papaya, Mikania micrantha, and Cyperus rotundus. Statistical analysis (GLM and ANOVA) revealed significantly fewer pollen species (p < 0.001) and lower pollen abundance (p < 0.001) in treatment plots compared to control plots. ANOSIM analysis showed significant differences in pollen composition between the control and treatment plots at most sites (p < 0.05). The bipartite interaction network revealed that control plots supported greater plant diversity (41 species vs 19) and more generalized foraging, while treatment plots had fewer plant species and exhibited more specialized foraging. These findings highlight the adaptability of T. laeviceps, with more selective foraging in low-diversity environments and generalized behavior in high-diversity areas.
1 Introduction
Pollinator insects have an important role in the ecosystem, especially in global food production. There are 82% of the plant species in the world that are pollinated exclusively by insects [1,2]. Pollinator insects contribute to seed production for 79% of the plant species [3]. Nearly three-quarters of global food crops rely on pollinators, such as bees, to boost and refine agricultural output [4]. Pollination by bees can improve the quality and quantity of crops, increasing global economic and food output [5]. Research by Gogoi et al. [6] found that pollination of mangoes by Apis cerana produced a more extensive fruit set than those not pollinated by bees. Research by Bosch et al. [7] also showed increased almond (Prunus dulcis) productivity and increased visits by the solitary bee Osmia cornuta. Pollination by three species of stingless bees in an okra plantation can increase the pod length, the number of seeds, and the number of pods [8]. The pollination activity of T. laeviceps improved the fruit size, weight, seed number per fruit, germination success, and sugar content in Cucumis melo L. [9]. Unfortunately, bee populations in various regions are reported to be declining [10,11].
Land-use change is one of the key drivers of pollinator decline [12]. Forest fragmentation can lead to a decline in the ability of specialist bees to pollinate forest plants [13]. Beekeepers in Indonesia report that a major concern they face is the loss of habitats and food sources for bees, driven by changes in land use [14]. Farmland and agricultural intensification are major causes of landscape transformation and fragmentation [15–17]. For instance, the change from forest and agroforestry into monoculture agriculture, like a corn field, has contributed to the decrease in bumblebee diversity [18]. The extensive corn fields in Indonesia, covering an area of 2.5 million hectares [19], also have a high potential to cause the loss of bee biodiversity. Currently, corn farmers in Indonesia are employing herbicides to address weed issues. Using herbicides in corn fields can reduce plant diversity, including flowers, an important food source for pollinator insects [20,21].
Protecting pollinators, particularly bees, is essential for ecosystem health and sustainable agriculture. Enhancing the presence of flowering plants in corn farming areas is an effective strategy for bee conservation. Research by Amrulloh et al. [22] found that adding five types of flowers to corn fields could become a food source for wild bees such as Amegilla sp., Apis dorsata, Augochlorella sp. Apis cerana, Andrena sp., Eumerus sp., and Xylocopa confusa. Planting a variety of flower types in agricultural landscapes in Canada can increase the diversity and abundance of wild bees [23]. The planting of wildflower strips or refuges can provide nesting sites and an abundance of pollen and nectar for honeybees in an agro-ecosystem [24]. A study by Pluta et al. [25] indicated that expanding the area of annual flower strips can enhance the colony growth of Apis mellifera.
Efforts to improve habitats aim to provide diverse and high-quality food sources, thereby supporting the year-round survival of pollinating insects [26]. The presence of flowering plants in agricultural landscapes can serve as a food source for various bees, including T. laeviceps. T. laeviceps require a variety of resources to rear their larvae, build nest structures, and maintain their colonies [27]. Unlike honey bees, stingless bees rely heavily on non-floral resources, such as resin and fruit sap, to support colony development [28,29]. Research on the effects of flowering strips on domesticated bees in agricultural landscapes, particularly maize fields in Indonesia, is still limited. Planting flowers in maize fields is essential for promoting bee conservation by providing them with a food source. Our study is an experimental research involving planting various flowering species. Our research aims to investigate the foraging behavior of T. laeviceps in a maize agricultural landscape that has been modified.
2 Materials and methods
2.1 Experimental design
This study prepared research and observed T. laeviceps from April to September 2022. The research preparation included selecting plots, planting flowering plants, and placing T. laeviceps colonies. Plot selection was done by selecting four maize fields in four villages in Bogor, Indonesia (Cibitung Wetan, Cihideung Ilir, Cihideung Udik, and Cibereum Petir). In each village, one maize field was selected and divided into control and treatment plots with a minimum distance of 150 m between plots (Figure 1). Overall, we have four treatment plots and four control plots. The treatment plot was divided into three subplots of 5 m × 5 m for planting flowering plants. The flowering plants on the treatment plot were at a planting distance of 20 cm × 30 cm. The treatment plots in this study were selected based on the accessibility for the maintenance of the planted flowers.
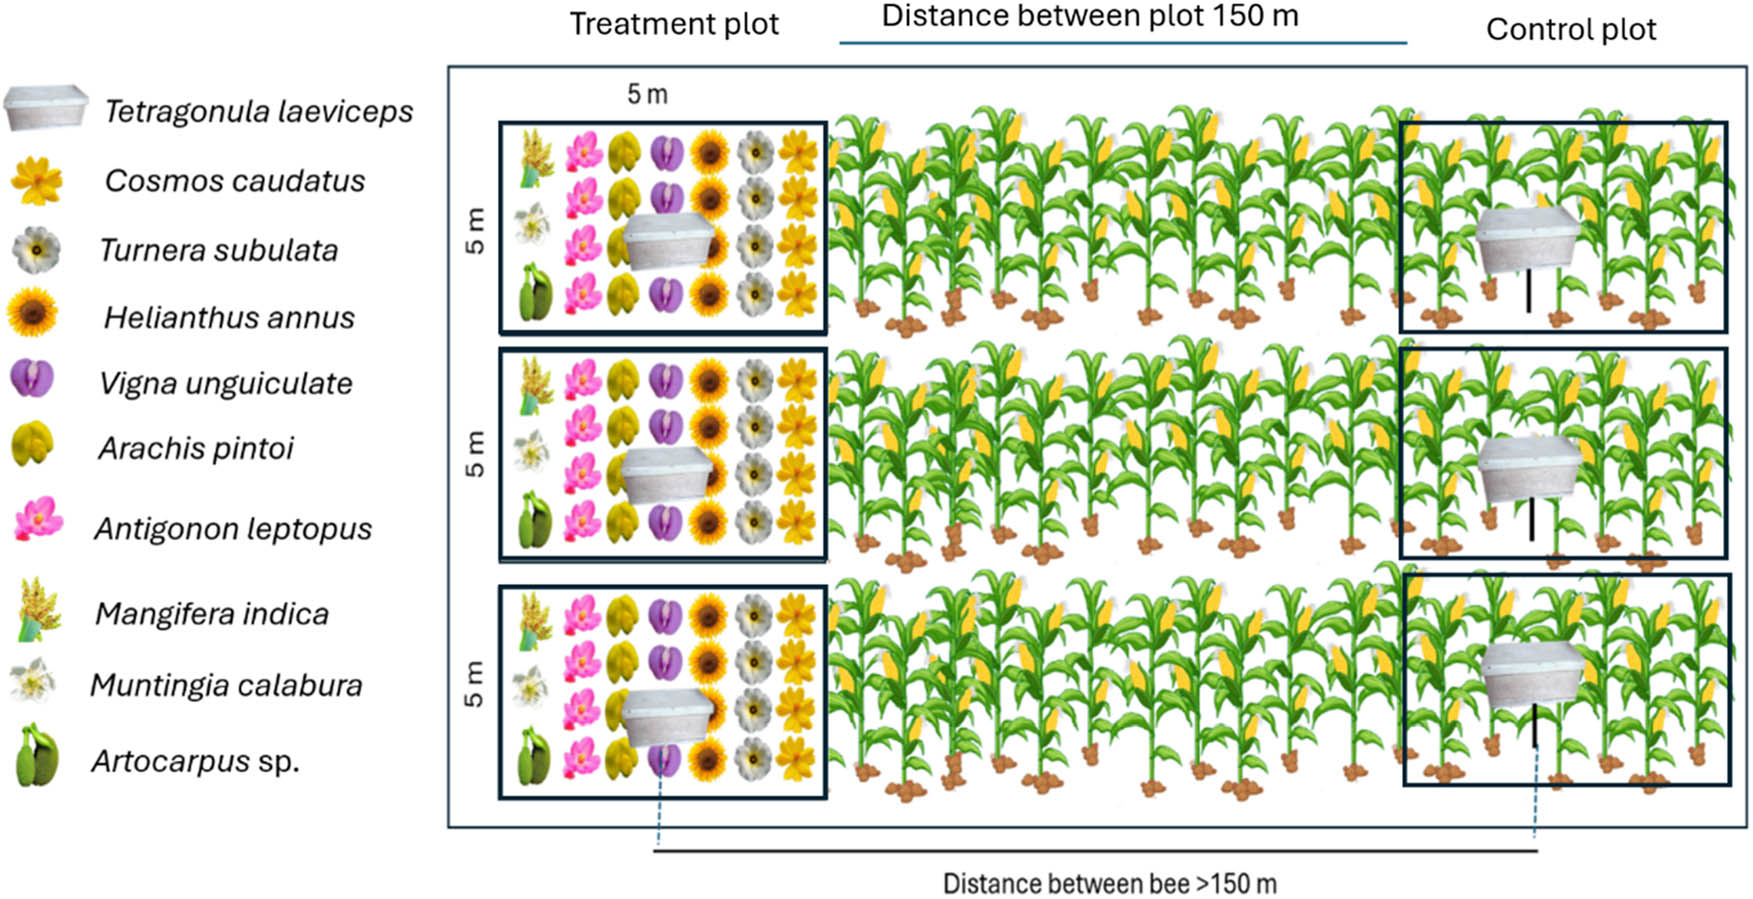
Experimental design on a corn field in four locations. Source: Created by the authors.
At the treatment plots, we planted seven flowering plants, such as Cosmos caudatus, Turnera subulata, Helianthus annuus, Vigna unguiculata, Arachis pintoi, Antigonon leptopus, and Muntingia calabura, to produce pollen and nectar for T. laeviceps. Flowering plants such as C. caudatus, T. subulata, A. leptopus, and H. annus can attract various insects like pollinators, predators, and parasitoids [30–33]. These plants are also commonly found in Indonesia and are widely used as ornamental plants in home gardens. We also planted two types of plants to produce resin, namely Mangifera indica and Artocarpus heterophyllus. All plants used in this study were obtained from flower plant stores. Based on information from the sellers, most of the plants were approximately 3 weeks old at the time of purchase, except for Mangifera and Artocarpus, which were around 1–2 months old. All flowering plants obtained from the stores were propagated through stem cuttings, but Vigna and Zea mays were directly grown from seeds in the field. The flowering period can be seen in Figure S5. Muntingia calabura, M. indica, and A. heterophyllus did not exhibit flowering during the observation period; however, T. laeviceps were still observed collecting resin from M. calabura and M. indica.
To determine the effect of flowering plants on bees, we placed three T. laeviceps colonies in both the control plot and the treatment plot. The T. laeviceps colonies were placed in the fields when the flowering plant started blooming.
2.2 Pollen sampling and identification
We collected pollen from two different sources. The first source is pollen from bee bodies. We collected three individual bees from each colony that returned to their hive with pollen and placed them in a tube containing 70% ethanol. The second source was pollen from the beehive. We used tweezers to take 0.01–0.03 g of pollen from the beehive and placed it in a tube containing 70% ethanol. The pollen collection was carried out three times; that is, before the corn flowered, when the corn flowered, and after the harvest. The pollen samples were brought to the Laboratory of Animal Biosystematics and Ecology, Department of Biology, IPB University.
Pollen samples from the field were prepared using the acetolysis method [34]. We utilized a compound microscope to identify pollen, adapting the method proposed by Djakaria et al. [8]. Pollen was identified based on the shape of the polar and equatorial axes and aperture, referring to Huang [35], the Australian Pollen and Spore Atlas (APSA) database (apsa.anu.edu.au), the Global Pollen Project (https://globalpollenproject.org/), and other related publications. Pollen load analysis was conducted to assess the quantity of pollen from the body and the beehive of T. laeviceps. The pollen identification and count data were organized and processed using Microsoft Excel.
2.3 Data analysis
We constructed the T. laeviceps–plant interaction using the R version 4.1.1 package bipartite [36]. Interaction between T. laeviceps colonies and plants from each plot was visualized using the plotweb function. We calculated network metrics to compare the interaction of T. laeviceps with plants. We evaluated the indices connectance, nestedness, specialization asymmetry, and interaction evenness [36,37]; see Table S1 for details about the indices. We also used species-level function to analyze the role and characteristics of each plant species in a bipartite network (Table S2). We also used a heatmap to visualize frequency and identify dominant pollen collected by T. laeviceps colonies.
To assess differences in the number of pollen grains among control and treatment plots, we applied a generalized linear model (GLM) with a Poisson distribution, which is suitable for count data [38]. In this model, the number of pollen grains per plot was used as the response variable, while plots, such as Control, CI-treatment, CP-treatment, CU-treatment, and CW-treatment, served as explanatory factors. In addition, differences in the presence or absence of pollen species among treatments were analyzed using a binomial GLM, considering the binary nature of the data (presence vs absence of pollen species within plots). The significance of treatment effects on both pollen abundance and pollen species presence was evaluated using analysis of deviance (ANOVA) based on Chi-square statistics, comparing the full model against the null model to determine the overall effect of treatment. A significant reduction in deviance indicated that treatment had a meaningful influence on the observed variables.
Pollen composition from each plot and location was analyzed based on similarity or dissimilarity using the method of Bray and Curtis [39]. We used non-metric multidimensional scaling (NMDS) to visualize the dissimilarity of pollen from different plots and locations using the R version 4.1.1 package vegan [40]. To identify whether there were significant differences in pollen composition at each location, we used analysis of similarities (ANOSIM) [41]. We also constructed a Venn diagram to identify pollen distribution in different locations [42].
3 Results
3.1 Pollen composition
Based on the pollen identification, we found 28 pollen species in Cibitung Wetan, 39 in Cihideung Ilir, 15 in Cihideung Udik, and 23 in Cibereum Petir (Figure S1). The observed differences in pollen types reflect the varying compositions of flowering plants at each study site. However, 14 species were found at all locations, indicating some level of ecological overlap. From multiple sources, a total of 48 pollen species were identified as being collected by bees (Figure S2). Of these, 24 species (50%) were detected both on bee bodies and within the beehive, suggesting that these pollen types represent key food resources actively transported into the hive. Ten species (20.8%) were found exclusively on bee bodies, possibly originating from recent or short-term floral visits and not yet deposited in the hive. In contrast, 14 species (29.2%) appeared only in the beehive, likely reflecting pollen acquired during earlier foraging activities or brought in by other members of the colony that were not sampled directly from their bodies.
There is a clear variation in pollen composition from T. laeviceps between the control and treatment plots (Figure 2). Several species, such as Mikania micrantha, Cyperus rotundus, and Melastoma malabathricum, appear to be dominant (indicated by darker colors), particularly from the beehive in both control (CP) and treatment plots (TP). Overall, the dominant pollen sources collected by T. laeviceps bees in this study included Carica papaya, Mikania micrantha, Cyperus rotundus, Imperata cylindrica, and Andrographis trilobata. As illustrated in Figure 2, corn pollen was detected in both treatment and control plots. The high abundance of Carica papaya pollen is likely due to the proximity of certain study sites, such as Cibereum Petir, to nearby papaya plantations. This suggests that T. laeviceps tend to forage on plant species close to their nests. Overall, the findings demonstrate that T. laeviceps bees utilize a diverse range of pollen sources, including cultivated crops, flowering plants, and surrounding weeds.

Heatmap of dominant pollen collected by T. laeviceps. Code description: CP: pollen from the nest in the control plot, TP: pollen from the nest in the treatment plot, CB: pollen from the bee body in the control plot, and TB: pollen from the bee body in the treatment plot. Darker hues correspond to larger amounts of pollen detected.
Analysis using GLM revealed significant differences in both the number of pollen species and the total number of pollen grains between the control plot and the various treatment plots (CI-treatment, CP-treatment, CU-treatment, and CW-treatment; see Tables 1 and 2). The binomial GLM model showed that the number of pollen species found across the treatment plots was significantly lower than in the control plot (p < 0.001). These findings suggest that T. laeviceps in the treatment plots exhibited more selective foraging behavior, with a tendency to visit only certain plant species. In contrast, in the control plot, T. laeviceps displayed more generalist foraging behavior, visiting a wider variety of plants without a strong dependence on any particular species.
Results of the GLM analysis of the pollen species presence across control and treatment plots
| Predictor | Estimate | SE | Z value | Pr(>|z|) |
|---|---|---|---|---|
| (Intercept) | 1.4663 | 0.3698 | 3.965 | 7.33 × 10⁻⁵*** |
| CI-treatment | −1.8028 | 0.4717 | −3.822 | 0.000132*** |
| CP-treatment | −1.8028 | 0.4717 | −3.822 | 0.000132*** |
| CU-treatment | −2.6794 | 0.5047 | −5.309 | 1.10 × 10⁻⁷*** |
| CW-treatment | −1.1299 | 0.4717 | −2.395 | 0.016598* |
Note: * indicate the significant codes in GLM analysis. ***p < 0.001; *p < 0.05.
Results of the GLM analysis of pollen grains across control and treatment plots
| Predictor | Estimate | SE | Z value | Pr(>|z|) |
|---|---|---|---|---|
| (Intercept) | 8.154309 | 0.002447 | 3331.9 | <2 × 10⁻¹⁶*** |
| CI-treatment | −4.84164 | 0.027653 | −175.1 | <2 × 10⁻¹⁶*** |
| CP-treatment | −2.32414 | 0.008197 | −283.5 | <2 × 10⁻¹⁶*** |
| CU-treatment | −1.25591 | 0.005198 | −241.6 | <2 × 10⁻¹⁶*** |
| CW-treatment | −0.86133 | 0.00449 | −191.8 | <2 × 10⁻¹⁶*** |
Note: * indicate the significant codes in GLM analysis. ***p < 0.001.
The results of the Poisson GLM analysis on the total number of pollen grains also revealed a similar pattern (Table 2), with the amount of pollen collected in the control plots being significantly higher compared to all treatment plots (p < 0.001). This difference reflects T. laeviceps’ foraging behavior toward specific food sources, which resulted in a decrease in the total amount of pollen carried. The ANOVA test for each model confirmed that the treatment factor significantly influenced both the number of pollen species (Chisq = 39.04; p < 0.001) and the total amount of pollen (Chisq = 284441; p < 0.001).
NMDS analysis revealed a significant difference in pollen composition between the control and treatment plots at several locations (Figure 3). At Cihideung Ilir, Cihideung Udik, and Petir, there was a clear separation between the control and treatment plots, supported by ANOSIM results with significant p-values (p < 0.05), indicating a difference in pollen composition between the two plots. In contrast, at Cibitung Wetan, no clear separation was observed, with a non-significant ANOSIM result (p = 0.484), suggesting that the treatment did not affect pollen composition at this site. Stress values for each plot (all < 0.2) indicate that the NMDS analysis provided a robust representation of sample dissimilarities at each location.

Comparison of pollen composition between control and treatment groups across four different locations based on NMDS analysis: (a) Cibitung Wetan, (b) Cihideung Ilir, (c) Cihideung Udik, and (d) Cibereum Petir.
3.2 T. laeviceps activity and its interaction with flowering plants
A bipartite interaction network between T. laeviceps and plant species across control plots (C1–C3) and treatment plots (T1–T3) revealed significant shifts in the bees’ foraging patterns (Figure 4). In the control plots, T. laeviceps displayed a generalist foraging strategy, visiting a diverse array of plant taxa. Conversely, in the treatment plots, the number of pollen species encountered was lower, and the interactions between bees and pollen species were more constrained. This indicates that foraging by T. laeviceps in the treatment plots was more selective, focusing on a limited subset of plant species.

Interactions of T. laeviceps with various flowering plants. Color legend: Blue: control, red: Treatment, green: Food crops, orange: Flowering plants, black: Wild plants. Letter codes: C1–C3 = T. laeviceps colonies in the control plot, T1–T3 = T. laeviceps colonies in the treatment plots.
Control hives were dominated by Carica papaya, with strong contributions from Zea mays and Ipomoea batatas, and weeds like Mikania micrantha and Melastoma malabathricum (Figure S3). Treatment plots, by contrast, found that Lantana camara, Ageratum conyzoides, and Cleome rutidosperma emerged as the main pollen sources. Body‐pollen analysis confirmed that control bees (CB1–CB3) primarily foraged on these control‐plot plants but also collected pollen from treatment‐plot species (e.g., A. leptopus, Arachis pintoi, Corallocarpus caudatus, Helianthus annus, and Turnera subulata), indicating flight ranges over 150 m (Figure S4). Meanwhile, treatment‐plot bees focused on a narrow set of resources, notably weeds such as Caesalpinia pulcherrima, L. camara, and A. conyzoides.
Species-level analysis of the pollen collected by T. laeviceps confirms that Carica papaya, Helianthus annus, and Lantana camara are highly connected, each having six interactions with relatively strong connections (species strength ranging from 1.07 to 1.75) (Table S2). These plants are likely to serve as primary pollen sources for T. laeviceps. In contrast, species such as Sphagneticola trilobata and Ipomea batatas exhibit low interaction strength and partner diversity, indicating that they are minor or specialized resources. Meanwhile, species like Imperata cylindrica and Andrographis paniculata also have multiple partners but moderate interaction strengths, suggesting that although they are less critical functionally at the interaction level, they remain important structurally for maintaining network connectivity.
The control plot exhibited greater plant species richness (41 vs 19) and higher specialization asymmetry (0.42 vs 0.25), while both plots showed similar nestedness (∼25) and interaction evenness (∼0.58; Table 3). The control plot also had lower connectivity (0.69 vs 0.74), suggesting that T. laeviceps exhibits more generalized foraging behavior in areas with higher floral diversity, whereas in treatment plots with fewer species, bees show more selective foraging strategies.
Network interaction matrix of T. laeviceps in different plots
| Variable | Plot | |
|---|---|---|
| Control | Treatment | |
| Plant species (n) | 41 | 31 |
| Connectance (0–1) | 0.69 | 0.74 |
| Nestedness (0–100) | 25.2 | 25.8 |
| Specialization asymmetry (−1−1) | 0.42 | 0.25 |
| Interaction evenness (0–1) | 0.59 | 0.57 |
The interactions at each location and plot are shown in Table S3. T. laeviceps shows differences in foraging behavior between treatment and control plots. Treatment plots typically had fewer plant species and higher connectivity, suggesting more frequent visits to a limited range of plants. The lower nestedness in treatment plots indicates more specialized foraging, while higher specialization asymmetry suggests a focus on specific plants. In contrast, control plots exhibited a more generalist behavior with broader plant visitation, reflected in higher interaction evenness. These results highlight T. laeviceps’ adaptability, with more selective foraging in treatment plots and more generalized foraging in control plots.
4 Discussion
T. laeviceps in this research was collected with more than 30 pollen species from around their hives. This finding proves that T. laeviceps is a generalist bee because it can visit a variety of plant species. A previous study found that T. laeviceps can visit 12 plant families in the campus area of the Bogor Agricultural University [43]. In India, T. laeviceps visits 34 plant species [44]. In the world, stingless bees can visit 1,476 genera of flowering plants, and the frequent interactions reported for many of the most species-rich plant families in the tropics [45]. The behavior of T. laeviceps in collecting pollen is influenced by its foraging ability [46] and the distance between the nest and the flowering plants [47]. Our research also confirms that the T. laeviceps can fly more than 150 m because we found the bees in the control plot collected pollen from the flowers in the treatment plot. Smith et al. [48] found that T. carbonaria in Australia can fly up to 333 m, with a maximum distance of 712 m. Several factors, such as the distance between flowering plants and the nest, influence the bee’s flying ability [27]; for example, C. papaya is most collected by T. laeviceps because it is close to the papaya plantation.
Aside from C. papaya, the most abundant pollen collected by T. laeviceps is from M. micrantha, M. malabathricum, and I. cylindrica. These plant species provide significant foraging resources for T. laeviceps, contributing to the bees’ diet and influencing their foraging behavior and floral preferences. One possible reason for the high collection rate of these pollen types is their relatively small grain size, which allows the bees to carry larger quantities back to the nest more efficiently [49]. Weeds often have morphological traits compatible with small-bodied bees like T. laeviceps. T. laeviceps commonly visits plant families with floral traits adapted to attract pollinators. These flowers typically have open corollas, numerous stamens, and anthers that open longitudinally, making it easier for bees to collect pollen and nectar [50]. In some cases, stingless bees can still access such resources by biting holes in the corolla. This form of “nectar robbery” has been observed in some species [51]. Antigonon leptopus, C. caudatus, H. annus, T. subulate, and Z. mays in this research are not primary food sources for T. laeviceps (Table S2). While these plants are not the main sources of food, they contribute significantly to the growth of T. laeviceps colonies by providing alternative resources that enhance dietary diversity when primary sources are scarce or unavailable.
The foraging preferences of T. laeviceps are shaped by multiple factors, including body size, which significantly impacts their flower choices by determining how far they can forage [52]. This might affect the spatial extent to which bee species can access and utilize flowering resources [53]. In addition, body size and colony size (i.e., the number of foragers) can impact flower preferences due to competition. For instance, smaller species or those with fewer foragers may opt for flowers less commonly visited by larger, more dominant bees or colonies [54,55], which tend to monopolize rich resources [56]. To avoid competition, T. laeviceps usually forages for pollen earlier in the day. T. laeviceps starts foraging at sunrise [57] and reaches its peak activity between 9 and 10 AM [58,59].
T. laeviceps needs pollen, nectar, and resin to build their colony. Morgado et al. [60] reported that the pollen is an essential food for larval development, and its storage in the colony stimulates queen oviposition and population growth. Protein deficiency during the larval stage can lead to malformed hypopharyngeal glands in worker bees, so pollen is essential for worker bees [61]. Previous studies have reported that food sources around the nest are very important to increase the productivity of T. laeviceps. Polyculture farming systems with various plants and flowers can increase the foraging activity of T. laeviceps. This will have an impact on the productivity of bees in producing honey and propolis [62].
Pollen composition in this study was influenced by landscape composition. Our research is in line with Inês da Silva et al. [63], who found that land use and landscape heterogeneity influenced Apis mellifera pollen composition and nutritional value. A more heterogeneous landscape implies increased habitat diversity, positively influencing the species richness of flowering plants [64]. Landscape composition can also influence the foraging behavior of bee species. According to Kortsch et al. [65], heterogeneous landscapes can increase the number of visits by pollinating insects.
T. laeviceps from treatment plots in this study showed greater specialization than the control plots, with fewer flower species, higher asymmetry of specialization, and a more focused distribution of interactions on a few flower species. In these plots, T. laeviceps tended to specialize in specific plant species, which likely facilitated flower constancy and allowed bees to return to the same plant species for repeated foraging. The study by Pardee et al. [66] found that heterogeneous landscapes can increase the specialization of the network, which may be because such landscapes can reduce competition between pollinators and plants [37]. The control plots in this study showed more generalist characteristics than the treatment plots, with more plant species, more even interactions, and lower specialization levels. The study by Redhead et al. [47] found that the diversity of generalist pollinators was significantly higher in agriculture-dominated landscapes. As a result, T. laeviceps does not depend on only a few specific flower types and instead seeks out a broader variety of floral resources. Connectivity in this study was higher in the treatment plots than in the control plots. The lower connectivity in the control plots indicates more dispersed interactions, which is consistent with higher species diversity [66].
5 Conclusion
The planting of flowers in treatment plots significantly influenced the foraging activity of T. laeviceps. In these plots, the bees exhibited a highly selective foraging strategy, focusing on specific plant species. This selective foraging behavior resulted in a lower total pollen load, as the bees concentrated their efforts on a limited set of floral resources. In contrast, T. laeviceps in control plots displayed a more generalized foraging strategy, visiting a broader range of plant species. These findings suggest that the foraging patterns of T. laeviceps are influenced by the availability and composition of floral resources. The more specialized foraging in treatment plots indicates a preference for certain plant species, while the generalized foraging in control plots reflects a wider interaction with the available plant community. The ability of T. laeviceps to adjust its foraging strategy is particularly intriguing in relation to the ecosystem. This study emphasizes the importance of floral diversity in shaping pollinator behavior and further contributes to understanding the role of T. laeviceps in plant–pollinator networks.
-
Funding information: This research was funded by Syngenta Indonesia with Grant No. 017/Syngenta/BS/PEI/XII/2021. This research also have funded by Dana Abadi Perguruan Tinggi–Lembaga Pengelola Dana Pendidikan (DAPT-LPDP) through the National Research Collaboration Funding Program (Riset Kolaborasi Nasional) with Grant No. 480/IT3.D10/PT.01.03/P/B/2023. We also express our gratitude to Fajrin Fahmi for assisting with the data analysis.
-
Author contributions: All authors have accepted responsibility for the entire content of this manuscript and consented to its submission to the journal, reviewed all the results and approved the final version of the manuscript. WP: writing – original draft, methodology, validation, and data curation; RA: writing – original draft, formal analysis, visualization, and investigation; DB: writing – review, data curation, methodology, supervision, and validation; DS: data curation and supervision; IN: data curation and supervision; MS: formal analysis and investigation; AS: resources and project administration; FS: investigation; HA: investigation; UN: investigation; AR: methodology, data curation, and validation.
-
Conflict of interest: Authors state no conflict of interest.
-
Data availability statement: The data supporting this study’s findings are available and can be accessed from https://github.com/rosyidamrulloh/pollen-analysis.git.
References
[1] Ollerton J, Winfree R, Tarrant S. How many flowering plants are pollinated by animals? Oikos. 2011;120(3):321–6.10.1111/j.1600-0706.2010.18644.xSearch in Google Scholar
[2] Aslan CE, Zavaleta ES, Tershy B, Croll D. Mutualism disruption threatens global plant biodiversity: A systematic review. PLoS One. 2013;8(6):e66993. 10.1371/journal.pone.0066993.Search in Google Scholar PubMed PubMed Central
[3] Rodger JG, Bennett JM, Razanajatovo M, Knight TM, van Kleunen M, Ashman TL, et al. Widespread vulnerability of flowering plant seed production to pollinator declines. Sci Adv. 2021;7(42):1–11.10.1126/sciadv.abd3524Search in Google Scholar PubMed PubMed Central
[4] Klein AM, Vaissière BE, Cane JH, Steffan-Dewenter I, Cunningham SA, Kremen C, et al. Importance of pollinators in changing landscapes for world crops. Proc R Soc B: Biol Sci. 2007;274(1608):303–13.10.1098/rspb.2006.3721Search in Google Scholar PubMed PubMed Central
[5] Khalifa SAM, Elshafiey EH, Shetaia AA, El-Wahed AAA, Algethami AF, Musharraf SG, et al. Overview of bee pollination and its economic value for crop production. Insects. 2021;12(8):1–23.10.3390/insects12080688Search in Google Scholar PubMed PubMed Central
[6] Gogoi J, Bathari M, Deuri A, Rahman A, Borah P. Pollinator diversity and effect of Apis cerana F. pollination on yield of mango (Mangifera indica L.). J Entomol Zool Stud. 2018;6(5):957–61.Search in Google Scholar
[7] Bosch J, Osorio-Canadas S, Sgolastra F, Vicens N. Use of a managed solitary bee to pollinate almonds: Population sustainability and increased fruit set. Insects. 2021;12(1):1–11.10.3390/insects12010056Search in Google Scholar PubMed PubMed Central
[8] Djakaria KM, Atmowidi T, Priawandiputra W. The foraging activity and pollination services of three stingless bee species to enhance fruit quality and quantity of Okra (Abelmoschus Esculentus L.). Acta Universitatis Agriculturae et Silviculturae Mendelianae Brunensis. 2022;70(3):215–26. 10.11118/actaun.2022.016.Search in Google Scholar
[9] Bahlis W, Armowidi T, Priawandiputra W. Pollination services of Tetragonula laeviceps Smith (Apidae: Meliponinae) on melon plants (Cucumis melo L.). Serangga. 2021;26(4):124–36.Search in Google Scholar
[10] Panziera D, Requier F, Chantawannakul P, Pirk CWW, Blacquière T. The diversity decline in wild and managed honey bee populations urges for an integrated conservation approach. Front Ecol Evol. 2022;10(March):1–7.10.3389/fevo.2022.767950Search in Google Scholar
[11] LeBuhn G, Vargas Luna J. Pollinator decline: What do we know about the drivers of solitary bee declines? Curr Opin Insect Sci. 2021;46:106–11. 10.1016/j.cois.2021.05.004.Search in Google Scholar PubMed
[12] Goulson D, Lye GC, Darvill B. Decline and conservation of bumble bees. Annu Rev Entomol. 2008;53:191–208.10.1146/annurev.ento.53.103106.093454Search in Google Scholar PubMed
[13] Gómez-Martínez C, Aase ALTO, Totland Ø, Rodríguez-Pérez J, Birkemoe T, Sverdrup-Thygeson A, et al. Forest fragmentation modifies the composition of bumblebee communities and modulates their trophic and competitive interactions for pollination. Sci Rep. 2020;10(1):1–15. 10.1038/s41598-020-67447-y.Search in Google Scholar PubMed PubMed Central
[14] Buchori D, Rizali A, Priawandiputra W, Raffiudin R, Sartiami D, Pujiastuti Y, et al. Beekeeping and managed bee diversity in Indonesia: Perspective and preference of beekeepers. Diversity (Basel). 2022;14(1):1–14.10.3390/d14010052Search in Google Scholar
[15] Toledo-Hernández M, Tscharntke T, Tjoa A, Anshary A, Cyio B, Wanger TC. Landscape and farm-level management for conservation of potential pollinators in Indonesian cocoa agroforests. Biol Conserv. 2021;257:109106. 10.1016/j.biocon.2021.109106.Search in Google Scholar
[16] Tscharntke T, Klein AM, Kruess A, Steffan-Dewenter I, Thies C. Landscape perspectives on agricultural intensification and biodiversity - Ecosystem service management. Ecol Lett. 2005;8(8):857–74.10.1111/j.1461-0248.2005.00782.xSearch in Google Scholar
[17] Gomes E, Banos A, Abrantes P, Rocha J, Kristensen SBP, Busck A. Agricultural land fragmentation analysis in a peri-urban context: From the past into the future. Ecol Indic. 2019;97(Aug 2018):380–8. 10.1016/j.ecolind.2018.10.025.Search in Google Scholar
[18] Hemberger J, Crossley MS, Gratton C. Historical decrease in agricultural landscape diversity is associated with shifts in bumble bee species occurrence. Ecol Lett. 2021;24(9):1800–13.10.1111/ele.13786Search in Google Scholar PubMed
[19] Statistic Organization Center. Harvest Area and Corn Production in Indonesia Period 2023. BpsGoId [Internet]. 2024;2024(75):1–15. https://www.bps.go.id/id/publication/2024/08/16/fa2d1e4d5414f76a9bc3c713/luas-panen-dan-produksi-jagung-di-indonesia-2023.html.Search in Google Scholar
[20] Jin H, Xu J, Peng Y, Xin J, Peng N, Li Y, et al. Impacts of landscape patterns on plant species diversity at a global scale. Sci Total Environ. 2023;896:165193. https://www.sciencedirect.com/science/article/pii/S0048969723038160.10.1016/j.scitotenv.2023.165193Search in Google Scholar PubMed
[21] José-María L, Armengot L, Blanco-Moreno JM, Bassa M, Sans FX. Effects of agricultural intensification on plant diversity in Mediterranean dryland cereal fields. J Appl Ecol. 2010;47(4):832–40.10.1111/j.1365-2664.2010.01822.xSearch in Google Scholar
[22] Amrulloh R, Buchori D, Priawandiputra W, Sartiami D. Impact of ecological engineering on Zea mays plantations to biodiversity of insect pollinators. IOP Conf Ser Earth Env Sci. 2023;1220:012030. 10.1088/1755-1315/1220/1/012030.Search in Google Scholar
[23] Olynyk M, Westwood AR, Koper N. Effects of natural habitat loss and edge effects on wild bees and pollination services in remnant prairies. Env Entomol. 2021;50(3):732–43.10.1093/ee/nvaa186Search in Google Scholar PubMed
[24] Decourtye A, Mader E, Desneux N. Landscape enhancement of floral resources for honey bees in agro-ecosystems. Apidologie. 2010;41(3):264–77.10.1051/apido/2010024Search in Google Scholar
[25] Pluta P, Czechofsky K, Hass A, Frank L, Westerhoff A, Klingenberg H, et al. Organic farming and annual flower strips reduce parasite prevalence in honeybees and boost colony growth in agricultural landscapes. J Appl Ecol. 2024;(June):2146–56.10.1111/1365-2664.14723Search in Google Scholar
[26] Holland JM, Smith BM, Storkey J, Lutman PJW, Aebischer NJ. Managing habitats on English farmland for insect pollinator conservation. Biol Conserv. 2015;182:215–22. 10.1016/j.biocon.2014.12.009.Search in Google Scholar
[27] Salatnaya H, Kahono S, Suhri AGMI, Ismanto A, Anggraeni I, Fara SB, et al. Diversity, distribution, nesting, and foraging behavior of stingless bees and recent meliponiculture in Indonesia. In: Aziz MA, editor. Rijeka: IntechOpen; 2023. Chapter. 4. 10.5772/intechopen.1003758.Search in Google Scholar
[28] Roubik DW, Holbrook NM, Parra GV. Roles of nectar robbers in reproduction of the tropical treelet Quassia amara (Simaroubaceae). Oecologia. 1985 May;66(2):161–7.10.1007/BF00379850Search in Google Scholar PubMed
[29] Lorenzon MC, Matrangolo CA. Foraging on some nonfloral resources by stingless bees (Hymenoptera, Meliponini) in a Caatinga region. Braz J Biol. 2005;65(2):291–8.10.1590/S1519-69842005000200013Search in Google Scholar PubMed
[30] Barros AP, de Carvalho Silva A, de Souza Abboud AC, Ricalde MP, Ataide JO. Effect of Cosmos, Crotalaria, Foeniculum, and Canavalia species, single-cropped or mixes, on the community of predatory arthropods. Sci Rep. 2022;12(1):16013. 10.1038/s41598-022-20188-6.Search in Google Scholar PubMed PubMed Central
[31] Schlindwein C, Medeiros CR Pollination in Turnera subulata (Turneraceae): Unilateral reproductive dependence of the narrowly oligolectic bee Protomeliturga turnerae Pollination in Turnera subulata (Turneraceae): Unilateral reproductive dependence of the narrowly oligolectic bee. 2020;(June).Search in Google Scholar
[32] Hidayat R, Irsyan CSA. The existence species of passionflower (Turnera subulata J.E SM. And Turnera ulmifolia L.) on palm oil plant (Elaeis guineensis J.) against to the diversity of entomofag and phytopage insects. 2018;4(1):1–4.10.24233/BIOV.4.1.2018.94Search in Google Scholar
[33] Solomon J, Aluri R Floral ecology, breeding system and pollination in Antigonon leptopus L. (Polygonaceae). 2017;(October).Search in Google Scholar
[34] Erdtman G. Pollen morphology and plant taxonomy. Geologiska Föreningen i Stockh Förhandlingar. 1952 Jan;74(4):526–7. 10.1080/11035895209453507.Search in Google Scholar
[35] Huang TC. Pollen flora of Taiwan. Taipei: National Taiwan University, Botany Department Press; 1972. https://books.google.co.id/books?id=CIXwAAAAMAAJ.Search in Google Scholar
[36] Dormann CF, Gruber B, Fründ J. Introducing the bipartite Package: Analysing ecological networks. R N. 2008;8(2):8–11. http://cran.r-project.org/doc/Rnews/.Search in Google Scholar
[37] Blüthgen N, Menzel F, Hovestadt T, Fiala B, Blüthgen N. Specialization, constraints, and conflicting interests in mutualistic networks. Curr Biol. 2007;17(4):341–6.10.1016/j.cub.2006.12.039Search in Google Scholar PubMed
[38] Hastie TJ, Pregibon D. Generalized linear models. Statistical Models in S. London: Chapman & Hall; 2017. p. 195–247.10.1201/9780203738535-6Search in Google Scholar
[39] Bray JR, Curtis JT. An ordination of the upland forest communities of Southern Wisconsin. Ecol Monogr. 1957 Oct;27(4):325–49. 10.2307/1942268.Search in Google Scholar
[40] Oksanen J Vegan: Ecological diversity. R Package Version 24-4 [Internet]. 2017;11. https://cran.r-project.org/package=vegan.Search in Google Scholar
[41] Clarke K, Green R. Statistical design and analysis for a ‘biological effects’ study. Mar Ecol Prog Ser. 1988;46:213–6.10.3354/meps046213Search in Google Scholar
[42] Oliveros JC Venny. An interactive tool for comparing lists with Venn’s diagrams. 2015. https://bioinfogp.cnb.csic.es/tools/venny/index.ht.Search in Google Scholar
[43] Cholis MN, Alpionita R, Prawasti TS, Atmowidi T. Pollen load and flower constancy of stingless bees Tetragonula laeviceps (Smith) and Heterotrigona itama (Cockerell) (Apidae: Meliponinae). 2020;8(Iccesi 2019):285–9.10.2991/absr.k.200513.047Search in Google Scholar
[44] Gadhiya VC, Pastagia JJ. Flowers visited by stingless bees, Tetragonula laeviceps Smith. Agres. 2015;3(April):323–30.Search in Google Scholar
[45] Bueno FGB, Kendall L, Alves DA, Tamara ML, Heard T, Latty T, et al. Stingless bee floral visitation in the global tropics and subtropics. Glob Ecol Conserv. 2023;43(March):e02454. 10.1016/j.gecco.2023.e02454.Search in Google Scholar
[46] Prasetyo A, Raffiudin R, Batubara I, Ariyanti NS. Perilaku Mencari Polen dan Identifikasi Polen Tetragonula laeviceps pada dua Kebun Tanaman Obat. J Ilmu Pertan Indonesia. 2022;27(3):341–50.10.18343/jipi.27.3.341Search in Google Scholar
[47] Redhead JW, Dreier S, Bourke AFG, Heard MS, Jordan WC, Sumner S, et al. Effects of habitat composition and landscape structure on worker foraging distances of five bumblebee species. Ecol Appl. 2015;26(3):150819033522003.10.1890/15-0546.1Search in Google Scholar
[48] Smith JP, Heard TA, Beekman M, Gloag R. Flight range of the Australian stingless bee Tetragonula carbonaria (Hymenoptera: Apidae). Aust Entomol. 2017;56(1):50–3.10.1111/aen.12206Search in Google Scholar
[49] Hao K, Tian ZX, Wang ZC, Huang SQ. Pollen grain size associated with pollinator feeding strategy. Proc R Soc B: Biol Sci. 2020;287:20201191. 10.1098/rspb.2020.1191.Search in Google Scholar PubMed PubMed Central
[50] Torres C, Galetto L. Are nectar sugar composition and corolla tube length related to the diversity of insects that visit asteraceae flowers? Plant Biol (Stuttg). 2002;4(3):360–6. http://www.thieme-connect.de/products/ejournals/abstract/10.1055/s-2002-32326.10.1055/s-2002-32326Search in Google Scholar
[51] Barrows EM. Nectar robbing and pollination of Lantana camara (Verbenaceae). Biotropica. 1976 Jul;8(2):132–5, http://www.jstor.org/stable/2989633.10.2307/2989633Search in Google Scholar
[52] Greenleaf SS, Williams NM, Winfree R, Kremen C. Bee foraging ranges and their relationship to body size. Oecologia. 2007;153(3):589–96. 10.1007/s00442-007-0752-9.Search in Google Scholar PubMed
[53] Borges RC, Padovani K, Imperatriz-Fonseca VL, Giannini TC. A dataset of multi-functional ecological traits of Brazilian bees. Sci Data. 2020;7(1):120. 10.1038/s41597-020-0461-3.Search in Google Scholar PubMed PubMed Central
[54] Hubbell SP, Johnson LK. Comparative foraging behavior of six stingless bee species exploiting a standardized resource. Ecology. 1978 Oct;59(6):1123–36. 10.2307/1938227.Search in Google Scholar
[55] Sommeijer MJ, De Rooy GA, Punt W, De Bruijn LL. A comparative study of foraging behavior and pollen resources of various stingless bees and honeybees. Apidologie. 1983;14(3):205–24.10.1051/apido:19830306Search in Google Scholar
[56] Nagamitsu T, Inoue T. Aggressive foraging of social bees as a mechanism of floral resource partitioning in an Asian tropical rainforest. Oecologia. 1997;110(3):432–9.10.1007/s004420050178Search in Google Scholar PubMed
[57] Roubik DW. Review article stingless bee nesting biology. Apidologie. 2006;37:124–43.10.1051/apido:2006026Search in Google Scholar
[58] Atmowidi T, Prawasti TS, Raffiudin R. Flight activities and pollen load of three species of stingless bees (Apidae: Melliponinae). IOP Conf Ser Earth Env Sci. 2018;197(1):10–7.10.1088/1755-1315/197/1/012025Search in Google Scholar
[59] Puteri G, Herwina H, Mairawita, Janra MN. Foraging activity of Tetragonula laeviceps workers for natural resources and nest materials at a polyculture cropland in Batusangkar, Tanah Datar Regency, West Sumatra. IOP Conf Ser Earth Env Sci. 2022;1059:012086. 10.1088/1755-1315/1059/1/012086.Search in Google Scholar
[60] Morgado LN, Andrade RC, Lorenzon MCA, Gonçalves-Esteves V. padrão polínico utilizado por Tetragonisca angustula latreille (Apidae: Meliponina). Acta Bot Brasilica. 2011;25(4):932–4.10.1590/S0102-33062011000400021Search in Google Scholar
[61] Pereira DS, da Silva Paiva C, de Andrade Mendes AR, Batista JS, Maracajá PB. Produção De Geleia Real Por Abelhas Africanizadas Em Mossoró, Rio Grande Do Norte, Brasil. Holos. 2015;6(Dec):77–89.10.15628/holos.2015.1478Search in Google Scholar
[62] Salatnaya H, Fuah AM, Widodo WD. Winarno. Tetragonula laeviceps activity ( Hymenoptera: Apidae: Meliponini) at nutmeg plantation (Myristica fragrans Hout) with monoculture and polyculture system at West Java. Koli J. 2020;1(1):14–20.10.30598/koli.1.1.14-20Search in Google Scholar
[63] Inês da Silva C, Victorino Nicolosi Arena M, Cristina Mathias da Silva E, Roberto Martines M, Malaspina O, Chiovatto G, et al. Landscape and land use affect composition and nutritional values of bees’ food. J Env Manage. 2024;352:120031, https://www.sciencedirect.com/science/article/pii/S0301479724000173.10.1016/j.jenvman.2024.120031Search in Google Scholar PubMed
[64] Kivinen S, Luoto M, Kuussaari M, Helenius J. Multi-species richness of boreal agricultural landscapes: Effects of climate, biotope, soil and geographical location. J Biogeogr. 2006 May;33(5):862–75. 10.1111/j.1365-2699.2006.01433.x.Search in Google Scholar
[65] Kortsch S, Saravia L, Cirtwill AR, Timberlake T, Memmott J, Kendall L, et al. Landscape composition and pollinator traits interact to influence pollination success in an individual-based model. Funct Ecol. 2023 Jul;37(7):2056–71. 10.1111/1365-2435.14353.Search in Google Scholar
[66] Pardee GL, Ballare KM, Neff JL, Do LQ, Ojeda DJ, Bienenstock EJ, et al. Local and landscape factors influence plant-pollinator networks and bee foraging behavior across an urban corridor. Land (Basel). 2023;12:362. 10.3390/land12020362.Search in Google Scholar
© 2025 the author(s), published by De Gruyter
This work is licensed under the Creative Commons Attribution 4.0 International License.
Articles in the same Issue
- Research Articles
- Optimization of sustainable corn–cattle integration in Gorontalo Province using goal programming
- Competitiveness of Indonesia’s nutmeg in global market
- Toward sustainable bioproducts from lignocellulosic biomass: Influence of chemical pretreatments on liquefied walnut shells
- Efficacy of Betaproteobacteria-based insecticides for managing whitefly, Bemisia tabaci (Hemiptera: Aleyrodidae), on cucumber plants
- Assessment of nutrition status of pineapple plants during ratoon season using diagnosis and recommendation integrated system
- Nutritional value and consumer assessment of 12 avocado crosses between cvs. Hass × Pionero
- The lacked access to beef in the low-income region: An evidence from the eastern part of Indonesia
- Comparison of milk consumption habits across two European countries: Pilot study in Portugal and France
- Antioxidant responses of black glutinous rice to drought and salinity stresses at different growth stages
- Differential efficacy of salicylic acid-induced resistance against bacterial blight caused by Xanthomonas oryzae pv. oryzae in rice genotypes
- Yield and vegetation index of different maize varieties and nitrogen doses under normal irrigation
- Urbanization and forecast possibilities of land use changes by 2050: New evidence in Ho Chi Minh city, Vietnam
- Organizational-economic efficiency of raspberry farming – case study of Kosovo
- Application of nitrogen-fixing purple non-sulfur bacteria in improving nitrogen uptake, growth, and yield of rice grown on extremely saline soil under greenhouse conditions
- Digital motivation, knowledge, and skills: Pathways to adaptive millennial farmers
- Investigation of biological characteristics of fruit development and physiological disorders of Musang King durian (Durio zibethinus Murr.)
- Enhancing rice yield and farmer welfare: Overcoming barriers to IPB 3S rice adoption in Indonesia
- Simulation model to realize soybean self-sufficiency and food security in Indonesia: A system dynamic approach
- Gender, empowerment, and rural sustainable development: A case study of crab business integration
- Metagenomic and metabolomic analyses of bacterial communities in short mackerel (Rastrelliger brachysoma) under storage conditions and inoculation of the histamine-producing bacterium
- Fostering women’s engagement in good agricultural practices within oil palm smallholdings: Evaluating the role of partnerships
- Increasing nitrogen use efficiency by reducing ammonia and nitrate losses from tomato production in Kabul, Afghanistan
- Physiological activities and yield of yacon potato are affected by soil water availability
- Vulnerability context due to COVID-19 and El Nino: Case study of poultry farming in South Sulawesi, Indonesia
- Wheat freshness recognition leveraging Gramian angular field and attention-augmented resnet
- Suggestions for promoting SOC storage within the carbon farming framework: Analyzing the INFOSOLO database
- Optimization of hot foam applications for thermal weed control in perennial crops and open-field vegetables
- Toxicity evaluation of metsulfuron-methyl, nicosulfuron, and methoxyfenozide as pesticides in Indonesia
- Fermentation parameters and nutritional value of silages from fodder mallow (Malva verticillata L.), white sweet clover (Melilotus albus Medik.), and their mixtures
- Five models and ten predictors for energy costs on farms in the European Union
- Effect of silvopastoral systems with integrated forest species from the Peruvian tropics on the soil chemical properties
- Transforming food systems in Semarang City, Indonesia: A short food supply chain model
- Understanding farmers’ behavior toward risk management practices and financial access: Evidence from chili farms in West Java, Indonesia
- Optimization of mixed botanical insecticides from Azadirachta indica and Calophyllum soulattri against Spodoptera frugiperda using response surface methodology
- Mapping socio-economic vulnerability and conflict in oil palm cultivation: A case study from West Papua, Indonesia
- Exploring rice consumption patterns and carbohydrate source diversification among the Indonesian community in Hungary
- Determinants of rice consumer lexicographic preferences in South Sulawesi Province, Indonesia
- Effect on growth and meat quality of weaned piglets and finishing pigs when hops (Humulus lupulus) are added to their rations
- Healthy motivations for food consumption in 16 countries
- The agriculture specialization through the lens of PESTLE analysis
- Combined application of chitosan-boron and chitosan-silicon nano-fertilizers with soybean protein hydrolysate to enhance rice growth and yield
- Stability and adaptability analyses to identify suitable high-yielding maize hybrids using PBSTAT-GE
- Phosphate-solubilizing bacteria-mediated rock phosphate utilization with poultry manure enhances soil nutrient dynamics and maize growth in semi-arid soil
- Factors impacting on purchasing decision of organic food in developing countries: A systematic review
- Influence of flowering plants in maize crop on the interaction network of Tetragonula laeviceps colonies
- Bacillus subtilis 34 and water-retaining polymer reduce Meloidogyne javanica damage in tomato plants under water stress
- Vachellia tortilis leaf meal improves antioxidant activity and colour stability of broiler meat
- Evaluating the competitiveness of leading coffee-producing nations: A comparative advantage analysis across coffee product categories
- Application of Lactiplantibacillus plantarum LP5 in vacuum-packaged cooked ham as a bioprotective culture
- Evaluation of tomato hybrid lines adapted to lowland
- South African commercial livestock farmers’ adaptation and coping strategies for agricultural drought
- Spatial analysis of desertification-sensitive areas in arid conditions based on modified MEDALUS approach and geospatial techniques
- Meta-analysis of the effect garlic (Allium sativum) on productive performance, egg quality, and lipid profiles in laying quails
- Optimizing carrageenan–citric acid synergy in mango gummies using response surface methodology
- The strategic role of agricultural vocational training in sustainable local food systems
- Agricultural planning grounded in regional rainfall patterns in the Colombian Orinoquia: An essential step for advancing climate-adapted and sustainable agriculture
- Perspectives of master’s graduates on organic agriculture: A Portuguese case study
- Developing a behavioral model to predict eco-friendly packaging use among millennials
- Government support during COVID-19 for vulnerable households in Central Vietnam
- Citric acid–modified coconut shell biochar mitigates saline–alkaline stress in Solanum lycopersicum L. by modulating enzyme activity in the plant and soil
- Herbal extracts: For green control of citrus Huanglongbing
- Research on the impact of insurance policies on the welfare effects of pork producers and consumers: Evidence from China
- Investigating the susceptibility and resistance barley (Hordeum vulgare L.) cultivars against the Russian wheat aphid (Diuraphis noxia)
- Characterization of promising enterobacterial strains for silver nanoparticle synthesis and enhancement of product yields under optimal conditions
- Testing thawed rumen fluid to assess in vitro degradability and its link to phytochemical and fibre contents in selected herbs and spices
- Protein and iron enrichment on functional chicken sausage using plant-based natural resources
- Fruit and vegetable intake among Nigerian University students: patterns, preferences, and influencing factors
- Bioprospecting a plant growth-promoting and biocontrol bacterium isolated from wheat (Triticum turgidum subsp. durum) in the Yaqui Valley, Mexico: Paenibacillus sp. strain TSM33
- Quantifying urban expansion and agricultural land conversion using spatial indices: evidence from the Red River Delta, Vietnam
- LEADER approach and sustainability overview in European countries
- Influence of visible light wavelengths on bioactive compounds and GABA contents in barley sprouts
- Assessing Albania’s readiness for the European Union-aligned organic agriculture expansion: a mixed-methods SWOT analysis integrating policy, market, and farmer perspectives
- Genetically modified foods’ questionable contribution to food security: exploring South African consumers’ knowledge and familiarity
- The role of global actors in the sustainability of upstream–downstream integration in the silk agribusiness
- Multidimensional sustainability assessment of smallholder dairy cattle farming systems post-foot and mouth disease outbreak in East Java, Indonesia: a Rapdairy approach
- Enhancing azoxystrobin efficacy against Pythium aphanidermatum rot using agricultural adjuvants
- Review Articles
- Reference dietary patterns in Portugal: Mediterranean diet vs Atlantic diet
- Evaluating the nutritional, therapeutic, and economic potential of Tetragonia decumbens Mill.: A promising wild leafy vegetable for bio-saline agriculture in South Africa
- A review on apple cultivation in Morocco: Current situation and future prospects
- Quercus acorns as a component of human dietary patterns
- CRISPR/Cas-based detection systems – emerging tools for plant pathology
- Short Communications
- An analysis of consumer behavior regarding green product purchases in Semarang, Indonesia: The use of SEM-PLS and the AIDA model
- Effect of NaOH concentration on production of Na-CMC derived from pineapple waste collected from local society