Assessment of nutrition status of pineapple plants during ratoon season using diagnosis and recommendation integrated system
-
Nguyen Huynh Minh Anh


Abstract
The use of chemical fertilizer based on farmers' experience has led to fertilizer over-application in Hau Giang province, leading to increased production costs and severe environmental pollution. Therefore, it is important to assess crop nutrition status and make nutrient recommendations. Therein, the diagnosis and recommendation integrated system (DRIS) is a well-known approach to evaluating the nutrition status of crops. The current study aimed (i) to evaluate the sensitivity of established DRIS norms set for ratoon pineapple and (ii) to appraise the nutrition status of the plants in different regions of Hau Giang province, Vietnam. An omission plot experiment was conducted with a fully fertilized treatment and treatments omitting each nutrient of nitrogen (N), phosphorus (P), potassium (K), calcium (Ca), and magnesium (Mg) at leaves +1, +3, +7, +14, +15, +18, +20, +22, and +24. In the results, at leaf +1 and leaf +7, the DRIS indices of the groups omitting each of P, K, Ca, and Mg nutrients were lower than those of the NPKCaMg group, i.e., the leaves +1 and +7 had greater reliabilities. Based on leaf +1, the requirement order for nutrients of the ratoon pineapple was Cu > Ca > K > Zn > P > N > Fe > Mn. The newly established DRIS can be provided to the local agriculture managers to recommend the farmers to improve their profits and lower the use of chemical fertilizers for ratoon pineapple. Moreover, the results of this study will be a valuable reference for the establishment of DRIS in the world.
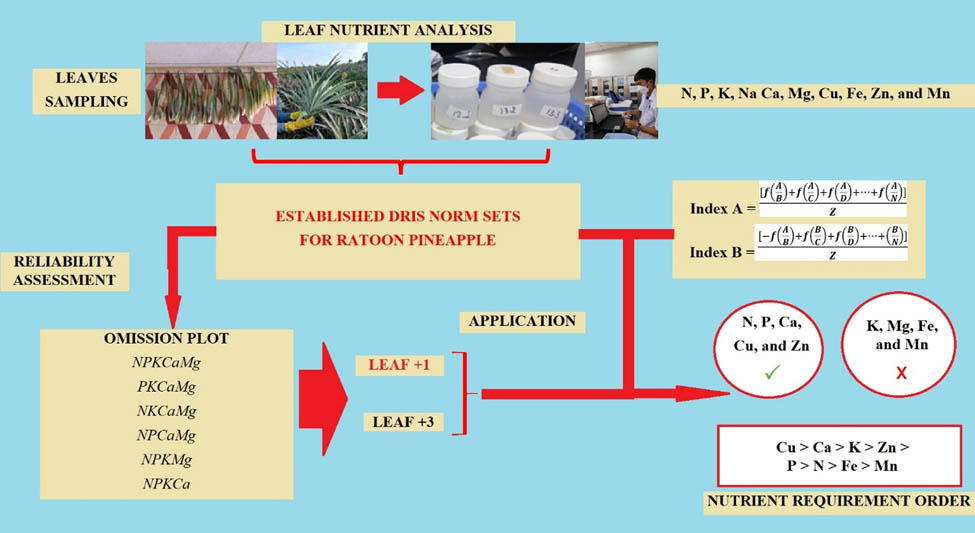
Graphical abstract.
Source: Created by Authors.
1 Introduction
Pineapple (Ananas comusus L.) is a tropical fruit with a production area and productivity ranking third in the world. Pineapple is considered a fruit that contains different types of minerals, nutrients, fibers, and bioactive substances that benefit human health [1]. Many developing countries, such as the Philippines, Mexico, Brazil, Indonesia, and Thailand, are known to cultivate pineapple the most [2], with a global production of 23.33 million metric tons, along with an increasing trend [3].
Locally, in Hau Giang Province, Vietnam, the area for pineapple farming was 2,000, with a production of 40,000 tons [4]. In this locality, pineapple cultivation is divided into two types of fruiting: ratoon and plant. The plant pineapple is grown from crowns and suckers on a new field, while the ratoon pineapple is grown from shoots of a central stalk, the “mother plant” that has been cut down [5,6].
To optimize pineapple yield, nutrients are supplied according to the crop’s demands [7]. Meanwhile, farmers usually add fertilizer according to their experience or the local recommendation. To be more specific, in Hau Giang Province, farmers applied an average of 719 kg ha⁻¹ of nitrogen, 408.25 kg ha⁻¹ of phosphorus, and 90.25 kg ha⁻¹ of potassium, exceeding local recommendations [8]. Therefore, there is a need for nutrient management and recommendations in this location. Modern nutrient assessment methods have the potential to transform farming practices. Therein, the diagnosis and recommendation integrated system (DRIS) is a promising method to assess crop nutrition status by foliar analysis because it can analyze the interactions between nutrients [9].
DRIS is based on the nutrient content in leaf tissues of a certain crop during a growth stage and is applied to diagnose the nutrition status of the crop and to categorize nutrition deficiency for optimal nutrient management [10]. According to Traspadini et al. [11], compared to the Compositional Nutrient Diagnosis, the DRIS has been applied to soybeans and it was more promising. Additionally, DRIS can also determine the optimal nutrient content for crops to grow and balance their nutrition [12]. Hence, based on the DRIS, the nutrition status of crops can be assessed, and an optimum fertilizer rate can be recommended to obtain a high yield [13]. Crops can be said to be deficient, excessive, or balanced nutrient status by a negative, positive, or zero DRIS index, respectively [14]. Normally, studies involving DRIS should go through a two-step protocol: DRIS norms establishment and DRIS norms evaluation. For example, in 2020, a DRIS norm set was established for bananas in Ecuador and evaluated for applicability 2 years later [15].
DRIS has been used to evaluate the nutrition status of crops such as grapes [16], coffee plants [13], lemons, mandarins [17], soybeans [18], oil palm [19], and mango [20]. In addition, Villaseñor et al. [21] assessed the N and K nutrition status of bananas in Ecuador by a DRIS norm set established during 2018–2020. For pineapples, Angeles et al. [22] have assessed the N, P, and K nutrient status. Subsequently, Sumner and Angeles [23] used DRIS to evaluate the nutrition balance of pineapples and their yield.
As mentioned above, many norm sets have been made for pineapple in the world, while in Vietnam, some norm sets have been made during the leaf formation stage and pre-flowering stage [24,25]. To be more specific, Xuan et al. [24] have built and evaluated a DRIS norm set for pineapple in the plant season during the pre-flowering stage at leaves +1 and +3. In addition, Khuong et al. [25] have found a DRIS norm set for pineapples at leaf +3, which is suitable for pineapple nutrition diagnosis. For the plant pineapple, a DRIS norm set has been evaluated with a nutrient demand of K > Zn > N > Mg > Ca > Fe > Mn > P [26]. However, plant pineapple is suitable for the first season of cultivation. To save production costs, suckers are usually reused in the following seasons. Thus, ratoon pineapple is utilized.
In addition, Khuong et al. [27] also built 9 DRIS norm sets for ratoon pineapple based on nine different leaf positions to evaluate the nutrition status of pineapples. Nevertheless, these nine leaf positions have not been applied or investigated for reliability under actual field conditions. Therefore, in the current study, the reliability of the norm set for ratoon pineapples was investigated and used to assess pineapple nutrition status. Thus, the current study was conducted (i) to evaluate the reliability of the established DRIS norm set for ratoon pineapple and (ii) to apply the norms to evaluate the nutrition status of pineapple farming regions in Hau Giang province, Vietnam.
2 Materials and methods
2.1 Materials
Time: The experiment was carried out from May 2021 to February 2022.
Location: The ratoon pineapple leaves for the norm set were appraised from the omission plot experiment in Hau Giang province, while pineapple leaves were collected and evaluated from different farm regions. A total of 540 leaf samples (3 leaves × 9 leaf positions × 20 farms) derived from 20 pineapple farms during the ratoon season were collected in Vinh Vien town (VV), Vinh Vien A commune (VVA), Tan Tien commune (TT), Hoa Tien commune (HT) of Vi Thanh City, and Hau Giang province, Vietnam (Table S1).
Cultivar: The Queen pineapple variety was used throughout the experiment.
Fertilizer: Urea fertilizer (46% N; Phu My Company, Vietnam), superphosphate fertilizer (16% P2O5 and 20% CaO; Long Thanh Company, Vietnam), DAP (18% N and 46% P2O5, Phu My Company, Vietnam), potassium chloride (60% K2O; Tien Nong Company, Vietnam), lime (60% CaO; Tan Thanh Long Company, Vietnam), and magnesium (92% MgO; Star Grace Producer, China) were used.
2.2 Methods
2.2.1 Evaluation of the established DRIS norm set for ratoon pineapple
Omission plot design: The experiment included 6 treatments and 4 replications, each of which was a plot of 25 m2 based on the fertilizer formula following the recommendation of the site-specific nutrient management by Khuong et al. [28]: 434 N, 314 P2O5, 362 K2O, 1,108 CaO, and 568 MgO (kg ha−1). This means that this formula was recommended for the selected area of the experiment. Treatment (i) NPKCaMg was applied with a sufficient amount of nitrogen (N), phosphorus (P), potassium (K), calcium (Ca), and magnesium (Mg), the treatment [434 N, 314 P2O5, 362 K2O, 1,108 CaO, and 568 MgO (kg ha−1)]; (ii) PKCaMg was applied without N [314 P2O5, 362 K2O, 1,108 CaO, and 568 MgO (kg ha−1)]; treatment (iii) NKCaMg: was applied without P [434 N, 362 K2O, 1,108 CaO, and 568 MgO (kg ha−1)]; treatment (iv) NPCaMg was applied without K [434 N, 314 P2O5, 1,108 CaO, and 568 MgO (kg ha−1)]; (v) treatment NPKMg was applied without Ca [434 N, 314 P2O5, 362 K2O, and 568 MgO (kg ha−1)]; and treatment (vi) NPKCa was applied without Mg [434 N, 314 P2O5, 362 K2O, and 1,108 CaO (kg ha−1)]. The rates of chemical fertilizers are summarized in Table S2. In brief, the chemical fertilizers were applied five times for one cycle, with 20% for each at 1, 3, 5, 7, and 9 months after planting.
Sampling method: Leaves at positions +1, +3, +7, +14, +15, +18, +20, +22, and +24 that were identical among plants in the same treatment were selected during the leaf development stage. Leaves were wiped, and old and immature parts of leaves were removed before being oven-dried at 70°C in paper bags for 96 h. Completely dried samples were ground via a 0.5 mm sieve for nutrient analysis in leaves.
Nutrient analyzing method: Nutrients N, P, K, Na Ca, Mg, Cu, Fe, Zn, and Mn in leaves were quantified according to the method of Houba et al. [29].
Analysis of nutrition status was performed according to the standard DRIS:
The nutrient ratio pairs (NRPs) were calculated according to Beaufils [30].
The functions for the nutrient ratio pairs are calculated as follows:
if A/B < a/b:
if A/B > a/b:
if A/B = a/b:
where A/B are the NRPs that need diagnosis; a/b are the NRPs found in the DRIS norm set; and CV is the coefficient of variation.
The DRIS index for each nutrient (DRIS index A) is calculated as follows:
where Z is the number of NRPs, including A. A negative DRIS index indicates nutrient deficiency, while a positive DRIS indicates nutrient excess, and zero indicates balance [31].
The DRIS norm set, which was established at leaves +1, +3, +7, +14, +15, +18, +20, +22, and +24 according to the nutrient contents in leaves of ratoon pineapple collected in Vinh Vien town, Vinh Vien A commune, Tan Tien commune, and Hoa Tien commune of Hau Giang province [27], was used in the current study.
2.2.2 Assessment of the nutrition status of ratoon pineapples based on the sensitivity of the established DRIS norm set
Sampling method: Pineapple leaf samples were collected from 20 farms in 4 locations. In each farm, five pineapple plants that were healthy and were at the leaf development stage (roughly 8 months old) were chosen. In each plant, 30 leaves were collected, except for the 6 top leaves, from the peak to the ground. Leaves 1, +3, +7, +14, +15, +18, +20, +22, and +24 were analyzed. Ntotal, Ptotal, Ktotal, Catotal, Mgtotal, Natotal, Cutotal, Fetotal, Zntotal, and Mntotal were quantified as previously described. The DRIS indices of the samples were analyzed according to the established DRIS norm set.
2.3 Statistical analysis
Mean values among treatments were compared according to the Duncan test at 5 and 1% significance levels using the SPSS 13.0 software.
3 Results
3.1 Evaluation of the established DRIS for ratoon pineapple by nutrient omission plot
3.1.1 Macronutrient contents in the NPKCaMg treatment and omission treatments at different leaf positions
At leaf +1, the contents of N, P, K, Ca, and Mg between treatments varied significantly. The NPKCaMg treatment had greater contents of N, P, K, Ca, and Mg than those omitting each corresponding nutrient, with 0.091–1.94% compared with 0.067–1.59%. Likewise, at leaf +7, the values were 2.48, 0.178, 1.15, 0.112, and 0.248% compared to 1.56, 0.130, 0.813, 0.064, and 0.094%, respectively. Meanwhile, at leaf +3, the Ca contents between treatments were equivalent to approximately 0.058–0.075%. On the contrary, the contents of N, P, K, and Mg in the NPKCaMg treatment were greater than those in the treatments omitting each nutrient, with 2.22, 0.16, 0.973, and 0.154% compared to 1.42, 0.13, 0.715, and 0.075%, respectively (Table 1).
Nutrient contents in NPKCaMg treatment and omission treatments at leaves +1, +3, and +7 in ratoon pineapple in Hau Giang
| Leaf position | Treatment | Nutrient content (%) | ||||
|---|---|---|---|---|---|---|
| N | P | K | Ca | Mg | ||
| +1 | NPKCaMg | 1.94a | 0.168a | 1.075a | 0.091bc | 0.121a |
| PKCaMg | 1.59b | 0.157a | 1.122a | 0.098b | 0.106b | |
| NKCaMg | 1.96a | 0.106c | 1.100a | 0.115a | 0.092bc | |
| NPCaMg | 1.92a | 0.124b | 0.861b | 0.097b | 0.086b | |
| NPKMg | 1.51b | 0.136b | 0.740b | 0.067d | 0.087d | |
| NPKCa | 1.68b | 0.130b | 1.232a | 0.080cd | 0.080cd | |
| Sign | * | * | * | * | * | |
| +3 | NPKCaMg | 2.22a | 0.16a | 0.973ab | 0.075 | 0.154a |
| PKCaMg | 1.42c | 0.15a | 0.870bc | 0.059 | 0.121b | |
| NKCaMg | 2.13a | 0.13b | 1.19a | 0.063 | 0.076cd | |
| NPCaMg | 1.77b | 0.12b | 0.715c | 0.074 | 0.067d | |
| NPKMg | 2.16a | 0.12b | 1.19a | 0.058 | 0.103bc | |
| NPKCa | 1.84b | 0.12b | 1.05ab | 0.061 | 0.075cd | |
| Sign | * | * | * | ns | * | |
| +7 | NPKCaMg | 2.48a | 0.178a | 1.15a | 0.112a | 0.248a |
| PKCaMg | 1.56e | 0.167ab | 1.21a | 0.076bc | 0.145b | |
| NKCaMg | 2.01bc | 0.130c | 1.17a | 0.067c | 0.134b | |
| NPCaMg | 2.10b | 0.146bc | 0.813b | 0.086b | 0.130b | |
| NPKMg | 1.85cd | 0.137c | 0.713b | 0.064c | 0.131b | |
| NPKCa | 1.73de | 0.138c | 1.24a | 0.073c | 0.094b | |
| Sign | * | * | * | * | * | |
Note: In the same column, numbers followed by different letters are different at 5% significance (*); ns: no significance. Sign: significance level.
At leaf +14, the Ca content in the NPCaMg treatment was greater than those of the NPKCaMg and NPKMg treatments, with 0.122 compared with 0.066 and 0.049%, respectively. The treatments omitting each of the N, P, K, Ca, and Mg nutrients resulted in lower N, P, K, Ca, and Mg contents than those in the NPKCaMg treatment, with 1.28, 0.110, 0.509, 0.049, and 0.049 compared to 1.80, 0.209, 1.04, 0.066, and 0.099%. At leaf +15, the N, P, K, Ca, and Mg contents of the treatments omitting each nutrient were lower than those in the NPKCaMg treatment, with 1.32, 0.137, 0.326, 0.039, and 0.043% compared to 1.77, 0.191, 0.578, 0.076, and 0.181%, respectively. At leaf +18, the Ca and Mg contents in the NPKCaMg treatment were equivalent to those in the treatments omitting Ca or Mg, approximately 0.065–0.095 and 0.063–0.091%. In contrast, the treatments omitting N, P, and K resulted in lower corresponding nutrient contents than the NPKCaMg treatment, with 1.70, 0.149, and 0.182% compared to 2.02, 0.175, and 0.461% (Table 2).
Nutrient contents in NPKCaMg treatment and omission treatments at leaves +14, +15, and +18 in ratoon pineapple in Hau Giang
| Leaf position | Treatment | Nutrient content (%) | ||||
|---|---|---|---|---|---|---|
| N | P | K | Ca | Mg | ||
| +14 | NPKCaMg | 1.80ab | 0.209a | 1.04ab | 0.066bc | 0.099a |
| PKCaMg | 1.28c | 0.205a | 1.06a | 0.063cd | 0.075bc | |
| NKCaMg | 1.94a | 0.110b | 0.953ab | 0.080b | 0.055d | |
| NPCaMg | 1.76ab | 0.148b | 0.509d | 0.122a | 0.066ab | |
| NPKMg | 1.57b | 0.116b | 0.807c | 0.049d | 0.087a | |
| NPKCa | 1.61b | 0.123b | 0.909bc | 0.059cd | 0.049d | |
| Sign | * | * | * | * | * | |
| +15 | NPKCaMg | 1.77a | 0.191a | 0.578bc | 0.076a | 0.181a |
| PKCaMg | 1.32c | 0.138b | 0.586bc | 0.072a | 0.093b | |
| NKCaMg | 1.79a | 0.137b | 0.639ab | 0.060a | 0.060c | |
| NPCaMg | 1.68ab | 0.185a | 0.326d | 0.073a | 0.058c | |
| NPKMg | 1.55b | 0.154b | 0.449cd | 0.039b | 0.058c | |
| NPKCa | 1.55b | 0.141b | 0.784a | 0.057a | 0.043c | |
| Sign | * | * | * | * | * | |
| +18 | NPKCaMg | 2.02a | 0.175b | 0.461b | 0.065b | 0.091abc |
| PKCaMg | 1.70b | 0.219a | 0.950a | 0.094a | 0.096ab | |
| NKCaMg | 2.00a | 0.149c | 0.414b | 0.041b | 0.107a | |
| NPCaMg | 1.75b | 0.140cd | 0.182c | 0.060b | 0.089abc | |
| NPKMg | 1.73b | 0.137cd | 0.461b | 0.095b | 0.071bc | |
| NPKCa | 1.57b | 0.118d | 0.880a | 0.050b | 0.063c | |
| Sign | * | * | * | * | * | |
Note: In the same column, numbers followed by different letters are different at 5% significance (*); ns: no significance. Sign: significance level.
At leaf +20, the N content between treatments differed insignificantly and fluctuated from 1.68 to 2.03%. In addition, the P and Mg contents in the NPKCaMg treatment were equivalent to those in the treatments, respectively, omitting P and Mg, with 0.149–0.175 compared to 0.059–0.076%. On the contrary, only the K content in the NPKCaMg treatment (0.504%) was greater than that in the NPCaMg treatment (0.182%), while the Ca content in the NPKCaMg treatment (0.061%) was lower than the treatment without Ca (0.080%). At leaf +22, the treatments omitting N, P, K, and Ca resulted in equivalent N, P, K, and Ca contents to those in the NPKCaMg treatment, which were 1.68–1.90, 0.180–0.207, 0.230–0.270, and 0.040–0.050%, respectively. The Mg content in the NPKCaMg treatment was greater than that in the NPKCa treatment, with 0.130% compared to 0.042%. At leaf +24, the N contents between treatments were not significant and were 1.54–2.17%. The Ca content in the NPKCaMg treatment (0.059%) was equivalent to that in the NPKMg treatment (0.075%). However, the P content in the NPKCaMg treatment was lower than that in the NKCaMg treatment, with 0.146% compared to 0.228%. On the contrary, the K and Mg contents in the NPKCaMg treatment (0.699 and 0.101%) were greater than those without K and Mg (0.368 and 0.063%) (Table 3).
Nutrient contents in NPKCaMg treatment and omission treatments at leaves +20, +22, and +24 in ratoon pineapple in Hau Giang
| Leaf position | Treatment | Nutrient content (%) | ||||
|---|---|---|---|---|---|---|
| N | P | K | Ca | Mg | ||
| +20 | NPKCaMg | 2.03 | 0.175a | 0.504b | 0.061b | 0.076a |
| PKCaMg | 1.68 | 0.180a | 0.950a | 0.094a | 0.085a | |
| NKCaMg | 2.03 | 0.149ab | 0.387b | 0.049b | 0.063a | |
| NPCaMg | 1.68 | 0.140b | 0.182c | 0.060b | 0.031b | |
| NPKMg | 1.72 | 0.137b | 0.461b | 0.080a | 0.064a | |
| NPKCa | 1.61 | 0.095c | 1.10a | 0.054b | 0.059ab | |
| Sign | ns | * | * | * | * | |
| +22 | NPKCaMg | 1.90b | 0.207a | 0.271d | 0.040c | 0.130b |
| PKCaMg | 1.68bc | 0.212a | 0.736b | 0.093b | 0.077c | |
| NKCaMg | 2.35a | 0.180a | 0.324d | 0.038c | 0.167a | |
| NPCaMg | 1.55c | 0.205a | 0.230d | 0.117a | 0.088c | |
| NPKMg | 1.67bc | 0.085b | 0.558c | 0.050c | 0.101bc | |
| NPKCa | 1.54c | 0.117b | 0.870a | 0.034c | 0.042d | |
| Sign | * | * | * | * | * | |
| +24 | NPKCaMg | 2.17 | 0.146bc | 0.699a | 0.059bc | 0.101a |
| PKCaMg | 1.54 | 0.151b | 0.820a | 0.070ab | 0.091a | |
| NKCaMg | 1.84 | 0.228a | 0.816a | 0.083a | 0.022d | |
| NPCaMg | 1.66 | 0.120cd | 0.368b | 0.052c | 0.044c | |
| NPKMg | 1.67 | 0.113d | 0.490b | 0.075ab | 0.084a | |
| NPKCa | 1.55 | 0.134bcd | 0.860a | 0.046c | 0.063b | |
| Sign | ns | * | * | * | * | |
Note: In the same column, numbers followed by different letters are different at 5% significance (*); ns: no significance. Sign: significance level.
3.1.2 Appraisal of the established DRIS norm set based on DRIS indices of macronutrients between the NPKCaMg and omission treatments at different leaf positions
From the nutrient ratio pairs calculated in Tables S3–S20, DRIS norms of different leaf positions were established as follows.
At leaf +1, the NPKCaMg treatment had greater DRIS indices of P, K, and Mg than the treatments omitting each of them, with values of (−34.1)–(7.22), (−24.8)–61.7, and (−33.4)–(−5.25). However, the DRIS indices of N and Ca in the NPKCaMg were equivalent to those in the treatments omitting N and Ca, with values of 14.0–26.3 and (−28.7)–(−27.4). At leaf +3, The NPKCaMg treatment had greater DRIS indices of Ca and Mg than those in the treatments omitting Ca and Mg, with −5.20 and 126.5 compared to −25.9 and 28.5. The DRIS indices of N and K between treatments were not significant and ranged from 353.3 to 1002.2 and (−148.2)–(−95.0). At leaf +3, the DRIS index of P was not available due to a lack of P NRPs. At leaf +7, the DRIS indices of K and Mg in the NPCaMg treatment (−84.7) and in the NPKCa treatment (−40.6), which was more negative than that in the NPKCaMg treatment (−40.5 and 8.72). The DRIS indices of N, P, and Ca between treatments varied insignificantly and were (−43.2)–(−0.275), (−134.2)–(−63.1), and 50.2–113.6, respectively (Table 4).
DRIS indices of the NPKCaMg and omission treatments at leaves +1, +3, and +7 in ratoon pineapple in Hau Giang
| Leaf position | Treatment | DRIS indices | ||||
|---|---|---|---|---|---|---|
| N | P | K | Ca | Mg | ||
| +1 | NPKCaMg | 26.3ab | −7.22a | 61.7a | −28.7c | −5.25a |
| PKCaMg | 14.0b | −7.86a | 33.4abc | −17.4bc | −13.7a | |
| NKCaMg | 27.5ab | −34.1b | 24.6bc | −2.43a | −29.7b | |
| NPCaMg | 38.0a | −24.9b | −24.8d | −20.5c | −43.7c | |
| NPKMg | 35.7a | 0.605a | 9.48c | −27.4c | −32.8bc | |
| NPKCa | 24.4ab | 1.83a | 53.2ab | −4.45ab | −33.4bc | |
| Sign | * | * | * | * | * | |
| +3 | NPKCaMg | 425.4 | — | −123.0 | −5.20ab | 126.5a |
| PKCaMg | 355.3 | — | −95.0 | −13.7abc | 54.6b | |
| NKCaMg | 1002.2 | — | −120.6 | −22.7bcd | 49.6b | |
| NPCaMg | 677.1 | — | −142.9 | 1.63a | 55.6b | |
| NPKMg | 815.6 | — | −148.2 | −25.9cd | 68.2b | |
| NPKCa | 429.7 | — | −127.5 | −33.0d | 28.5b | |
| Sign | ns | — | ns | * | * | |
| +7 | NPKCaMg | −0.275 | −63.1 | −40.5a | 110.0 | 8.72a |
| PKCaMg | −43.2 | −105.7 | −44.5a | 50.2 | −12.6bc | |
| NKCaMg | −8.08 | −113.8 | −38.4a | 42.6 | −10.7b | |
| NPCaMg | −19.5 | −129.0 | −84.7b | 113.6 | −24.9c | |
| NPKMg | −15.8 | −114.3 | −83.0b | 56.6 | −17.8bc | |
| NPKCa | −25.5 | −134.2 | −45.8a | 83.3 | −40.6d | |
| Sign | ns | ns | * | ns | * | |
Note: In the same column, numbers followed by different letters are different at 5% significance (*); ns: no significance. Sign: significance level.
At leaf +14, because Ca did not appear among NRPs of the DRIS norm set, the Ca DRIS index was not calculated. In addition, the DRIS indices of P, K, and Mg in the treatments omitting P (12.4), K (−33.6), and Mg (5.25) were lower than those in the NPKCaMg treatment (19.9, 77.0, and 14.5, respectively). However, between the treatments with and without N, their DRIS indices were equivalent. At leaf +15, the NPKCaMg treatment had greater DRIS indices of P, K, Ca, and Mg than the treatments omitting the corresponding nutrients, with 38.3 compared to 8.59, −81.0, compared to −182.3, 23.9, compared to −26.9, and 14.8 compared to −177.6. The DRIS indices of N among treatments were not significant. At leaf +18, the DRIS indices of N, K, and Mg in the NPKCaMg treatment were greater than those in the corresponding omission treatments, with 1.05 compared to −23.1, −104.0 compared to −655.7, and −13.7 compared to −89.7, respectively. On the other hand, the other two nutrients were equivalent between the NPKCaMg treatment and the corresponding omission treatments (Table 5).
DRIS indices of the NPKCaMg and omission treatments at leaves +14, +15, and +18 in ratoon pineapple in Hau Giang
| Leaf position | Treatment | DRIS indices | ||||
|---|---|---|---|---|---|---|
| N | P | K | Ca | Mg | ||
| +14 | NPKCaMg | −15.0ab | 19.9a | 77.0ab | — | 14.5ab |
| PKCaMg | −34.6bc | 18.8ab | 20.3bc | — | 3.60bc | |
| NKCaMg | −13.1a | 12.4c | 66.5ab | — | −2.95c | |
| NPCaMg | −43.6c | 15.5bc | −33.6c | — | 30.3a | |
| NPKMg | −29.3abc | 16.5ab | 32.0b | — | 23.0a | |
| NPKCa | −10.1a | 15.6bc | 109.7a | — | −5.25c | |
| Sign | * | * | * | — | * | |
| +15 | NPKCaMg | 4732.2 | 38.3a | −81.0ab | 23.9a | 14.8a |
| PKCaMg | 3816.0 | 0.705c | −61.0ab | 10.6ab | −52.1b | |
| NKCaMg | 5111.7 | 8.59b | −61.9ab | −4.07bc | −109.8c | |
| NPCaMg | 4438.4 | 4.14bc | −182.3c | 24.1a | −122.1c | |
| NPKMg | 4466.3 | 5.83bc | −102.2b | −26.9d | −111.6c | |
| NPKCa | 4389.3 | 9.35b | −43.9a | −12.9cd | −177.6d | |
| Sign | ns | * | * | * | * | |
| +18 | NPKCaMg | 1.05a | −3.23a | −104.0a | −22.3a | −13.7a |
| PKCaMg | −23.1b | −4.08a | −83.4a | −24.8a | −31.5ab | |
| NKCaMg | 9.63a | −4.00a | −117.7a | −51.9ab | 2.30a | |
| NPCaMg | −35.7b | −34.4bc | −655.7c | −76.5bc | −57.1bc | |
| NPKMg | −25.4b | −26.1b | −210.7b | −31.1a | −61.6bc | |
| NPKCa | −40.3b | −41.8c | −115.8a | −99.7c | −89.7c | |
| Sign | * | * | * | * | * | |
Note: In the same column, numbers followed by different letters are different at 5% significance (*); ns: no significance. Sign: significance level.
At leaf +20, only in the treatment without P, Mg had a DRIS index equivalent to that in the NPKCaMg treatment. The DRIS indices in the treatments omitting N, K, and Mg were −19.3, −314.1, and −47.7, respectively, while the corresponding values in the NPKCaMg treatment were 0.250, −66.2, and −27.7. At leaf +22, each DRIS index of N, P, and K in the corresponding treatments omitting N, P, and K was equivalent to those in the NPKCaMg treatment. However, only in the treatments omitting Ca and Mg the DRIS indices (−49.5 and −124.5, respectively) were lower than those in the NPKCaMg treatment (−79.1 and −21.2). At leaf +24, each DRIS index of N, K, Ca, and Mg in each of the corresponding omission treatments was equivalent to those in the NPKCaMg treatment. Although the DRIS indices were significantly different for the P nutrient, the treatment without P outperformed the treatment with P (Table 6).
DRIS indices of the NPKCaMg and omission treatments at leaves +20, +22, and +24 in ratoon pineapple in Hau Giang
| Leaf position | Treatment | DRIS indices | ||||
|---|---|---|---|---|---|---|
| N | P | K | Ca | Mg | ||
| +20 | NPKCaMg | 0.250b | −13.6a | −66.2b | −20.0a | −27.7a |
| PKCaMg | −19.3bc | −21.7a | −32.4a | −10.4a | −32.8a | |
| NKCaMg | 18.6a | −16.9a | −62.1b | −16.0a | −17.0a | |
| NPCaMg | −24.7c | −66.4c | −314.1c | −42.0b | −143.3b | |
| NPKMg | −11.0bc | −47.6b | −86.2b | −11.8a | −36.3a | |
| NPKCa | −16.7bc | −86.5d | −26.3a | −39.9b | −47.7b | |
| Sign | * | * | * | * | * | |
| +22 | NPKCaMg | −26.2ab | 125.6a | −358.1c | −79.1cd | −21.2ab |
| PKCaMg | −34.9bc | 119.1a | −91.2a | −21.3ab | −68.3c | |
| NKCaMg | −20.6a | 86.6a | −260.8bc | −90.1de | −5.05a | |
| NPCaMg | −39.2c | 112.8a | −334.7c | −3.20a | −46.4bc | |
| NPKMg | −26.3ab | −20.2b | −115.8ab | −49.5ab | −26.5ab | |
| NPKCa | −37.3bc | −76.0b | −50.2a | −120.0e | −124.5d | |
| Sign | * | * | * | * | * | |
| +24 | NPKCaMg | −7.75bc | −20.2bc | 69.4 | −33.3bc | 60.0ab |
| PKCaMg | −9.75bc | −6.33bc | 53.5 | −20.1ab | 26.4ab | |
| NKCaMg | 69.8a | 90.2a | 70.1 | −8.75a | −80.3c | |
| NPCaMg | 13.3b | −3.45b | 12.6 | −31.4bc | 7.30b | |
| NPKMg | −16.7c | −29.7c | 21.9 | −20.1ab | 69.0a | |
| NPKCa | −12.7bc | −14.8bc | 147.5 | −44.8c | 32.5ab | |
| Sign | * | * | ns | * | * | |
Note: In the same column, numbers followed by different letters are different at 5% significance (*); ns: no significance. Sign: significance level.
3.2 Assessment of the nutrition status of ratoon pineapple by DRIS
3.2.1 Nutrient contents in ratoon pineapple in farms of Vinh Vien, Vinh Vien A, Hoa Tien, and Tan Tien, Hau Giang Province
The N contents between the four locations differed in leaves +1, +3, +14, +20, and +22 at 5% significance. In particular, the N content of pineapple in TT was greater than the others. However, their N contents were equivalent at leaves +7, +15, +18, and +24. For the P content, only at leaves +14 and +24, the results were equivalent between the four locations. However, at leaves +1, +3, +7, +15, +18, +20, and +22, the P content showed significant differences and was 0.185–0.339%. The K contents varied at 5% significance between locations at all leaf positions, except for the leaf +22. Therein, the K contents were 0.800–1.379% at leaf +1, 0.773–1.322% at leaf +3, 0.624–1.488% at leaf +7, 0.370–0.781% at leaf +14, 0.416–0.794% at leaf +15, 0.426–0.698% at leaf +18, 0.325–0.858% at leaf +20, and 0.252–0.428% at leaf +24. The Ca contents at leaves +1, +3, +7, +14, +18, and +24 were different at 5% significance between locations and were 0.035–0.136%. Meanwhile, the Ca contents were equivalent at leaves +15, +20, and +22, with 0.046% on average. Mg content: At leaves +1, +3, +7, +14, +15, +18, +20, and +24, the Mg contents were different between locations and were 0.074–0.294%. Nevertheless, at leaf +22, the result was equivalent and was 0.157% on average. Meanwhile, the Na contents were not significant among locations, except for at leaf +24, where TT had greater Na content than the others, with 0.042 compared to 0.024–0.031% (Tables 7–9). For the micronutrient contents, the contents of Cu, Fe, Zn, and Mn were different at 5% between locations, except for Cu contents at leaves +7, +14, and +18, Fe content at leaf +7, and Zn contents at leaf +7 and +22. Therein, the contents of Cu, Fe, Zn, and Mn were approximately 0.445–2.060, 153.6–365.4, 12.6–44.8, and 46.1–345.1, respectively (Tables 7–9).
Nutrient contents in ratoon pineapple at leaves +1, +3, and +7 at four locations in Hau Giang
| Leaf position | Location | Nutrient content | |||||||||
|---|---|---|---|---|---|---|---|---|---|---|---|
| N | P | K | Ca | Mg | Na | Cu | Fe | Zn | Mn | ||
| +1 | VV | 1.531b | 0.254b | 0.800c | 0.073b | 0.255a | 0.025 | 1.440b | 237.3ab | 42.9b | 253.3b |
| VVA | 1.773b | 0.281ab | 1.113bc | 0.107a | 0.235a | 0.029 | 1.627ab | 274.5a | 36.3ab | 233.0b | |
| TT | 2.769a | 0.323a | 1.379a | 0.116a | 0.189b | 0.031 | 0.815c | 251.6a | 39.7b | 345.1a | |
| HT | 1.540b | 0.286ab | 1.018c | 0.120a | 0.261a | 0.023 | 2.060a | 197.7b | 29.8b | 228.9b | |
| Sign | * | * | * | * | * | ns | ** | * | * | * | |
| +3 | VV | 1.652bc | 0.284bc | 0.773b | 0.083ab | 0.214bc | 0.026 | 1.736a | 292.5b | 29.1b | 148.7b |
| VVA | 1.972ab | 0.243c | 1.229a | 0.090a | 0.272a | 0.033 | 1.316ab | 374.2a | 39.3a | 163.1b | |
| TT | 2.217a | 0.313ab | 1.332a | 0.082ab | 0.187c | 0.024 | 1.736a | 206.4c | 36.7a | 253.3a | |
| HT | 1.482c | 0.342a | 0.941b | 0.073b | 0.250ab | 0.022 | 0.855b | 153.6d | 24.6b | 186.2b | |
| Sign | * | * | * | * | * | ns | * | * | * | * | |
| +7 | VV | 1.680 | 0.241c | 0.624c | 0.064a | 0.169b | 0.033 | 1.240 | 341.5 | 29.8 | 151.7b |
| VVA | 1.622 | 0.271bc | 1.488a | 0.062ab | 0.294a | 0.033 | 1.319 | 243.9 | 29.8 | 116.3b | |
| TT | 2.027 | 0.335a | 1.211b | 0.073a | 0.205b | 0.027 | 1.536 | 253.8 | 29.8 | 222.1a | |
| HT | 1.590 | 0.324ab | 1.061b | 0.049b | 0.217b | 0.021 | 1.167 | 280.5 | 25.7 | 120.2b | |
| Sign | ns | * | * | * | * | ns | ns | ns | ns | * | |
Note: In the same column, numbers followed by different letters are different at 5% significance (*) and 1% significance (**); ns: no significance. Sign: significance level. VV: Vinh Vien; VVA: Vinh Vien A; TT: Tan Tien; and HT: Hoa Tien.
Nutrient contents in ratoon pineapple at leaves +14, +15, and +18 at four locations in Hau Giang
| Leaf position | Location | Nutrient content | |||||||||
|---|---|---|---|---|---|---|---|---|---|---|---|
| N | P | K | Ca | Mg | Na | Cu | Fe | Zn | Mn | ||
| +14 | VV | 1.643b | 0.241 | 0.493b | 0.136a | 0.098c | 0.027 | 0.483 | 300.7a | 23.9a | 49.6b |
| VVA | 2.088a | 0.250 | 0.495b | 0.084b | 0.213a | 0.032 | 0.571 | 225.5b | 28.9a | 65.8b | |
| TT | 1.967a | 0.292 | 0.781a | 0.044c | 0.163b | 0.028 | 0.540 | 235.3b | 25.7a | 219.7a | |
| HT | 1.596b | 0.289 | 0.370c | 0.043c | 0.160b | 0.029 | 0.491 | 258.2ab | 12.6b | 69.3b | |
| Sign | * | ns | * | * | * | ns | ns | * | * | * | |
| +15 | VV | 1.680 | 0.213c | 0.550b | 0.050 | 0.123b | 0.024 | 0.695b | 317.0a | 24.2ab | 66.9c |
| VVA | 1.995 | 0.243bc | 0.794a | 0.045 | 0.134b | 0.018 | 0.445b | 317.0a | 26.6a | 127.0b | |
| TT | 1.727 | 0.339a | 0.707a | 0.035 | 0.187a | 0.026 | 1.076a | 149.9b | 19.5bc | 212.0a | |
| HT | 1.671 | 0.295ab | 0.416b | 0.044 | 0.201a | 0.027 | 0.612b | 167.3b | 16.6c | 75.7c | |
| Sign | ns | * | * | ns | * | ns | * | * | * | * | |
| +18 | VV | 1.913 | 0.231b | 0.547bc | 0.041b | 0.156a | 0.019 | 0.503 | 395.4a | 19.0b | 75.0b |
| VVA | 1.801 | 0.226b | 0.649ab | 0.076a | 0.088b | 0.019 | 0.463 | 179.0b | 26.0a | 73.9b | |
| TT | 1.785 | 0.310a | 0.698a | 0.045b | 0.212a | 0.026 | 0.602 | 194.4b | 24.9a | 161.9a | |
| HT | 1.624 | 0.268ab | 0.426c | 0.076a | 0.182a | 0.026 | 0.465 | 230.8b | 16.8b | 69.6b | |
| Sign | ns | * | * | * | * | ns | ns | * | * | * | |
Note: In the same column, numbers followed by different letters are different at 5% significance (*); ns: no significance. Sign: significance level. VV: Vinh Vien; VVA: Vinh Vien A; TT: Tan Tien; HT: and Hoa Tien.
Nutrient contents in ratoon pineapple at leaves +20, +22, and +24 at four locations in Hau Giang
| Leaf position | Location | Nutrient content | |||||||||
|---|---|---|---|---|---|---|---|---|---|---|---|
| N | P | K | Ca | Mg | Na | Cu | Fe | Zn | Mn | ||
| +20 | VV | 1.801b | 0.185b | 0.373b | 0.053 | 0.121b | 0.022 | 1.067a | 284.3a | 35.1a | 97.8b |
| VVA | 2.065a | 0.211b | 0.344b | 0.056 | 0.176b | 0.028 | 0.487b | 245.1ab | 28.9ab | 85.8bc | |
| TT | 1.762b | 0.243ab | 0.858a | 0.057 | 0.268a | 0.031 | 0.987a | 205.9b | 20.3c | 132.0a | |
| HT | 1.727b | 0.293a | 0.325b | 0.050 | 0.178b | 0.024 | 0.942a | 198.0b | 21.6bc | 65.8c | |
| Sign | * | * | * | ns | * | ns | * | * | * | * | |
| +22 | VV | 1.760ab | 0.190b | 0.313 | 0.042 | 0.121 | 0.033 | 1.543b | 215.9ab | 29.1 | 82.3b |
| VVA | 1.988a | 0.221b | 0.286 | 0.042 | 0.186 | 0.041 | 1.440b | 252.5a | 28.5 | 97.0b | |
| TT | 1.708ab | 0.292a | 0.266 | 0.040 | 0.145 | 0.036 | 1.440b | 219.0ab | 19.2 | 149.3a | |
| HT | 1.600b | 0.263a | 0.459 | 0.041 | 0.175 | 0.029 | 2.060a | 161.8b | 30.6 | 93.3b | |
| Sign | * | * | ns | ns | ns | ns | * | * | ns | * | |
| +24 | VV | 1.661 | 0.189 | 0.263b | 0.067a | 0.103bc | 0.031b | 0.894b | 242.1b | 23.3b | 86.8a |
| VVA | 1.657 | 0.235 | 0.428a | 0.049b | 0.200a | 0.024b | 0.487c | 299.0a | 44.8a | 46.1b | |
| TT | 1.762 | 0.242 | 0.252b | 0.037b | 0.141b | 0.042a | 1.378a | 227.1b | 21.7b | 83.1a | |
| HT | 1.773 | 0.208 | 0.307b | 0.035b | 0.074c | 0.029b | 0.521c | 244.3b | 20.1b | 48.9b | |
| Sign | ns | ns | * | * | * | * | * | * | * | * | |
Note: In the same column, numbers followed by different letters are different at 5% significance (*); ns: no significance. Sign: significance level. VV: Vinh Vien; VVA: Vinh Vien A; TT: Tan Tien; HT: Hoa Tien.
3.2.2 Nutrient DRIS indices of ratoon pineapple in Vinh Vien, Vinh Vien A, Hoa Tien, and Tan Tien, Hau Giang province
The DRIS indices at leaves +1, +3, +7, +14, +15, +18, +20, +22, and +24 of N, P, K, Na, Ca, Mg, Cu, Fe, Zn, and Mn nutrients are presented in Tables 10–12. At leaves +1 and +7, the norm sets were reliable in diagnosing plant nutrition status (Table 4). Therefore, the two leaf positions were evaluated as follows.
DRIS indices of ratoon pineapple at leaves +1, +3, and +7 in four locations in Hau Giang
| Leaf position | Location | DRIS indices | |||||||||
|---|---|---|---|---|---|---|---|---|---|---|---|
| N | P | K | Na | Ca | Mg | Cu | Fe | Zn | Mn | ||
| +1 | VV | 5.47 | 9.86 | −54.5c | 79.4b | −107.6b | 11.8a | −416.0a | 75.0b | 8.9a | 243.3b |
| VVA | 4.10 | 4.75 | −21.0b | 77.0b | −63.9a | 3.68b | −361.4a | 80.3b | −9.6b | 176.3b | |
| TT | 17.5 | −7.09 | 17.0a | 160.8a | −87.7ab | −13.5c | −904.1b | 142.9a | −24.0b | 405.2a | |
| HT | −3.24 | 5.62 | −29.0bc | 38.4b | −53.6a | 19.3a | −238.5a | 26.7c | −18.8b | 148.3b | |
| Sign | ns | ns | * | * | * | * | * | * | * | * | |
| +3 | VV | 132.5b | — | −93.7b | 3.96 | 7.69a | 104.4c | −226.4a | 64.2b | 8.10 | 19.7bc |
| VVA | 229.0a | — | −86.5b | 5.72 | −2.56b | 139.0b | −371.6b | 94.0a | 6.96 | 12.5c | |
| TT | 194.2ab | — | −68.1ab | 0.01 | −7.79b | 71.5d | −225.9a | 24.9c | 6.43 | 28.8a | |
| HT | 170.3ab | — | −43.9a | 2.31 | −2.16b | 203.9a | −419.9b | 35.0c | 3.24 | 26.1ab | |
| Sign | * | * | ns | * | * | * | * | ns | * | ||
| +7 | VV | −11.3 | −21.4d | −74.6c | 102.5a | 79.3 | −0.39c | −517.2 | 104.6a | −3.94 | 109.5ab |
| VVA | 7.83 | −17.8bc | −11.7a | 85.1ab | 69.9 | 28.9a | −396.7 | 44.4b | 1.25 | 66.0b | |
| TT | 11.8 | −6.01ab | −30.4b | 58.1b | 65.4 | 6.08bc | −410.8 | 33.3b | −4.02 | 129.7a | |
| HT | −1.59 | −0.42a | −21.7ab | 55.9b | 56.8 | 15.2b | −390.3 | 76.0ab | −0.78 | 81.3b | |
| Sign | ns | * | * | * | ns | * | ns | * | ns | * | |
Note: In the same column, numbers followed by different letters are different at 5% significance (*); ns: no significance. Sign: significance level. VV: Vinh Vien; VVA: Vinh Vien A; TT: Tan Tien; and HT: Hoa Tien.
DRIS indices of ratoon pineapple at leaves +14, +15, and +18 in four locations in Hau Giang
| Leaf position | Location | DRIS indices | |||||||||
|---|---|---|---|---|---|---|---|---|---|---|---|
| N | P | K | Na | Ca | Mg | Cu | Fe | Zn | Mn | ||
| +14 | VV | −6.79 | 15.6 | 10.3b | 23.7b | — | 61.1 | −746.6a | 342.6a | 4.10ab | 102.9b |
| VVA | 3.91 | 15.6 | −18.8bc | 26.6b | — | 168.8 | −595.4a | 225.6b | 8.92a | 129.4b | |
| TT | −8.05 | 20.6 | 77.9a | 13.0c | — | 66.2 | −1094.4b | 236.8b | −3.68b | 554.4a | |
| HT | −8.50 | 19.4 | −52.0c | 39.5a | — | 166.9 | −681.5a | 297.0ab | −15.8c | 160.1b | |
| Sign | ns | ns | * | * | * | * | * | * | * | ||
| +15 | VV | 4637.6a | 15.6a | −71.0b | 157.4 | −5.31a | −47.3 | −594.1a | 136.5a | −2.50a | −2983.2c |
| VVA | 543.6c | 1.57b | −40.0a | 146.4 | −19.4a | −48.0 | −1002.6b | 168.3a | −3.73a | −80.1a | |
| TT | 25.4c | −1.72b | −48.7ab | 109.4 | −42.9b | −2.98 | −564.3a | 25.7b | −22.4b | 220.2a | |
| HT | 3226.4b | 21.5a | −109.7c | 188.7 | −1.55a | 13.5 | −595.5a | 60.0b | −21.9b | −2008.5b | |
| Sign | * | * | * | ns | * | * | * | * | * | * | |
| +18 | VV | −4.71b | 1.19b | −89.6b | 112.6 | −45.4b | 9.18c | −1054.5 | 272.7a | −1.35b | 79.5b |
| VVA | 8.91a | 7.56a | −34.1a | 155.0 | 1.67a | 0.53bc | −815.4 | 103.2b | 12.6a | 84.1b | |
| TT | −1.37b | 8.17a | −41.6a | 182.1 | −40.6b | 27.0a | −971.9 | 86.7b | 3.15b | 171.1a | |
| HT | −0.68b | 9.50a | −90.2b | 218.0 | −5.99a | 25.1ab | −1003.4 | 140.3b | −1.36b | 74.2b | |
| Sign | * | * | * | ns | * | * | ns | * | * | * | |
Note: In the same column, numbers followed by different letters are different at 5% significance (*); ns: no significance. Sign: significance level. VV: Vinh Vien; VVA: Vinh Vien A; TT: Tan Tien; and HT: Hoa Tien.
DRIS indices of ratoon pineapple at leaves +20, +22, and +24 in four locations in Hau Giang
| Leaf position | Location | DRIS indices | |||||||||
|---|---|---|---|---|---|---|---|---|---|---|---|
| N | P | K | Na | Ca | Mg | Cu | Fe | Zn | Mn | ||
| +20 | VV | −1.03bc | −10.2 | −83.1b | 51.7b | −29.6 | 2.78b | −364.2a | 14.4a | 12.1a | 99.8b |
| VVA | 5.22ab | −6.37 | −84.9b | 135.0a | −18.1 | 25.3a | −879.0c | 1.16ab | 7.28a | 168.2a | |
| TT | −4.42c | −8.06 | −30.3a | 74.0b | −22.3 | 46.4a | −557.1b | −22.6c | −7.15b | 128.3b | |
| HT | 7.04a | −10.7 | −67.8b | 67.9b | −14.3 | 42.5a | −342.5a | −6.38bc | 5.65a | 55.5c | |
| Sign | * | ns | * | * | ns | * | * | * | * | * | |
| +22 | VV | 39.4 | 327.6 | −146.4 | 152.7 | −37.6 | 2.26b | −336.6 | 59.1a | 8.97ab | −81.8 |
| VVA | −8.99 | 310.9 | −168.2 | 212.7 | −44.1 | 12.0ab | −488.2 | 79.1a | 0.98bc | −67.3 | |
| TT | −18.5 | 461.7 | −157.3 | 173.8 | −53.1 | −1.07b | −448.8 | 70.4a | −9.00c | −76.2 | |
| HT | −8.34 | 490.4 | −84.1 | 97.0 | −29.7 | 26.1a | −222.0 | 15.1b | 14.3a | −139.5 | |
| Sign | ns | ns | ns | ns | ns | * | ns | * | * | ns | |
| +24 | VV | −3.46ab | 2.73ab | −41.5c | 39.0b | −12.8a | 61.2b | −297.6a | 17.9ab | 98.6bc | −20.5a |
| VVA | −17.0b | −7.89c | 81.2a | 26.3b | −16.5a | 279.0a | −1102.9c | 9.79b | 389.7a | −162.4b | |
| TT | −14.6b | 0.24bc | −86.4c | 80.9a | −51.9b | 40.7b | −226.9a | 21.1ab | 57.9c | −18.9a | |
| HT | 7.23a | 12.8a | 11.5b | 55.2ab | −38.8ab | 64.5b | −437.7b | 27.1a | 150.5b | −58.0a | |
| Sign | * | * | * | * | * | * | * | * | * | * | |
Note: In the same column, numbers followed by different letters are different at 5% significance (*); ns: no significance. Sign: significance level. VV: Vinh Vien; VVA: Vinh Vien A; TT: Tan Tien; and HT: Hoa Tien.
At both leaves +1 and +7, N nutrient was deficient in HT and sufficient in VVA and TT. However, in VV, the N content was sufficient according to leaf +1 but deficient at leaf +7, with DRIS indices of 5.47 and −11.3, respectively. In addition, the DRIS indices at leaf +1 showed P deficiency only in TT (−7.09). However, in leaf +7, P was deficient at the four locations: VV, VVA, TT, and HT. For the K nutrient, the DRIS indicated deficiencies in the four locations at both leaf positions, except for TT at leaf +1 (17.0). Along the same lines, according to DRIS indices at leaf +1, VV, VVA, TT, and HT lacked Ca. However, Ca was sufficient in the four locations for leaf +7. The DRIS indices at leaf +1 revealed Mg deficiency in TT, while at leaf +7, Mg was deficient in VV. DRIS indices of Na were positive at both leaf positions in the four locations and were 38.4–160.8 and 55.9–102.5, respectively. The DRIS indices revealed that Cu and Zn were deficient because of negative DRIS indices, while Fe and Mn were in excess due to positive DRIS indices (Tables 10–12).
4 Discussion
4.1 Effects of leaf positions of ratoon pineapple on DRIS analysis
According to Agbangba et al. [32], a sample size of 200 is optimal for DRIS analysis for pineapple, and the sample size determines the accuracy of the DRIS norms. This showed a high reliability of the DRIS norm set made in the current study. For the pineapple plant, different leaf positions also show different DRIS norm sets. In the study by Xuan et al. [24], leaf +1 and leaf +3 were investigated and used to successfully diagnose the nutrient status of N, K, Ca, and Mg. In the current study, nine leaf positions were investigated (Tables 1–3). However, other leaf positions were suitable for diagnosing one or some nutrients (Tables 4–6). For example, at leaf +18, the treatments without each of P or Ca showed insignificant changes. Therefore, leaf +18 cannot be used to diagnose P and Ca nutrients. The same occurred at leaves +3 and +22 for N, P, and K nutrients, leaf +14 for Ca nutrients, leaf +15 for N nutrients, leaf +20 for P and Ca nutrients, and leaf +24 for N, P, and Ca nutrients. Thus, leaves +1 and +7 were selected because, at each nutrient, the NPKCaMg treatment had a significantly greater result than the treatment omitted with a corresponding nutrient (Table 1). This is a bit contradictory to the study by Xuan et al. [24] and Khuong et al. [25,26] on plant pineapple, where leaf +3 can be used for nutrient diagnosis, while in the current study on ratoon pineapple, leaves +1 and +7 were more accurate than leaf +3. This study suggests that DRIS norms for ratoon pineapple differ slightly from those for plant pineapple.
4.2 Effects of different ratoon pineapple farms on DRIS analysis
In the four pineapple farming regions (Tables 7–9), DRIS indices were made (Tables 10–12) based on selected leaf positions (Tables 4–6). For instance, at leaves +1 and +7, N was considered sufficient in VVA and TT, and deficient in HT, but leaf +1 showed N excess, while leaf +7 showed N deficiency in VV. This indicated that different regions show different nutrient requirements. Therefore, the DRIS establishment should be for a certain crop in a certain region at a certain point in time, and the reliability of the established norm set should be investigated to optimize fertilization for crop enhancement. This explains why many DRIS norm sets were made [24,25]. According to Anago et al. [33], the nutrition status of cowpeas in four communes of Benin showed nutrient deficiencies in each commune as follows: P > K > Ca > Zn > N > Mg; P > K > Ca > N > Zn > Mg; N > Mg > Zn > K > P > Ca; P > Ca > K > N > Mg > Zn, respectively, in Dassa-Zoume, Glazoue, Ketou, and Ouesse. This indicates that the soil conditions and farming techniques of each commune were different, leading to different nutrition status. Therefore, in the current study, DRIS indices were used to evaluate different pineapple farming regions (Tables 10–12). In addition, the nutrient diagnosis, when combining both DRIS and soil analysis, showed correlations [34]. For maize in Nigeria, low nutrient contents in the soil led to negative DRIS indices and vice versa, i.e., soil fertility and characteristics are different according to different regions, so fertilization and farming technique recommendations should consider the soil of each region [34].
4.3 Nutrient demands according to DRIS analysis
Apart from pineapple, DRIS has been applied to many crops, such as vegetables, fruits, and annual plants. Particularly, Mirzaee et al. [17] used DRIS to evaluate the nutrition status of Lisbon lemon and Perl tangerine in Dezful, South Iran. DRIS has also been used for the cocoa–coconut system, with the following order: Mn > Cu > Zn > Fe > B [35]. For Keitt mango in semi-arid regions in Brazil, nutrient deficiencies were ranked as follows: Zn > Al > Na > Cu > S > B > Mn > P ∽ K > Fe > Ca > N > Mg [36]. In the study by Khuong et al. [26], the demands of plant pineapple ranked as follows: K > Zn > N > Mg > Ca > Fe > Mn > P. Subsequently, our study has successfully provided a reference for the nutrient demand of the ratoon pineapple: Cu > Ca > K > Zn > P > N > Fe > Mn. Apart from crop differences, nutrient demands may vary based on specific conditions and purposes in a certain study because different authors may choose different nutrient targets. For example, Perígolo et al. [13] targeted four elements N, P, K, and S for coffee, while five elements N, P, K, Mg, and B were studied for oil palm by Kamireddy et al. [19]. Although da Silva et al. [16] tested N, P, K, Ca, Mg, S, Fe, Cu, Mn, Zn, and B, only Ca was further analyzed for table grapes. The same was followed in the study by Souza et al. [18], where only N was further investigated for soybeans. Furthermore, Rezende et al. [20] also added Cl and Mo into DRIS norms for mango.
4.4 Limitations and applicability of the established DRIS norms
On the Smooth Cayenne pineapple, Teixeira et al. [37] established a DRIS norm set in Brazil. Furthermore, Agbangba et al. [38] also founded a DRIS norm set for pineapples in Benin, in which only leaf +3 was used. However, these data were considered preliminary and needed further modifications to be available due to only one season process. Thus, the omission plot experiment should be reorganized for at least one more season to evaluate nutrients. Moreover, norm sets for each growth stage of the plant should be built to make it more accurate in diagnosing crop nutrition status. For instance, in the study by de Amorim et al. [39], a DRIS norm set was established for Perola pineapple and showed different adequacy levels of nutrients from the previous studies. Furthermore, based on the current study, an actual field trial should be conducted to confirm the reliability of established DRIS norms.
The current study can be applied as a reference for local agricultural managers to recommend the farmers focus on Cu, Ca, and K rather than overusing macronutrients such as N and P. In Vietnam, farmers mainly focus on macronutrient fertilization, such as N and P, while other nutrients are ignored. This leads to the mass use of urea and superphosphate chemical fertilizers. In the current study, the local agricultural managers will have strong evidence to guide farmers to reduce the use of N and P fertilizers and to consider other micronutrients. However, although DRIS is an excellent tool to evaluate nutrient status and provide farmers with direct recommendations on nutritional balance for crops, it is a time-consuming approach [40]. Thus, the use of an algorithm should be a possible solution by merging a large database from different crops under different conditions. For example, a DRIS system was made for bananas from two databases of the Tropical Phytotechnie Research Group in the National University of Colombia [41]. Moreover, the combination of different methods can be useful to develop a database. For instance, DRIS and CND were coupled to determine to nutrient status of almonds [41]. For walnuts, DRIS and principal component analysis were combined for the diagnosis of nutrient deficiency [42]. Hence, from the results of the current study, more investigations should be made in different regions to achieve an adequate database to construct a specific DRIS software for pineapple in acidic soils. First, the acid sulfate soil in different regions in the Mekong Delta, Vietnam, should be considered.
5 Conclusion
DRIS indices for ratoon pineapple were made according to the omission plot at leaves +1, +3, +7, +14, +15, +18, +20, +22, and +24. Leaves +1 and +7 were more reliable because the DRIS indices of P, K, Ca, and Mg in the corresponding omission treatments were lower than those in the NPKCaMg. Based on the established norm set at leaf +1, pineapples were determined to be sufficient in N, P, and Ca and deficient in K and Mg. For micronutrients, Cu and Zn were determined to be sufficient, while Fe and Mn were deficient. The nutrient demand of ratoon was determined as follows: Cu > Ca > K > Zn > P > N > Fe > Mn. However, an omission plot should be reorganized to investigate the determined nutrition status. The current established DRIS can be further utilized by the local agricultural managers to develop a strategy to promote the use of Cu, Ca, and K fertilizers and reduce the use of N, P, Fe, and Mn fertilizers to enhance pineapple yield, improve the production profits, and maintain the health of the environment. Additionally, this study can be a beneficial reference for DRIS studies in the world, especially to contribute to a database for the software to universally determine the nutrient status of pineapple in acidic soils.
Acknowledgement
The authors sincerely appreciate the Crop Production Laboratory (Faculty of Crop Science, College of Agriculture, Can Tho University) for providing the equipment, chemicals, and materials for this study.
-
Funding information: This research was funded by the Hau Giang Department of Science and Technology under Grant no. 02/HÐ-KHCN.
-
Author contributions: All authors have accepted responsibility for the entire content of this manuscript and consented to its submission to the journal, reviewed all the results and approved the final version of the manuscript. N.H.M.A. – conceptualization, formal analysis, and writing – original draft; P.C.H., N.T.N., L.T.N.T., N.D.T., V.M.T., and T.T.N.T. – formal analysis and investigation; L.T.Q. – formal analysis, investigation, and writing – review and editing; N.Q.K. – conceptualization, methodology, supervision, funding acquisition, and writing – review and editing.
-
Conflict of interest: Authors state no conflict of interest.
-
Data availability statement: The datasets generated during and/or analyzed during the current study are available from the corresponding author on reasonable request.
References
[1] Ali MM, Hashim N, Abd Aziz S, Lasekan O. Pineapple (Ananas comosus): A comprehensive review of nutritional values, volatile compounds, health benefits, and potential food products. Food Res Int. 2020 Nov;137:109675. 10.1016/j.foodres.2020.109675.Suche in Google Scholar PubMed
[2] Hossain MF. World pineapple production: An overview. Afr J Food Agric Nutr Dev. 2016 Dec;16(4):11443–56. 10.18697/ajfand.76.15620.Suche in Google Scholar
[3] The United Nations Conference on Trade and Development (UNCTAD). Pineapple [Internet]; 2014. http://www.unctad.info/en/Infocomm/AACP-Products/COMMODITY-PROFILE---Pineapple.Suche in Google Scholar
[4] Thong NV. Cau Duc Pineapple [Internet]. Hau Giang Agriculture Extension Center, Hau Giang, Department of Agriculture and Rural Development; 2017. http://www.khuyennonghaugiang.com.vn/Default.aspx?tabid=37.Suche in Google Scholar
[5] Bartholomew DP, Rohrbach KG, Evans DO. Pineapple cultivation in Hawaii. Honolulu (HI): University of Hawai; 2002.Suche in Google Scholar
[6] Biswas P, Nishat SA. Production and export possibility of canned pineapple and pineapple leaf fiber in Bangladesh. IOSR J Bus Manag. 2019;21(9):17–23. 10.9790/487X-2109041723.Suche in Google Scholar
[7] Maia VM, Pegoraro RF, Aspiazú I, Oliveira FS, Nobre DA. Diagnosis and management of nutrient constraints in pineapple. In: Srivastava AK, Hu C, editors. Fruit crops. Amsterdam, Netherlands: Elsevier; 2020 Jan. p. 739–60. 10.1016/B978-0-12-818732-6.00050-2.Suche in Google Scholar
[8] Ngan PN, Tien PD, Thuc LV, Huu TN, Xuan LNT, Chung TTK, et al. Analysis of present cultivation techniques (Ananas comosus L.) in Vi Thanh city, Hau Giang province. Vietnam J Agric Rural Dev. 2021;419(2):135–40.Suche in Google Scholar
[9] Walworth JL, Sumner ME. The diagnosis and recommendation integrated system (DRIS). In: Stewart BA, editor. Advances in soil science. New York: Springer; 1987 June. p. 149–88. 10.1007/978-1-4612-4682-4_4.Suche in Google Scholar
[10] Ray PK. Nutrition, fertilization and irrigation. In: Mitra S, editor. Jackfruit: Botany, production and uses. Wallingford, UK: CABI; 2023. p. 158–94.Suche in Google Scholar
[11] Traspadini EI, Wadt PG, de Mello Prado R, Roque CG, Wassolowski CR. Prescient diagnostic analysis for boron nutritional status in soy crops. Sci Rep. 2023 Feb;13(1):2281. 10.1038/s41598-022-26263-2.Suche in Google Scholar PubMed PubMed Central
[12] Morales J, Rodríguez-Carretero I, Martínez-Alcántara B, Canet R, Quiñones A. DRIS norms and sufficiency ranges for persimmon ‘Rojo Brillante’ grown under Mediterranean conditions in Spain. Agronomy. 2022 May;12(6):1269. 10.3390/agronomy12061269.Suche in Google Scholar
[13] Perígolo D, Nogueira NO, César MD, Rocha BC, Clemente JM. Widespread nutritional imbalances of coffee plantations. J Plant Nutr. 2023 Jun;46(10):2407–15. 10.1080/01904167.2022.2155551.Suche in Google Scholar
[14] Serra AP, Marchetti ME, Rojas EP, Vitorino AC. Beaufils ranges to assess the cotton nutrient status in the southern region of Mato Grosso. Rev Bras Ciênc Solo. 2012;36:171–82. 10.1590/S0100-06832012000100018.Suche in Google Scholar
[15] Villaseñor-Ortiz D, de Mello Prado R, Pereira da Silva G, Lata-Tenesaca LF. Applicability of DRIS in bananas based on the accuracy of nutritional diagnoses for nitrogen and potassium. Sci Rep. 2022 Oct;12(1):18125. 10.1038/s41598-022-22554-w.Suche in Google Scholar PubMed PubMed Central
[16] da Silva SR, Freire FJ, Rezende JS, Santos RL, Cunha JC. Nutritional status and quality of table grapes cultivated in Submédio São Francisco Valley. Rev Bras Eng Agríc Amb. 2023 Mar;27:415–21. 10.1590/1807-1929/agriambi.v27n5p415-421.Suche in Google Scholar
[17] Mirzaee S, Rasouli Sadaghiani MH, Miran N. Evaluating the nutritional status of Lisbon lemon and Perl tangerine gardens in Dezful using DRIS and DOP methods. Water Soil Sci. 2023 Dec;33(4):185–200. 10.22034/WS.2022.54302.2505.Suche in Google Scholar
[18] Souza HA, Rozane DE, Vieira PF, Sagrilo E, Leite LF, Brito LC, et al. Accuracy of DRIS and CND methods and nutrient sufficiency ranges for soybean crops in the Northeast of Brazil. Acta Sci Agron. 2023 Apr;45:e59006. 10.4025/actasciagron.v45i1.59006.Suche in Google Scholar
[19] Kamireddy M, Behera SK, Kancherla S. Establishing critical leaf nutrient concentrations and identification of yield limiting nutrients for precise nutrient prescriptions of oil palm (Elaeis guineensis Jacq) plantations. Agriculture. 2023 Feb;13(2):453. 10.3390/agriculture13020453.Suche in Google Scholar
[20] Rezende JS, Freire FJ, da Silva SR, Musser RD, Cavalcante ÍH, Saldanha E, et al. Nutritional diagnosis of mango plants post-harvest in anticipation of pre-flowering avoids nutritional stress. Rev Bras Eng Agríc Amb. 2023 Mar;27:359–66. 10.1590/1807-1929/agriambi.v27n5p359-366.Suche in Google Scholar
[21] Villaseñor D, Prado RD, Pereira da Silva G, Carrillo M, Durango W. DRIS norms and limiting nutrients in banana cultivation in the South of Ecuador. J Plant Nutr. 2020 Jul;43(18):2785–96. 10.1080/01904167.2020.1793183.Suche in Google Scholar
[22] Angeles DE, Sumner ME, Barbour NW. Preliminary nitrogen, phosphorus, and potassium DRIS norms for pineapple. HortScience. 1990 Jun;25(6):652–5. 10.21273/HORTSCI.25.6.652.Suche in Google Scholar
[23] Sumner ME, Angeles DE. Nutrient balance and the yield and quality of pineapple. Commun Soil Sci Plant Anal. 1990 Aug;21(13–16):1431–6. 10.1080/00103629009368314.Suche in Google Scholar
[24] Xuan LNT, Anh TK, Diep LTH, Van TTB, Thu LTM, Khuong NQ. Foundation and validation of diagnosis and recommendation of integrated system norms for evaluating nutrient status of pineapple plants (Ananas comosus L.). Aust J Crop Sci. 2023 Jul;17(7):600–7.10.21475/ajcs.23.17.06.p3936Suche in Google Scholar
[25] Khuong NQ, Nhi LTY, Quang LT, Xuan LNT, Thuc LV. Norms establishment of the diagnosis and recommendation integrated system at preflowering in pineapple (Ananas comosus L.) and its verification in case of nutrient omission trial by two consecutive crops. Commun Soil Sci Plant Anal. 2023 May;54(9):1198–214. 10.1080/00103624.2022.2138910.Suche in Google Scholar
[26] Khuong NQ, Anh NH, Quang LT, Xuan LNT. Appraisal of the diagnosis and recommendation integrated system and nutrient status of pineapple (Ananas Comosus L.) growing fields. Commun Soil Sci Plant Anal. 2024 May;55(10):1508–38. 10.1080/00103624.2024.2319807.Suche in Google Scholar
[27] Khuong NQ, Anh NT, Dang NH, Han LV, Le TN, Xuan LN, et al. Determining an appropriate leaf position to establish norms of diagnosis and recommendation integrated system for ratoon pineapple. Asian J Plant Sci. 2023;22(1):173–98. 10.3923/ajps.2023.173.198.Suche in Google Scholar
[28] Khuong NQ, Thuyen LTG, Dao NTX, Phung NM, Quang LT, Xuan LNTX. Specific-site nutrient management for ratoon pineapple (Ananas comosus L.). J Trop Agric Sci. 2024. Under review.Suche in Google Scholar
[29] Houba VJG, Lee VD, Novazamsky I. Soil and plant analysis - Part 5B Soil analysis procedures. 6th edn. The Netherlands: Department of Soil Science and Plant Nutrition, Wageningen Agricultural University; 1995. p. 217.Suche in Google Scholar
[30] Beaufils ER. Diagnosis and recommendation integrated system (DRIS). University of Natal, Pietermartizburg, South Africa. Soil Sci Bull. 1973;1:1–32.Suche in Google Scholar
[31] Sumner ME. Use of the DRIS system in foliar diagnosis of crops at high yield levels. Commun Soil Sci Plant Anal. 1977 Jan;8(3):251–68. 10.1080/00103627709366718.Suche in Google Scholar
[32] Agbangba CE, Aubin A, Sossa EL. Optimal sample size for DRIS model parameterisation to diagnosis nutrients status in fruit crops. Afr Crop Sci J. 2024 Aug;32(2):185–92. 10.4314/acsj.v32i2.6.Suche in Google Scholar
[33] Anago FN, Agbangba EC, Dagbenonbakin GD, Amadji LG. Continuous assessment of cowpea [Vigna unguiculata L. Walp.] nutritional status using diagnosis and recommendation integrated system approach. Sci Rep. 2023 Sep;13(1):14446. 10.1038/s41598-023-40146-0.Suche in Google Scholar PubMed PubMed Central
[34] Aliyu KT, Kamara AY, Huising J, Adam AM, Shehu BM, Jibrin JM. Implication of blanket NPK application on nutrient balance of maize based on soil and tissue diagnosis approaches in the savannas of northern Nigeria. Env Res Commun. 2023 Jun;5:065007. 10.1088/2515-7620/acdc87.Suche in Google Scholar
[35] Chinnappan S. DRIS norms for identifying yield limiting micronutrients in cocoa under coconut intercropping systems. J Plant Nutr. 2022 May;45(8):1214–22. 10.1080/01904167.2021.1994592.Suche in Google Scholar
[36] Tullio L, Rozane DE. Dris norms for ‘Keitt’ mango in Brazilian semiarid: Diagnosis and validation. Rev Bras Frutic. 2022 Oct;44:e-177. 10.1590/0100-29452022117.Suche in Google Scholar
[37] Teixeira LA, Quaggio JA, Zambrosi FC. Preliminary DRIS norms for’Smooth Cayenne’pineapple and derivation of critical levels of leaf nutrient concentrations. Acta Hortic. 2007 Nov;822:131–8. 10.17660/ActaHortic.2009.822.15.Suche in Google Scholar
[38] Agbangba EC, Sossa EL, Dagbenonbakin GD, Diatta S, Akpo LE. DRIS model parameterization to access pineapple variety ‘Smooth Cayenne’ nutrient status in Benin (West Africa). J Asian Sci Res. 2011 Jul;1(5):254.Suche in Google Scholar
[39] de Amorim DA, Favero AC, Conceição MP, Vilela Rodrigues MG, Belarmino Rodrigues JB, Natale W, et al. DRIS nutritional norms and sufficiency range for the perola pineapple cultivation. J Plant Nutr. 2024 Aug;47:3998–4007. 10.1080/01904167.2024.2392027.Suche in Google Scholar
[40] Pérez Zapata JJ, Álvarez Albanés EY, Castañeda Sánchez DA. Plant analysis based on the DRIS system: Programming interface with a case study in plantain crop (Musa AAB). Chil J Agric Anim Sci. 2022 Dec;38(3):274–86. 10.29393/chjaa38-26hdnv10026.Suche in Google Scholar
[41] Ferrández-Cámara M, Martínez-Nicolás JJ, Alfosea-Simón M, Cámara-Zapata JM, Melgarejo Moreno P, García-Sánchez F. Estimation of diagnosis and recommendation integrated system (DRIS), compositional nutrient diagnosis (CND) and range of normality (RN) norms for mineral diagnosis of almonds trees in Spain. Horticulturae. 2021 Nov;7(11):481. 10.3390/horticulturae7110481.Suche in Google Scholar
[42] Maulood P. DRIS formulas and PCA approach for evaluation of the nutritional status of walnut trees in the Hawraman area. Passer J Basic Appl Sci. 2024 Jan;6(1):74–9. 10.24271/psr.2023.415676.1388.Suche in Google Scholar
© 2025 the author(s), published by De Gruyter
This work is licensed under the Creative Commons Attribution 4.0 International License.
Artikel in diesem Heft
- Research Articles
- Optimization of sustainable corn–cattle integration in Gorontalo Province using goal programming
- Competitiveness of Indonesia’s nutmeg in global market
- Toward sustainable bioproducts from lignocellulosic biomass: Influence of chemical pretreatments on liquefied walnut shells
- Efficacy of Betaproteobacteria-based insecticides for managing whitefly, Bemisia tabaci (Hemiptera: Aleyrodidae), on cucumber plants
- Assessment of nutrition status of pineapple plants during ratoon season using diagnosis and recommendation integrated system
- Nutritional value and consumer assessment of 12 avocado crosses between cvs. Hass × Pionero
- The lacked access to beef in the low-income region: An evidence from the eastern part of Indonesia
- Comparison of milk consumption habits across two European countries: Pilot study in Portugal and France
- Antioxidant responses of black glutinous rice to drought and salinity stresses at different growth stages
- Differential efficacy of salicylic acid-induced resistance against bacterial blight caused by Xanthomonas oryzae pv. oryzae in rice genotypes
- Yield and vegetation index of different maize varieties and nitrogen doses under normal irrigation
- Urbanization and forecast possibilities of land use changes by 2050: New evidence in Ho Chi Minh city, Vietnam
- Organizational-economic efficiency of raspberry farming – case study of Kosovo
- Application of nitrogen-fixing purple non-sulfur bacteria in improving nitrogen uptake, growth, and yield of rice grown on extremely saline soil under greenhouse conditions
- Digital motivation, knowledge, and skills: Pathways to adaptive millennial farmers
- Investigation of biological characteristics of fruit development and physiological disorders of Musang King durian (Durio zibethinus Murr.)
- Enhancing rice yield and farmer welfare: Overcoming barriers to IPB 3S rice adoption in Indonesia
- Simulation model to realize soybean self-sufficiency and food security in Indonesia: A system dynamic approach
- Gender, empowerment, and rural sustainable development: A case study of crab business integration
- Metagenomic and metabolomic analyses of bacterial communities in short mackerel (Rastrelliger brachysoma) under storage conditions and inoculation of the histamine-producing bacterium
- Fostering women’s engagement in good agricultural practices within oil palm smallholdings: Evaluating the role of partnerships
- Increasing nitrogen use efficiency by reducing ammonia and nitrate losses from tomato production in Kabul, Afghanistan
- Physiological activities and yield of yacon potato are affected by soil water availability
- Vulnerability context due to COVID-19 and El Nino: Case study of poultry farming in South Sulawesi, Indonesia
- Wheat freshness recognition leveraging Gramian angular field and attention-augmented resnet
- Suggestions for promoting SOC storage within the carbon farming framework: Analyzing the INFOSOLO database
- Optimization of hot foam applications for thermal weed control in perennial crops and open-field vegetables
- Toxicity evaluation of metsulfuron-methyl, nicosulfuron, and methoxyfenozide as pesticides in Indonesia
- Fermentation parameters and nutritional value of silages from fodder mallow (Malva verticillata L.), white sweet clover (Melilotus albus Medik.), and their mixtures
- Five models and ten predictors for energy costs on farms in the European Union
- Effect of silvopastoral systems with integrated forest species from the Peruvian tropics on the soil chemical properties
- Transforming food systems in Semarang City, Indonesia: A short food supply chain model
- Understanding farmers’ behavior toward risk management practices and financial access: Evidence from chili farms in West Java, Indonesia
- Optimization of mixed botanical insecticides from Azadirachta indica and Calophyllum soulattri against Spodoptera frugiperda using response surface methodology
- Mapping socio-economic vulnerability and conflict in oil palm cultivation: A case study from West Papua, Indonesia
- Exploring rice consumption patterns and carbohydrate source diversification among the Indonesian community in Hungary
- Determinants of rice consumer lexicographic preferences in South Sulawesi Province, Indonesia
- Effect on growth and meat quality of weaned piglets and finishing pigs when hops (Humulus lupulus) are added to their rations
- Healthy motivations for food consumption in 16 countries
- The agriculture specialization through the lens of PESTLE analysis
- Combined application of chitosan-boron and chitosan-silicon nano-fertilizers with soybean protein hydrolysate to enhance rice growth and yield
- Stability and adaptability analyses to identify suitable high-yielding maize hybrids using PBSTAT-GE
- Phosphate-solubilizing bacteria-mediated rock phosphate utilization with poultry manure enhances soil nutrient dynamics and maize growth in semi-arid soil
- Factors impacting on purchasing decision of organic food in developing countries: A systematic review
- Influence of flowering plants in maize crop on the interaction network of Tetragonula laeviceps colonies
- Bacillus subtilis 34 and water-retaining polymer reduce Meloidogyne javanica damage in tomato plants under water stress
- Vachellia tortilis leaf meal improves antioxidant activity and colour stability of broiler meat
- Evaluating the competitiveness of leading coffee-producing nations: A comparative advantage analysis across coffee product categories
- Application of Lactiplantibacillus plantarum LP5 in vacuum-packaged cooked ham as a bioprotective culture
- Evaluation of tomato hybrid lines adapted to lowland
- South African commercial livestock farmers’ adaptation and coping strategies for agricultural drought
- Spatial analysis of desertification-sensitive areas in arid conditions based on modified MEDALUS approach and geospatial techniques
- Meta-analysis of the effect garlic (Allium sativum) on productive performance, egg quality, and lipid profiles in laying quails
- Optimizing carrageenan–citric acid synergy in mango gummies using response surface methodology
- The strategic role of agricultural vocational training in sustainable local food systems
- Agricultural planning grounded in regional rainfall patterns in the Colombian Orinoquia: An essential step for advancing climate-adapted and sustainable agriculture
- Perspectives of master’s graduates on organic agriculture: A Portuguese case study
- Developing a behavioral model to predict eco-friendly packaging use among millennials
- Government support during COVID-19 for vulnerable households in Central Vietnam
- Citric acid–modified coconut shell biochar mitigates saline–alkaline stress in Solanum lycopersicum L. by modulating enzyme activity in the plant and soil
- Herbal extracts: For green control of citrus Huanglongbing
- Research on the impact of insurance policies on the welfare effects of pork producers and consumers: Evidence from China
- Investigating the susceptibility and resistance barley (Hordeum vulgare L.) cultivars against the Russian wheat aphid (Diuraphis noxia)
- Review Articles
- Reference dietary patterns in Portugal: Mediterranean diet vs Atlantic diet
- Evaluating the nutritional, therapeutic, and economic potential of Tetragonia decumbens Mill.: A promising wild leafy vegetable for bio-saline agriculture in South Africa
- A review on apple cultivation in Morocco: Current situation and future prospects
- Quercus acorns as a component of human dietary patterns
- CRISPR/Cas-based detection systems – emerging tools for plant pathology
- Short Communications
- An analysis of consumer behavior regarding green product purchases in Semarang, Indonesia: The use of SEM-PLS and the AIDA model
- Effect of NaOH concentration on production of Na-CMC derived from pineapple waste collected from local society