Application of Lactiplantibacillus plantarum LP5 in vacuum-packaged cooked ham as a bioprotective culture
-
María Inés Palacio


Abstract
The objective of this study was to evaluate the viability of a potentially protective culture of L. plantarum LP5 in vacuum-packed cooked ham (CH) and the modifications in the sensory and physicochemical characteristics of the product. The study was conducted in triplicate for each treatment (control cooked ham [CCH] and treated cooked ham [TCH]), analysed on days 0, 28, 42, and 84. TCH samples were treated with the protective culture at concentrations approximately 8 log10 CFU/mL per sample by surface spraying. During the product’s shelf life, pH, hardness, colour, and microbial composition were evaluated. The pH values in TCH and CCH presented final values like those of samples treated with bioprotective cultures. An increase in hardness was observed during the shelf life of both samples. At the end of shelf life, the TCH presented lower luminosity and greater redness than the CCH. Microbiological analysis showed the absence of Listeria, Salmonella, and Escherichia coli O157:H7. No sulphite-reducing anaerobes or coagulase-positive Staphylococcus were observed in any sample. In both groups, yeast counts at 28 days of study exceeded the limit permitted by the Argentine Food Code but were lower in the TCH group. L. plantarum LP5 remained viable until the end of the study. Sensory analysis showed no differences between groups. The development of a CH supplemented with beneficial microorganisms and biopreservatives without altering its organoleptic characteristics represents a potential alternative for obtaining healthier foods.
1 Introduction
The production of refrigerated and minimally processed meat products involves the use of moderate heat treatments that allow the survival of a significant residual microbial load. For this reason, it is essential to look for alternative tools as an additional barrier in the “hurdle technology” for the production of meat products [1]. According to the provisions of Article 294 – Resolution RESFC-2018-1-APN-SRYGS#MSN No. 1/2018, of the Chapter VI, Meat and related Foods of the Argentine Food Code, cooked ham (CH) is understood to be a salted product prepared with pork leg, with or without bone, and cooked in salt water with or without authorized seasonings. For the purposes of this definition, pork leg is understood to be the single piece of meat corresponding to the total or partial cutting of the hind limbs of pigs, separated at most from the rest of the side of the semi-carcass at a point no earlier than the end of the hip bone, expressly excluding ground or minced meat and meat trimmings.
Numerous researchers have studied the use of lactic acid bacteria (LAB) and their bacteriocins for the bio-preservation of fresh meat products [2,3,4,5]. Bio-protection has been defined as the use of antagonistic microorganisms and/or their metabolic products to inhibit undesirable organisms to improve food safety and prolong shelf life without significantly altering the sensory properties of the product [6]. The inhibitory effect of LAB against pathogenic and spoilage bacteria is an important indicator of their possible use as protective cultures in food matrices, where they could replace some synthetic preservatives [7,8]. This antagonism is due to direct competition for nutrients and/or the production of different antimicrobial metabolites, such as organic acids, hydrogen peroxide, and an abundant group of protein substances with significant antimicrobial and/or bacteriostatic activity called bacteriocins [9]. Additionally, LAB are generally recognized as safe and meet all recommendations for use in food [10].
The genus Lactiplantibacillus spp. generates a growing interest among microbiologists and technologists dedicated to discovering new biotechnological applications and probiotic properties and represents an alternative to inactivate food pathogens through its active metabolites with inhibitory activity and thus provide safe food to consumers [11]. Lactiplantibacillus plantarum has widespread applications in the pharmaceutical and food industry by contributing significantly to human medicine without causing side effects. L. plantarum is easily cultivated and considered a safe bacterium for humans, animals, and environment [12]. In addition, it has remarkable potential as a probiotic biological preservative due to its double function as an indigenous inhabitant of the human intestine and the tradition regarding its use as a starter culture in the preparation of fermented foods [13]. In particular, the L. plantarum LP5 strain has shown an in vitro antibacterial effect against pathogens involved in food-borne diseases [14,15], in vitro reducing potential of biofilms produced by potentially contaminating pathogens in the food industry [16,17], and protective capacity in vivo in murine models colonized by Campylobacter [15]. The addition of beneficial microorganisms to CH could ensure its safety without altering its organoleptic characteristics. In addition, to its nutritional value, this food could meet demands of today’s consumers.
The objective of this work was to evaluate the feasibility of a potentially protective culture of L. plantarum LP5 on vacuum-packed CH and to determine if there are any changes in the sensory and physicochemical characteristics of the product.
2 Materials and methods
2.1 Ham processing and sample preparation
During the CH production day of a local company, three pieces of ham were randomly selected. These were cut into pieces following the hygiene and safety standards normally used by the industry. The samples obtained were randomly distributed to avoid bias in the groups: Control cooked ham (CCH) and treated cooked ham (TCH) at the following times: 0, 28, 42, 56, 84 days (Figure 1). In addition, samples from each group were used for the sensory analysis. Each group consisted of three samples (n = 3) to provide statistical support. Each sample consisted of a piece of ham cut transversally with a thickness of 2 cm. The samples of the CCH group were vacuum-packed and preserved under the usual conditions. The samples of the TCH group were treated with the protective culture (Lactiplantibacillus plantarum LP5) at concentrations of 8 log10CFU/mL per sample by surface spraying, vacuum-packed, and preserved under the same conditions as the samples of the CCH group.
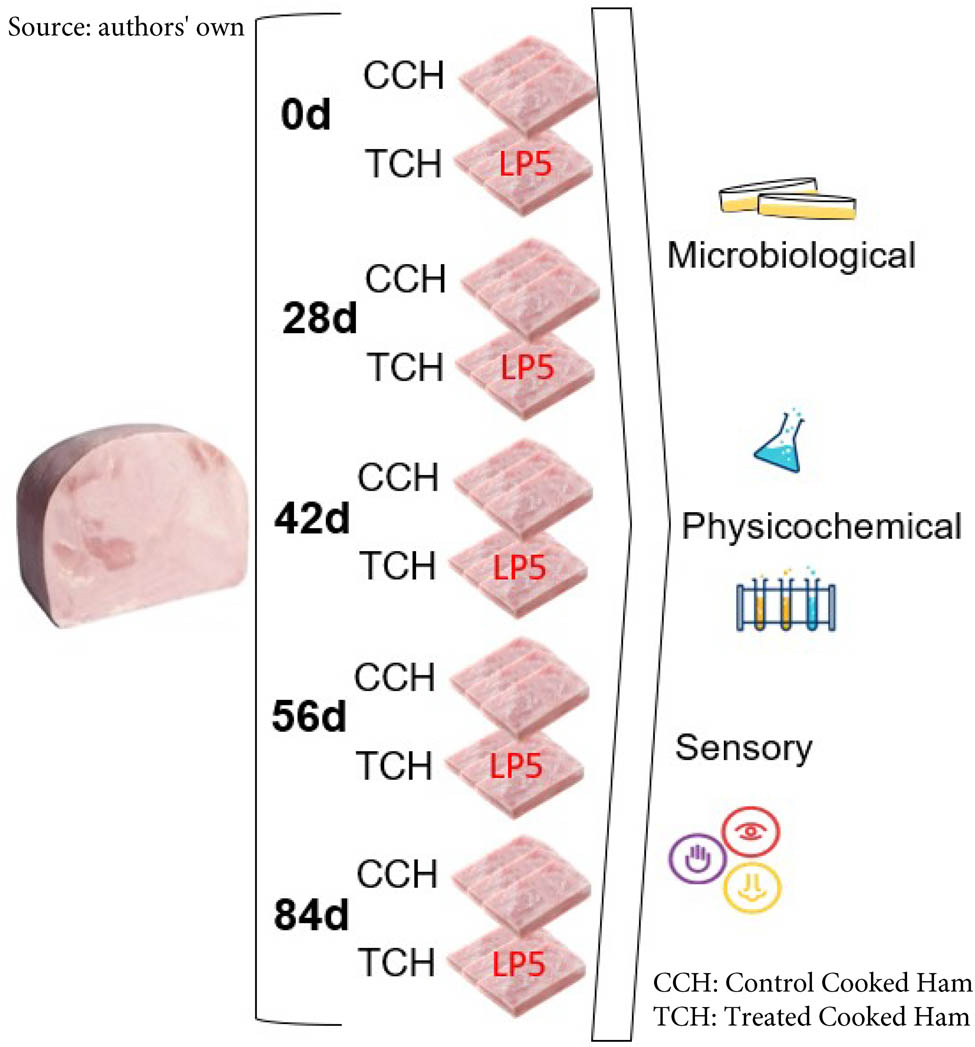
Experimental design for the processing of CH samples.
The samples were taken in triplicate at different times. Each sample was divided into two subsamples to determine the microbiological parameters according to the specifications for cooked salted meats established in Article 286 bis, Chapter VI of the Argentine Food Code [18] and the physicochemical and sensory parameters according to the Quality Protocol for CH [1].
2.2 Proximate composition
Moisture, fat, protein, and ash contents of CH were determined in triplicate according to the AOAC (2000) methods. Moisture content was determined in an oven at 105°C until a constant weight was attained (AOAC 950.46). Fat was extracted by the organic phase extraction method (hexane:isopropanol) according to Galvis Góez et al. [19]. Protein content was measured using the Kjeldahl method with a 6.25 conversion factor (% N total = % proteins) (AOAC 981.10). Ash content was determined by heating at 550°C for 24 h (AOAC 938.08). Sodium chloride content was determined by measuring the chloride-ion content using the Mohr method.
2.3 Physicochemical characterization of CH
All measurements were performed on 0 (when the CH was manufactured) and after 14, 28, 42, 56, and 84 days of storage at 4°C to evaluate the effect of adding L. plantarum LP5 on the surface of CH on the physicochemical and microbial properties and shelf life.
2.4 pH measurement
The pH values were determined by taking at least three measurements of individual samples at three different areas of the product along the longitudinal axis of the product. These areas included the proximal end (adjacent to the tying), the central section (corresponding to the geometric midpoint), and the distal end (located at the opposite extremity from the tie). Each data point represents the mean of three measurements conducted on three independently sampled slices. A previously calibrated pH meter was used (Professional Portable pH Meter, Testo 250, Germany).
2.5 Colour measurement
The internal colour of CH samples was assessed on the surface using a Minolta Chroma meter CR-400 (Minolta Co. Ltd., Osaka, Japan). The CIE colour space coordinates L*, a*, b* were determined on a white tile with illuminant D65 and 2° observer angle. Chroma (C*) was also calculated. Five measurements were recorded for each colour space (L*, a*, b*) from three individual CH slices, each obtained from a different sample (n = 3). Each data point represents the mean of five measurements conducted on three independently sampled slices.
2.6 Warner–Bratzler (WB) shear force
An Instron texturometer (Model 3343, USA) equipped with a 500 N load cell was used for the shear force analysis. Five prisms were obtained from the central part of each ham under study with a longitudinal orientation of the muscle fibres (1 cm × 1 cm × 5 cm). The samples were crossed in the central zone with WB shears, using a crosshead speed of 20 mm/s. Five measurements were taken for each sample. The average of the five repeats was considered as the WB shear force value for each sample.
2.7 Foreign materials
All samples were visually examined to confirm the possible presence or absence of foreign materials, hair, blood, and faecal material.
2.8 Pathogen detection
The microbiological analysis included all the parameters proposed in Article 286 bis of the AFC [18]. The detection of pathogens was carried out by the sausage company according to the methodological standards set out in the article. The methodology used involved the following standards: SO 11290-1:2004; BAMFDA:2003; USDAFSIS:2008; and ISO 6579:2002, BAMFDA 2007. The acceptance criterion indicates the absence of Listeria monocytogenes and Salmonella spp. in 25 g of the sample.
2.9 Quantification of indicator microorganisms
The determination of indicator microorganisms included the quantification of coliforms, coagulase-positive staphylococci, yeast, and mould counts, and sulphite-reducing anaerobes. The analysis was performed from a primary dilution. The CH samples (10 g) were homogenized with 90 mL of sterile peptone water (0.1%) for 120 s in a Stomacher (Seward, UK).
Coliform quantification was done using the most probable number (MPN) technique in the selective medium MacConkey broth (Britania, Argentina) for 48 h at 37°C and confirmed on Brilliant Green Bile broth (Britania, Argentina) for 24 h at 37°C. The results were compared with the AFC criteria (10 and 102 MPN/g).
The quantification of coagulase-positive Staphylococci was performed by inoculation on Baird Parker agar (Britania, Argentina) for 48 h at 37°C, with an initial reading after 24 h. Typical and atypical colonies (5 of each, if present) were cultured in brain heart infusion broth (BHI, Britania, Argentina) for 24 h at 37°C. An aliquot of the culture (0.1 mL) was inoculated in 0.3 mL of equine plasma and incubated at 37°C. The test was observed at 4 and 24 h. The total quantification of the number of coagulase-positive Staphylococci (a) was calculated based on the following equation:
where Ac is the number of typical colonies subjected to the coagulase test; Anc is the number of atypical colonies subjected to the coagulase test; bc is the number of typical colonies that tested positive for the coagulase test; bnc is the number of atypical colonies that tested positive for the coagulase test; Cc is the total number of typical colonies counted on the plate; and Cnc is the total number of atypical colonies counted on the plate. The results obtained were compared with the criterion established by the AFC, ranging between 10 and 102 CFU/g.
The quantification of fungi and yeasts was carried out in a medium for fungi and yeasts (Britania, Argentina) on a surface with aerobic incubation at 25°C for 5 days. The count of fungi and yeasts was compared with the criterion established by the AFC, ranging between 102 and 103 CFU/g.
Quantification of sulphite-reducing anaerobes was performed on Tryptose Sulphite Cycloserine agar (TSC, Britannia, Argentina). Most Clostridia reduce sulphite to sulphide, as evidenced by the black colour produced by iron ions. Plates sown on the surface were incubated anaerobically for 48 h at 37°C. The results were compared with the criteria established by the AFC, ranging between 102 and 103 CFU/g.
2.10 Quantification and viability of L. plantarum LP5
The counts of L. plantarum LP5 were performed on the Lactiplantibacillus plantarum selective medium [20]. Samples were surface-sown, and the plates were incubated at 37°C for 48 h in microaerophilia. The presumptive colonies of L. plantarum considered were approximately 2 mm in size and yellow in colour due to the production of acid from the metabolism of sorbitol. The count of L. plantarum LP5 was expressed in log10CFU/g and was analysed throughout the shelf life of the product.
2.11 Analysis of sensory parameters
The sensory analysis was carried out using a descriptive test, sensory profile of texture, colour, and odour, modified based on the evaluation that is periodically carried out by the company that produces CH. This protocol was developed by the researchers involved in the research and knowledge transfer project that forms part of this study. The sensory profile study was carried out with 26 untrained regular consumers of CH aged between 25 and 65 years. Since trained panellists were not available, these individuals were present at the Faculty of Veterinary Medicine and regularly consumed this type of product. Samples of the product with and without the addition of probiotic bacteria were used in the test 42 days after production. The evaluation was carried out blindly, as the consumers were unaware of the correspondence of the sample’s identity with its treatment. The samples were presented individually in disposable containers coded with four-digit random numbers [21]. The order in which consumers evaluated the products was randomized to achieve a correct balance in presentation and minimize any sensory bias. The evaluation was carried out using terms associated with cooked meat matrices (Figure 2). The survey design included a total of 18 attributes: 4 colour descriptors, 5 odour descriptors, and 9 texture descriptors. Each evaluator was asked to rate each attribute of four samples (control (2) and treated (2)) on a scale from 0 to 9, indicating the optimal rating (9) desired. The data obtained were analysed by a one-way analysis of variance (ANOVA) using the statistical program R Studio (version 4.1-2).

Worksheet used for sensory analysis.
2.12 Statistical analysis
The results are expressed as mean ± standard deviation. An ANOVA was performed followed by Tukey’s test for the comparison of multiple means to determine significant differences (p < 0.05) using Infostat version 2011. Normality and homogeneity of variances were assessed. Different letters were used to label values with statistically significant differences among them.
-
Consent: The sensory analysis was performed anonymously by individuals who previously provided their consent.
3 Results
3.1 Analysis of physicochemical parameters
3.1.1 Proximate composition
Table 1 shows the initial chemical composition of CCH and TCH. The results were evaluated in relation to the parameters required by the AFC in Article 294 [18] and according to the Quality Protocol for CH [1] for this type of product.
Initial proximate composition of CH
| CCH | TCH | ||
|---|---|---|---|
| pH | 6.25 ± 0.07a | 6.30 ± 0.03a | |
| Proximate composition (g/100 g) | NaCl | 1.54 ± 0.22a | 1.67 ± 0.08a |
| Moisture (%, w.b.) | 69.00 ± 1.63a | 68.01 ± 0.46a | |
| Protein | 17.68 ± 2.47a | 18.37 ± 1.39a | |
| Fat | 11.20 ± 0.82a | 11.51 ± 0.83a | |
| Ash | 2.12 ± 0.01a | 2.10 ± 0.09a | |
| Water/Protein mean ratio | 3.90a | 3.70a | |
CCH: Control Cooked Ham.
TCH: Treated Cooked Ham.
w.b.: wet basis.
Different lowercase letter (a) indicate significant differences between groups.
Values are given as mean ± standard deviation (n = 3). The same letter in the same file indicates no significant differences between control and treated group (p < 0.05).
3.1.2 Physicochemical CH characterization
The pH values during the storage of CH were monitored. Figure 3 shows the pH values of both samples during the shelf life storage at 4°C. The initial pH value of CCH was 6.25 ± 0.07 and decreased to 5.56 ± 0.02 on day 84 of storage. For the sample spread with L. plantarum LP5, the initial pH value was 6.30 ± 0.03, and it decreased to 5.52 ± 0.04 on the final day. The results showed a significant decrease in the pH value for TCH on day 28 of storage compared to the CCH (p < 0.05), being lower for the CH spread with L. plantarum LP5 (TCH). At the end of the study (day 84), the pH value of both samples did not differ significantly.

Evolution of pH in CCH and TCH groups during the shelf life period. Data are expressed as mean ± standard deviation (SD), n = 3. Error bars represent SD. Different lowercase letters indicate significance differences overtime within each group; uppercase letters indicate significance differences between treatments at the same time point (p < 0.05).
Values are expressed as mean ± SD (n = 3 per group). The same letters at the same time point (days) indicate no significant differences between the control and treated groups; among the same group at initial and final day (0 vs 84) were also considered differences statistically significant (capital letter) (p < 0.05).
Figure 4 shows the results for RH (%), and Figure 5 shows the data of shear force (N) during storage time. An increase in hardness values during the shelf life period for both samples was observed, showing a significant difference between the initial (0 day) and final time (day 84 ) for both samples, CCH, and TCH but without significant differences between them, reaching values from 18 to 19 N (day 0) to 29 N (day 84). Regarding the visual examination, no CH showed the presence of foreign materials.

Relative humidity (%) of CCH and TCH at initial and final days of shelf life. Data are expressed as mean ± standard deviation (SD), n = 3. Error bars represent SD. Bars sharing the same letter are not significant different (p > 0.05).

Evolution of WB force (N) of CCH and TCH groups during the shelf life period. Data are expressed as mean ± standard deviation (SD), n = 3. Error bars represent SD. Different lowercase letters indicate significant differences overtime within each group; uppercase letters indicate significance differences between treatments at the same time point (p < 0.05).
Values are expressed as mean ± SD (n = 3 per group). The same letters at the same time point (days) indicate no significant differences between the CCH and TCH (p < 0.05).
Values are expressed as mean ± SD (n = 3 per group). The same letters at the same time point (days) indicate no significant differences between the control and treated groups; among the same group at initial and final day (0 vs 84) were also considered differences statistically significant (capital letter) (p < 0.05).
The colours obtained (L*, a*, and b*) in the CH are presented in Table 2, together with the chromatic attribute. It can be observed that at the end of the shelf life, significant differences are evident in the luminosity (L*) and redness (a*) parameters between the samples under study (p < 0.05). Figure 6 shows visually the colour difference of the CCH and TCH samples, where the control is brighter and paler than the sample treated with the strain under study.

Macroscopic observation of colour on day 84 post-inoculation of CCH sample (a) and TCH sample (b).
3.2 Analysis of microbiological parameters
3.2.1 Pathogen detection
The pathogens L. monocytogenes, Salmonella spp., and E. coli O157:H7 were not detected in any of the initial samples. The results were reported as the absence of L. monocytogenes, Salmonella spp., and E. coli O157:H7 in 25 g of the sample, values that, according to the AFC, indicate the product’s suitability for consumption from this microbiological aspect.
3.2.2 Quantification of indicator microorganisms
No growth was observed in the analyses performed for the sulphite-reducing anaerobic count, coagulase-positive Staphylococcus counts, and mould in any of the samples collected during the study period. Yeast counts showed values above the limit permitted by the AFC (103 CFU/g) 28 days after the start of the study in samples from both groups. However, the values obtained in the TCH samples showed a significantly smaller difference than in the CCH samples (p < 0.05) at the end of the study. Yeast counts in the control samples ranged from 4.8 log10CFU/g, while the treated samples remained at values slightly higher than the permitted limit (3.2 log10CFU/g).
3.2.3 Viability of L. plantarum LP5 in CH
Initial quantification of L. plantarum LP5 after inoculation showed levels ranging from 6.11 to 6.69 log10CFU/g (average 6.49 log10CFU/g) in the TCH samples. Throughout the trial, counts remained between 6.29 and 7.42 log10CFU/g (average 6.77 log10CFU/g). Quantification of L. plantarum LP5 at the end of the study showed viability values averaging 7.3 log10CFU/g, with no significant differences from the values found in previous samplings (p > 0.05).
3.3 Analysis of sensory parameters
The samples to be evaluated were randomly numbered with four-digit numbers. Each participant blindly evaluated two samples from each group. The panel of evaluators was made up of 26 teaching and non-teaching staff from the Faculty of Veterinary Sciences and students from the Bachelor’s Degree in Food Technology, Faculty of Veterinary Sciences, National University of the Centre of the Province of Buenos Aires program. The rating scale for each attribute ranges from 0 to 9. The average value, SD, and variance coefficient were calculated for each attribute (Table 3). It was observed that the difference in the evaluators’ rating for all descriptors, measured by the value of the coefficient of variance, was less than 0.26, indicating that the responses were “homogeneous.” Figure 7 shows the averages of all descriptors for each experimental condition. No statistically significant differences were found for any attribute (p > 0.05).
Statistical results obtained in CCH and TCH for each attribute valued from 0 to 9. Each participant (n = 26) evaluated 2 samples from each group (CCH and TCH), obtaining 52 responses for each group
| Attribute | CCH | TCH | p value | ||||
|---|---|---|---|---|---|---|---|
| Mean | SD | CV | Mean | SD | CV | ||
| Characteristic (O) | 7.42a | 1.63 | 0.22 | 7.58a | 1.47 | 0.19 | 0.61 |
| Fresh (O) | 7.31a | 1.85 | 0.25 | 7.60a | 1.68 | 0.22 | 0.40 |
| Toasted (O) | 8.63a | 1.03 | 0.12 | 8.83a | 0.47 | 0.05 | 0.22 |
| Smoky (O) | 8.58a | 0.94 | 0.11 | 8.63a | 0.77 | 0.09 | 0.73 |
| Citrusy (O) | 7.98a | 1.46 | 0.18 | 8.27a | 1.01 | 0.12 | 0.24 |
| Gummy (T) | 7.50a | 1.81 | 0.24 | 7.67a | 1.67 | 0.22 | 0.61 |
| Firm (T) | 7.75a | 1.30 | 0.17 | 7.85a | 1.29 | 0.16 | 0.70 |
| Appropriate fibrousness (T) | 7.65a | 1.71 | 0.22 | 7.69a | 2.00 | 0.26 | 0.91 |
| Elastic (T) | 7.88a | 1.29 | 0.16 | 7.88a | 1.20 | 0.15 | 0.75 |
| Compact (T) | 7.85a | 1.60 | 0.20 | 7.75a | 1.53 | 0.20 | 0.75 |
| Own juiciness (T) | 7.17a | 1.49 | 0.21 | 7.38a | 1.46 | 0.20 | 0.46 |
| Spongy (T) | 7.83a | 1.54 | 0.20 | 7.83a | 1.45 | 0.19 | 1.00 |
| Grummy (T) | 8.15a | 1.46 | 0.18 | 7.90a | 1.61 | 0.20 | 0.42 |
| Grainy (T) | 8.08a | 1.47 | 0.18 | 7.94a | 1.62 | 0.20 | 0.64 |
| Pink (C) | 8.15a | 0.98 | 0.12 | 8.35a | 0.76 | 0.09 | 0.26 |
| Brown (C) | 8.42a | 0.98 | 0.12 | 8.44a | 1.45 | 0.17 | 0.93 |
| Red (C) | 8.23a | 1.57 | 0.19 | 8.54a | 1.06 | 0.12 | 0.24 |
| Brown (C) | 8.88a | 0.47 | 0.05 | 8.69a | 1.31 | 0.15 | 0.32 |
CCH: Control Cooked Ham.
TCH: Treated Cooked Ham.
SD: Standard Deviation; CV: Cofficient of Variation.
Lowercase letters (a,b) indicate not significantly different (p > 0.05).
O: odour; T: texture: C: colour.
Colour characteristic of CH stored at 4°C during the useful life
| Time (days) | CCH | TCH |
|---|---|---|
| CIE L * (lightness) | ||
| 0 | 62.36 ± 1.07a | 62.15 ± 0.92a |
| 28 | 64.96 ± 0.91b | 58.28 ± 0.38a |
| 42 | 66.91 ± 1.10b | 58.39 ± 0.15a |
| 84 | 64.20 ± 1.19b | 53.66 ± 1.91a |
| CIE a * (redness) | ||
| 0 | 9.50 ± 0.83a | 10.02 ± 0.42a |
| 28 | 8.87 ± 0.55a | 8.32 ± 0.17a |
| 42 | 8.89 ± 1.70a | 11.70 ± 0.98b |
| 84 | 9.55 ± 0.89a | 10.67 ± 0.01b |
| CIE b * (yellowness) | ||
| 0 | 5.77 ± 0.30a | 5.83 ± 0.84a |
| 28 | 6.81 ± 0.52a | 6.64 ± 0.59a |
| 42 | 6.76 ± 0.07a | 6.09 ± 0.33a |
| 84 | 6.61 ± 0.74a | 5.92 ± 0.57a |
| Chroma | ||
| 0 | 10.99 ± 0.55a | 11.64 ± 0.31a |
| 28 | 11.42 ± 0.29a | 11.67 ± 1.59a |
| 42 | 11.01 ± 0.90a | 13.02 ± 0.18a |
| 84 | 12.18 ± 0.42a | 11.43 ± 0.38a |
CCH: control cooked ham, TCH: treated cooked ham. Different lowercase letters (a, b) indicate significant differences between groups. Values are expressed as mean ± SD (n = 3 per group). The same letter within a file indicates no significant differences between the control and treated groups (p < 0.05).

Sensory profile of CH samples.
4 Discussion
In this study, the physicochemical characterization did not show major modifications between the control and treated samples. The chemical composition of CCH and TCH was consistent with published data [22,23]. The pH reduction obtained in this study due to the application of the L. plantarum LP5 coincides with the results of other studies. According to Blanco-Lizarazo et al. [24], similar final pH values were reached in samples treated with bioprotective cultures. According to the Quality Protocol for CH [1], control and treated samples showed a final pH value slightly lower than the desired value (published value estimated between 5.9 and 6.3). The increase in shear force observed in this study is likely attributed to water loss during the product’s shelf life. These results are consistent with those of Nuñez de Gonzalez et al. [25], who observed an increase in instrumental hardness during the storage of hams. Structural damage studies where myofibrils and connective tissue can be observed would be relevant for this study. According to Tomović et al. [26], colour is one of the most important quality characteristics in CHs. Shahidi and Pegg [27] summarized a series of values for the parameters L* (<58.2), a* (>6.6), and b* (<13.6) that are considered acceptable in CH. The TCH sample had a lower luminosity value and a higher redness value compared to the CCH. The same trend could be recorded visually in which it can be observed that the control sample is brighter and paler compared to the sample treated with the strain under study. The TCH presented values within the normal range for this type of product, while the CCH presented a higher final L* value. The observed variations in colour parameters, specifically the reduction in lightness (L*) and the increase in red intensity (a*) in the treated samples (TCH), may have direct implications for consumer perception. In general, a deeper red hue and reduced paleness in cooked meat products are typically associated with enhanced freshness, superior quality, and lower levels of processing-attributes often positively perceived by consumers. In this study, despite these instrumentally detected differences, the sensory evaluation revealed no statistically significant differences between the groups. These findings suggest that the colour changes induced by the application of L. plantarum LP5 remain within an acceptable range from the consumer’s perspective and do not negatively influence the product sensory acceptance. In fact, they may even contribute to improving the visual perception of CH, although further studies involving trained sensory panels are recommended to confirm this observation.
Researchers have demonstrated a high prevalence of Listeria monocytogenes in ready-to-eat meats, especially pork products, and in the retail market [28]. The same is true for Salmonella, which has been highly reported in many countries [29,30]. However, proper hygiene practices have proven relevant in reducing the level of contamination of carcasses and the slaughterhouse environment, as well as in preventing its spread to pork products [31]. Escherichia coli O157:H7, also listed as a mandatory search pathogen according to the AFC, has been reported at a globally variable but concerning prevalence rate in retail pork samples [32].
Sulphite-reducing anaerobic bacteria are a group associated with Clostridium spp. are normally present in faeces, although in much smaller numbers than E. coli. These microorganisms are usually found in the meat mass of the carcass in a vegetative form and small numbers, generally less than one bacterium per 10 g. These bacterial cells are killed during ordinary cooking and do not pose any special problems. The C. perfringens spores that are indirectly responsible for foodborne illnesses have a diverse origin, and there is no evidence that vegetative forms sporulate in meat [33]. Coagulase-positive Staphylococcus causes staphylococcal food poisoning and is an indicator of the degree of human contact or contact with untreated natural foods of animal origin within a food factory. Controlling outbreaks of Staphylococcal enterotoxin disease depends largely on maintaining food at an appropriate temperature. Staphylococci can multiply exponentially between 6 and 45°C [34]. Meat products typically contain small numbers of Staphylococci, and their handling poses no particular risk because normal handling temperatures are low for their growth (below 10°C) and toxin production (below 20°C, toxin production is slower). In this study, no growth was observed in the analyses performed for the sulphite-reducing anaerobic count or for the coagulase-positive Staphylococcus count in any of the samples collected during the study period. Scientific evidence of the prevalence of C. perfringens and S. aureus in CH is scarce. In the analysis of the yeast and mould count, yeast growth was observed in several samples from both groups (CCH and TCH) in a number higher than the limit allowed by the Argentine food code (103 CFU/g) from day 28 of the study. Towards the end of the study, comparison of the results of both groups showed a lower count in the samples from the TCH. This may be due to environmental contamination, so it is essential to evaluate and control potential contaminating microorganisms that may adhere to various surfaces as biofilms. In this type of food industry, the presence of large volumes of water and organic debris are potential environmental contaminants if an effective sanitation system is not applied. Therefore, it is necessary to understand the development and composition of biofilms in the food industry to delay contamination by preventing biofilm formation and eliminating them [35].
The observed count allowed us to corroborate the viability and stability of the number of probiotic microorganisms in the TCH samples. Barcenilla et al. [34] studied the application of a cocktail of L. lactis, L. paracasei, and L. plantarum, achieving excellent results in controlling the growth of artificially inoculated L. monocytogenes and some relevant spoilage microorganisms, without causing substantial quality losses. These results support the potential of LAB as a preservation strategy in meat products either by competitive exclusion or metabolite production [37,38]. Other studies have shown that the use of biopreservation strategies (lactate and bioprotective cultures) is more effective in reducing the risk of pathogen contamination in CH than other intervention strategies [39]. In contrast, strategies such as high hydrostatic pressure processing applied to pork ham formulations during post-packaging have been highly effective, significantly extending the shelf life of cooked pork ham up to 97 days [24]. The present work reinforces the antimicrobial potential of LAB in meat products, as the treated samples exhibited a clear suppression of both pathogenic and spoilage organisms. This protective effect has been previously documented, with multiple studies highlighting the ability of selected LAB strains to control undesirable microbiota in cooked meats while preserving their sensory attributes. In this context, the surface application of L. plantarum LP5 proved effective in maintaining viable cell populations throughout the storage period and in limiting yeast proliferation relative to control samples. These findings are consistent with earlier reports of enhanced microbial stability and extended shelf life through biopreservation strategies previously discussed. A distinctive aspect of our study lies in the broader scope of microbial analysis, encompassing not only common pathogens but also indicator organisms such as sulphite-reducing anaerobes and coagulase-positive Staphylococcus, offering a more robust evaluation of product safety.
Sensory analysis determined that consumers did not detect any differences between the control samples and those treated with the L. plantarum LP5 potentially probiotic [38]. A similar study, using sensory evaluation, determined a decrease in acidity in vacuum-packed CH artificially inoculated with LAB, but this was not considered unacceptable [36]. This indicates that the application of L. plantarum LP5 would exert a biopreservative or bioretardant effect without altering the product’s sensory attributes.
5 Conclusion
Changes and developments in the pork industry over the years may have triggered new problems and obstacles that hinder pathogen control throughout the food chain. Scientific evidence reinforces the importance of coordinating control measures and monitoring programs to protect pork consumers. The sensory results obtained demonstrated that the application of L. plantarum LP5 to the surface of a piece of CH to extend the product’s shelf life did not affect the organoleptic properties of texture, colour, and aroma. The growing consumer demand for “clean label” foods has stimulated interest in the development of new food preservation techniques. Although no pathogenic bacteria were detected in any sample, the inhibitory capacity of L. plantarum offers a promising alternative for controlling bacterial growth, the subsequent production of bacterial toxins, and biofilm formation, owing to its production of a broad spectrum of antibacterial metabolites and/or competitive exclusion mechanisms previously studied. Future studies will be necessary to evaluate the antagonistic effect against yeasts and other microorganisms. The combined use of L. plantarum LP5 with an effective microorganism could be a synergistic biological control alternative to address this problem.
-
Funding information: This research was funded by the Young Researchers Project (03-JOVIN-104H), accredited under the VI Program of the Secretariat of Science, Art, and Technology (SECAT, UNCPBA), financed by the FCV-UNCPBA (Res. RD 189/23) and directed by María Julia Ruiz.
-
Author contributions: All authors accepted responsibility for the entire contents of this manuscript and gave their consent for submission to the journal. They reviewed all results and approved the final version. MJR designed the experiments. MJR, MIP, MAJ, and JPC carried out the experimental activities. MIP and MAJ performed the statistical analysis of the results. MÁP has managed the link with the company. MV has developed the experimental phase of the project. MJR and AIE prepared the manuscript with contributions from all co-authors.
-
Conflict of interest: Authors state no conflict of interest.
-
Data availability statement: The datasets generated during and/or analysed during the current study are available from the corresponding author on reasonable request.
References
[1] Ministry of Agriculture, Livestock and Fisheries. Caracterización del Mercado Nacional e Internacional de Chacinados y Salazones (CyS) October 2019 [Internet]. Ministry of Agriculture, Livestock and Fisheries; 2019. p. 29. https://alimentosargentinos.magyp.gob.ar/HomeAlimentos/Cadenas%20de%20Valor%20de%20Alimentos%20y%20Bebidas/informes/CyS_Informe_2019_Noviembre.pdf.Search in Google Scholar
[2] Castellano P, Pérez Ibarreche M, Blanco Massani M, Fontana C, Vignolo GM. Strategies for pathogen biocontrol using lactic acid bacteria and their metabolites: a focus on meat ecosystems and industrial environments. Microorganisms. 2017;5(3):38.10.3390/microorganisms5030038Search in Google Scholar PubMed PubMed Central
[3] Di Gioia D, Mazzola G, Nikodinoska I, Aloisio I, Langerholc T, Rossi M, et al. Lactic acid bacteria as protective cultures in fermented pork meat to prevent Clostridium spp. growth. Int J Food Microbiol. 2016;235:53–9.10.1016/j.ijfoodmicro.2016.06.019Search in Google Scholar PubMed
[4] Egan K, Field D, Rea MC, Ross RP, Hill C, Cotter PD. Bacteriocins: Novel solutions to age old spore-related problems? Front Microbiol. 2016 [cited January 2023];7:461, https://www.frontiersin.org/articles/10.3389/fmicb.2016.00461.10.3389/fmicb.2016.00461Search in Google Scholar PubMed PubMed Central
[5] Jones RJ, Hussein HM, Zagorec M, Brightwell G, Tagg JR. Isolation of lactic acid bacteria with inhibitory activity against pathogens and spoilage organisms associated with fresh meat. Food Microbiol. 2008;25(2):228–34.10.1016/j.fm.2007.11.001Search in Google Scholar PubMed
[6] Barbieri F. Bio-preservation and bio-active compounds as sustainable strategies to improve quality and safety of fresh and fermented products. Doctoral thesis. Universidad de Granada; 2023 [cited March 2025]. https://digibug.ugr.es/handle/10481/84463.Search in Google Scholar
[7] Chikindas ML, Weeks R, Drider D, Chistyakov VA, Dicks LM. Functions and emerging applications of bacteriocins. Curr Opin Biotechnol. 2018;49:23–8.10.1016/j.copbio.2017.07.011Search in Google Scholar PubMed PubMed Central
[8] Danielski GM, Imazaki PH, Andrade Cavalari CM, de Daube G, Clinquart A, de Macedo REF. Carnobacterium maltaromaticum as bioprotective culture in vitro and in cooked ham. Meat Sci. 2020;162:108035.10.1016/j.meatsci.2019.108035Search in Google Scholar PubMed
[9] Orihuel A, Terán L, Renaut J, Vignolo GM, De Almeida AM, Saavedra ML, et al. Differential proteomic analysis of lactic acid bacteria – Escherichia coli O157:H7 interaction and its contribution to bioprotection strategies in meat. Front Microbiol. 2018;5(9):1083. https://www.frontiersin.org/articles/10.3389/fmicb.2018.01083.10.3389/fmicb.2018.01083Search in Google Scholar PubMed PubMed Central
[10] Rovira J, Melero B. Protective cultures for the safety of animal-derived foods. In: Di Gioia D, Biavati B, editors. Probiotics and prebiotics in animal health and food safety. Cham: Springer International Publishing; 2018 [cited January 2023]. p. 63–107. 10.1007/978-3-319-71950-4_3.Search in Google Scholar
[11] Benítez-Cabello A, Delgado AM, Quintas C. Main challenges expected from the impact of climate change on microbial biodiversity of table olives: current status and trends. Foods. 2023;12(19):3712.10.3390/foods12193712Search in Google Scholar PubMed PubMed Central
[12] Behera SS, Ray RC, Zdolec N. Lactobacillus plantarum with functional properties: an approach to increase safety and shelf-life of fermented foods. BioMed Res Int. 2018;2018:e9361614.10.1155/2018/9361614Search in Google Scholar PubMed PubMed Central
[13] Seddik HA, Bendali F, Gancel F, Fliss I, Spano G, Drider D. Lactobacillus plantarum and its probiotic and food potentialities. Probiotics Antimicrob Prot. 2017;9(2):111–22.10.1007/s12602-017-9264-zSearch in Google Scholar PubMed
[14] Ruiz MJ, Colello R, Padola NL, Etcheverría AI. Efecto inhibitorio de Lactobacillus spp. sobre bacterias implicadas en enfermedades transmitidas por alimentos. Rev Argent Microbiol. 2017;49(2):174–7.10.1016/j.ram.2016.10.005Search in Google Scholar PubMed
[15] Ruiz MJ, Zbrun MV, Signorini ML, Zimmermann JA, Soto LP, Rosmini MR, et al. In vitro screening and in vivo colonization pilot model of Lactobacillus plantarum LP5 and Campylobacter coli DSPV 458 in mice. Arch Microbiol. 2021;203(7):4161–71.10.1007/s00203-021-02385-5Search in Google Scholar PubMed
[16] Ruiz MJ, García MD, Padola NL, Etcheverría AI. Capacidad de Lactiplantibacillus plantarum de reducir biofilms de bacterias patógenas transmitidas por alimentos. Rev Vet. 2022;33(1):48–52.10.30972/vet.3315879Search in Google Scholar
[17] Ruiz MJ, Sirini NE, Zimmermann JA, Soto LP, Zbrun MV, Sequeira GJ, et al. Capacidad de Lactiplantibacillus plantarum LP5 para inhibir biopelículas de Campylobacter coli. FAVE Sección Cienc Vet. 2022;21:e0002.10.14409/favecv.2022.1.e0002Search in Google Scholar
[18] Argentine Food Code. Meat and related Foods [Internet]. Argentine Food Code. Chapter VI. Meat and related Foods. Art 286 bis–(Res Conjunta SPReI N°178/2012 y SAGyP N° 714/2012). 2012. https://www.argentina.gob.ar/sites/default/files/capitulo_vi_carneos_res_conj_21-2023_actualiz_2024-5.pdf.Search in Google Scholar
[19] Galvis Góez RD, Ramírez Vásquez NF, Giraldo Mejía Á. Extracción, cuantificación y distribución de las principales fracciones lipídicas en pequeñas biopsias de hígado de vacas en el periodo de transición. CES Med Vet Zootec. 2016;11(1):26–38.10.21615/cesmvz.11.1.3Search in Google Scholar
[20] Bujalance C, Jiménez-Valera M, Moreno E, Ruiz-Bravo A. A selective differential medium for Lactobacillus plantarum. J Microbiol Methods. 2006;66(3):572–5.10.1016/j.mimet.2006.02.005Search in Google Scholar PubMed
[21] Sogari G, Caputo V, Joshua Petterson A, Mora C, Boukid F. A sensory study on consumer valuation for plant-based meat alternatives: What is liked and disliked the most? Food Res Int. 2023;169:112813.10.1016/j.foodres.2023.112813Search in Google Scholar PubMed
[22] Barretto TL, Pollonio MAR, Telis-Romero J, da Silva Barretto AC. Improving sensory acceptance and physicochemical properties by ultrasound application to restructured cooked ham with salt (NaCl) reduction. Meat Sci. 2018;145:55–62.10.1016/j.meatsci.2018.05.023Search in Google Scholar PubMed
[23] Talens P, Mora L, Morsy N, Barbin DF, ElMasry G, Sun DW. Prediction of water and protein contents and quality classification of Spanish cooked ham using NIR hyperspectral imaging. J Food Eng. 2013;117(3):272–80.10.1016/j.jfoodeng.2013.03.014Search in Google Scholar
[24] Blanco-Lizarazo CM, Sierra-Cadavid A, Ospina-E JC. Application of physical, chemical, and biological preservation strategies and their effect on the shelf life of different types of cooked hams. J Food Process Eng. 2024;47(1):e14514.10.1111/jfpe.14514Search in Google Scholar
[25] Nuñez de Gonzalez MT, Hafley BS, Boleman RM, Miller RM, Rhee KS, Keeton JT. Qualitative effects of fresh and dried plum ingredients on vacuum-packaged, sliced hams. Meat Sci. 2009;83(1):74–81.10.1016/j.meatsci.2009.04.002Search in Google Scholar PubMed
[26] Tomović VM, Jokanović MR, Petrović LS, Tomović MS, Tasić TA, Ikonić PM, et al. Sensory, physical and chemical characteristics of cooked ham manufactured from rapidly chilled and earlier deboned M. semimembranosus. Meat Sci. 2013;93(1):46–52.10.1016/j.meatsci.2012.07.015Search in Google Scholar PubMed
[27] Shahidi F, Pegg RB. Nitrite-free meat curing systems: Update and review. Food Chem. 1992;43(3):185–91.10.1016/0308-8146(92)90171-WSearch in Google Scholar
[28] Cavalcanti AAC, Limeira CH, Siqueira IN, de Lima AC, de Medeiros FJP, de Souza JG, et al. The prevalence of Listeria monocytogenes in meat products in Brazil: A systematic literature review and meta-analysis. Res Vet Sci. 2022;145:169–76.10.1016/j.rvsc.2022.02.015Search in Google Scholar PubMed
[29] Castrica M, Andoni E, Intraina I, Curone G, Copelotti E, Massacci FR, et al. Prevalence of Listeria monocytogenes and Salmonella spp. in different ready to eat foods from large retailers and canteens over a 2-year period in Northern Italy. Int J Environ Res Public Health. 2021;18(20):10568.10.3390/ijerph182010568Search in Google Scholar PubMed PubMed Central
[30] Jaramillo-Bedoya E, Flórez-Elvira LJ, Ocampo-Ibáñez ID. High prevalence of Salmonella spp. in ready-to-eat artisanal pork sausages sold at food outlets in Quindío, Colombia. Pathogens. 2025;14(1):31.10.3390/pathogens14010031Search in Google Scholar PubMed PubMed Central
[31] Soliani L, Rugna G, Prosperi A, Chiapponi C, Luppi A. Salmonella infection in pigs: Disease, prevalence, and a link between swine and human health. Pathogens. 2023;12(10):1267.10.3390/pathogens12101267Search in Google Scholar PubMed PubMed Central
[32] Haque M, Bosilevac JM, Chaves BD. A review of Shiga-toxin producing Escherichia coli (STEC) contamination in the raw pork production chain. Int J Food Microbiol. 2022;377:109832.10.1016/j.ijfoodmicro.2022.109832Search in Google Scholar PubMed
[33] Salinas PAA, Valles MNV, Sevilla WHS, Huamán AV. Clostridium perfringens sulfito reductores en hamburguesas que se comercializan en mercados de la ciudad de Trujillo, Perú. REBIOL. 2013 [cited march 2025];33(1):1–5. https://revistas.unitru.edu.pe/index.php/facccbiol/article/view/170.Search in Google Scholar
[34] Barcenilla C, Puente A, Cobo-Díaz JF, Alexa EA, Garcia-Gutierrez E, O’Connor PM, et al. Selection of lactic acid bacteria as biopreservation agents and optimization of their application for the control of Listeria monocytogenes in ready-to-eat cooked meat products. Int J Food Microbiol. 2023;403:110341.Search in Google Scholar
[35] Nikolaev Y, Yushina Y, Mardanov A, Gruzdev E, Tikhonova E, El-Registan G, et al. Microbial biofilms at meat-processing plant as possible places of bacteria survival. Microorganisms. 2022;10(8):1583.10.3390/microorganisms10081583Search in Google Scholar PubMed PubMed Central
[36] Barcenilla C, Puente A, Cobo-Díaz JF, Alexa EA, Garcia-Gutierrez E, O’Connor PM, et al. Selection of lactic acid bacteria as biopreservation agents and optimization of their mode of application for the control of Listeria monocytogenes in ready-to-eat cooked meat products. Int J Food Microbiol. 2023;403:110341.10.1016/j.ijfoodmicro.2023.110341Search in Google Scholar PubMed
[37] Lahiri D, Nag M, Sarkar T, Ray RR, Shariati MA, Rebezov M, et al. Lactic acid bacteria (LAB): Autochthonous and probiotic microbes for meat preservation and fortification. Foods. 2022;11(18):2792.10.3390/foods11182792Search in Google Scholar PubMed PubMed Central
[38] Ruiz MJ, García MD, Canalejo LMM, Krüger A, Padola NL, Etcheverría AI. Antimicrobial activity of Lactiplantibacillus plantarum against shiga toxin-producing Escherichia coli. J Appl Microbiol. 2023;134(9):lxad202.10.1093/jambio/lxad202Search in Google Scholar PubMed
[39] Serra-Castelló C, Bover-Cid S, Jofré A, Lindqvist R. Impact of intervention strategies on listeriosis risk in cooked ham: Biopreservation and high pressure processing. Int J Food Microbiol. 2025;435:111174.10.1016/j.ijfoodmicro.2025.111174Search in Google Scholar PubMed
© 2025 the author(s), published by De Gruyter
This work is licensed under the Creative Commons Attribution 4.0 International License.
Articles in the same Issue
- Research Articles
- Optimization of sustainable corn–cattle integration in Gorontalo Province using goal programming
- Competitiveness of Indonesia’s nutmeg in global market
- Toward sustainable bioproducts from lignocellulosic biomass: Influence of chemical pretreatments on liquefied walnut shells
- Efficacy of Betaproteobacteria-based insecticides for managing whitefly, Bemisia tabaci (Hemiptera: Aleyrodidae), on cucumber plants
- Assessment of nutrition status of pineapple plants during ratoon season using diagnosis and recommendation integrated system
- Nutritional value and consumer assessment of 12 avocado crosses between cvs. Hass × Pionero
- The lacked access to beef in the low-income region: An evidence from the eastern part of Indonesia
- Comparison of milk consumption habits across two European countries: Pilot study in Portugal and France
- Antioxidant responses of black glutinous rice to drought and salinity stresses at different growth stages
- Differential efficacy of salicylic acid-induced resistance against bacterial blight caused by Xanthomonas oryzae pv. oryzae in rice genotypes
- Yield and vegetation index of different maize varieties and nitrogen doses under normal irrigation
- Urbanization and forecast possibilities of land use changes by 2050: New evidence in Ho Chi Minh city, Vietnam
- Organizational-economic efficiency of raspberry farming – case study of Kosovo
- Application of nitrogen-fixing purple non-sulfur bacteria in improving nitrogen uptake, growth, and yield of rice grown on extremely saline soil under greenhouse conditions
- Digital motivation, knowledge, and skills: Pathways to adaptive millennial farmers
- Investigation of biological characteristics of fruit development and physiological disorders of Musang King durian (Durio zibethinus Murr.)
- Enhancing rice yield and farmer welfare: Overcoming barriers to IPB 3S rice adoption in Indonesia
- Simulation model to realize soybean self-sufficiency and food security in Indonesia: A system dynamic approach
- Gender, empowerment, and rural sustainable development: A case study of crab business integration
- Metagenomic and metabolomic analyses of bacterial communities in short mackerel (Rastrelliger brachysoma) under storage conditions and inoculation of the histamine-producing bacterium
- Fostering women’s engagement in good agricultural practices within oil palm smallholdings: Evaluating the role of partnerships
- Increasing nitrogen use efficiency by reducing ammonia and nitrate losses from tomato production in Kabul, Afghanistan
- Physiological activities and yield of yacon potato are affected by soil water availability
- Vulnerability context due to COVID-19 and El Nino: Case study of poultry farming in South Sulawesi, Indonesia
- Wheat freshness recognition leveraging Gramian angular field and attention-augmented resnet
- Suggestions for promoting SOC storage within the carbon farming framework: Analyzing the INFOSOLO database
- Optimization of hot foam applications for thermal weed control in perennial crops and open-field vegetables
- Toxicity evaluation of metsulfuron-methyl, nicosulfuron, and methoxyfenozide as pesticides in Indonesia
- Fermentation parameters and nutritional value of silages from fodder mallow (Malva verticillata L.), white sweet clover (Melilotus albus Medik.), and their mixtures
- Five models and ten predictors for energy costs on farms in the European Union
- Effect of silvopastoral systems with integrated forest species from the Peruvian tropics on the soil chemical properties
- Transforming food systems in Semarang City, Indonesia: A short food supply chain model
- Understanding farmers’ behavior toward risk management practices and financial access: Evidence from chili farms in West Java, Indonesia
- Optimization of mixed botanical insecticides from Azadirachta indica and Calophyllum soulattri against Spodoptera frugiperda using response surface methodology
- Mapping socio-economic vulnerability and conflict in oil palm cultivation: A case study from West Papua, Indonesia
- Exploring rice consumption patterns and carbohydrate source diversification among the Indonesian community in Hungary
- Determinants of rice consumer lexicographic preferences in South Sulawesi Province, Indonesia
- Effect on growth and meat quality of weaned piglets and finishing pigs when hops (Humulus lupulus) are added to their rations
- Healthy motivations for food consumption in 16 countries
- The agriculture specialization through the lens of PESTLE analysis
- Combined application of chitosan-boron and chitosan-silicon nano-fertilizers with soybean protein hydrolysate to enhance rice growth and yield
- Stability and adaptability analyses to identify suitable high-yielding maize hybrids using PBSTAT-GE
- Phosphate-solubilizing bacteria-mediated rock phosphate utilization with poultry manure enhances soil nutrient dynamics and maize growth in semi-arid soil
- Factors impacting on purchasing decision of organic food in developing countries: A systematic review
- Influence of flowering plants in maize crop on the interaction network of Tetragonula laeviceps colonies
- Bacillus subtilis 34 and water-retaining polymer reduce Meloidogyne javanica damage in tomato plants under water stress
- Vachellia tortilis leaf meal improves antioxidant activity and colour stability of broiler meat
- Evaluating the competitiveness of leading coffee-producing nations: A comparative advantage analysis across coffee product categories
- Application of Lactiplantibacillus plantarum LP5 in vacuum-packaged cooked ham as a bioprotective culture
- Evaluation of tomato hybrid lines adapted to lowland
- South African commercial livestock farmers’ adaptation and coping strategies for agricultural drought
- Spatial analysis of desertification-sensitive areas in arid conditions based on modified MEDALUS approach and geospatial techniques
- Meta-analysis of the effect garlic (Allium sativum) on productive performance, egg quality, and lipid profiles in laying quails
- Optimizing carrageenan–citric acid synergy in mango gummies using response surface methodology
- The strategic role of agricultural vocational training in sustainable local food systems
- Agricultural planning grounded in regional rainfall patterns in the Colombian Orinoquia: An essential step for advancing climate-adapted and sustainable agriculture
- Perspectives of master’s graduates on organic agriculture: A Portuguese case study
- Developing a behavioral model to predict eco-friendly packaging use among millennials
- Government support during COVID-19 for vulnerable households in Central Vietnam
- Citric acid–modified coconut shell biochar mitigates saline–alkaline stress in Solanum lycopersicum L. by modulating enzyme activity in the plant and soil
- Herbal extracts: For green control of citrus Huanglongbing
- Research on the impact of insurance policies on the welfare effects of pork producers and consumers: Evidence from China
- Investigating the susceptibility and resistance barley (Hordeum vulgare L.) cultivars against the Russian wheat aphid (Diuraphis noxia)
- Characterization of promising enterobacterial strains for silver nanoparticle synthesis and enhancement of product yields under optimal conditions
- Testing thawed rumen fluid to assess in vitro degradability and its link to phytochemical and fibre contents in selected herbs and spices
- Protein and iron enrichment on functional chicken sausage using plant-based natural resources
- Fruit and vegetable intake among Nigerian University students: patterns, preferences, and influencing factors
- Bioprospecting a plant growth-promoting and biocontrol bacterium isolated from wheat (Triticum turgidum subsp. durum) in the Yaqui Valley, Mexico: Paenibacillus sp. strain TSM33
- Quantifying urban expansion and agricultural land conversion using spatial indices: evidence from the Red River Delta, Vietnam
- LEADER approach and sustainability overview in European countries
- Influence of visible light wavelengths on bioactive compounds and GABA contents in barley sprouts
- Assessing Albania’s readiness for the European Union-aligned organic agriculture expansion: a mixed-methods SWOT analysis integrating policy, market, and farmer perspectives
- Genetically modified foods’ questionable contribution to food security: exploring South African consumers’ knowledge and familiarity
- The role of global actors in the sustainability of upstream–downstream integration in the silk agribusiness
- Multidimensional sustainability assessment of smallholder dairy cattle farming systems post-foot and mouth disease outbreak in East Java, Indonesia: a Rapdairy approach
- Enhancing azoxystrobin efficacy against Pythium aphanidermatum rot using agricultural adjuvants
- Review Articles
- Reference dietary patterns in Portugal: Mediterranean diet vs Atlantic diet
- Evaluating the nutritional, therapeutic, and economic potential of Tetragonia decumbens Mill.: A promising wild leafy vegetable for bio-saline agriculture in South Africa
- A review on apple cultivation in Morocco: Current situation and future prospects
- Quercus acorns as a component of human dietary patterns
- CRISPR/Cas-based detection systems – emerging tools for plant pathology
- Short Communications
- An analysis of consumer behavior regarding green product purchases in Semarang, Indonesia: The use of SEM-PLS and the AIDA model
- Effect of NaOH concentration on production of Na-CMC derived from pineapple waste collected from local society