Metagenomic and metabolomic analyses of bacterial communities in short mackerel (Rastrelliger brachysoma) under storage conditions and inoculation of the histamine-producing bacterium
-
Pongrawee Nimnoi


Abstract
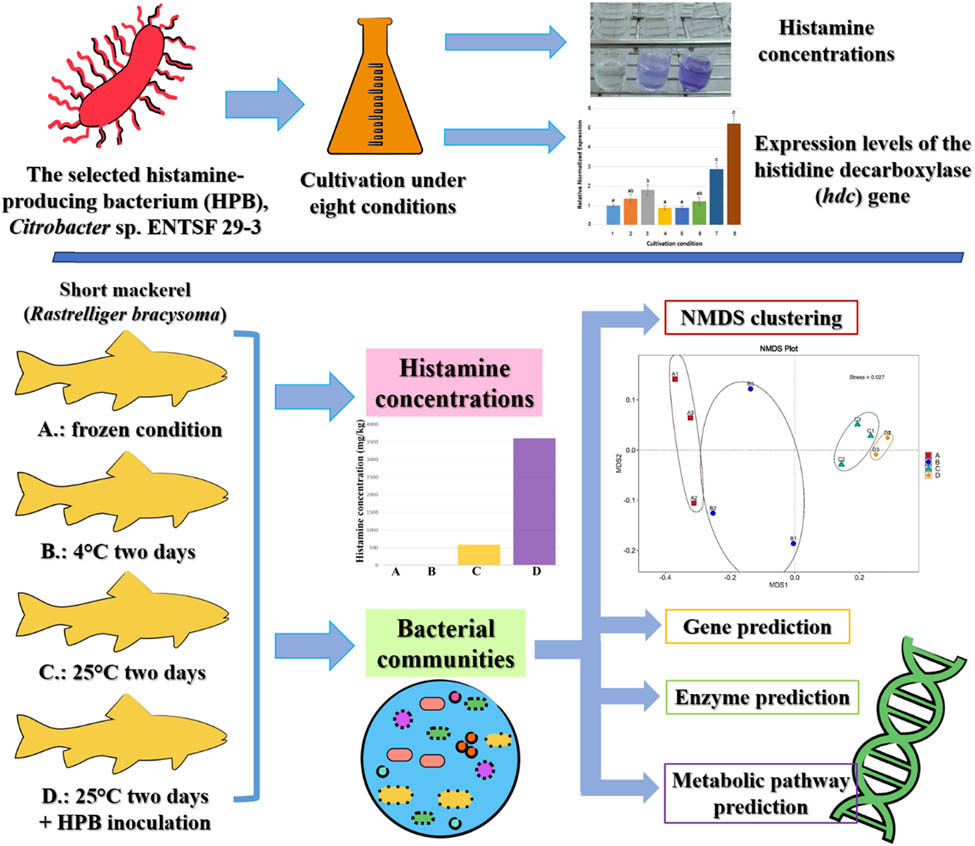
The 69 enterobacterial strains were evaluated for histamine synthesis in which 40.6% were positive. The effects of factors on the histamine synthesis and histidine decarboxylase (hdc) gene expression of Citrobacter sp. ENTSF 29-3 were evaluated. Static condition and 0.2% potassium sorbate contributed to positive and negative effects on the histamine concentration, respectively. pH values (5.5, 6.5, and 7.5), temperatures (15 and 37°C), 5% inulin, and 5% NaCl did not significantly affect histamine concentration. Based on a quantitative real-time PCR analysis, static condition, 5% NaCl, and pH 5.5 upregulated the hdc gene expression, in decreasing order. The storage of short mackerel (Rastrelliger brachysoma) at 25°C for 2 days and at 25°C for 2 days after inoculation of the histamine-producing bacterium (HPB) resulted in the histamine synthesis and altered the bacterial community. High-throughput sequencing of the 16S rRNA gene clarified that the predominant bacterial phyla in short mackerel under different storage conditions were Proteobacteria (40.17–97.40%), Firmicutes (1.31–30.40%), and Bacteroidota (0.66–9.72%). Bacterial diversity decreased, while bacterial dominance and the gamma-Proteobacteria abundance increased under the conditions in which histamine was synthesized. The storage at 25°C for 2 days conferred increases in abundance of the families Enterobacteriaceae, Defluviicoccaceae, and Wohlfahrtiimonadaceae. The principal component analysis plots regarding the predicted genes, enzymes, and metabolic pathways illustrated that the bacterial communities of short mackerel from the original frozen condition and the storage at 4°C for 2 days were overlapped, while that from the storage at 25°C for 2 days and the HPB inoculation were unique.
Graphical abstract
Source: Created by Authors.
1 Introduction
Histamine (2-(4-imidazolyl) ethylamine, C5H9N3) (PubChem compound identifier [CID] no. 774) is most toxic among biogenic amines, which are low-molecular-weight nitrogen compounds. Histamine is synthesized from decarboxylation of an amino acid, histidine. Histidine decarboxylase (HDC, EC 4.1.1.22) is an enzyme crucial to histamine synthesis by histamine-producing bacterium (HPB) [1]. Bacterial HDC is categorized into two families. One family found in Gram-negative bacteria requires pyridoxal 5′-phosphate as a co-factor. The other family found in Gram-positive bacteria requires a pyruvoyl moiety for its mechanism [2].
Histamine is commonly present in seafood and their processed products [3]. Consumption of fishes containing high levels of histamine causes scombrotoxin fish poisoning (SFP) or histamine poisoning, a common seafood-borne illness [4]. SFP is commonly associated with fishes belonging to the Scombridae family (such as mackerel, tuna, bonito, and saury) due to high levels of histidine in their muscle tissues [3,5]. The SPF appearance is triggered by histamine at concentrations around or over 100 mg/100 g [5]. The SPF symptoms include facial flushing, facial rash, hives, sweating, dry mouth, burning-peppery taste sensation, lightheadedness, dizziness, headache, edema, vomiting, diarrhea, abdominal pain, palpitations, wheezing, and unconsciousness [5,6].
Histamine synthesis by HPB has been reported to be affected by several factors such as pH, temperature, as well as concentrations of NaCl and histidine. Histidine at a concentration of 0.1 mM triggered histamine synthesis by Lactobacillus vaginalis, and the maximum synthesis occurred at pH 4.0 and 5.0 [7]. Histamine synthesis by Klebsiella pneumoniae and Raoultella ornithinolytica was maximum at pH 7.0 and 6.0–8.0, respectively [8]. The most optimal condition for histamine synthesis by Tetragenococcus halophilus was a combination of pH 6.0, 50°C, 1% histidine, and 25% NaCl [9]. Among HPB, enterobacteria are frequently distributed in a variety of seafood [10]. Enterobacteria, which belong to the families Enterobacteriaceae, Budviciaceae, Erwiniaceae, Hafniaceae, Morganellaceae, Pectobacteriaceae, and Yersiniaceae [11], have been found as dominant HPB in seafood including fresh fishes and fish products [3,10,12].
The hdc gene responsible for HDC synthesis has been detected in several enterobacterial genera such as Citrobacter, Enterobacter, Erwinia, Hafnia, Klebsiella, Morganella, Proteus, Providencia, Serratia, and Raoultella [13,14,15,16,17]. The hdc gene expression has been found to depend on several factors, although varying among bacterial species. Histidine is a gene inducer, as observed in Lactobacillus buchneri, Lactobacillus hilgardii, Lactobacillus reuteri, Oenococcus oeni, Pediococcus parvulus, Photobacterium damselae, and Streptococcus thermophilus [18,19,20,21,22]. In contrast, the hdc gene in Photobacterium phosphoreum was constitutively expressed regardless of histidine [23]. The hdc gene expression in three lactic acid bacteria, namely, L. hilgardii, O. oeni, and P. parvulus, was diminished by histamine, glucose, fructose, malic acid, and citric acid [20]. The hdc gene expression in P. damselae was elevated at low pH values [19] while it was pH-independent in L. hilgardii, O. oeni, P. parvulus, P. phosphoreum, and S. thermophilus [18,23,24]. Maximum expression occurred during exponential growth phase in L. hilgardii, O. oeni, and P. parvulus [20] and during stationary growth phase in S. thermophilus [18].
Bacterial community is crucial to seafood hygiene in many aspects such as spoilage and food quantity and safety. In this study, we explored the bacterial communities in short mackerel (Rastrelliger brachysoma) with regard to histamine synthesis due to its importance as a commercially valuable marine fish in the Gulf of Thailand countries, which include Thailand, Cambodia, Viet Nam, and Malaysia [25], and its association with SFP [3,5]. Furthermore, metagenomic and metabolomic analyses can provide massive data for better understanding bacterial ecology and may be helpful for seafood preservation. Therefore, this study was conducted to (1) survey HPB among enterobacterial genera, (2) study factors influencing the histamine synthesis and hdc gene expression of the HPB strain, (3) explore the bacterial communities in short mackerel under storage conditions and HPB inoculation, and (4) analyze the alteration of bacterial metabolic pathway in response to synthesized histamine. This is the first report providing metagenomic and metabolomic aspects of the bacterial communities in a marine fish in response to histamine content.
2 Materials and methods
2.1 Measurement of histamine concentrations synthesized by enterobacterial strains
Histamine synthesis by 69 enterobacterial strains was screened following the method of Wauters et al. [26]. All these strains were isolated from seafood in Thailand and identified into genus level by 16S rRNA sequence analysis, and some of them were identified into species level by the VITEK 2 system [27,28]. The strains belonged to eight enterobacterial genera, including Enterobacter (35 strains), Citrobacter (14 strains), Providencia (11 strains), Klebsiella (three strains), Morganella (two strains), Yersinia (two strains), Hafnia (one strain), and Serratia (one strain). After bacterial inoculation and cultivation, purple and yellow colors of histidine broth indicated positive and negative results of histamine synthesis, respectively. The positive strains were subjected to histamine concentration measurement following the method of Sumner and Taylor [29]. Histamine concentration was calculated by a standard curve constructed from reactions with histamine at concentrations of 0–10 mM.
2.2 Detection and nucleotide sequencing of the hdc gene in enterobacterial strains
The presence of hdc gene was examined in 69 enterobacterial strains by a polymerase chain reaction (PCR). A pair of primers hdc-f (5′-TCH ATY ARY AAC TGY GGT GAC TGG RG-3′) and hdc-r (5′-CCC ACA KCA TBA RWG GDG TRT GRC C-3′) was used. The PCR condition consisted of an initial denaturation (94°C for 4 min), 35 cycles of a denaturation (94°C for 1 min), an annealing (58°C for 1 min), and an extension (72°C for 1 min), and a final extension (72°C for 4 min) [30]. The PCR product with a size of 709 bp was determined by electrophoresis on 1% agarose gel. The PCR product was eluted from an agarose gel using a QIAquick gel extraction kit (Qiagen, Inc., Valencia, CA, USA). The nucleotide sequence analysis of PCR product was performed by ATGC Co. Ltd. (Pathumthani, Thailand). The nucleotide sequence was pairwise-aligned with reference sequences in order to obtain an identity percentage using the BLASTN program available on the website of the National Center for Biotechnology Information (NCBI) (https://blast.ncbi.nlm.nih.gov/Blast.cgi).
2.3 Examination on factors affecting the histamine synthesis by the HPB strain
The HPB strain, which synthesized the highest concentration of histamine and possessed the hdc gene, was selected. The HPB strain was inoculated in histidine broth at an initial concentration of 105 colony-forming unit (CFU)/mL and cultivated under the tested conditions. Eight cultivation conditions listed in Table 1 varied in terms of pH medium, temperature, supplement, and aeration. Histamine concentration was determined as mentioned earlier.
Histamine concentrations synthesized by the HPB strain, Citrobacter sp. ENTSF 29-3, under various cultivation conditions
| No. | Cultivation condition of the HPB strain, Citrobacter sp. ENTSF 29-3 | Histamine concentration (mM)* | |||
|---|---|---|---|---|---|
| pH medium | Temperature (°C) | Supplement | Aeration by shaking | ||
| 1. (control condition) | 6.5 | 37 | None | ✓ | 4.84 ± 0.18b** |
| 2. | 6.5 | 15 | None | ✓ | 4.80 ± 0.15ab |
| 3. | 5.5 | 37 | None | ✓ | 4.71 ± 0.12ab |
| 4. | 7.5 | 37 | None | ✓ | 4.67 ± 0.16ab |
| 5. | 6.5 | 37 | 0.2% potassium sorbate | ✓ | 4.41 ± 0.13a |
| 6. | 6.5 | 37 | 5% inulin | ✓ | 4.58 ± 0.08ab |
| 7. | 6.5 | 37 | 5% NaCl | ✓ | 4.93 ± 0.14b |
| 8. | 6.5 | 37 | None | None | 5.44 ± 0.18c |
*Values are presented as mean values from triplicate samples ± standard deviations. **Values with the same letters are not significantly different (p > 0.05) according to Tukey’s test.
2.4 Examination on factors affecting the hdc gene expression of the HPB strain
The hdc gene expression in the HPB strain was quantified using a quantitative real-time PCR (qRT-PCR). A pair of specific primers for partial amplification of the hdc gene in qRT-PCR experiments was designed using the Primer-BLAST program of the NCBI (https://www.ncbi.nlm.nih.gov/tools/primer-blast/). A pair of primers recA-f (5′ TTA AAC AGG CCG AAT TCC AG 3′) and recA-r (5′ CCG CTT TCT CAA TCA GCT TC 3′) was used for partial amplification of the housekeeping gene, recA (recombinase A), which was a reference gene in gene expression normalization [31]. A qRT-PCR was carried out as described by Nimnoi and Pongsilp [32]. Total RNA of the HPB culture cultivated under each condition was extracted using an RNeasy mini kit (Qiagen, Inc., Valencia, CA, USA). The RNA quantity and quality were determined photometrically at 260, 280, and 230 nm using a NanoDrop 2000C spectrophotometer (Thermo Scientific, Waltham, MA, USA). RNA integrity was determined by 1% agarose gel electrophoresis. RNA was diluted in nuclease and protease-free water (Apsalagen Co., Ltd., Bangkok, Thailand) to obtain a concentration of 10 ng/µL. RNA template in an amount of 50 ng was used to synthesize complementary DNA (cDNA) with an IScriptTM Reverse Transcription Supermix for qRT-PCR (Bio-Rad Laboratories, Hercules, CA, USA). The qRT-PCR was performed with a qPCRBIO SyGreen 1-step detect Lo-Rox (PCR Biosystems Ltd, London, UK) in a CFX ConnectTM real-time PCR detection system (Bio-Rad Laboratories, Hercules, CA, USA). The qRT-PCR condition consisted of an initial denaturation (95°C for 3 min) and 39 cycles of a denaturation (95°C for 10 s) and an annealing coupled with extension (60°C for 30 s). Fluorescence acquisition was performed at the completion of each extension step. Melting curve measurement was performed after the completion of cycling.
2.5 Measurement of histamine concentrations in short mackerel under storage conditions and HPB inoculation
Short mackerel was collected from a fresh market in Mueang District, Nakhon Pathom Province of Thailand. No ethical approval was required for seafood sold in a market. Short mackerel was prepared under four conditions: (A) the original frozen condition at −20°C, (B) the storage at 4°C for 2 days, (C) the storage at 25°C for 2 days, and (D) the storage at 25°C for 2 days after the HPB inoculation at an initial concentration of 105 CFU/g. Histamine concentration in fish tissue was analyzed by the in-house method TE-CH-288 [33].
2.6 Assessment of the bacterial communities in short mackerel under storage conditions and HPB inoculation
To explore the bacterial community through Illumina next-generation sequencing, total bacterial DNA was extracted from fish tissue using a DNeasy mericon food kit (Qiagen, Inc., Valencia, CA, USA). The DNA quantity and quality were determined using a DS-11FX + spectrofluorometer (DeNovix, Wilmington, DE, USA). The V4 variable region of the 16S rRNA gene was amplified using a pair of primers, 515F and 806R, linked to the barcodes [34,35] and Phusion high-fidelity PCR master mix (New England Biolabs, Ipswich, MA, USA). The PCR product was purified using a QIAquick gel extraction kit (Qiagen, Inc., Valencia, CA, USA). The amplified DNA library was constructed with a TruSeq DNA PCR-free sample preparation kit (Illumina, San Diego, CA, USA) and analyzed with a HiSeq2500 PE250 sequencing platform (Illumina, San Diego, CA, USA). Negative control (reaction without DNA template) was carried out along with amplification and sequencing. Data of raw sequence reads were converted to fastq files.
The FLASH software version 1.2.11 (https://ccb.jhu.edu/software/FLASH/) [36] was employed for assembly of paired-end raw sequence reads. The FASTP software version 0.20.1 (https://github.com/OpenGene/fastp) [37] was employed for quality filtering of the raw tags to select the high-quality clean tags. The VSEARCH software version 2.21.1 (https://github.com/torognes/vsearch/releases) [38] was employed to detect and remove the chimera sequences from the screened tags to select the eventual effective tags. The QIIME2 software version 2021.4 (https://forum.qiime2.org/) [39] was employed to denoise the effective tags. The effective tags, whose sequence abundance was less than five, were excluded to select the final amplicon sequence variables (ASVs). The Classify-sklearn module in the QIIME2 software version 2021.4 was employed to compare the ASVs with the sequences available in the SILVA SSU rRNA database (https://www.arb-silva.de/) [40] for species annotation of each ASV. The eventual ASV data have been deposited into the Sequence Read Archive of the NCBI under BioProject accession no. PRJNA1081585 (https://www.ncbi.nlm.nih.gov/nuccore/?term=PRJNA1081585).
The QIIME2 software version 2021.4 [39] was availed to compute the parameters relative to alpha diversity, which included community diversity (Shannon–Weaver and Simpson’s indices), community richness (Chao1 and number of observed species), index of sequencing depth (the Good’s coverage), and dominance as well as beta diversity for quantifying sample variation in species complexity. The R software version 3.5.1 (https://www.R-project.org/) [41] was used to display the analyzed data. Principal coordinate analysis (PCoA) and non-metric multi-dimensional scaling (NMDS) were performed to arrange complex, encompassed data, which were further displayed by the Ade4 and ggplot2 packages available in the R software version 3.5.1 (https://www.R-project.org/) [41]. The QIIME2 software version 2021.4 [39] was employed to operate the nonparametric multivariate variance test according to distance matrix (ADONIS) and the analysis of similarity (ANOSIM) for analyzing the significance of community structure among groups. Linear discriminant analysis (LDA) effect size (LEfSe) algorithm that is accompanied in the LEfSe software version 1.1.0 (https://huttenhower.sph.harvard.edu/lefse/) [42] was applied to identify the bacterial groups whose abundance was different among samples. The PICRUSt2 software version 2.5.0 (https://github.com/picrust/picrust2) [43] was employed to analyze the metagenomic data for the identification of genes, enzymes, and metabolic pathways using the information in the Kyoto Encyclopedia of Genes and Genomes (KEGG) (https://www.genome.jp/kegg/) and MetaCyC (https://metacyc.org/) databases. Principal component analysis (PCA) was performed to display the clusterings of predicted genes, enzymes, and metabolic pathways among different samples. Alpha and beta diversity indices as well as the top ten most abundant bacterial classes were included in the analysis of variance using Tukey’s test of the SPSS software version 19.0 (IBM Corp., Chicago, IL, USA). All data analyses were performed with three replicate samples.
3 Results
3.1 Histamine concentrations synthesized by enterobacterial strains
According to the method of Wauters et al. [26], the return to purple color of histidine broth supplemented with bromocresol purple as a pH indicator indicates histamine synthesis. A total of 40.6% of the enterobacterial strains (28 out of 69) were primarily screened as HPB. The HPB genera included Enterobacter (16 strains), Providencia (five strains), Citrobacter (four strains), Klebsiella (one strain), Morganella (one strain), and Serratia (one strain). These 28 HPB strains were confirmed for their ability to synthesize histamine by the method of Sumner and Taylor [29]. Histamine concentrations synthesized by HPB strains ranged from 1.17 ± 0.04 to 5.18 ± 0.46 mM in which the highest concentration was obtained from Citrobacter sp. ENTSF 29-3.
3.2 Presence of the hdc gene in enterobacterial strains
Among 69 enterobacterial strains, PCR products of the hdc gene were amplified from three strains. The nucleotide sequences of the PCR products from Citrobacter sp. ENTSF 1-3, Citrobacter sp. ENTSF 29-3, and Morganella morganii SFTCBS1 shared the maximum identities with the hdc gene sequences of Klebsiella aerogenes (GenBank accession no. CP011539) (99.28% identity), K. aerogenes (GenBank accession no. CP070520) (99.71% identity), and M. morganii (GenBank accession no. FJ469559) (99.15% identity), respectively. The nucleotide sequences of the hdc gene from three enterobacterial strains were deposited in the NCBI database under GenBank accession nos PP793741–PP793743.
3.3 Factors affecting the histamine synthesis by the HPB strain
Citrobacter sp. ENTSF 29-3, which synthesized the highest concentration of histamine and possessed the hdc gene, was selected for examining the influence of cultivation conditions on the histamine synthesis. The histamine concentrations synthesized under various cultivation conditions are presented in Table 1. Static condition (condition 8) contributed to the significantly highest concentration of histamine. The histamine concentrations were not significantly different among conditions with different pH values (5.5, 6.5, and 7.5; conditions 3, 1, and 4, respectively) and between conditions with different temperatures (15 and 37°C; conditions 2 and 1, respectively). Among three supplements, 0.2% potassium sorbate significantly decreased the histamine concentration, while 5% inulin and 5% NaCl had no significant effect on the histamine concentration, as compared to the control condition (condition 1), which was without a supplement.
3.4 Factors affecting the hdc gene expression of the HPB strain
The hdc gene expression of the HPB strain, Citrobacter sp. ENTSF 29-3, was quantified using a qRT-PCR. The hdc gene nucleotide sequence of the strain (GenBank accession no. PP793742) was employed to design a pair of specific primers for qRT-PCR experiments. A pair of designed primers hdcRT-f (5′-GCC ATC CCA TCA TTT TCG CC-3′) and hdcRT-r (5′-CCG GAA ACG CCA ATC GAA TC-3′) generated the RT-PCR product of 214 bp in size. Expression levels of the hdc gene under various cultivation conditions were determined by normalizing to the recA gene, which was reported as the most suitable internal reference gene [31]. The relative normalized gene expression levels under various cultivation conditions are compared in Figure 1. Static condition, 5% NaCl, and pH 5.5 (conditions 8, 7, and 3, respectively) upregulated the hdc gene expression, in decreasing order, as compared to the control condition (condition 1). On the other hand, the hdc gene expression levels were not significantly different among all other conditions (conditions 1, 2, 4, 5, and 6). The hdc gene expression was statistically equal between two pH values (6.5 and 7.5) and two temperatures (15 and 37°C). Two supplements, 0.2% potassium sorbate and 5% inulin, had no effect on the hdc gene expression.
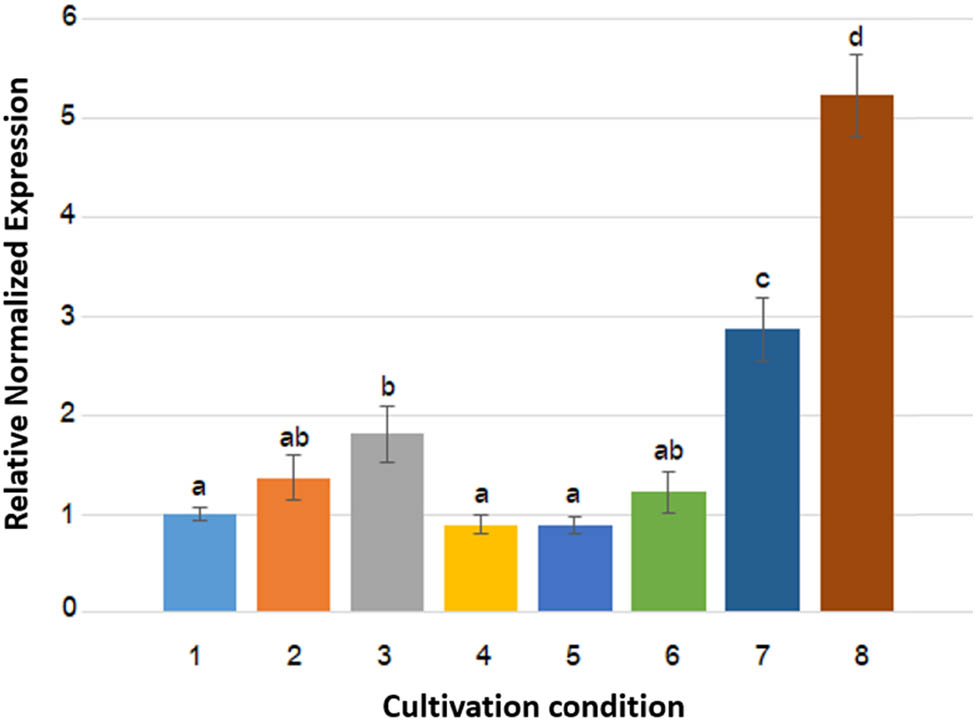
Relative gene expression levels of the hdc gene of the HPB strain, Citrobacter sp. ENTSF 29-3, under various cultivation conditions. Graph bars are presented as mean values from three experiments. Error bars indicate standard deviations. Graph bars with the same letters are not significantly different (p > 0.05) according to Tukey’s test. Numbers 1–8 on the X-axis refer to the cultivation conditions that are in accordance with those in Table 1.
3.5 Histamine concentrations in short mackerel under storage conditions and HPB inoculation
Histamine concentrations in short mackerel under four storage conditions are presented in Table 2. Histamine was undetectable under the original frozen condition (condition A) and the storage at 4°C for 2 days (condition B), while it was synthesized under the storage at 25°C for 2 days (condition C) and the storage at 25°C for 2 days after HPB inoculation (condition D).
Histamine concentrations in short mackerel under storage conditions and HPB inoculation
| Storage condition | Histamine concentration in short mackerel (mg/kg)* |
|---|---|
| A. The original frozen condition | Undetectable |
| B. The storage at 4°C for 2 days | Undetectable |
| C. The storage at 25°C for 2 days | 590.43 ± 246.52 |
| D. The storage at 25°C for 2 days after inoculation of the HPB strain, Citrobacter sp. ENTSF 29-3 | 3602.21 ± 26.47 |
*Values are presented as mean values from triplicate samples ± standard deviations.
3.6 Diversity and richness indices of the bacterial communities in short mackerel under storage conditions and HPB inoculation
A total of 1,903,481 raw reads derived from 12 DNA samples (three replicates/storage condition) were subjected to tag merge and sequence quality control, resulting in a total of 1,598,027 qualified tags (83.95% of raw reads). A total of 1,367,362 effective tags were remained after the removal of potential chimera tags from qualified tags by the VSEARCH software. Denoising the effective tags by the QIIME2 software and dismissing the sequences whose abundance was less than five yielded a total of 4,594 ASVs from all samples, with a mean Good’s coverage of 99.75 ± 0.00%.
The Venn diagram (Figure 2) illustrates the numbers of common, overlapping, and unique ASVs among four storage conditions. There were 240 common ASVs among all storage conditions. Condition A (the original frozen condition) had the highest number of unique ASVs (1,751 ASVs), followed by conditions B (the storage at 4°C for 2 days; 927 ASVs), C (the storage at 25°C for 2 days; 364 ASVs), and D (the storage at 25°C for 2 days after the HPB inoculation; 68 ASVs). When comparing the number of common ASVs among pairs of conditions, an AB pair shared the highest number of common ASVs of 1,152, followed by a BC pair (908 ASVs), an AC pair (851 ASVs), an AD pair (291 ASVs), a BD pair (278 ASVs), and a CD pair (261 ASVs).
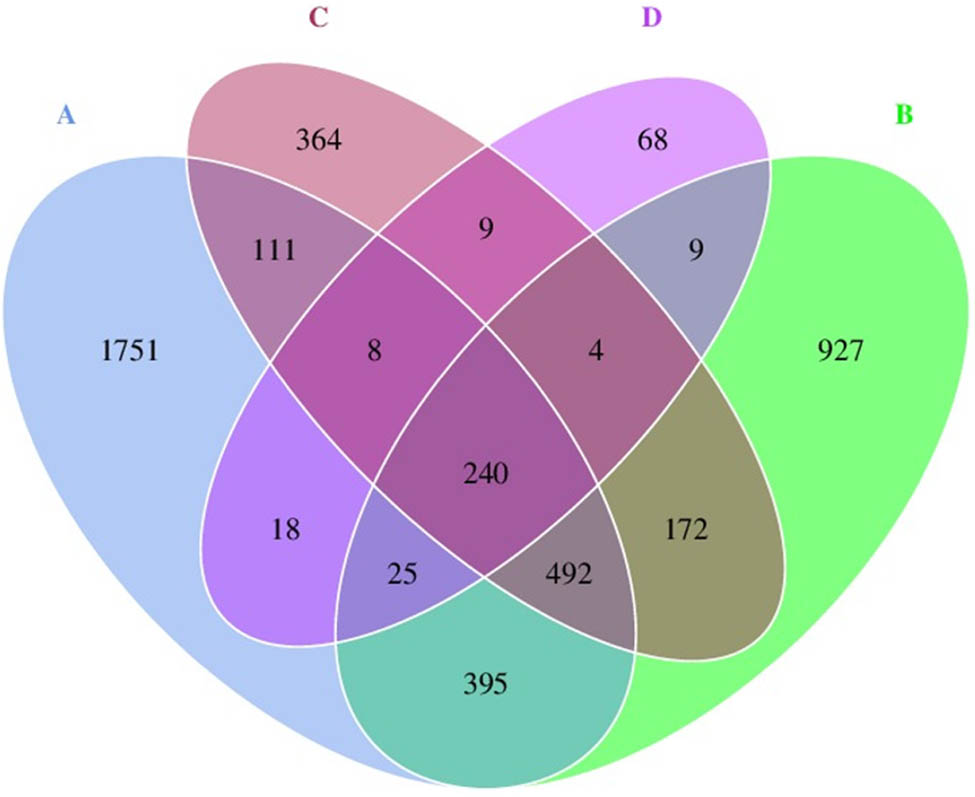
Venn diagram presenting the number of common, overlapping, and unique ASVs among storage conditions. The condition codes (A–D) are in accordance with those in Table 2.
In addition, the parameters relating to alpha diversity, including community diversity (Shannon–Weaver and Simpson’s indices), community richness (Chao1 and number of observed species), and dominance, are presented in Table 3. Higher Shannon–Weaver and Simpson’s indices denote greater bacterial diversity. The results show that Shannon–Weaver and Simpson’s indices of storage conditions A and B were significantly higher than those of the other conditions. It is interpreted that conditions A and B exhibited the significantly highest bacterial diversity, while condition D had the significantly lowest bacterial diversity according to its Simpson’s index value. Bacterial richness indices (Chao1 and number of observed species) of conditions A, B, and C were not significantly different. These indices of conditions C and D were not significantly different to each other. It is interpreted from these indices that conditions A and B exhibited the highest bacterial richness, which was significantly different from that of condition D. Condition D had the significantly highest dominance. Conditions C and D significantly decreased the bacterial diversity but only condition D significantly decreased the bacterial richness, as compared to those of conditions A and B. The results suggest that synthesized histamine suppressed the growth of some groups of bacterial normal flora in short mackerel.
Diversity and richness indices of the bacterial communities in short mackerel under storage conditions and HPB inoculation
| Storage condition | Diversity indices* | Richness indices* | Dominance* | ||
|---|---|---|---|---|---|
| Shannon–Weaver | Simpson’s | Chao1 | Number of observed species | ||
| A | 7.42 ± 0.47b** | 0.96 ± 0.02c | 1467.11 ± 246.11b | 1434.00 ± 229.48b | 0.04 ± 0.02a |
| B | 7.28 ± 1.95b | 0.94 ± 0.06c | 1162.26 ± 423.38b | 1128.00 ± 428.54b | 0.06 ± 0.05a |
| C | 3.66 ± 1.83a | 0.65 ± 0.18b | 784.38 ± 418.60ab | 739.33 ± 401.97ab | 0.34 ± 0.18b |
| D | 0.53 ± 0.38a | 0.08 ± 0.06a | 211.52 ± 91.98a | 196.00 ± 93.43a | 0.91 ± 0.06c |
*Values are presented as mean values from triplicate samples ± standard deviations. **Values with the same letters in the column are not significantly different (p > 0.05) according to Tukey’s test. The condition codes (A–D) are in accordance with those in Table 2.
3.7 Compositions of the bacterial communities in short mackerel under storage conditions and HPB inoculation
Among the top ten most abundant bacterial phyla present in short mackerel from all storage conditions, the Proteobacteria was most abundant with proportions ranging between 40.17 and 97.40%, followed by Firmicutes (1.31–30.40%), Bacteroidota (0.66–9.72%), Actinobacteriota (0.14–2.42%), Cyanobacteria (0.08–2.34%), Chloroflexi (0.05–0.97%), Desulfobacterota (0.03–0.96%), Planctomycetota (0.08–0.76%), Myxococcota (0.03–0.76%), and Acidobacteriota (0.01–0.70%). The top ten most abundant bacterial classes present in short mackerel from all storage conditions are listed in Table 4. When comparing among conditions, the two classes with highest percentages in condition A were the Clostridia, whose percentage was significantly higher than that in condition D, and the Cyanobacteria, whose percentage was not significantly different than that in all other conditions. The percentage of the gamma-Proteobacteria was estimated being the lowest in condition A, in which it was significantly lower than that in conditions C and D. Even though the percentages of seven classes, including Bacilli, Bacteroidia, alpha-Proteobacteria, Actinobacteria, Anaerolineae, Negativicutes, and Polyangia, were highest in condition B, they were not significantly higher than those in at least one of other conditions. Condition C had the lowest percentage of the Anaerolineae, although it was not significantly different from that in all other conditions. In contrast to condition A or B, condition D had the highest percentage of the gamma-Proteobacteria and the lowest percentages of Bacilli, Clostridia, Bacteroidia, alpha-Proteobacteria, Cyanobacteria, Actinobacteria, Negativicutes, and Polyangia. When comparing conditions with and without synthesized histamine, it is noted that synthesized histamine was positively associated with a significant increase in the gamma-Proteobacteria percentage.
Prevalence percentages of the top ten most abundant bacterial classes present in short mackerel under storage conditions and HPB inoculation
| Bacterial class | Prevalence percentage in each condition* | |||
|---|---|---|---|---|
| A | B | C | D | |
| Gamma-Proteobacteria | 35.89 ± 8.44a** | 38.02 ± 13.08a | 82.89 ± 13.49b | 97.08 ± 2.11b |
| Bacilli | 12.24 ± 3.74bc | 18.06 ± 6.67c | 4.14 ± 3.10ab | 0.66 ± 1.58a |
| Clostridia | 13.33 ± 7.35b | 11.54 ± 5.60ab | 3.48 ± 2.41ab | 0.62 ± 0.54a |
| Bacteroidia | 8.37 ± 1.05ab | 9.16 ± 6.04b | 1.92 ± 1.36ab | 0.62 ± 0.50a |
| Alpha-Proteobacteria | 4.81 ± 1.65a | 5.35 ± 2.71a | 2.79 ± 2.71a | 0.31 ± 0.27a |
| Cyanobacteria | 2.33 ± 0.58a | 2.18 ± 1.67a | 0.23 ± 0.18a | 0.08 ± 0.10a |
| Actinobacteria | 1.73 ± 0.75a | 1.79 ± 1.11a | 0.50 ± 0.40a | 0.12 ± 0.11a |
| Anaerolineae | 0.57 ± 0.16a | 0.75 ± 0.47a | 0.32 ± 0.31a | 0.41 ± 0.02a |
| Negativicutes | 0.62 ± 0.22a | 0.65 ± 0.52a | 0.13 ± 0.10a | 0.02 ± 0.02a |
| Polyangia | 0.42 ± 0.18ab | 0.70 ± 0.31b | 0.32 ± 0.34ab | 0.03 ± 0.00a |
*Values are presented as mean values from triplicate samples ± standard deviations. **Values with the same letters in the row are not significantly different (p > 0.05) according to Tukey’s test. The condition codes (A–D) are in accordance with those in Table 2.
The distribution and relative abundance of bacterial families among all storage conditions are displayed in a heat map chart (Figure 3), in which the colors signify the abundance levels. The color shades ranging from deep blue into yellow, brown, and red symbolize the abundance levels, from lowest to highest. Cyanobiaceae, Vibrionaceae, Tannerellaceae, Monoglobaceae, Xanthomonadaceae, Erysipelotrichaceae, Eubacterium, Bacteroidaceae, and Thiotrichaceae were predominant in condition A. Planococcaceae, Vagococcaceae, Staphylococcaceae, Rhodobacteraceae, Muribaculaceae, Prevotellaceae, Peptostreptococcaceae, Rhodocyclaceae, Morganellaceae, Saprospiraceae, and Rhodanobacteraceae were more abundant in condition B. Enterobacteriaceae, Defluviicoccaceae, and Wohlfahrtiimonadaceae became more common in condition C, suggesting that synthesized histamine in short mackerel contributed to the increases in their proportions. Condition D had the Enterobacteriaceae as the sole and dramatically highest abundant family due to the HPB inoculation.
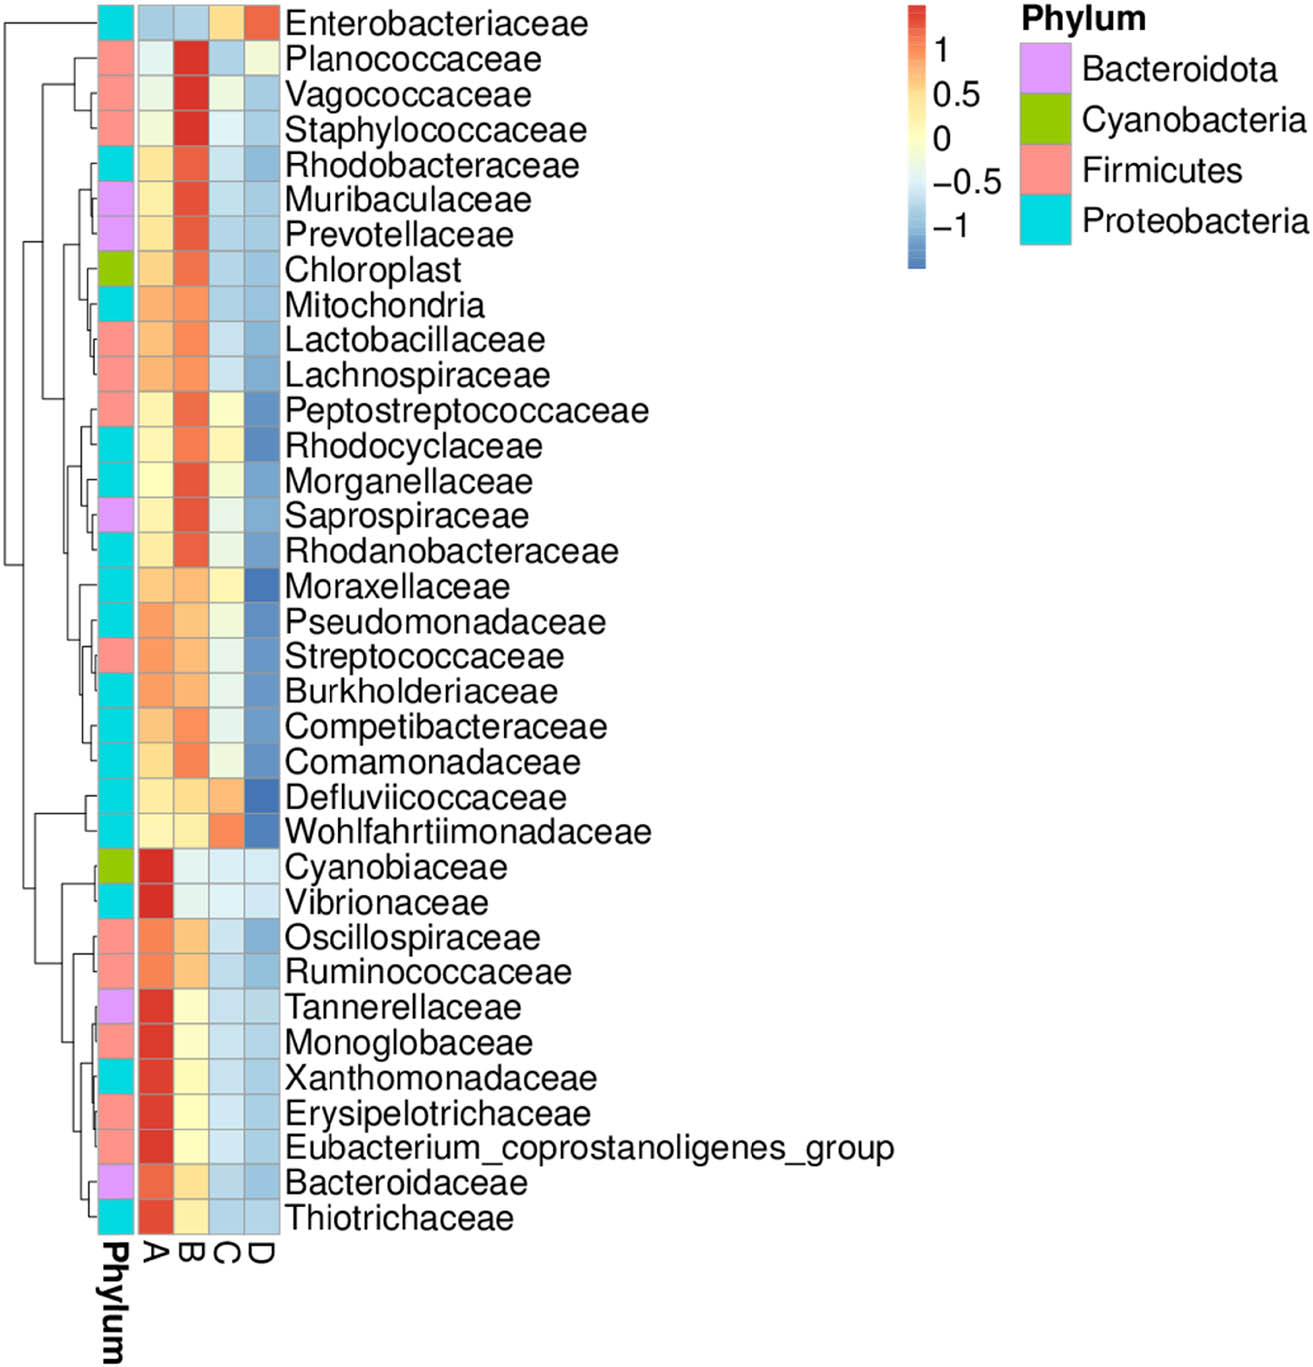
Heat map chart displaying bacterial families’ distribution and abundance in short mackerel under storage conditions and HPB inoculation. The condition codes (A–D) are in accordance with those in Table 2.
A biomarker analysis was conducted to access a finer evaluation of the unique bacterial community characteristic in short mackerel from each storage condition. The LDA scores computed from a biomarker analysis represented significant differences in the abundance of bacterial taxonomic ranks among conditions (Figure 4). The genera Faecalibaculum and Monoglobus were significantly more abundant in condition A. The genera Macrococcus and Lactobacillus were significantly more abundant in condition B. Condition C had no any bacterial taxon whose abundance was significantly higher than that in all other conditions. The family Enterobacteriaceae was a sole biomarker existing in condition D.
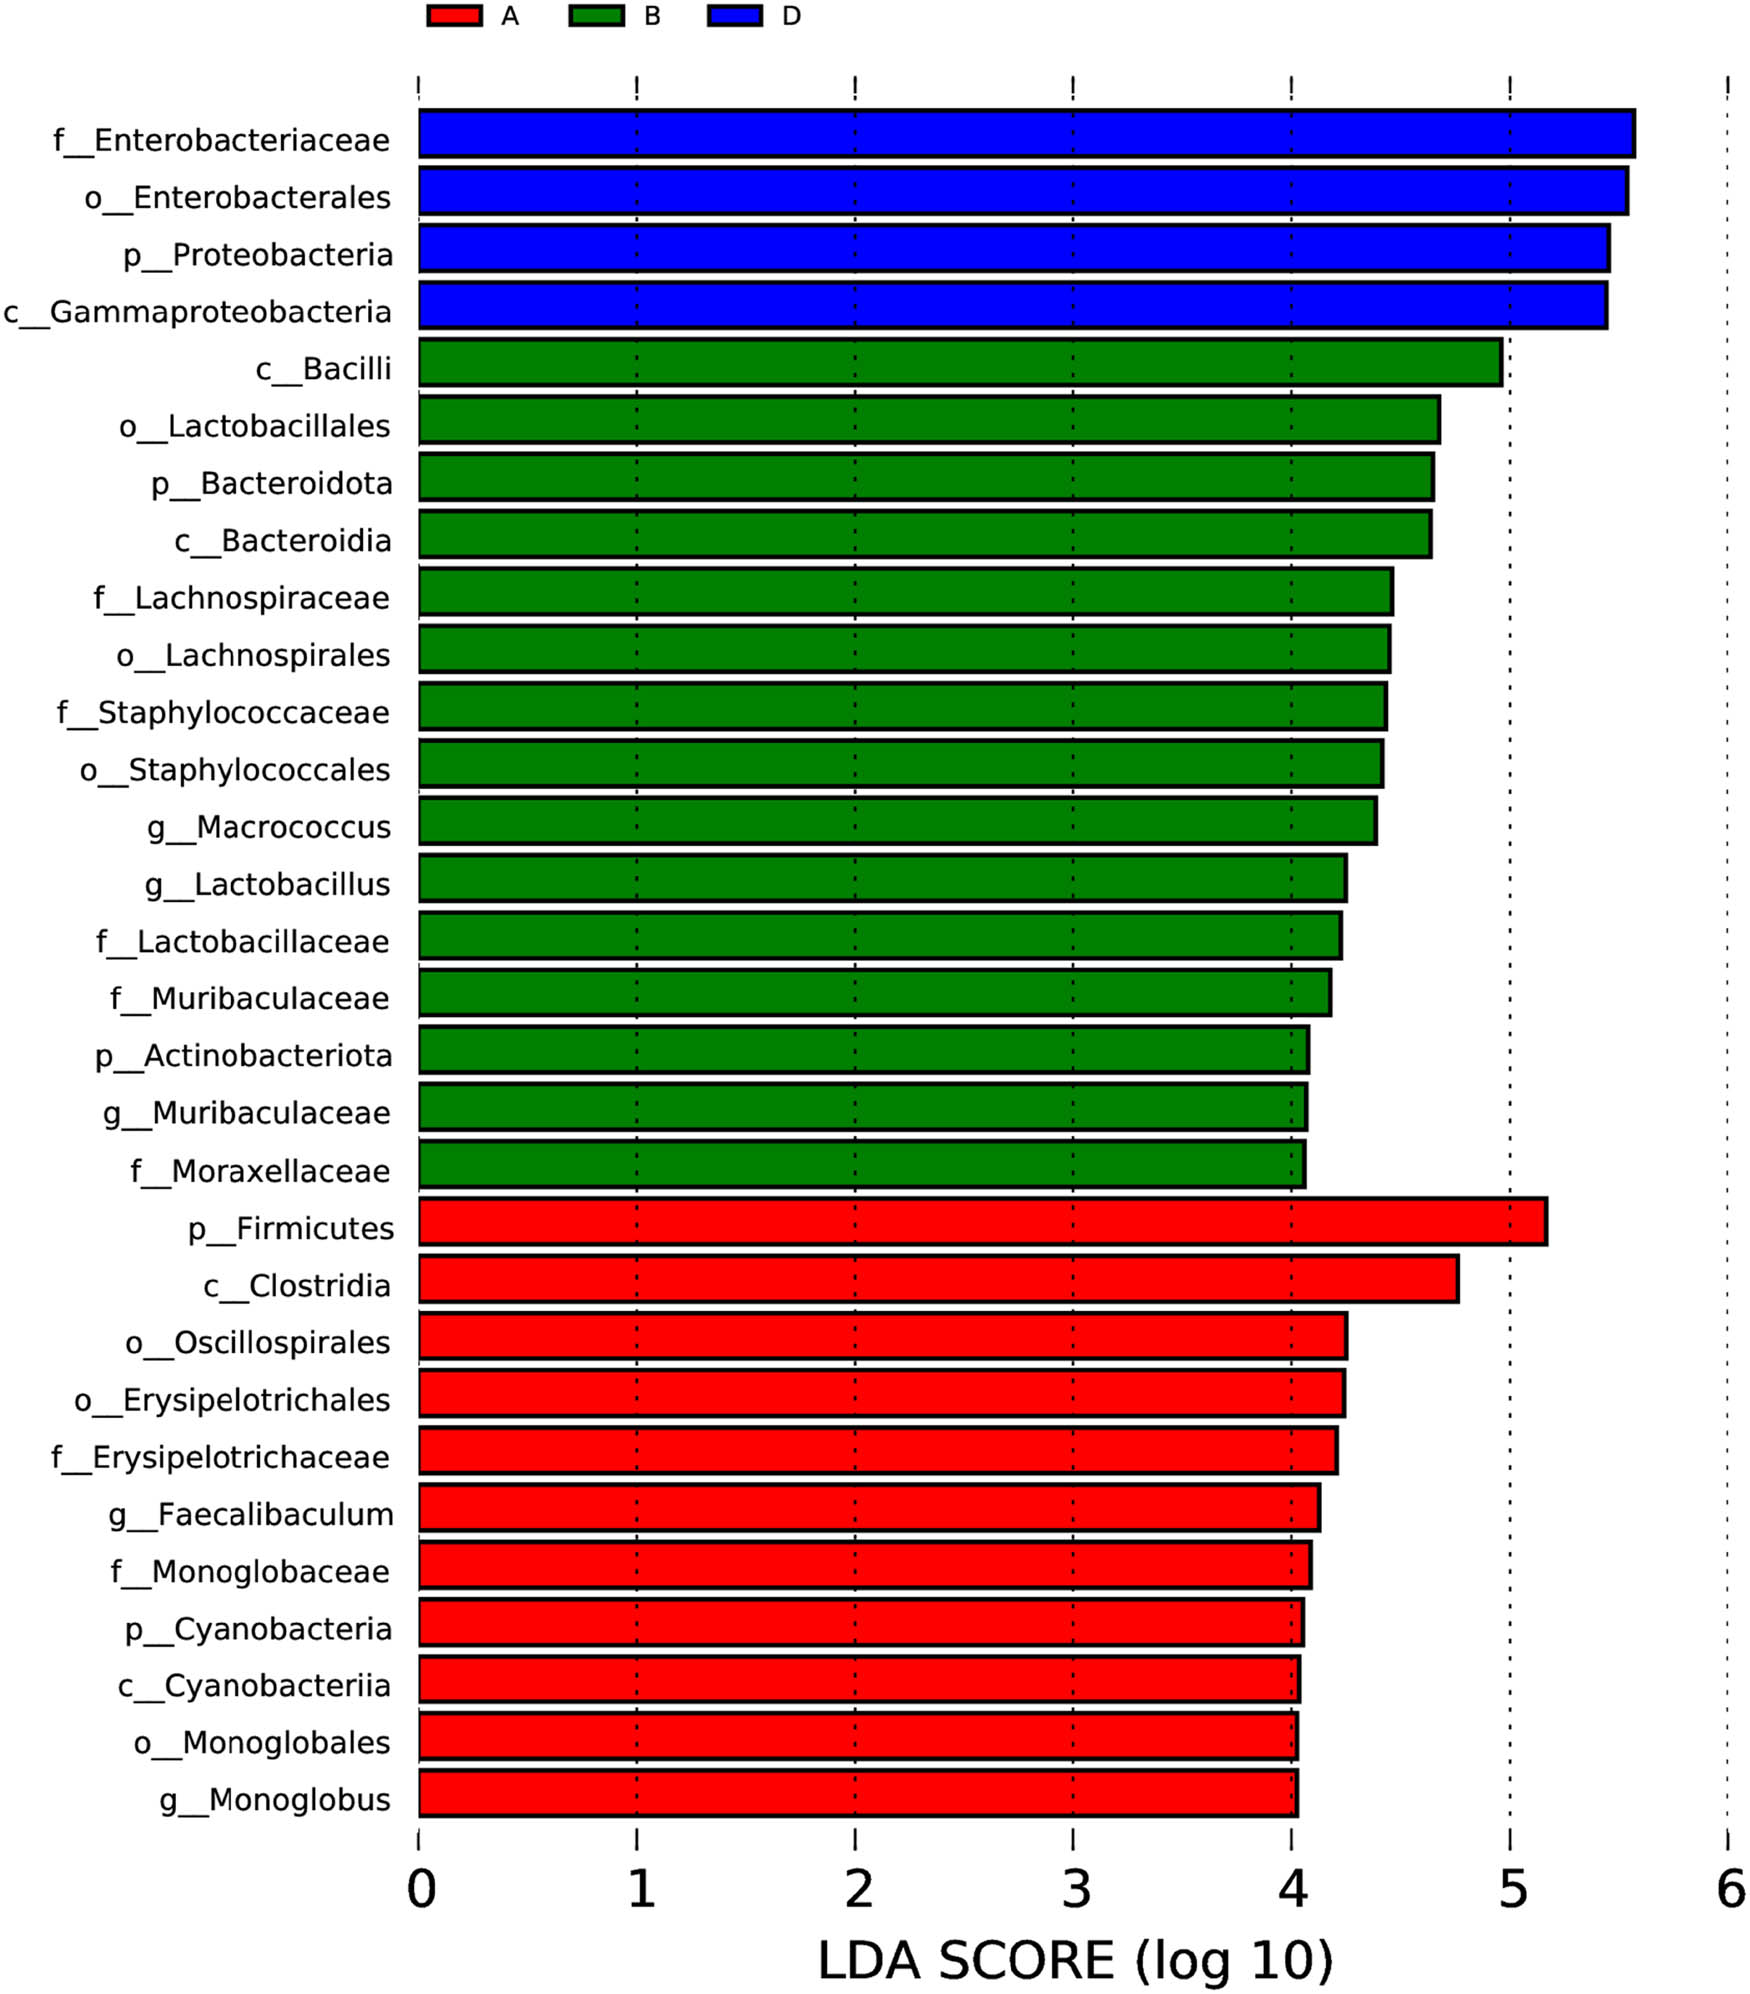
Histogram of LDA scores for the evaluation of bacterial biomarkers whose abundance was significantly different among storage conditions. The condition codes (A–D) are in accordance with those in Table 2.
The ADONIS method for displaying the significance of bacterial community among samples revealed that the bacterial community structures were significant among storage conditions (R 2 = 0.491; p = 0.002). The ANOSIM output additionally confirmed that the variations of intergroup bacterial community structure were larger than those of the inner-group (R = 1, p = 0.00). The bacterial community structures of conditions A and B were most similar to each other (R = 0.18) and dissimilar to that of conditions C (R = 1) and D (R = 1). The bacterial community structure of condition B was more similar to that of condition C (R = 0.70) than to that of condition D (R = 0.88). A similarity heat map (Figure 5) displays the differences in bacterial community between pairs of samples from all storage conditions. The circle with larger size and deeper blue color signifies the greater difference between a pair of samples. Among pairs of conditions, a CD pair was the one having the most similarity in bacterial community, followed by an AB pair. In contrast, AD and BD pairs exhibited the most differences in bacterial community.
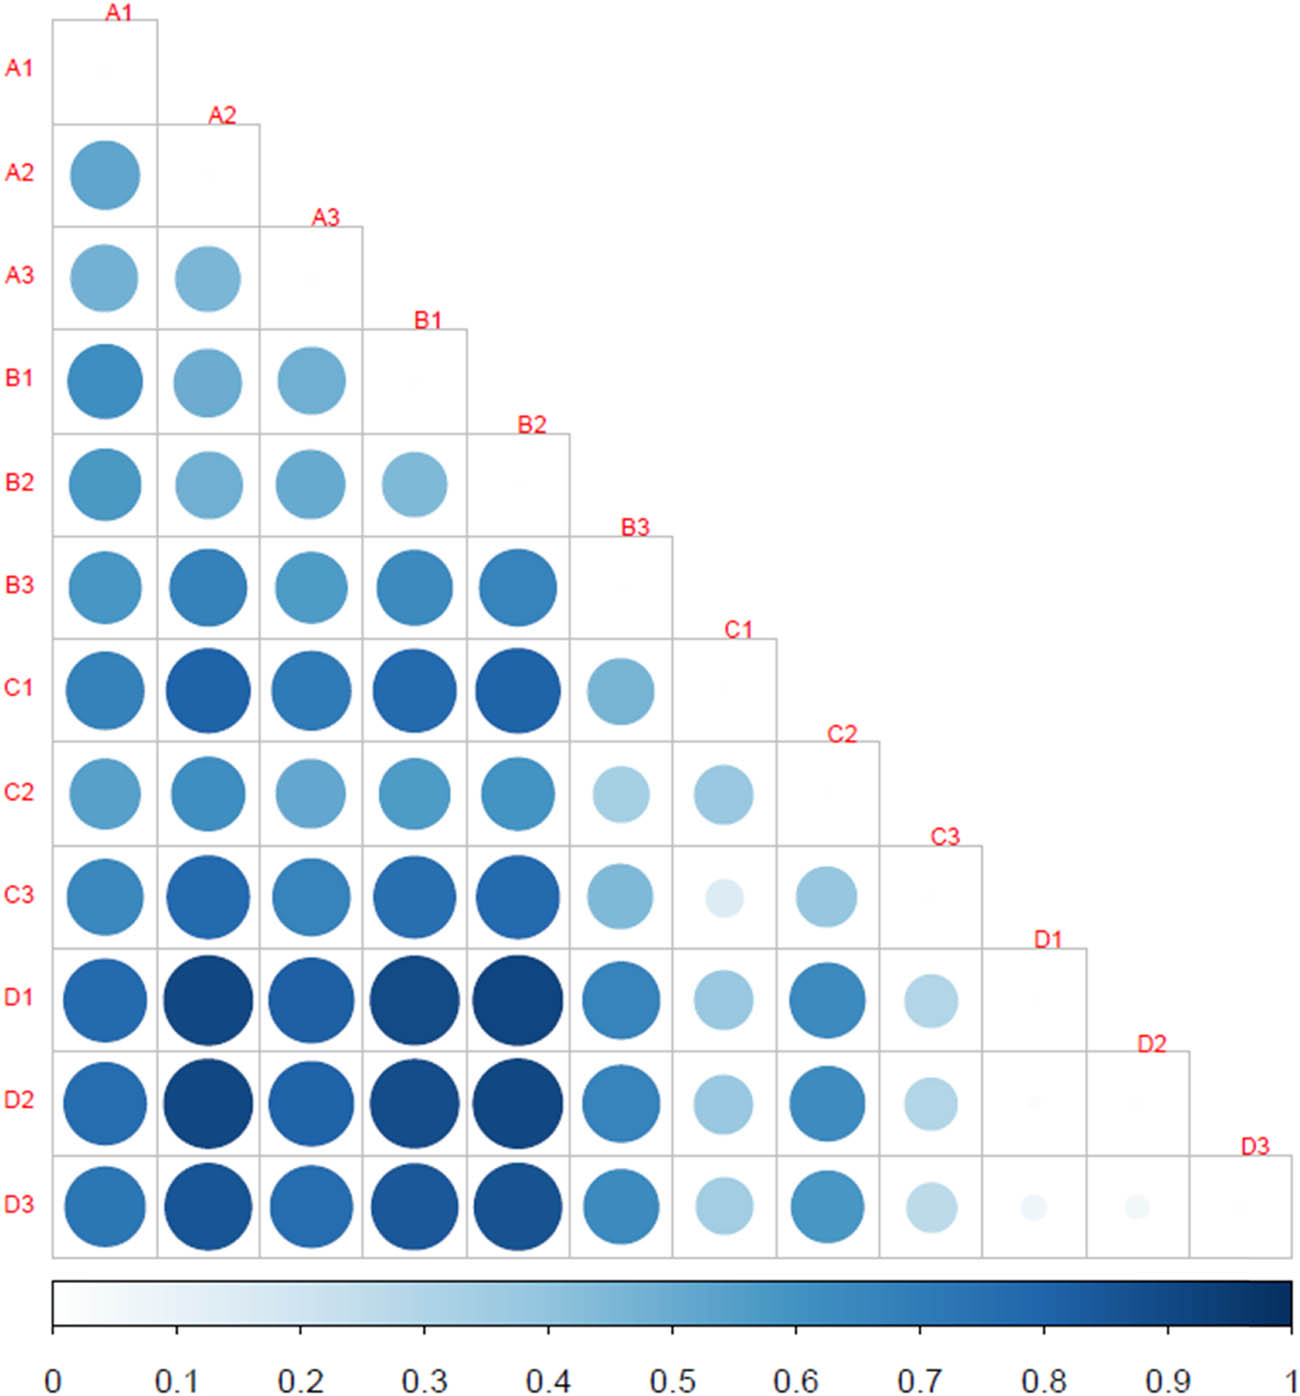
Similarity heat map displaying the differences in bacterial community between pairs of samples from all storage conditions. The condition codes (A–D) are in accordance with those in Table 2. Numbers 1–3 indicate the replicates of each condition. The scale indicates the correlation between blue color shade and similarity level.
The PCoA ordination (Figure 6) illustrates the clusterings of bacterial communities from all storage conditions. The closest bacterial communities were derived from conditions C and D. The bacterial communities of conditions A and B were closer to each other. The NMDS (Figure 7) additionally confirmed that the bacterial compositions of conditions A and B were closer to each other, whereas that of conditions C and D were the closest ones.
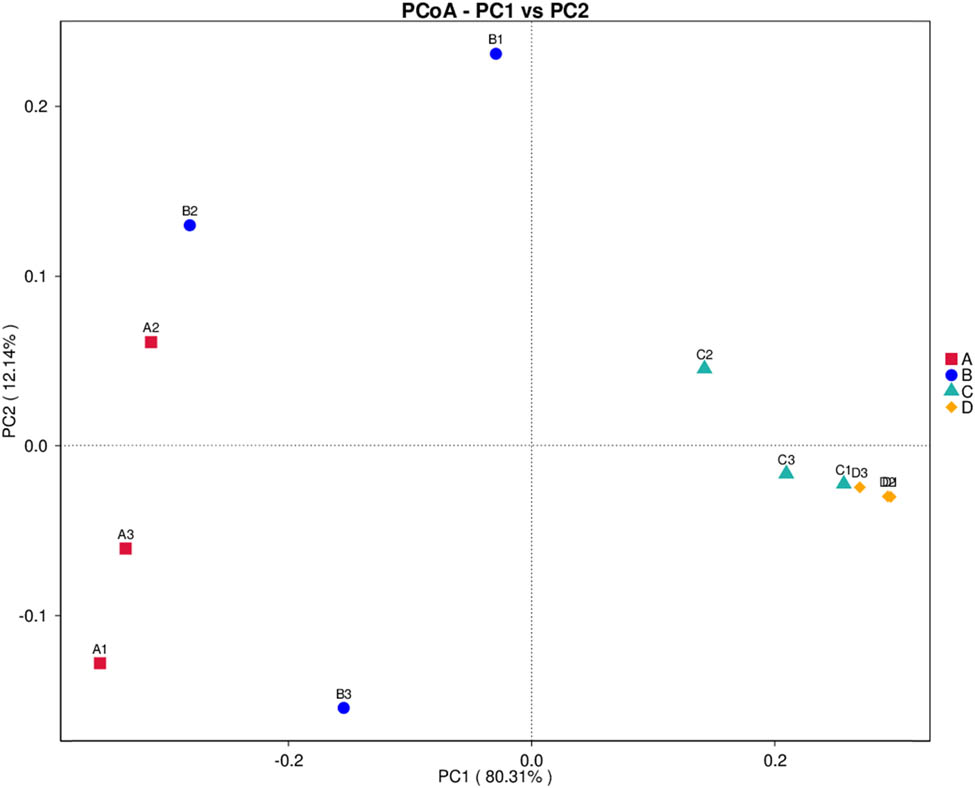
PCoA plot displaying the clusterings of bacterial compositions from all storage conditions. The condition codes (A–D) are in accordance with those in Table 2. Numbers 1–3 indicate the replicates of each condition.
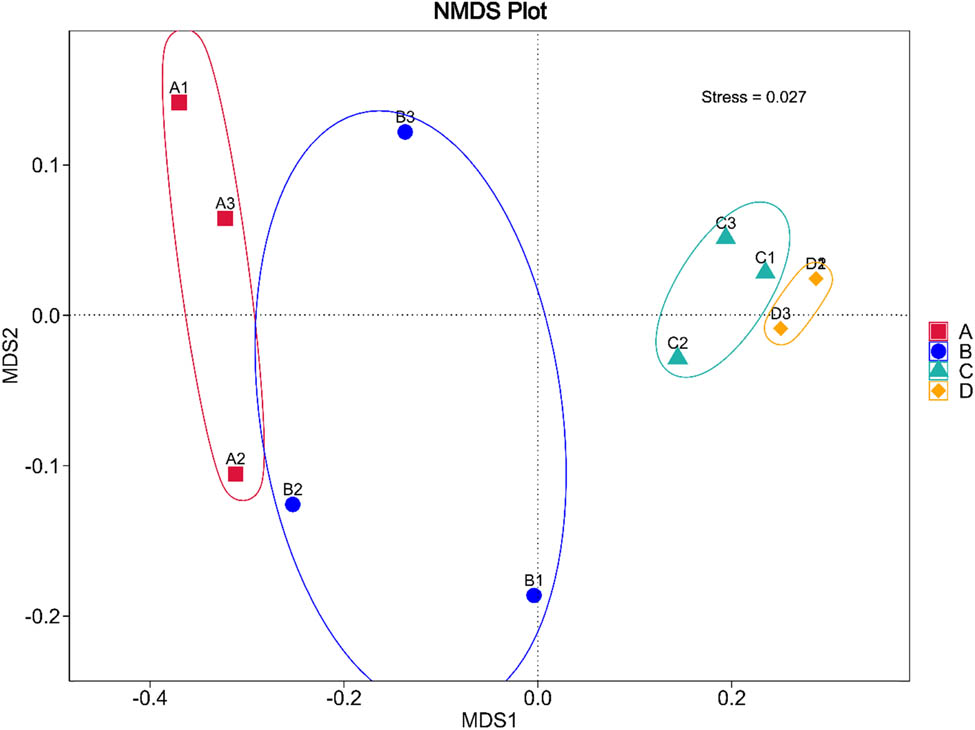
NMDS displaying the distances and variations of bacterial compositions from all storage conditions. The condition codes (A–D) are in accordance with those in Table 2. Numbers 1–3 indicate the replicates of each condition.
3.8 Gene function prediction of the bacterial communities in short mackerel under storage conditions and HPB inoculation
Gene functions were predicted by the PICRUSt2 software against the sequence information in the KEGG Orthology database (https://www.genome.jp/kegg/ko.html). Genes predicted from metagenomic data of the bacterial communities in short mackerel and their relative abundance are displayed in a heat map chart (Figure 8), in which the colors of squares signify the abundance levels. The color shades ranging from deep blue into yellow, brown, and red symbolize the abundance levels, from lowest to highest. More abundant genes in condition A included genes coding for a lactose repressor protein (LacI), family transcriptional regulator (K02529), peptide/nickel permeases (K02033 and K02034), a carrier protein reductase (K00059), an RNA polymerase σ70 factor (K03088), and a chemotaxis protein (K03406). More abundant genes in condition B included genes coding for a phosphatase (K07024) and amino acid/peptide transport and binding proteins (K02030 and K02035). More abundant genes in condition C included genes coding for an outer-membrane receptor protein (K02014), a transposase (K07497), a glutathione S-transferase (K00799), and an amino acid transport and binding protein (K01999). More abundant genes in condition D included genes coding for a β-glucosidase (K01223), amino acid/peptide transport and binding proteins (K02029, K02073, and K03305), a formate dehydrogenase (K00123), iron complex transport and binding proteins (K02013, K02015, and K02016), cellobiose-specific phosphotransferases (K02760 and K02761), an outer-membrane usher protein (K07347), amino acid synthases (K01652 and K01714), and a transketolase (K00615).
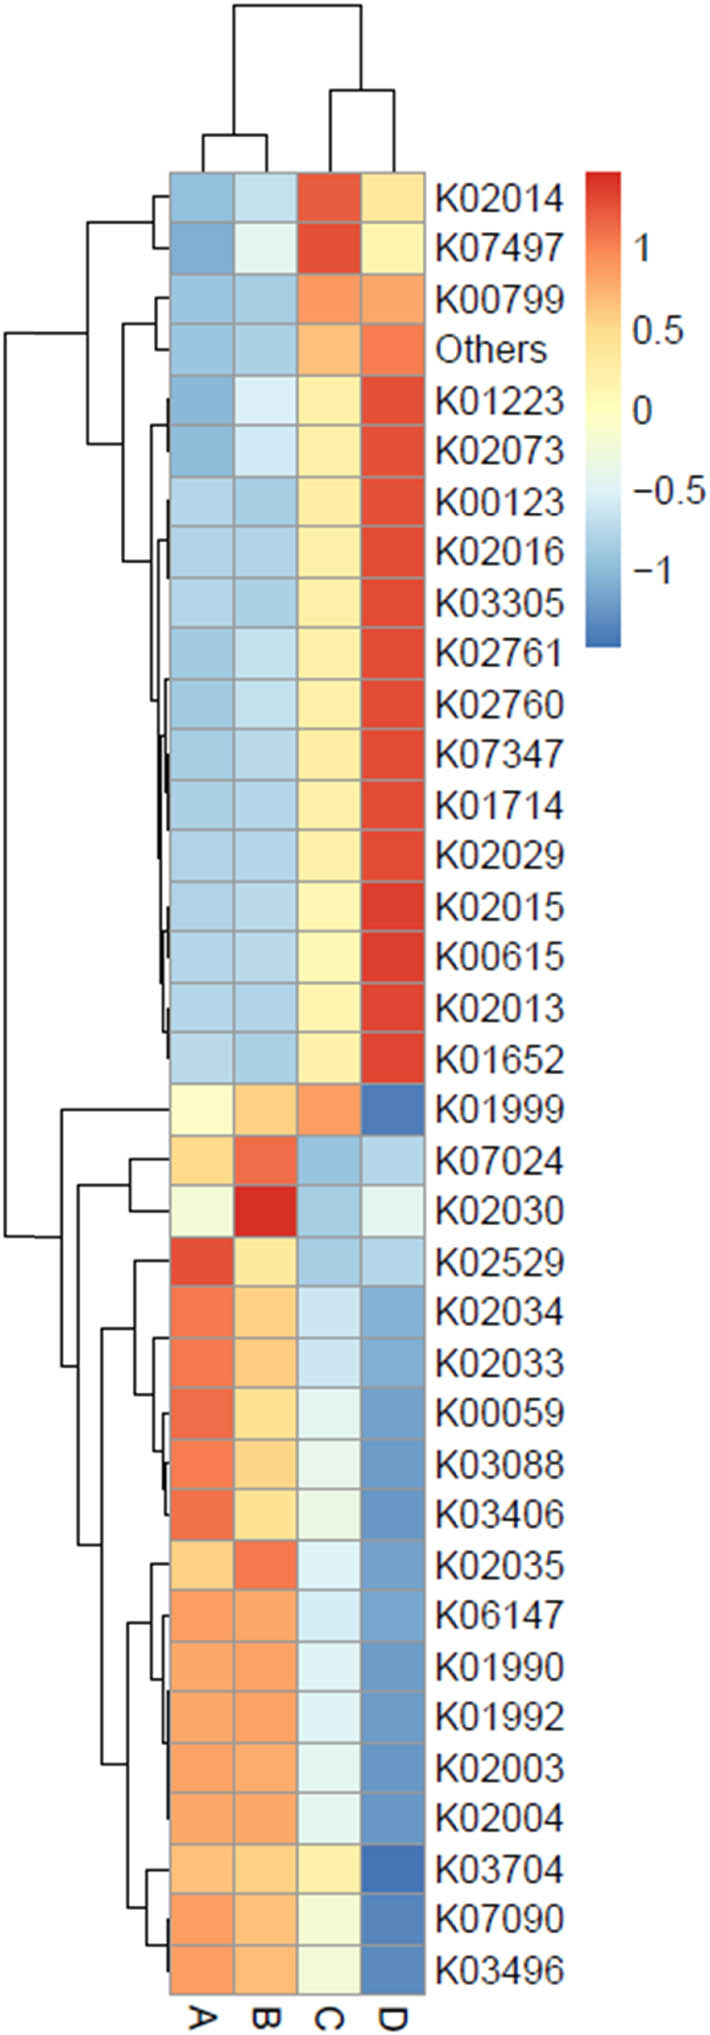
Heat map chart displaying the predicted genes (KEGG Orthology no.) from the bacterial communities in short mackerel under storage conditions and their relative abundance. The condition codes (A–D) are in accordance with those in Table 2.
Enzyme annotation is displayed in a heat map chart (Figure 9), in which the colors of squares signify the abundance levels. The color shades ranging from deep blue into yellow, brown, and red symbolize the abundance levels, from lowest to highest. Enzymes were searched against the KEGG Enzyme database (https://www.genome.jp/kegg/annotation/enzyme.html). More abundant enzymes in condition A included an amidase (EC: 3.5.1.28), a phosphatase (EC: 3.6.1.27), a carrier protein reductase (EC: 1.1.1.100), and a carboxypeptidase (EC: 3.4.16.4). The sole most abundant enzyme in condition B was a phosphoglycerate mutase (EC: 5.4.2.12). Condition C exhibited high abundance of a peptidylprolyl isomerase (EC: 5.2.1.8), a glutathione S-transferase (EC: 2.5.1.18), and an ubiquinone reductase (EC: 1.6.5.3). Enzymes with high abundance in condition D included ATPases (EC: 3.6.3.17, EC: 3.6.3.21, and EC: 3.6.3.34), oxidoreductases (EC: 1.2.1.2, EC: 1.3.5.4, and EC: 1.7.99.4), a phosphotransferase (EC: 2.7.1.69), a β-glucosidase (EC: 3.2.1.86), an RNA helicase (EC: 3.6.4.13), a decarboxylase (EC: 4.1.1.98), a transketolase (EC: 2.2.1.1), and amino acid synthases (EC: 2.2.1.6 and EC: 4.3.3.7).
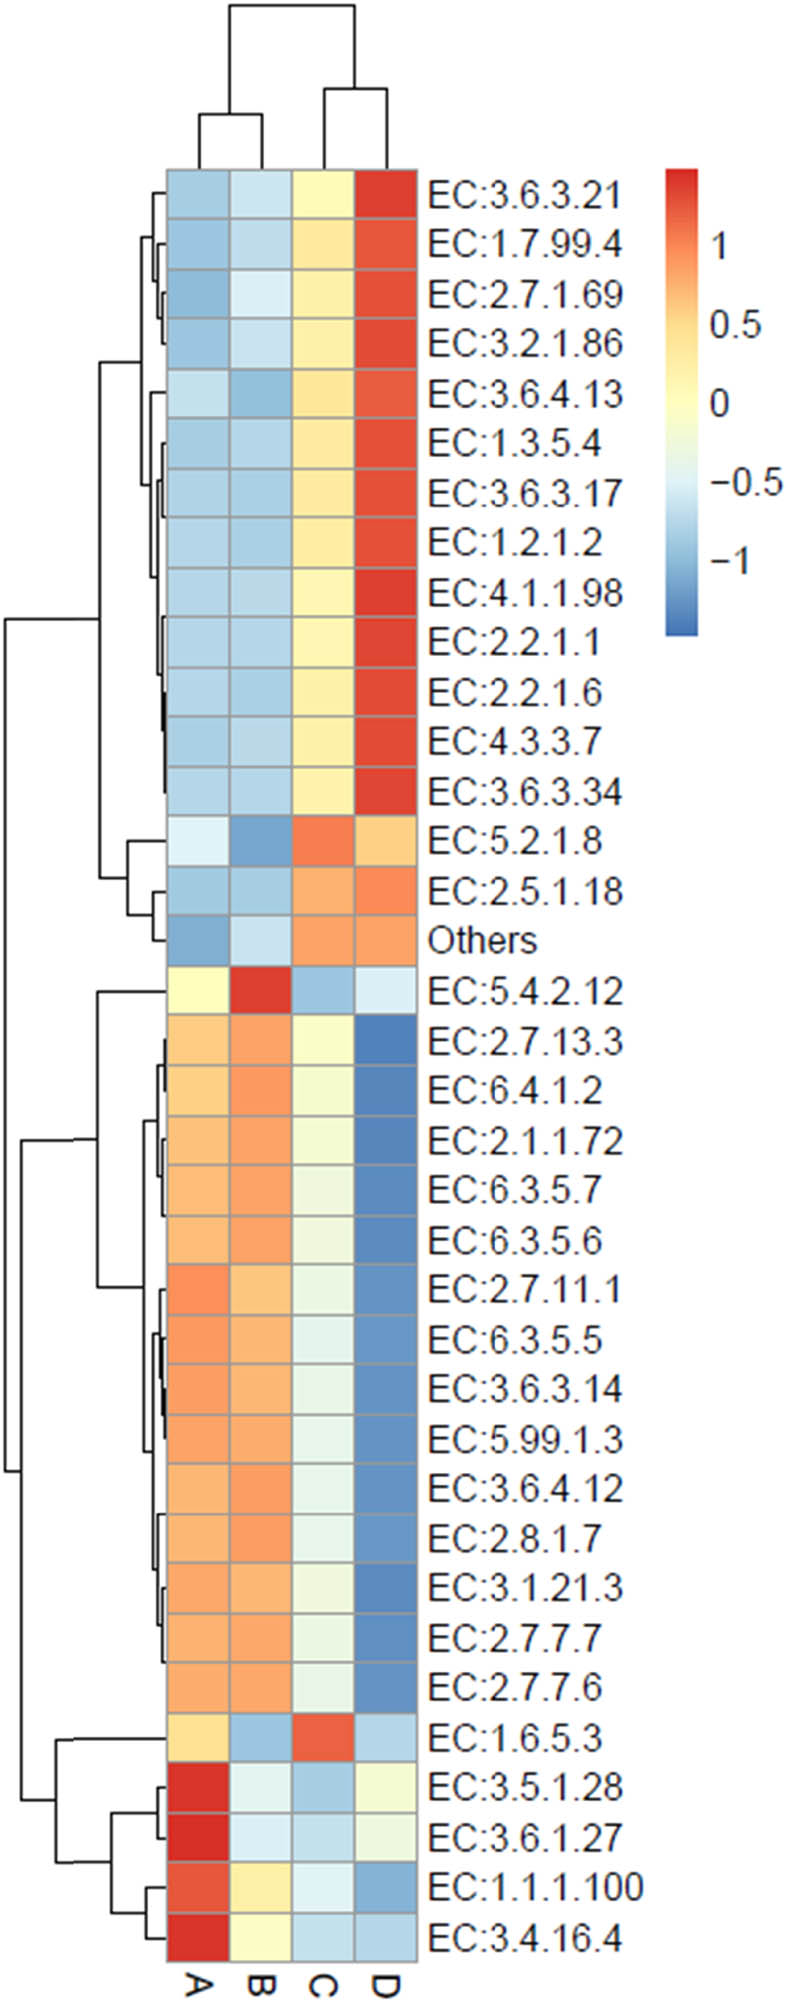
Heat map chart displaying the predicted enzymes (KEGG Enzyme commission no.) from the bacterial communities in short mackerel under storage conditions and their relative abundance. The condition codes (A–D) are in accordance with those in Table 2.
Metabolic pathway analysis was performed and is displayed in a heat map chart (Figure 10), in which the colors of squares signify the abundance levels. The color shades ranging from deep blue into yellow, brown, and red symbolize the abundance levels, from lowest to highest. Metabolic pathways were searched against the MetaCyC database (https://metacyc.org/). Condition A exhibited high abundance of peptidoglycan synthesis (PWY0-1586) and amino acid synthesis (PWY-5104). More abundant pathways in condition B included glycolysis (ANAGLYCOLYSIS-PWY), phospholipid synthesis (PHOSLIPSYN-PWY, PWY4FS-7, and PWY4FS-8), and nucleotide synthesis (PWY-7208 and PWY-7221). More abundant pathways in condition C included fatty acid β-oxidation (FAO-PWY) and fatty acid synthesis (PWY-5989). Pathways with high abundance in condition D included the Calvin cycle (CALVIN-PWY), fatty acid and lipid syntheses (FASYN-ELONG-PWY, PWY0-862, PWY-5973, PWY-5989, PWY-6282, PWY-7663, PWY-7664, and PWYG-321), peptidoglycan recycling (PWY0-1261), sugar degradation (PWY-621 and PWY-7242), the pentose phosphate pathway (NONOXIPENT-PWY), and fatty acid β-oxidation I (FAO-PWY).
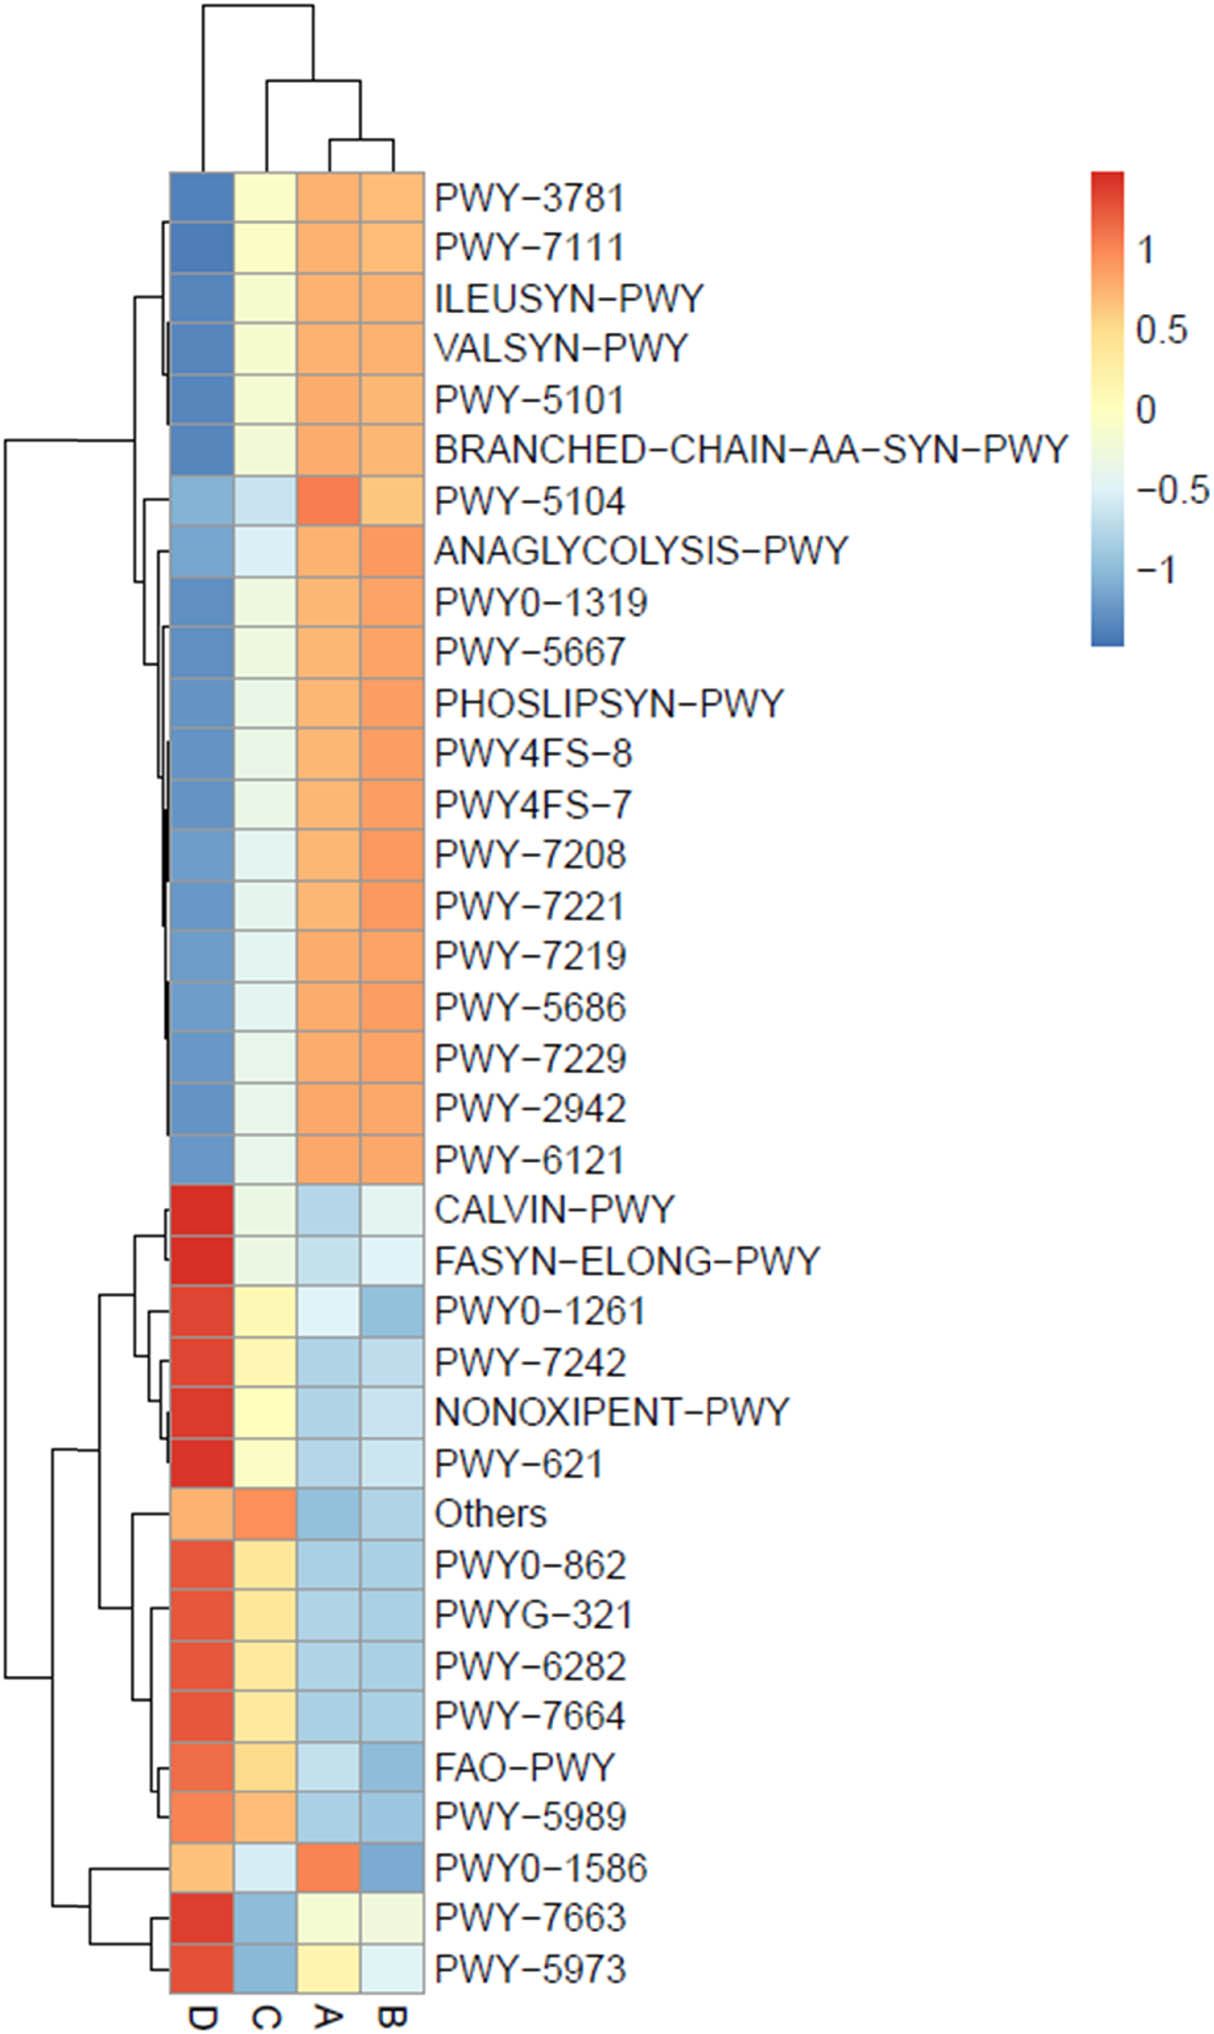
Heat map chart displaying the predicted metabolic pathways (BioCyc ID) from the bacterial communities in short mackerel under storage conditions and their relative abundance. The condition codes (A–D) are in accordance with those in Table 2.
The ordinations of samples from all storage conditions by PCA based on the predicted genes, enzymes, and metabolic pathways derived from the bacterial communities are displayed in Figure 11 (A, B, and C, respectively). The results illustrate that conditions A and B had the overlapping compositions of genes, enzymes, and pathways, whereas those of conditions C and D were completely alienated, showing their unique patterns.
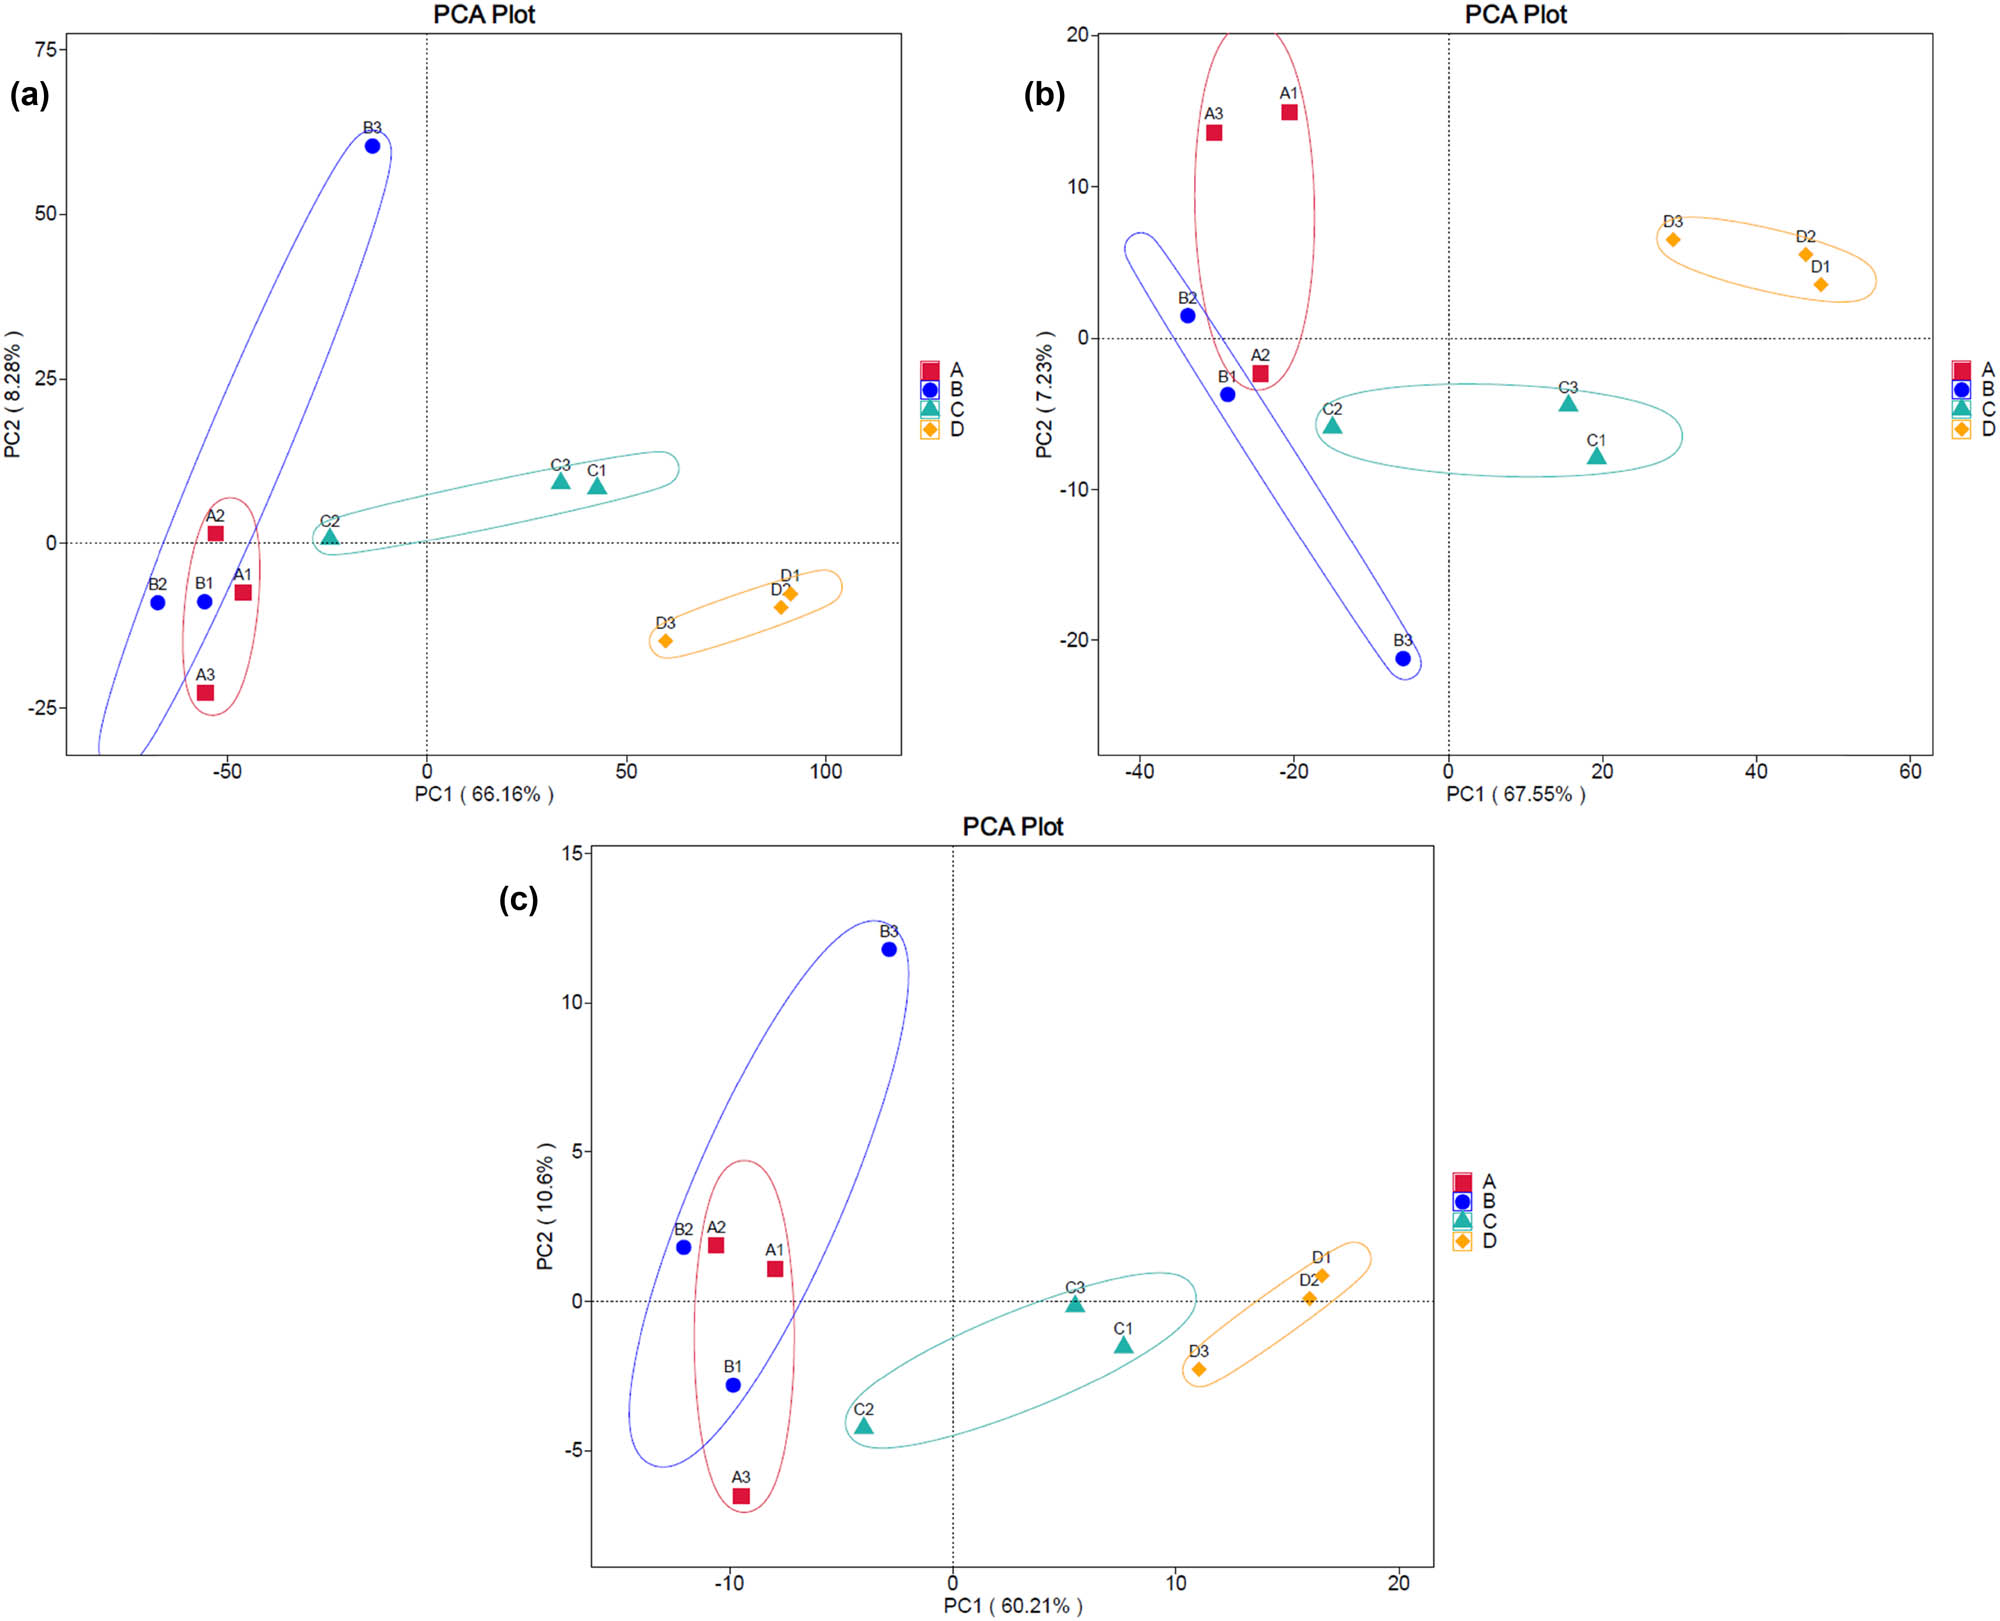
PCA plots displaying the clusterings of the predicted genes (a), enzymes (b), and metabolic pathways (c) derived from the bacterial communities from all storage conditions. The condition codes (A–D) are in accordance with those in Table 2. Numbers 1–3 indicate the replicates of each condition.
4 Discussion
It was observed in this study that 40.6% of the enterobacterial strains (28 out of 69), which were isolated from seafood in Thailand, synthesized histamine. The HPB genera included Enterobacter, Providencia, Citrobacter, Klebsiella, Morganella, and Serratia. A previous study reported the prevalence of HPB in seafood. Bacterial isolates from sardine and mackerel were screened as HPB at frequencies of 84 and 53%, respectively [12]. Enterobacteria in genera Citrobacter, Enterobacter, Escherichia, Hafnia, Klebsiella, Morganella, Proteus, Providencia, Raoultella, and Serratia have been reported to be HPB [3,17]. Among HPB of this study, Citrobacter sp. ENTSF 1-3, Citrobacter sp. ENTSF 29-3, and M. morganii SFTCBS1 harbored the hdc gene. The hdc gene sequences of two Citrobacter strains were almost identical to that of K. aerogenes (with 99.28% identity to GenBank accession no. CP011539 and 99.71% identity to CP070520). The closest relative of the hdc gene of M. morganii was from the same species (with 99.15% identity to GenBank accession no. FJ469559). The hdc-positive HPB strains in this study harbored the pyridoxal 5′-phosphate-dependent hdc gene that is associated with Gram-negative bacteria [2].
Citrobacter sp. ENTSF 29-3 was selected for further studies because this strain synthesized histamine at the maximum concentration of 5.18 ± 0.46 mM and harbored the hdc gene. Factors were compared for their effects on the histamine synthesis by Citrobacter sp. ENTSF 29-3. According to the results in Table 1, the insignificant concentrations of histamine were synthesized at two temperatures (15 and 37°C; conditions 2 and 1, respectively) and three pH values of medium (5.5, 6.5, and 7.5; conditions 3, 1, and 4, respectively), indicating no inducible effect of these variables. Among supplements, 0.2% potassium sorbate (condition 5) decreased the histamine concentration, while 5% inulin (condition 6) and 5% NaCl (condition 7) had no effect as compared to the control condition (condition 1), which was without a supplement. The comparison between conditions 8 and 1 showed that the histamine concentration was significantly higher under static condition than under aerated condition. In summary, static condition and 0.2% potassium sorbate affected histamine concentration in positive and negative manners, respectively. Our result was consistent with that in the study by Morii and Kasama [44], who observed that the HDC activity of P. phosphoreum was maximum under anaerobic stationary condition, followed by aerobic stationary condition and aerobic shaking condition. A decrease in histamine concentration by 0.2% potassium sorbate, a food preservative, may be due to the growth inhibitory effect.
Even though histamine synthesis by HPB is affected by several factors such as pH, temperature, and concentrations of NaCl and histidine, the effects of several factors have been found to be dependent on bacterial strain. pH value showed a significant effect on the histamine synthesis by 27 strains belonging to four enterobacterial genera (Citrobacter, Enterobacter, Klebsiella, and Morganella) in a strain-dependent manner [17]. Histamine synthesis by M. morganii at pH 5.3 was significantly higher than at pH 6.0, while these two pH values had no effect for Serratia liquefaciens [45]. The HDC activity of L. hilgardii, O. oeni, and P. parvulus was affected by temperature and pH [24]. The HDC activity of two strains of P. phosphoreum was dramatically decreased by 5% NaCl (27 and 40% as compared to 0% NaCl), while that of M. morganii, P. damselae, and Raoultella planticola remained relatively high (73–95% as compared to 0% NaCl) [46]. Two out of five strains of Tetragenococcus muriaticus showed positive correlation between histamine concentration and NaCl [47]. NaCl at concentrations between 0 and 8% did not affect the activity of a novel HDC of P. phosphoreum whose protein sequence shared only 12% identity with that of other HDCs [23].
The same factors were evaluated for their effects on the hdc gene expression. As interpreted from the results shown in Figure 1, static condition mostly upregulated the hdc gene expression (5.2-fold), followed by 5% NaCl (2.9-fold) and a pH 5.5 (1.8-fold). A pH medium at 7.5, a temperature at 15°C, 0.2% potassium sorbate, and 5% inulin did neither upregulate nor downregulate the hdc gene expression as compared to the control condition (pH 6.5, 37°C, and without a supplement). The effects of pH medium and temperature on the hdc gene expression have been found to be dependent on bacterial species. pH value was a factor affecting the hdcA gene expression of P. damselae, in which it reached maximum at pH 4.5 and significantly decreased at pH 7.5 [19]. In contrast, the hdcA gene expression of S. thermophilus at pH values of 5.4 and 6.5 was not significantly different [18]. The novel hdc gene of P. phosphoreum was constitutively expressed and thus was not affected by pH value [23]. Both pH value and temperature had no effect on the hdc gene expression of L. hilgardii, O. oeni, and P. parvulus [24]. Our result is in the same trend with Rossi et al. [48], who concluded that 2% NaCl upregulated the hdcA gene expression of S. thermophilus to 1.9-fold. The hdc gene upregulation by low pH and NaCl suggests that the hdc gene plays roles in bacterial survival under acidic and osmotic conditions, respectively [17,48].
The storage conditions were evaluated for their effects on the histamine synthesis in short mackerel. As presented in Table 2, histamine was undetectable in the original frozen condition (condition A) and the storage at 4°C for 2 days (condition B) was effective to prevent histamine synthesis by microbiota in short mackerel. When a storage temperature was increased, histamine synthesis by microbiota occurred. Histamine concentration in short mackerel after being stored at 25°C for 2 days (condition C) reached 590.43 ± 246.52 mg/kg. This concentration exceeded the safety limits for fresh or frozen fish, which ranged from 50 to 500 mg/kg depending on countries [49]. Similarly, histamine synthesis in mackerel (Pneumatophorus japonicus) depended on storage temperature, in which the storage at 25°C for 2 days resulted in a histamine concentration of 2,080 mg/kg [50]. The storage at 25°C for 2 days after inoculation of the HPB strain, Citrobacter sp. ENTSF 29-3 (condition D), conferred the highest histamine concentration of 3602.21 ± 26.47 mg/kg. Histamine concentration in fish during storage depended on many factors such as storage temperature and time, fish species and age, fish catch season, microbiota, and bacterial HDC activity [51,52,53].
The Venn diagram (Figure 2) presents that the number of unique ASVs of conditions A, B, C, and D was decreased, respectively (A, 1,751; B, 927; C, 364; and D, 68). This suggests that histamine suppressed the proliferation of some groups of bacterial normal flora in short mackerel. This is consistent with the results in Table 3, which shows that diversity and richness indices of conditions A, B, C, and D were decreased, respectively, while dominance was increased, respectively. The bacterial diversity of conditions C and D was significantly lower than that of conditions A and B. Condition D was the only one whose bacterial richness was significantly lower than that of conditions A and B. On the other hand, conditions C and D exhibited dominance, which was significantly higher than that of conditions A and B.
The Proteobacteria was the most abundant phylum in short mackerel varying among conditions from 40.17 to 97.40%, followed by Firmicutes (1.31–30.40%), Bacteroidota (0.66–9.72%), and Actinobacteriota (0.14–2.42%). These phyla existed with the same ranks during the storage of Spanish mackerel (Scomberomorus niphonius) at 0°C for 0–216 h., in which Proteobacteria was mostly dominant (64.06–82.50%), followed by Firmicutes (6.05–31.80%), Bacteroidetes (1.95–6.52%), and Actinobacteria (0.91–4.81%) [54]. Host factors (e.g., fish species, fish body site, fish growth, length, and weight, and trophic level) and ecological factors (e.g., habitat, benthic substrate, and water column depth) were important drivers shaping microbial diversity and community in marine fishes [55,56,57].
According to a heat map chart (Figure 3), the families Cyanobiaceae, Vibrionaceae, Tannerellaceae, Monoglobaceae, Xanthomonadaceae, Erysipelotrichaceae, Eubacterium, Bacteroidaceae, and Thiotrichaceae were the abundant bacterial normal biota in short mackerel under the original frozen condition (condition A). The storage at 4°C for 2 days (condition B) altered the bacterial community in short mackerel as the families Planococcaceae, Vagococcaceae, Staphylococcaceae, Rhodobacteraceae, Muribaculaceae, Prevotellaceae, Peptostreptococcaceae, Rhodocyclaceae, Morganellaceae, Saprospiraceae, and Rhodanobacteraceae became more abundant, suggesting that members of these families were psychrophiles or psychrotrophs. Enterobacteriaceae, Defluviicoccaceae, and Wohlfahrtiimonadaceae were more common in short mackerel stored at 25°C for 2 days (condition C), suggesting that these families probably were indigenous HPB. The storage at 25°C for 2 days after the HPB inoculation (condition D) had the Enterobacteriaceae as the apparently most abundant family due to the HPB inoculation.
A similarity heat map (Figure 5), PCoA (Figure 6), and NMDS (Figure 7) confirmed the same results that the most similarity was observed with the bacterial communities of conditions C and D and the bacterial communities of conditions A and B were closer to each other than to any other condition. The HPB inoculation mostly altered the bacterial community from the original condition.
According to gene function prediction in a heat map chart (Figure 8), the abundance of genes in conditions A and B, in which histamine was undetectable, was inversely related to that in conditions C and D, in which histamine was synthesized. The most abundant gene in the frozen condition (condition A) was a gene coding for lactose repressor protein (LacI) family transcriptional regulator (K02529), which synthesizes repressors in carbohydrate metabolism [58]. A possible explanation is that microbial growth and metabolism are generally limited at temperatures below −8°C and during the cold acclimation phase [59,60]; therefore, carbohydrate metabolism was suppressed under a frozen condition. Other abundant genes in condition A encode the following proteins and enzymes: (1) peptide/nickel transport system permeases (K02033 and K02034), which act as quorum-sensing molecules in cell-to-cell communication; (2) a 3-oxoacyl-[acyl-carrier protein] reductase (K00059) for fatty acid synthesis [61]; (3) an RNA polymerase σ70 factor (K03088) for transcription initiation and stress responses [62]; and (4) a methyl-accepting chemotaxis protein (K03406) for cell motility [61]. These genes regulate mechanisms involved in microbial adaptation to low temperature, such as syntheses of fatty acids, cold shock proteins, cold acclimation proteins, and cold-adapted enzymes [60]. More abundant genes in condition B (the storage at 4°C for 2 days) included genes coding for a sucrose-6-phosphatase (K07024) for carbohydrate metabolism and synthesis of secondary metabolites as well as amino acid and peptide/nickel transport system substrate-binding proteins (K02030 and K02035). More abundant genes in condition C (the storage at 25°C for 2 days) encode the following proteins and enzymes: (1) an iron complex outer membrane receptor protein (K02014), (2) a transposase (K07497) for DNA replication and repair [61], (3) a glutathione S-transferase (K00799) for amino acid metabolism and cellular detoxification [61,63]. An association between glutathione S-transferase genotype and histamine level was observed in allergic patients [64], and (4) an amino acid transport system substrate-binding protein (K01999). More abundant genes in condition D (the storage at 25°C for 2 days after the HPB inoculation) encode the following proteins and enzymes: (1) a 6-phospho-β-glucosidase (K01223) for several processes such as carbohydrate metabolism, glycolysis, and gluconeogenesis [61]; (2) amino acid/peptide transport system substrate-binding proteins (K02029, K02073, and K03305); (3) a formate dehydrogenase (K00123) for carbohydrate metabolism and bacterial survival under stress conditions [61,65]; (4) iron complex transport system proteins (K02013, K02015, and K02016); (5) cellobiose-specific phosphotransferases (K02760 and K02761) for carbohydrate metabolism; (6) an outer membrane usher protein (K07347); (7) amino acid synthases (K01652 and K01714) for amino acid synthesis; and (8) a transketolase (K00615) for the syntheses of amino acids and secondary metabolites [61]. These genes are involved in metabolisms for bacterial growth and survival.
According to a heat map displaying enzyme annotation (Figure 9), the abundance of enzymes in conditions A and B, in which histamine was undetectable, was inversely related to that in conditions C and D, in which histamine was synthesized. More abundant enzymes in condition A function in the synthesis of bacterial cell wall composition, especially peptidoglycan. An N-acetylmuramoyl-l-alanine amidase (EC: 3.5.1.28) maintains a balance between peptidoglycan synthesis and degradation [66]. An undecaprenyl-diphosphate phosphatase (EC: 3.6.1.27) and a d-alanyl-d-alanine-carboxypeptidase (EC: 3.4.16.4) catalyze peptidoglycan synthesis. A 3-oxoacyl-[acyl-carrier-protein] reductase (EC: 1.1.1.100) catalyzes fatty acid synthesis. A phosphoglycerate mutase (EC: 5.4.2.12), which was mostly abundant in condition B, is involved in several processes such as glycolysis, gluconeogenesis, and synthesis of secondary metabolites [67]. Condition C exhibited high abundance of three enzymes involved in bacterial growth and survival. A peptidylprolyl isomerase (EC: 5.2.1.8) regulates protein-associated processes including folding, activation, and degradation [68]. A glutathione S-transferase (EC: 2.5.1.18) catalyzes amino acid metabolism and detoxifies cellular toxic compounds [63,67]. A ubiquinone reductase (EC: 1.6.5.3) plays a role in energy-consuming reactions [69]. Condition D had more numbers of enzymes with high abundance than all other conditions. More abundant enzymes in condition D were grouped as follows: (1) ATPases (EC: 3.6.3.17, EC: 3.6.3.21, and EC: 3.6.3.34) for energy supply; (2) oxidoreductases (EC: 1.2.1.2, EC: 1.3.5.4, and EC: 1.7.99.4) for several processes such as tricarboxylic cycle, oxidative phosphorylation, carbon and nitrogen metabolisms, carbon fixation, and synthesis of secondary metabolites; (3) a phosphotransferase (EC: 2.7.1.69) for carbohydrate metabolism; (4) a 6-phospho-β-glucosidase (EC: 3.2.1.86) for several processes such as carbohydrate metabolism, glycolysis, and gluconeogenesis [67]; (5) an RNA helicase (EC: 3.6.4.13) for RNA metabolism and gene expression [70]; (6) a 4-hydroxy-3-polyprenylbenzoate decarboxylase (EC: 4.1.1.98) for ubiquinone synthesis; (7) a transketolase (EC: 2.2.1.1) for several processes such as the pentose phosphate pathway, carbon fixation, and synthesis of secondary metabolites; and (8) amino acid synthases (EC: 2.2.1.6 and EC: 4.3.3.7) for amino acid synthesis [67].
According to a heat map displaying a metabolic pathway analysis (Figure 10), the pathway patterns of conditions A and B were mostly similar to each other, whereas that of condition D was farthest alienated. The pathways with the high levels in condition A were peptidoglycan synthesis (PWY0-1586) and amino acid synthesis (PWY-5104) [71]. It was found that peptidoglycan modification contributed to bacterial survival under cold stress condition [72]. Condition B exhibited high levels of glycolysis (ANAGLYCOLYSIS-PWY), phospholipid synthesis (PHOSLIPSYN-PWY, PWY4FS-7, and PWY4FS-8), and nucleotide synthesis (PWY-7208 and PWY-7221), which are essential for bacterial proliferation. The level of peptidoglycan synthesis (PWY0-1586) in condition B was mostly decreased as compared to condition A. This probably resulted from a decline in cold stress in condition B. Condition C exhibited high levels of fatty acid β-oxidation (FAO-PWY) and fatty acid synthesis (PWY-5989). Condition D exhibited high levels of various pathways including the Calvin cycle (CALVIN-PWY), fatty acid and lipid syntheses (FASYN-ELONG-PWY, PWY0-862, PWY-5973, PWY-5989, PWY-6282, PWY-7663, PWY-7664, and PWYG-321), peptidoglycan recycling (PWY0-1261), sugar degradation (PWY-621 and PWY-7242), the pentose phosphate pathway (NONOXIPENT-PWY), and fatty acid β-oxidation (FAO-PWY) [71].
5 Conclusions
The hdc gene expression of the HPB strain, Citrobacter sp. ENTSF 29-3, could be upregulated by static condition, 5% NaCl, and pH 5.5. The addition of 0.2% potassium sorbate and storage at 4°C for 2 days are recommended for controlling histamine accumulation in fresh fishes. Metagenomic and metabolomic analyses provided insight in the bacterial communities in short mackerel under storage conditions and HPB inoculation. Faecalibaculum and Monoglobus were normal biota considered as biomarkers in frozen short mackerel. Macrococcus and Lactobacillus were the significant biomarkers under the storage at 4°C for 2 days. The HPB inoculation promoted the family Enterobacteriaceae to be the sole biomarker. The storage of short mackerel at 25°C for 2 days caused histamine synthesis by normal flora and altered the bacterial community by decreasing the bacterial diversity and increasing the abundance of the families Enterobacteriaceae, Defluviicoccaceae, and Wohlfahrtiimonadaceae. A similarity heat map, PCoA, and NMDS attested the consistent results that the most similar bacterial communities were obtained from the storage at 25°C for 2 days and the storage at 25°C for 2 days after HPB inoculation, while the original frozen condition and the storage at 4°C for 2 days were closer to each other. Further analysis should be applied to quantify the levels of pathogenic bacteria for food safety assurance. Genes, enzymes, and metabolic pathways were indirectly predicted from the available genome data of the identified bacteria. The abundance of genes and enzymes in conditions with synthesized histamines was inversely related to that in conditions without synthesized histamines. Genes involved in bacterial adaptation to cold stress and cell detoxification were relevant to storage conditions and histamine synthesis. The PCA plots based on the predicted genes, enzymes, and metabolic pathways illustrate that the original frozen condition and the storage at 4°C for 2 days had the overlapping compositions, whereas the storage at 25°C for 2 days and the storage at 25°C for 2 days after HPB inoculation generated the unique patterns. Genes, enzymes, and pathways involved in bacterial growth and survival under stress conditions became more abundant in the conditions having histamine.
-
Funding information: This work was financially supported by the Thailand Science Research and Innovation (TSRI) and National Science, Research and Innovation Fund (NSRF) under Project Code 48858.
-
Author contributions: All authors have accepted responsibility for the entire content of this manuscript and consented to its submission to the journal. All authors have read and agreed to the published version of the manuscript. P.N. and N.P. contributed equally to this article. P.N. and N.P. conceived and designed this study, performed the experiments, analyzed the data, and wrote the manuscript.
-
Conflict of interest: Authors state no conflict of interest.
-
Data availability statement: All output data generated or analyzed during this study are provided in this published article. Sequence data can be retrieved from the Sequence Read Archive of the NCBI under BioProject accession no. PRJNA1081585.
References
[1] Ma J, Nie Y, Zhang L, Xu Y. Ratio of histamine-producing/non-histamine-producing subgroups of Tetragenococcus halophilus determines the histamine accumulation during spontaneous fermentation of soy sauce. Appl Env Microbiol. 2023;89(3):e01884–22. 10.1128/aem.01884-22.Search in Google Scholar PubMed PubMed Central
[2] Trip H, Mulder NL, Rattray FP, Lolkema JS. HdcB, a novel enzyme catalysing maturation of pyruvoyl-dependent histidine decarboxylase. Mol Microbiol. 2011;79(4):861–71. 10.1111/j.1365-2958.2010.07492.x.Search in Google Scholar PubMed
[3] Oktariani AF, Ramona Y, Sudaryatma PE, Dewi IAMM, Shetty K. Role of marine bacterial contaminants in histamine formation in seafood products: a review. Microorganisms. 2022;10(6):1197. 10.3390/microorganisms10061197.Search in Google Scholar PubMed PubMed Central
[4] Frith A, Hayes-Mims M, Carmichael R, Björnsdóttir-Butler K. Effects of environmental and water quality variables on histamine-producing bacteria concentration and species in the northern Gulf of Mexico. Microbiol Spectr. 2023;11(4):e0472022. 10.1128/spectrum.04720-22.Search in Google Scholar PubMed PubMed Central
[5] U.S. Food and Drug Administration (FDA). Scombrotoxin Poisoning and Decomposition; U.S. FDA; https://www.fda.gov/food/seafood-guidance-documents-regulatory-information/scombrotoxin-poisoning-and-decomposition.2017. Accessed: 25-April- 2024.Search in Google Scholar
[6] Pereira E, Elliot EL, Singleton LS, Otto M, Tesfai A, Doyle M, et al. An outbreak investigation of scombrotoxin fish poisoning illnesses in the United States linked to yellowfin tuna imported from Vietnam-2019. J Food Prot. 2021;84(6):962–72. 10.4315/JFP-20-456.Search in Google Scholar PubMed
[7] Diaz M, Del Rio B, Ladero V, Redruello B, Fernández M, Martin MC, et al. Histamine production in Lactobacillus vaginalis improves cell survival at low pH by counteracting the acidification of the cytosol. Int J Food Microbiol. 2020;321:108548. 10.1016/j.ijfoodmicro.2020.108548.Search in Google Scholar PubMed
[8] Alya’ainun R, Fathoni EY, Puspita ID. The effect of pH on bacterial growth and histamine formation by Klebsiella pneumoniae CK02 and Raoultella ornithinolytica TN01. IOP Conf Ser: Earth Env Sci. 2021;919:012039. 10.1088/1755-1315/919/1/012039.Search in Google Scholar
[9] Linh DTY, Hang TTT, Doan NTL, Anh NH, Thuy NTT. Isolation and screening of histamine-producing bacteria from the first six months of the Cat Hai fish sauce fermentation process. VJAS. 2018;1(3):220–9. 10.31817/vjas.2018.1.3.03.Search in Google Scholar
[10] Refai MAE, El-Hariri M, Ahmed ZAM, El Jakee J. Histamine producing bacteria in fish. Egypt J Aquat Biol Fish. 2020;24(7):1–11. 10.21608/ejabf.2020.117856.Search in Google Scholar
[11] Adeolu M, Alnajar S, Naushad S, Gupta RS. Genome-based phylogeny and taxonomy of the ‘Enterobacteriales’: proposal for Enterobacterales ord. nov. divided into the families Enterobacteriaceae, Erwiniaceae fam. nov., Pectobacteriaceae fam. nov., Yersiniaceae fam. nov., Hafniaceae fam. nov., Morganellaceae fam. nov., and Budviciaceae fam. nov. Int J Syst Evol Microbiol. 2016;66(12):5575–99. 10.1099/ijsem.0.001485.Search in Google Scholar PubMed
[12] Sabry MA, Mansour HAA, Ashour RM, Hamza E. Histamine-producing bacteria and histamine induction in retail sardine and mackerel from fish markets in Egypt. Foodborne Pathog Dis. 2019;16(9):597–603. 10.1089/fpd.2018.2616.Search in Google Scholar PubMed
[13] Björnsdóttir-Butler K, Bolton GE, Jaykus LA, McClellan-Green PD, Green DP. Development of molecular-based methods for determination of high histamine producing bacteria in fish. Int J Food Microbiol. 2010;139(3):161–7. 10.1016/j.ijfoodmicro.2010.03.017.Search in Google Scholar PubMed
[14] de Lira AD, de Castro IMS, Mann MB, Mallmann LP, Kothe CI, Varela APM, et al. Evaluating Sardinella brasiliensis quality indicators through the quantification of histamine and bacterial communities. Heliyon. 2020;6(8):e04461. 10.1016/j.heliyon.2020.e04461.Search in Google Scholar PubMed PubMed Central
[15] Rachmawati N, Powell S, Ross T, Tamplin M. Characterization of histamine-producing bacteria isolated during processing of Indonesian salted-boiled longtail (Thunnus sp.) and eastern little tuna (Euthynnus sp.). J Aquat Food Prod Technol. 2023;32(3):349–58. 10.1080/10498850.2023.2219248.Search in Google Scholar
[16] Wang Y, Pei H, Liu Y, Huang X, Deng L, Lan Q, et al. Inhibitory mechanism of cell-free supernatants of Lactobacillus plantarum on Proteus mirabilis and influence of the expression of histamine synthesis-related genes. Food Control. 2021;125:107982. 10.1016/j.foodcont.2021.107982.Search in Google Scholar
[17] Yang Q, Meng J, Zhang W, Liu L, He L, Deng L, et al. Effects of amino acid decarboxylase genes and pH on the amine formation of enteric bacteria from Chinese traditional fermented fish (Suan Yu). Front Microbiol. 2020;11:1130. 10.3389/fmicb.2020.01130.Search in Google Scholar PubMed PubMed Central
[18] Calles-Enríquez M, Eriksen BH, Andersen PS, Rattray FP, Johansen AH, Fernández M, et al. Sequencing and transcriptional analysis of the Streptococcus thermophilus histamine biosynthesis gene cluster: factors that affect differential hdcA expression. Appl Env Microbiol. 2010;76(18):6231–8. 10.1128/AEM.00827-10.Search in Google Scholar PubMed PubMed Central
[19] Kimura B, Takahashi H, Hokimoto S, Tanaka Y, Fujii T. Induction of the histidine decarboxylase genes of Photobacterium damselae subsp. damselae (formally P. histaminum) at low pH. J Appl Microbiol. 2009;107(2):485–97. 10.1111/j.1365-2672.2009.04223.x.Search in Google Scholar PubMed
[20] Landete JM, Pardo I, Ferrer S. Histamine, histidine, and growth-phase mediated regulation of the histidine decarboxylase gene in lactic acid bacteria isolated from wine. FEMS Microbiol Lett. 2006;260(1):84–90. 10.1111/j.1574-6968.2006.00294.x.Search in Google Scholar PubMed
[21] Martín MC, Fernández M, Linares DM, Alvarez MA. Sequencing, characterization and transcriptional analysis of the histidine decarboxylase operon of Lactobacillus buchneri. Microbiology (Read). 2005;151(Pt 4):1219–28. 10.1099/mic.0.27459-0.Search in Google Scholar PubMed
[22] Thomas CM, Hong T, van Pijkeren JP, Hemarajata P, Trinh DV, Hu W, et al. Histamine derived from probiotic Lactobacillus reuteri suppresses TNF via modulation of PKA and ERK signaling. PLoS One. 2012;7(2):e31951. 10.1371/journal.pone.0031951.Search in Google Scholar PubMed PubMed Central
[23] Björnsdóttir-Butler K, May S, Hayes M, Abraham A, Benner Jr RA. Characterization of a novel enzyme from Photobacterium phosphoreum with histidine decarboxylase activity. Int J Food Microbiol. 2020;334:108815. 10.1016/j.ijfoodmicro.2020.108815.Search in Google Scholar PubMed
[24] Landete JM, Pardo I, Ferrer S. Regulation of hdc expression and HDC activity by enological factors in lactic acid bacteria. J Appl Microbiol. 2008;105(5):1544–51. 10.1111/j.1365-2672.2008.03865.x.Search in Google Scholar PubMed
[25] Kongseng S, Phoonsawat R, Wanchana W, Swatdipong A. Genetic mixed-stock analysis of short mackerel, Rastrelliger brachysoma, catches in the Gulf of Thailand: evidence of transboundary migration of the commercially important fish. Fish Res. 2021;235:105823. 10.1016/j.fishres.2020.105823.Search in Google Scholar
[26] Wauters G, Avesani V, Charlier J, Janssens M, Delmée M. Histidine decarboxylase in Enterobacteriaceae revisited. J Clin Microbiol. 2004;42(12):5923–4. 10.1128/JCM.42.12.5923-5924.2004.Search in Google Scholar PubMed PubMed Central
[27] Nimnoi P, Pongsilp N. Distribution and expression of virulence genes in potentially pathogenic bacteria isolated from seafood in Thailand. CyTA J Food. 2020;18(1):753–63. 10.1080/19476337.2020.1842502.Search in Google Scholar
[28] Pongsilp N, Nimnoi P. Diversity and antibiotic resistance patterns of enterobacteria isolated from seafood in Thailand. CyTA J Food. 2018;16(1):793–800. 10.1080/19476337.2018.1479453.Search in Google Scholar
[29] Sumner SS, Taylor SL. Detection method for histamine-producing, dairy-related bacteria using diamine oxidase and leucocrystal violet. J Food Prot. 1989;52(2):105–8. 10.4315/0362-028X-52.2.105.Search in Google Scholar PubMed
[30] Takahashi H, Kimura B, Yoshikawa M, Fujii T. Cloning and sequencing of the histidine decarboxylase genes of gram-negative, histamine-producing bacteria and their application in detection and identification of these organisms in fish. Appl Env Microbiol. 2003;69(5):2568–79. 10.1128/AEM.69.5.2568-2579.2003.Search in Google Scholar PubMed PubMed Central
[31] Gomes AÉI, Stuchi LP, Siqueira NMG, Henrique JB, Vicentini R, Ribeiro ML, et al. Selection and validation of reference genes for gene expression studies in Klebsiella pneumoniae using reverse transcription quantitative real-time PCR. Sci Rep. 2018;8(1):9001. 10.1038/s41598-018-27420-2.Search in Google Scholar PubMed PubMed Central
[32] Nimnoi P, Pongsilp N. Identification, characterization, and virulence gene expression of marine enterobacteria in the Upper Gulf of Thailand. Microorganisms. 2022;10(3):511. 10.3390/microorganisms10030511.Search in Google Scholar PubMed PubMed Central
[33] Cinquina AL, Longo F, Calì A, De Santis L, Baccelliere R, Cozzani R. Validation and comparison of analytical methods for the determination of histamine in tuna fish samples. J Chromatogr A. 2004;1032(1–2):79–85. 10.1016/j.chroma.2003.11.033.Search in Google Scholar PubMed
[34] Apprill A, McNally S, Parsons R, Weber L. Minor revision to V4 region SSU rRNA 806R gene primer greatly increases detection of SAR11 bacterioplankton. Aquat Microb Ecol. 2015;75:129–37. 10.3354/ame01753.Search in Google Scholar
[35] Parada AE, Needham DM, Fuhrman JA. Every base matters: assessing small subunit rRNA primers for marine microbiomes with mock communities, time series and global field samples. Env Microbiol. 2016;18(5):1403–14. 10.1111/1462-2920.13023.Search in Google Scholar PubMed
[36] Magoč T, Salzberg SL. FLASH: fast length adjustment of short reads to improve genome assemblies. Bioinformatics. 2011;27(21):2957–63. 10.1093/bioinformatics/btr507.Search in Google Scholar PubMed PubMed Central
[37] Chen S, Zhou Y, Chen Y, Gu J. fastp: an ultra-fast all-in-one FASTQ preprocessor. Bioinformatics. 2018;34(17):i884–90. 10.1093/bioinformatics/bty560.Search in Google Scholar PubMed PubMed Central
[38] Rognes T, Flouri T, Nichols B, Quince C, Mahé F. VSEARCH: a versatile open source tool for metagenomics. PeerJ. 2016;4:e2584. 10.7717/peerj.2584.Search in Google Scholar PubMed PubMed Central
[39] Bolyen E, Rideout JR, Dillon MR, Bokulich NA, Abnet CC, Al-Ghalith GA, et al. Reproducible, interactive, scalable and extensible microbiome data science using QIIME2. Nat Biotechnol. 2019;37(8):852–7. 10.1038/s41587-019-0209-9.Search in Google Scholar PubMed PubMed Central
[40] Quast C, Pruesse E, Yilmaz P, Gerken J, Schweer T, Yarza P, et al. The SILVA ribosomal RNA gene database project: improved data processing and web-based tools. Nucleic Acids Res. 2013;41(Database issue):D590–6. 10.1093/nar/gks1219.Search in Google Scholar PubMed PubMed Central
[41] R Core Team. R: A language and environment for statistical computing; R foundation for statistical computing; http://www.R-project.org/.2018. Accessed: 25-April-2024.Search in Google Scholar
[42] Segata N, Izard J, Waldron L, Gevers D, Miropolsky L, Garrett WS, et al. Metagenomic biomarker discovery and explanation. Genome Biol. 2011;12(6):R60. 10.1186/gb-2011-12-6-r60.Search in Google Scholar PubMed PubMed Central
[43] Douglas GM, Maffei VJ, Zaneveld JR, Yurgel SN, Brown JR, Taylor CM, et al. PICRUSt2 for prediction of metagenome functions. Nat Biotechnol. 2020;38(6):685–8. 10.1038/s41587-020-0548-6.Search in Google Scholar PubMed PubMed Central
[44] Morii H, Kasama K. Changes in the activity of two histidine decarboxylases from Photobacterium phosphoreum during growth under different oxygen tensions. Fish Sci. 1995;61(5):845–51. 10.2331/fishsci.61.845.Search in Google Scholar
[45] Guillén-Velasco S, Ponce-Alquicira E, Farrés-González Saravia A, Guerrero-Legarreta I. Histamine production by two Enterobacteriaceae strains isolated from tuna (Thunnus thynnus) and jack mackerel (Trachurus murphyii). Int J Food Prop. 2004;7(1):91–103. 10.1081/JFP-120022984.Search in Google Scholar
[46] Kanki M, Yoda T, Tsukamoto T, Baba E. Histidine decarboxylases and their role in accumulation of histamine in tuna and dried saury. Appl Env Microbiol. 2007;73(5):1467–73. 10.1128/AEM.01907-06.Search in Google Scholar PubMed PubMed Central
[47] Kobayashi T, Wang X, Shigeta N, Taguchi C, Ishii K, Shozen K, et al. Distribution of histamine-producing lactic acid bacteria in canned salted anchovies and their histamine production behavior. Ann Microbiol. 2016;66:1277–84. 10.1007/s13213-016-1213-7.Search in Google Scholar
[48] Rossi F, Gardini F, Rizzotti L, La Gioia F, Tabanelli G, Torriani S. Quantitative analysis of histidine decarboxylase gene (hdcA) transcription and histamine production by Streptococcus thermophilus PRI60 under conditions relevant to cheese making. Appl Env Microbiol. 2011;77(8):2817–22. 10.1128/AEM.02531-10.Search in Google Scholar PubMed PubMed Central
[49] DeBEER J, Bell JW, Nolte F, Arcieri J, Correa G. Histamine limits by country: a survey and review. J Food Prot. 2021;84(9):1610–28. 10.4315/JFP-21-129.Search in Google Scholar PubMed
[50] Jiang QQ, Dai ZY, Zhou T, Wu JJ, Bu JZ, Zheng TL. Histamine production and bacterial growth in mackerel (Pneumatophorus japonicus) during storage. J Food Biochem. 2013;37(2):246–53. 10.1111/jfbc.12021.Search in Google Scholar
[51] Learoussy HY, Tfeil H, Dartige AY, Coulibaly SM, Aarab L. Determination of histamine level in commonly consumed frozen fish in Mauritania. Food Res. 2023;7(1):292–6. 10.26656/fr.2017.7(1).973.Search in Google Scholar
[52] Madejska A, Pawul-Gruba M, Osek J. Histamine content in selected production stages of fish products. J Vet Res. 2022;66(4):599–604. 10.2478/jvetres-2022-0063.Search in Google Scholar PubMed PubMed Central
[53] Pavlović MS, Ivanović SD, Pavlović IN, Rokvić NI, Radosavljević VI, Vasilev DD. Histamine levels in fish samples collected from Serbian market in 2018. Food Feed Res. 2019;46(1):37–43. 10.5937/FFR1901037P.Search in Google Scholar
[54] Zheng R, Xu X, Xing J, Cheng H, Zhang S, Shen J, et al. Quality evaluation and characterization of specific spoilage organisms of Spanish mackerel by high-throughput sequencing during 0°C cold chain logistics. Foods. 2020;9(3):312. 10.3390/foods9030312.Search in Google Scholar PubMed PubMed Central
[55] Minich JJ, Petrus S, Michael JD, Michael TP, Knight R, Allen EE. Temporal, environmental, and biological drivers of the mucosal microbiome in a wild marine fish, Scomber japonicus. mSphere. 2020;5(3):e00401–20. 10.1128/mSphere.00401-20.Search in Google Scholar PubMed PubMed Central
[56] Minich JJ, Härer A, Vechinski J, Frable BW, Skelton ZR, Kunselman E, et al. Host biology, ecology and the environment influence microbial biomass and diversity in 101 marine fish species. Nat Commun. 2022;13(1):6978. 10.1038/s41467-022-34557-2.Search in Google Scholar PubMed PubMed Central
[57] Soh M, Tay YC, Lee CS, Low A, Orban L, Jaafar Z, et al. The intestinal digesta microbiota of tropical marine fish is largely uncultured and distinct from surrounding water microbiota. NPJ Biofilms Microbiomes. 2024;10(1):11. 10.1038/s41522-024-00484-x.Search in Google Scholar PubMed PubMed Central
[58] Ravcheev DA, Khoroshkin MS, Laikova ON, Tsoy OV, Sernova NV, Petrova SA, et al. Comparative genomics and evolution of regulons of the LacI-family transcription factors. Front Microbiol. 2014;5:294. 10.3389/fmicb.2014.00294.Search in Google Scholar PubMed PubMed Central
[59] Geiges O. Microbial processes in frozen food. Adv Space Res. 1996;18(12):109–18. 10.1016/0273-1177(96)00006-3.Search in Google Scholar
[60] Qian YF, Yu JY, Xie J, Yang SP. A mini-review on cold-adapted enzymes from psychrotrophic microorganisms in foods: benefits and challenges. Curr Res Biotechnol. 2023;6:100162. 10.1016/j.crbiot.2023.100162.Search in Google Scholar
[61] Kyoto Encyclopedia of Genes and Genomes (KEGG) Orthology. KO (KEGG orthology) database; Kyoto University; https://www.genome.jp/kegg/ko.html. 2024. Accessed: 25-April-2024.Search in Google Scholar
[62] Paget MS, Helmann JD. The σ70 family of sigma factors. Genome Biol. 2003;4(1):203. 10.1186/gb-2003-4-1-203.Search in Google Scholar PubMed PubMed Central
[63] Lienkamp AC, Burnik J, Heine T, Hofmann E, Tischler D. Characterization of the glutathione S-transferases involved in styrene degradation in Gordonia rubripertincta CWB2. Microbiol Spectr. 2021;9(1):e00474–21. 10.1128/Spectrum.00474-21.Search in Google Scholar PubMed PubMed Central
[64] Gilliland FD, Li YF, Saxon A, Diaz-Sanchez D. Effect of glutathione-S-transferase M1 and P1 genotypes on xenobiotic enhancement of allergic responses: randomised, placebo-controlled crossover study. Lancet. 2004;363(9403):119–25. 10.1016/S0140-6736(03)15262-2.Search in Google Scholar PubMed
[65] Iwadate Y, Funabasama N, Kato JI. Involvement of formate dehydrogenases in stationary phase oxidative stress tolerance in Escherichia coli. FEMS Microbiol Lett. 2017;364(20):fnx193. 10.1093/femsle/fnx193.Search in Google Scholar PubMed
[66] Bourgeois I, Camiade E, Biswas R, Courtin P, Gibert L, Götz F, et al. Characterization of AtlL, a bifunctional autolysin of Staphylococcus lugdunensis with N-acetylglucosaminidase and N-acetylmuramoyl-l-alanine amidase activities. FEMS Microbiol Lett. 2009;290(1):105–13. 10.1111/j.1574-6968.2008.01414.x.Search in Google Scholar PubMed
[67] Kyoto Encyclopedia of Genes and Genomes (KEGG) Enzyme. KEGG enzyme database; Kyoto University; https://www.genome.jp/kegg/annotation/enzyme.html. 2024. Accessed: 25-April-2024.Search in Google Scholar
[68] Dunyak BM, Gestwicki JE. Peptidyl-proline isomerases (PPIases): targets for natural products and natural product-inspired compounds. J Med Chem. 2016;59(21):9622–44. 10.1021/acs.jmedchem.6b00411.Search in Google Scholar PubMed PubMed Central
[69] Kishikawa JI, Ishikawa M, Masuya T, Murai M, Kitazumi Y, Butler NL, et al. Cryo-EM structures of Na + -pumping NADH-ubiquinone oxidoreductase from Vibrio cholerae. Nat Commun. 2022;13(1):4082. 10.1038/s41467-022-31718-1.Search in Google Scholar PubMed PubMed Central
[70] Bourgeois CF, Mortreux F, Auboeuf D. The multiple functions of RNA helicases as drivers and regulators of gene expression. Nat Rev Mol Cell Biol. 2016;17(7):426–38. 10.1038/nrm.2016.50.Search in Google Scholar PubMed
[71] MetaCyC. MetaCyC metabolic pathway database; SRI International; https://metacyc.org/. 2024. Accessed: 25-April-2024.Search in Google Scholar
[72] Nallamotu KC, Bahadur R, Kaul M, Reddy M. Peptidoglycan remodeling by an L,D-transpeptidase, LdtD during cold shock in Escherichia coli. J Bacteriol. 2023;205(1):e00382–22. 10.1128/jb.00382-22.Search in Google Scholar PubMed PubMed Central
© 2025 the author(s), published by De Gruyter
This work is licensed under the Creative Commons Attribution 4.0 International License.
Articles in the same Issue
- Research Articles
- Optimization of sustainable corn–cattle integration in Gorontalo Province using goal programming
- Competitiveness of Indonesia’s nutmeg in global market
- Toward sustainable bioproducts from lignocellulosic biomass: Influence of chemical pretreatments on liquefied walnut shells
- Efficacy of Betaproteobacteria-based insecticides for managing whitefly, Bemisia tabaci (Hemiptera: Aleyrodidae), on cucumber plants
- Assessment of nutrition status of pineapple plants during ratoon season using diagnosis and recommendation integrated system
- Nutritional value and consumer assessment of 12 avocado crosses between cvs. Hass × Pionero
- The lacked access to beef in the low-income region: An evidence from the eastern part of Indonesia
- Comparison of milk consumption habits across two European countries: Pilot study in Portugal and France
- Antioxidant responses of black glutinous rice to drought and salinity stresses at different growth stages
- Differential efficacy of salicylic acid-induced resistance against bacterial blight caused by Xanthomonas oryzae pv. oryzae in rice genotypes
- Yield and vegetation index of different maize varieties and nitrogen doses under normal irrigation
- Urbanization and forecast possibilities of land use changes by 2050: New evidence in Ho Chi Minh city, Vietnam
- Organizational-economic efficiency of raspberry farming – case study of Kosovo
- Application of nitrogen-fixing purple non-sulfur bacteria in improving nitrogen uptake, growth, and yield of rice grown on extremely saline soil under greenhouse conditions
- Digital motivation, knowledge, and skills: Pathways to adaptive millennial farmers
- Investigation of biological characteristics of fruit development and physiological disorders of Musang King durian (Durio zibethinus Murr.)
- Enhancing rice yield and farmer welfare: Overcoming barriers to IPB 3S rice adoption in Indonesia
- Simulation model to realize soybean self-sufficiency and food security in Indonesia: A system dynamic approach
- Gender, empowerment, and rural sustainable development: A case study of crab business integration
- Metagenomic and metabolomic analyses of bacterial communities in short mackerel (Rastrelliger brachysoma) under storage conditions and inoculation of the histamine-producing bacterium
- Fostering women’s engagement in good agricultural practices within oil palm smallholdings: Evaluating the role of partnerships
- Increasing nitrogen use efficiency by reducing ammonia and nitrate losses from tomato production in Kabul, Afghanistan
- Physiological activities and yield of yacon potato are affected by soil water availability
- Vulnerability context due to COVID-19 and El Nino: Case study of poultry farming in South Sulawesi, Indonesia
- Wheat freshness recognition leveraging Gramian angular field and attention-augmented resnet
- Suggestions for promoting SOC storage within the carbon farming framework: Analyzing the INFOSOLO database
- Optimization of hot foam applications for thermal weed control in perennial crops and open-field vegetables
- Toxicity evaluation of metsulfuron-methyl, nicosulfuron, and methoxyfenozide as pesticides in Indonesia
- Fermentation parameters and nutritional value of silages from fodder mallow (Malva verticillata L.), white sweet clover (Melilotus albus Medik.), and their mixtures
- Five models and ten predictors for energy costs on farms in the European Union
- Effect of silvopastoral systems with integrated forest species from the Peruvian tropics on the soil chemical properties
- Transforming food systems in Semarang City, Indonesia: A short food supply chain model
- Understanding farmers’ behavior toward risk management practices and financial access: Evidence from chili farms in West Java, Indonesia
- Optimization of mixed botanical insecticides from Azadirachta indica and Calophyllum soulattri against Spodoptera frugiperda using response surface methodology
- Mapping socio-economic vulnerability and conflict in oil palm cultivation: A case study from West Papua, Indonesia
- Exploring rice consumption patterns and carbohydrate source diversification among the Indonesian community in Hungary
- Determinants of rice consumer lexicographic preferences in South Sulawesi Province, Indonesia
- Effect on growth and meat quality of weaned piglets and finishing pigs when hops (Humulus lupulus) are added to their rations
- Healthy motivations for food consumption in 16 countries
- The agriculture specialization through the lens of PESTLE analysis
- Combined application of chitosan-boron and chitosan-silicon nano-fertilizers with soybean protein hydrolysate to enhance rice growth and yield
- Stability and adaptability analyses to identify suitable high-yielding maize hybrids using PBSTAT-GE
- Phosphate-solubilizing bacteria-mediated rock phosphate utilization with poultry manure enhances soil nutrient dynamics and maize growth in semi-arid soil
- Factors impacting on purchasing decision of organic food in developing countries: A systematic review
- Influence of flowering plants in maize crop on the interaction network of Tetragonula laeviceps colonies
- Bacillus subtilis 34 and water-retaining polymer reduce Meloidogyne javanica damage in tomato plants under water stress
- Vachellia tortilis leaf meal improves antioxidant activity and colour stability of broiler meat
- Evaluating the competitiveness of leading coffee-producing nations: A comparative advantage analysis across coffee product categories
- Application of Lactiplantibacillus plantarum LP5 in vacuum-packaged cooked ham as a bioprotective culture
- Evaluation of tomato hybrid lines adapted to lowland
- South African commercial livestock farmers’ adaptation and coping strategies for agricultural drought
- Spatial analysis of desertification-sensitive areas in arid conditions based on modified MEDALUS approach and geospatial techniques
- Meta-analysis of the effect garlic (Allium sativum) on productive performance, egg quality, and lipid profiles in laying quails
- Review Articles
- Reference dietary patterns in Portugal: Mediterranean diet vs Atlantic diet
- Evaluating the nutritional, therapeutic, and economic potential of Tetragonia decumbens Mill.: A promising wild leafy vegetable for bio-saline agriculture in South Africa
- A review on apple cultivation in Morocco: Current situation and future prospects
- Quercus acorns as a component of human dietary patterns
- CRISPR/Cas-based detection systems – emerging tools for plant pathology
- Short Communications
- An analysis of consumer behavior regarding green product purchases in Semarang, Indonesia: The use of SEM-PLS and the AIDA model
- Effect of NaOH concentration on production of Na-CMC derived from pineapple waste collected from local society