Spatial analysis of desertification-sensitive areas in arid conditions based on modified MEDALUS approach and geospatial techniques
-
Ibraheem A. H. Yousif


Abstract
Desertification is one of the greatest environmental issues affecting sustainable development and food security in arid and semi-arid regions. Due to the dry conditions and dependence on groundwater as the main irrigation source, the West El-Minya region of Egypt is particularly susceptible to the increasing hazards of desertification. This research study aims to evaluate and map the environmentally sensitive areas (ESAs) to desertification in this study region using the modified Mediterranean Desertification and Land Use Model (MEDALUS) approach supported by sophisticated geospatial techniques. The model was utilized as a case study in the West El-Minya region of Egypt, covering an area of 447.12 km2 (44712.54 ha). The five thematic quality indices of soil (SQI), geomorphology (GQI), climate (CQI), vegetation (VQI), and management (MQI) were characterized through the analysis of satellite images, climatic data, field observations, and soil samples taken from 150 soil profiles. All these indices were integrated in a geographical information system (GIS) framework for ESAs in relation to desertification. According to the model, the findings indicated that the whole area (100%) is within the Critical type of ESA, with no area being assessed as the “Non-Affected” or “Fragile” or “Potential” type. A total of 84.79% (37911.99 ha) of the study area is classified as Critical sub-type 2, while 12.74% (5698.51 ha) and 2.46% (1102.04 ha) are classified as sub-type 3 and sub-type 1, respectively. This is mainly due to the arid climatic conditions and very low vegetation cover, with a strongly negative impact on the study area. The results of the study confirm the urgent need to develop integrated policies for managing natural resources. This study illustrates an innovative application of the MEDALUS model with the addition of geomorphological parameters and applies it in an under-researched area of Egypt. It also presents an explicit spatial assessment that can be utilized to support policy decision-making for land degradation mitigation and sustainable land management.
1 Introduction
Desertification is one of the main ecological challenges confronting the world today, directly harming more than 250 million people, while more than 1 billion people in about 110 countries are at risk of its negative impacts [1]. Desertification is the term used to describe the degradation of land in arid, semi-arid, and dry sub-humid regions due to human activity and climate changes, which results in decreased soil productivity and biodiversity loss [2]. Desertification also plays a role in rising rates of poverty, environmental displacement, and dwindling global food security [1,3]. Desertification affects farmers and rural communities’ lives by reducing agricultural productivity and degrading soil fertility [4]. Additionally, the loss of vegetation cover results in higher greenhouse gas emissions, exacerbating climate change [5]. Socially, desertification is linked to more disputes over natural resources and environmental migration, especially in regions with high rates of poverty and water scarcity [6]. Since desertification is closely related to Goal 15: Life on Land, which seeks to rehabilitate degraded lands and encourage sustainable management of ecosystems, the United Nations gives combating desertification particular priority within its Sustainable Development Goals (SDGs) [7]. Since land degradation is made worse by sharp temperature increases and decreasing rainfall, desertification is also related to Goal 13: Climate Action [8].
A significant barrier to sustainable development in many arid, semi-arid, and sub-humid countries is desertification. Desertification is a complicated and dynamic land degradation process in arid regions [9]. The Mediterranean region is thought to be among those most impacted by desertification as a result of deforestation, climate change, and the unsustainable use of natural resources [10]. A region is classified as arid if its Aridity Index (AI) is less than 0.65. This includes semi-arid (AI, 0.5–0.2), sub-humid (AI, 0.65–0.5), arid (AI, 0.2–0.05), and hyper-arid (AI, <0.05) zones [11]. Consequently, the process of land degradation known as desertification takes place in arid, semiarid, and sub-humid conditions [12]. Food insecurity and drought intensity are increased by desertification [13]. Therefore, researching desertification via environmental policies improves the ecological circumstances of the dry areas and supports sustainable development worldwide [14]. Water availability is considered the primary factor of the desertification process that occurs in arid and semi-arid regions [15,16]. The prediction of desertification in environmentally sensitive areas (ESAs) is essential to sustainable development because it signals the start of degradation processes so that appropriate, resilient solutions can be implemented in a timely manner [17].
Egypt is among the countries most impacted by desertification since it is located in the arid and semi-arid region, with over 96% of its land covered by desert. As a result, it is vulnerable to land degradation brought on by both human activity and climate influences [18]. Over 166,000 km2 or 16.6% of Egypt was covered by active dunes and sand invasion as a result of active winds, erratic rainfall, soil instability, and scarcity of vegetation cover, which makes an imbalance in the environment [19]. Both natural and human activities have a significant impact on land degradation, either positively or negatively. In Egypt, agriculture is a main sector of the economy, so new lands in desert areas were transferred to agricultural land by reclamation activities. Lately, increased soil salinity, depleting groundwater supplies, and random urban expansion on agricultural lands have all contributed to Egypt’s desertification issue [20]. Because of their fragility and sensitivity to desertification, these Egyptian new lands’ agricultural productivity growth is gradual and takes considerable time [21]. Area per capita declines as a result of the tremendous strain that a continuously expanding population places on already occupied areas [22]. It is a common phenomenon that impacts one billion people across over 90 countries [23]. Desertification increased due to the interference and interplay of various factors, such as changes in land use, land cover, physical and natural human activities, and climate [24]. West Minya region in Egypt is considered one of the most promising areas for future development plans, and it is the most arid region that is susceptible to reclamation based on groundwater extraction through drilled wells [25]. However, the investigated area is more vulnerable to desertification because it is regarded as an arid zone [9].
The United Nations Sustainable Development Goals (SDGs) have set the objective of eradicating desertification and land degradation by 2030. Specifically, SDG 15. Therefore, to comprehend land problems and identify the underlying causes, it is crucial to map and evaluate ESAs in order to achieve the SDGs related to land [26]. Field-based research is an important method to evaluate desertification and degradation. The combination of field-based research, GIS tools, and remote sensing methods is thought to be an excellent tool to evaluate and track the dynamics of dry regions [25]. Compared to field-based research, remote sensing is a more efficient and effective method to map land degradation [25,27,28]. In previous years, many models with various approaches and techniques have been suggested to map and evaluate land degradation and desertification, such as anthropogenic and spectral biophysical indicators [29], drought assessment [30], climate and vegetation indices [31], soil indices [32], or vegetation indexing [33].
The Mediterranean Desertification and Land Use (MEDALUS) methodology was developed by Kosmas et al. [10] to precisely identify desertification-vulnerable areas at various scales and to detect even the smallest changes in desertification variables by examining and integrating the four qualities of vegetation, soil, climate, and management [34]. The MEDALUS is one of the most popular approaches for analyzing land sensitivity to desertification, which has been applied in many international studies over the last 25 years since its establishment due to its simplicity, ease of use, adaptability, and quick implementation [35]. The MEDALUS model has been successfully used in numerous studies at various places worldwide to monitor and evaluate the sensitive lands to desertification/degradation, e.g., Egypt [36], Romania [35], Italy [37], Malaysia [38], Nigeria [39], Thailand [40], India [41], Moreover, MEDALUS has been used recently on a wide scale in Central Asia for an area of almost 4 million km2 [42] and in central and southeastern parts of Europe covering nearly 2 million km2 [43]. This research is different in methodology and geographical scope from our earlier research. Whereas our earlier works touched upon land evaluation in regions outside the Western Desert, the present research employs an adapted MEDALUS methodology complemented with morphological indices – slope, plan curvature, and profile curvature – and targets West El-Minya, a desert margin region of strategic value for present land reclamation efforts in Egypt. This region is not yet explored with this state-of-the-art methodology, hence presenting new spatial information of value to decision-makers dealing with land degradation in arid environments.
The investigated area of the West El-Minya region presents a particularly complicated context for land desertification sensitivity evaluation because it is a newly reclaimed zone in an arid environment. Significant obstacles include low plant cover, low soil quality, limited historical land use data, and high spatial variability in soil and geomorphological parameters. Furthermore, the lack of a permanent population and infrastructure hampers the assessment of management procedures. To address these constraints, this study uses a modified MEDALUS framework that includes a Geomorphological Quality Index (GQI) along with standard indices, allowing for more sophisticated geographical analysis. The model also includes a sub-classification of crucial zones (C1, C2, and C3), which allows for realistic prioritization of intervention areas and provides a scalable methodology for additional arid regions in the initial stages of development.
Although the MEDALUS model has been widely employed in Mediterranean and semi-arid environments, there is a distinct paucity of research that applies or adapts it to arid, newly reclaimed areas like West El-Minya. Standard indicators may fail to completely represent desertification trends in such areas due to extreme environmental conditions and a lack of long-term land use data. Furthermore, most previous research did not use geomorphological terrain factors or attempt to subclassify highly sensitive zones for targeted intervention. Therefore, the purpose of this research study is to use geospatial analyses in conjunction with general and local knowledge of environmental processes and modified, MEDALUS to assess and map environmentally sensitive areas (ESA) for desertification in the west of the El-Minya region, Egypt which is regarded as one of the important areas for land reclamation and agricultural development projects. Moreover, to improve spatial prioritization through sensitive zones sub-categorization, which is very important to support sustainable land use planning in early-stage development areas.
2 Materials and methods
2.1 Study area
The investigated area is located in the western part of El-Mina governorate, Egypt, and extends over about 44712.54 ha (Figure 1). It is situated at latitudes 27°38′06″ and 27°47′19″ N and longitudes 30°10′13″ and 30°29′51″ E. The area under investigation is classified as having an arid climate because of its hot summers, warm winters, low levels of precipitation, and high rate of evaporation. June through August are the warmest months, with an average temperature of might reach to 30.2°C. According to the El-Minya governorate’s meteorological station, the average temperature during December and February is 12.9°C, making it the coldest time of year. About 28 mL of precipitation falls on average each year [44]. Special permits were not required for field site access or research activities because the study was conducted on publicly accessible property and did not include interactions with regulated species or ecosystems.

Location maps of the investigated area (Sentinel-2A image).
2.2 Remote sensing and GIS work
One scene (T36RTR) of Sentinel-2A Multispectral Instrument (MSI) sensor satellite was obtained via the Copernicus Data Hub gateway in April 2024, with a spatial resolution of 10 m (https://www.copernicus.eu/en/access-data/conventional-data-access-hubs). Additionally; a digital elevation model (DEM) of the Advanced Space-borne Thermal Emission and Reflection Radiometer (ASTER) with a pixel size of 30 m was downloaded from the USGS (https://earthexplorer.usgs.gov/). The Planchon and Darboux algorithms were used to correct a digital elevation model (DEM) with a resolution of 30 m [45]. Using SAGA GIS software, DEM was utilized to obtain topographic features like slope, aspect, curvature, and hill shading. Specifically, the reclassified parameters included a combination of small continuous portions and stand-alone sections on the DEM’s transition zones between classes. A straightforward filter based on focus neighborhood statistics was used to cut down on errors and noise. To address this problem, a filter was applied to the parameter layers using the focus neighborhood statistics. For the majority focus statistic, the moving window’s center pixel was selected to be the value that was most common in the targeted neighborhood. For the mean focal statistic, the average value of the designated neighborhood pixels was assigned to the moving window’s center pixel [46]. Sentinel 2 image, DEM with 30 m resolution, and field surveys were incorporated to improve the visibility of the geomorphological map generated using the approach produced by Dobos et al. [47].
2.3 Field and laboratory work
A total of 150 geo-referenced soil profiles (Figure 1) were excavated down to the permanent groundwater table, which is 150 cm deep. FAO [48] states that the general characteristics of each profile were widely observed. Samples of soil were taken from the horizons that followed. Three 1 kg duplicates at each depth were combined into a single composite sample, stored in polyethylene bags, and brought to the lab. Samples of soil were ground, allowed to air dry, then sieved through a 2 mm sieve screen and stored for analysis. Analysis of the soil was done in accordance with the Soil Survey Staff [49].
2.4 Geostatistical analysis
Assessing and mapping the spatial variation of soil properties is essential for precision farming to maintain the sustainability of the soil and plants [50]. The Inverse Distance Weighted (IDW) Interpolation technique, Arc GIS10.8.1 software, was used to spatially distribute the features of the soil. The IDW has been accurately used in many soil and ecological studies to estimate the spatial distribution of environmental properties, especially in arid and semi-arid regions and when field data are sparse or irregularly distributed, like the spatial distribution of soil properties [51,52], modeling desertification and degradation indicators [17,53,54], and soil moisture [55,56]. IDW method was selected for the spatial interpolation of various data sets based on the findings of Moran’s I spatial autocorrelation test. With a p-value of 0.12 and a Moran’s I ≈ 0.1, the test revealed a weak spatial autocorrelation in the sample. Since IDW does not require a predetermined variogram model and is based on the premise that local points have a stronger influence than distant ones, it is appropriate when spatial dependence is weak [57]. On the other hand, when Moran’s I > 0.3 with p < 0.05, suggesting high spatial dependence, geostatistical techniques like Kriging are preferred. The values of the sample data points near each cell were averaged to estimate the grid cell values, assuming that each sample point has a local influence that diminishes with distance (the points nearer the processing cell are more heavily weighted than those farther away). A power of two was selected in order to draw attention to the nearest spots and enhance the final surface with more information [58]. A variable radius based on the number of neighboring points was used, as previous studies have shown that the variable radius improves the interpolation accuracy in contrast to using a fixed radius [57].
2.5 Desertification modeling in the investigated area
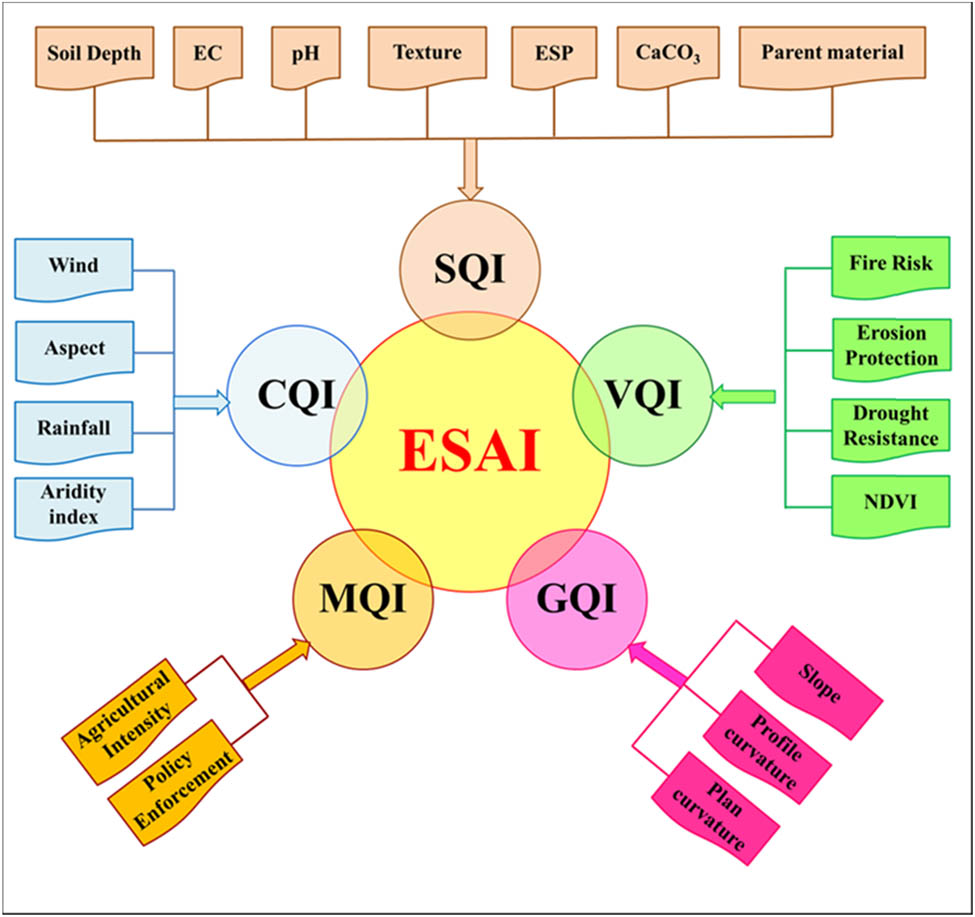
The MEDALUS framework, created by the European Commission and now one of the most popular models for assessing desertification, serves as the foundation for the technique employed in this study. A number of fundamental indicators unique to the original ESA (environmentally sensitive areas) procedure form the basis of the MEDALUS methodology employed in this study, as illustrated in Figures 2 and 3. These indicators include the Soil Quality Index (SQI), the Climate Quality Index (CQI), the Vegetation Quality Index (VQI), the Geomorphological Quality Index (GQI), and the Management Quality Index (MQI) [10]. Each class’s weight values range from 1 (least susceptible to desertification) to 2 (most sensitive to desertification), where 1 and 2 denote relative susceptibility [10]. As shown in Figure 3, all the model’s quality indexes, including the final index for the ESAs, were created geometrically using a model builder in a geographical information system (GIS) using raster maps.
The Flowchart of the MEDALUS methodology used in this study.

The structure of MEDALUS model based on model builder in ArcGIS.
The selection of parameters and their class weights for each quality index (SQI, VQI, CQI, GQI, MQI) were based on the original MEDALUS methodology and earlier adaptations in arid and semi-arid regions (e.g., [10,17,25,53,59]). These studies provided a consistent and validated basis for parameter thresholds. Several parameter classification schemes were tested during the initial modeling phase and observed less than 5% variation in overall ESAI classification when slightly modifying input thresholds. Therefore, the present parameter sets were maintained for consistency and comparability. A full sensitivity analysis of parameters is suggested for future work, as it needs additional simulations and computational resources beyond the scope of this study.
2.5.1 Soil quality index (SQI)
The SQI plays a major role in the desertification process, which influences the soil’s texture, structure, water retention ability, and particle cohesiveness [52,60,61]. The different parameters used for soil quality index (SQI) were rated and classified as shown in Table S1. The SQI is calculated according to the original model using the following equation [1]:
where
2.5.2 Vegetation quality index (VQI)
When assessing desertification in semiarid regions, vegetation cover is a crucial biotic land component [62]. By encouraging water infiltration, vegetation cover lowers runoff. Additionally, the vegetation cover increases the surface soil’s structure and cohesiveness, adds organic matter, and has a strong ability to lessen the severity of soil erosion [63]. Three distinct indicators drought resistance, fire risk, and plant cover were used in this study to evaluate the VQI. The plant cover indicator was taken from the normalized difference vegetation index (NDVI) [64]. This dimensionless indicator indicates the amount and density of vegetation. Equation (2) illustrates this based on the simulated red and NIR reflectance.
where NIR is the near infrared band, and R is the red band
The different parameters used for the vegetation quality index (VQI) were rated and classified as presented in Table S2. The VQI was processed/obtained based on the geometric mean of the parameters’ score values, using the following formula [3]:
where
2.5.3 Climate quality index (CQI)
The spatiotemporal distribution of precipitation and evapotranspiration is the most important factor in hydrology and ecology [65]. Precipitation has a significant effect on desertification and land degradation since it influences runoff and soil water content [62]. Because southern slopes receive more sunlight than northern ones, they have higher evapotranspiration, lower humidity, and, implicitly, less developed vegetation that leaves lands vulnerable to wind and water erosion. These variations in land humidity also affect vegetation development, which in turn affects land sensitivity to degradation [10,60,66]. NE and NW were chosen for this study to emphasize higher humidity, whereas SE and SW (Figure 4a) areas were understood as denoting lower humidity [43]. The different parameters used for the climate quality index (CQI) were rated and classified as illustrated in Table S3. The CQI was determined using four indicators: Rainfall, the aridity index, Aspect, and Wind speed using the following formula [4]:
where

Topographical analysis of the studied area: (a) aspect, (b) slope gradient, (c) plan curvature, and (d) profile curvature.
2.5.4 Geomorphological quality index (GQI)
This study was supplemented with the GQI indicator, which was first developed for Romania and, as far as we know, globally, to capture geomorphological features that directly or indirectly contribute to the vulnerability of the land to the process of degradation [35]. The incorporation of the Geomorphological Quality Index (GQI) improves the original MEDALUS model by better reflecting the physical landforms that influence degradation risk in arid environments. This change improves the model’s local relevance and has been verified in similar Mediterranean and North African settings. Three morphometric factors that were judged significant slope, plan curvature, and profile curvature (Figure 4b–d) were processed to produce this indicator. In essence, the three morphological variables included in the GQI processing show several ways that lands might be subject to erosion and, indirectly, degradation. The slope, a SQI parameter in the traditional MEDALUS model, highlights how the degree of slope steepness increases the intensity of hydric erosion. Sectors for convergent runoff (for negative values) are exposed to faster surface runoff than diverging sections, making them more vulnerable to hydric erosion. (for positive values), as indicated by plan curvature, which displays the horizontal slope curvature degree [67,68]. Profile curvature, which measures the slope curvature degree vertically, is associated with a higher propensity for soil erosion for convex slopes (negative values), which are affected by faster, more forceful runoff, contrary to concave slopes (positive values), which imply a slower rate of runoff [67,68]. The different parameters used for the geomorphological quality index (GQI) were rated and classified as shown in Table S4. The following formula (5) was used to process and obtain the GQI according to the geometric mean of the score values for the parameters:
where
2.5.5 Management quality index (MQI)
The Management Quality Index is an important tool used to evaluate anthropogenic stress on the environment. It can be analyzed from two points of view: the intensity of anthropogenic activity (i.e., croplands, grazing, natural, and mineral extraction) and agricultural policies intended to improve restrictive environmental circumstances [10]. Given the specificity of the study area and the limited availability of data, the analysis of human activity density was considered representative of this indicator, especially horizontal agricultural expansion activity and agricultural management policies in the region. Therefore, the agricultural intensity was assessed by classifying the land use data extracted from the NDVI (Table S5). The predominant land use in the examined area was field crops and some vegetable crops, while the rest of the study area was barren land. Furthermore, based on the reclassification of the CORINE nomenclature, a general assessment of the second parameter categories (agricultural management policies) (Table S5) was made, according to local techniques to increase the productivity of the agricultural system, or to ensure protection against land degradation/erosion. Finally, the MQI was processed/obtained based on the geometric mean of the parameters’ score values, using the following formula [6]:
where
2.5.6 Environmental sensitivity area index (ESAI)
The degree of sensitivity to desertification, ESAI, is determined by combining various indices according to the model provided by equation (7). The ESAI has a value between 1 and 2. Every variable has no dimensions. Based on processing and obtaining the five quality indicators, the ESAI was obtained in the end using the following formula [7]:
The original thresholds suggested in the MEDALUS technique, which establishes four major classes and eight sub-classes for land sensitivity to degradation, were used in the final ESAI analysis as illustrated in Table S6.
Classification of ESAI values into sub-types C1, C2, and C3 was created based on modified thresholds tested and validated for arid and semi-arid contexts as per Prăvălie et al. [59] and Abuzaid [53]. The thresholds have been applied in Egypt and other parts of the Mediterranean to enhance spatial accuracy in desertification-sensitive regions.
3 Results and discussion
3.1 Geomorphological units of the study area
Five distinct geomorphological units (gravelly alluvial plain, high terraces, basin, low terraces, and moderately High terraces) were derived to represent the different landforms in the studied area (Table 1 and Figure 5). Each of these landforms was confirmed through field GPS surveys. Subsequently, the resulting landform map was used as a base map, where every geomorphic unit displayed homogeneous inherent characteristics.
Areas of land from units and representative soil profiles
| Name | Area (ha) | % | Profile No |
|---|---|---|---|
| Gravelly alluvial plain | 8481.85 | 18.97 | 28 |
| High terraces | 4991.42 | 11.16 | 17 |
| Basin | 3475.35 | 7.77 | 10 |
| Low terraces | 14422.83 | 32.26 | 50 |
| Moderately High terraces | 13341.09 | 29.84 | 45 |
| Total | 44712.54 | 100 | 150 |

Landform map and geographical soil profile distribution.
3.2 Soil properties
The descriptive statistical analysis results of soil properties showed a wide range of variations among the different landform units, as shown in Table 2. With values ranging from 40 to 150 cm and a mean of 85.40 cm, the results demonstrated that the soil depth varied from shallow to deep, as indicated in Table 2. Additionally, the spatial heterogeneity of the soil depth throughout the research region is shown in Figure 6a. The soils were categorized as coarse-textured soils, namely sandy soils, loamy sand, and sandy loam, based on the USDA soil texture triangle. The mean soil reaction (pH) was 8.08, with a range of 6.70 to 8.42 (Figure 6b). It is well recognized that the pH of soil affects its chemical, biological, and physical characteristics [50,51,69]. There are both high-salinity and non-saline soils in this region since the electrical conductivity (EC) values varied from 1.70 to 15.30 dS m−1, with a mean value of 5.09 dS m−1 (Table 2 and Figure 6c). Drylands are where most salinized soils are found because of the high evaporation rates and arid environments [70,71]. Leaching high-salinity soils requires high-quality water [72,73]. Also, the results showed that the soil calcium carbonate (CaCO3) varied significantly across the study area, ranging between 2.75% (low) and 60% (high), with a mean of 15.53% (Table 2 and Figure 6d) The presence of parent materials rich in shell fragments is linked to the highest values of it. The exchangeable sodium percentage (ESP) varied from 5.92 to 16.55%, with a mean of 11.60% (Figure 6e). Crop yield may suffer because of the detrimental effects of high ESP content on soil hydrology and structure [25,52]. Some soil parameters, such as pH and ESP, exhibit minimal variability (C.V. < 15%), according to the coefficient of variation (C.V.) values. Whereas EC and calcium carbonate exhibit substantial variability (Table 2), soil depth exhibits moderate variability (C.V. = 15–35%). The soil properties under investigation had standard deviations (Std. D.) ranging from 0.16 for soil pH to 27.36 for soil depth.
Descriptive statistics of the studies soil properties. (n = 150)
| Soil property | Min. | Max. | Mean | Std. D. | CV (%) | Skewness | Kurtosis |
|---|---|---|---|---|---|---|---|
| Moderately high terraces ( n = 45) | |||||||
| Soil depth (cm) | 40 | 150 | 85.33 | 30.20 | 35.39 | 0.88 | 0.24 |
| pH | 6.70 | 8.42 | 8.04 | 0.24 | 2.99 | −4.23 | 23.01 |
| EC (dS m−1) | 1.23 | 10.65 | 4.87 | 2.19 | 44.87 | 0.48 | 0.02 |
| CaCO3 (%) | 3.92 | 60.00 | 15.82 | 9.94 | 62.87 | 2.97 | 10.64 |
| ESP (%) | 5.92 | 14.33 | 11.40 | 1.45 | 12.73 | −1.33 | 4.33 |
| Low terraces ( n = 50) | |||||||
| Soil depth (cm) | 45 | 150 | 77.20 | 21.12 | 27.36 | 1.27 | 2.18 |
| pH | 7.30 | 8.29 | 8.08 | 0.13 | 1.58 | −4.65 | 28.70 |
| EC (dS m−1) | 1.25 | 12.23 | 5.27 | 2.40 | 45.55 | 0.63 | 0.63 |
| CaCO3 (%) | 7.38 | 40.75 | 15.05 | 6.06 | 40.27 | 1.98 | 5.81 |
| ESP (%) | 7.86 | 15.08 | 11.69 | 1.27 | 10.84 | 0.01 | 1.40 |
| High terraces ( n = 17) | |||||||
| Soil depth (cm) | 50 | 150 | 105.29 | 30.64 | 29.10 | 0.26 | −0.76 |
| pH | 7.96 | 8.16 | 8.06 | 0.05 | 0.63 | −0.16 | −0.11 |
| EC (dS m−1) | 0.79 | 8.77 | 4.43 | 2.09 | 47.23 | 0.28 | −0.17 |
| CaCO3 (%) | 5.29 | 21.38 | 14.36 | 4.89 | 34.04 | −0.41 | −1.06 |
| ESP (%) | 9.62 | 13.43 | 11.36 | 1.00 | 8.81 | 0.28 | −0.17 |
| Gravelly alluvial plain ( n = 28) | |||||||
| Soil depth (cm) | 40 | 150 | 92.86 | 27.16 | 29.25 | 0.27 | −0.79 |
| pH | 8.00 | 8.36 | 8.12 | 0.09 | 1.12 | 0.87 | 0.37 |
| EC (dS m−1) | 0.71 | 15.30 | 5.43 | 3.58 | 65.97 | 1.06 | 1.11 |
| CaCO3 (%) | 2.75 | 44.25 | 16.39 | 9.22 | 56.26 | 1.51 | 2.35 |
| ESP (%) | 9.58 | 16.55 | 11.83 | 1.71 | 14.47 | 1.06 | 1.11 |
| Basin ( n = 10) | |||||||
| Soil depth (cm) | 50 | 90 | 72.00 | 11.35 | 15.77 | −0.48 | 0.55 |
| pH | 8.05 | 8.30 | 8.16 | 0.08 | 0.99 | 0.40 | −0.84 |
| EC (dS m−1) | 3.18 | 8.40 | 5.33 | 1.73 | 32.37 | 0.41 | −0.61 |
| CaCO3 (%) | 8.00 | 33.00 | 16.28 | 6.90 | 42.36 | 1.71 | 3.75 |
| ESP (%) | 10.76 | 13.25 | 11.79 | 0.83 | 7.00 | 0.41 | −0.61 |
Min. is the minimum; Max. is the maximum; Std. D. is the standard deviation; C.V. is the coefficient of variation; EC is the electrical conductivity; ESP is the exchangeable sodium percent.

Spatial distribution of some soil properties: (a) soil depth, (b) soil pH, (c) soil EC, (d) calcium carbonate, and (e) ESP.
3.3 Desertification quality indices
According to the findings, there are significant variations in the vulnerability of land to desertification depending on a number of quality indicators, such as soil (SQI), vegetation (VQI), climate (CQI), geomorphology (GQI), and management (MQI). Results at the local level, derived from the construction of the various quality indices previously described, are shown in Figures 7–13. As a percentage (%) of the quality classes, Figure 14 displays the retrieved spatial distributions for each quality indicator taken into consideration in this study.
3.3.1 Soil quality index (SQI)
The index of soil quality is an indicator of environmental quality, food security, water–plant–animal–human health, as well as economic viability. The Soil Quality Index, as shown in Figure 7, was obtained by applying equation (1) using seven sub-indices, namely soil depth, EC, pH, texture, ESP, CaCO3, and parent material. In our study area, the SQI ranged between 1.2 and 1.6 (Figure 7), suggesting that most of the study area, 41294.64 ha, (92.36%) is in moderate soil quality class, while a small percentage (7.64%), 3417.90 ha, appears to be of low soil quality, as shown in Table 3 and Figure 14. This is because of the coarse texture (loamy sand, sandy loam, and sand). These soils’ physical characteristics, such as their low nutrient levels, high permeability, poor water holding capacity, and lack of structure or weak structure, are extremely vulnerable to compaction and consequently more sensitive to desertification [74,75]. These findings are in line with previous research studies [17,25,76,77], which underlined that soil is a critical component in influencing the sensitivity of land to desertification. The soil quality index was higher in the north of the western desert region due to the high soil quality class predominating there [61,78]. Furthermore, the findings demonstrated that soil salinity is a significant issue in the investigated region, with salinity levels reaching 15.3 dS m−1 in some areas, which impairs plant absorption of nutrients and water, and has negative effects on agricultural production [25,52,79]. In addition to the accumulation of calcium carbonate in some areas, with a rate of up to 60%, it also hinders plant root penetration and affects soil structure, drainage, and water and nutrient availability [25,75,77].

Spatial distribution of soil quality index (SQI).
Classes and areas of the original indices used in the MEDLAUS methodology
| Indicator | Class | Quality | Range | Area (ha) | Area (%) |
|---|---|---|---|---|---|
| SQI | 1 | Moderate | 1.13–1.45 | 41294.64 | 92.36 |
| 2 | Low | >1.45 | 3417.90 | 7.64 | |
| VQI | 1 | High | 1.2–1.4 | 2699.44 | 6.04 |
| 2 | Moderate | 1.4–1.6 | 14867.79 | 33.25 | |
| 3 | Low | >1.6 | 27145.31 | 60.71 | |
| CQI | 1 | Moderate | 1.25–1.5 | 8302.40 | 18.57 |
| 2 | Low | >1.5 | 36410.14 | 81.43 | |
| GQI | 1 | High | <1.28 | 36770.52 | 82.24 |
| 2 | Moderate | 1.28–1.48 | 7942.01 | 17.76 | |
| MQI | 1 | Moderate | 1.15–1.81 | 24846.61 | 55.57 |
| 2 | Low | >1.81 | 19865.93 | 44.43 |
3.3.2 Vegetation quality index (VQI)
The VQI was determined using equation (3) by combining the four sub-indicators, namely fire danger, erosion protection, drought resistance, and NDVI. The NDVI was determined in April of 2024 from Sentential-2 image, as shown in Figure 8. The findings showed that NDVI values ranged between −0.06 (low) and +1 (high). The vegetation in West El-Mina is classified as agricultural land that is mostly used for field (permanent or annual) crops. It does not contain any forest habitats, according to the Corine Land Cover classification [44].

NDVI of the investigated area.
One of the most crucial elements in determining the degree of susceptibility to desertification is VQI. Erosion dominates sloping fields when biomass declines, and plant cover falls below 40% [80]. According to the findings, the VQI is divided into three classes: high, moderate, and low quality, overwhelming the research area, which spans 27145.31 km2, in the low quality class, as shown in Figure 9.

Spatial distribution of vegetation quality index (VQI).
As a result, vegetation has a moderate risk of fire and generally low resistance to erosion and drought. The VQI ranged between 1.2 and 1.68 (Figure 9), indicating that there are no places in the high-quality class and that roughly 60.71% (27145.31 ha) of the vegetation in the area is low-quality, characterized by crops, and 33.25% (14867.79 ha) is of a moderate vegetation quality type, primarily corresponding to natural grassland (Figure 14). Generally, the conditions for vegetation are poor due to the arid environment and the soil’s salinity and alkalinity. Because of the high concentration of saline and alkaline soil, the regions in the very high desertification class are devoid of vegetation [64]. These results are in line with the conclusions of many studies that have demonstrated that low vegetation cover in arid locations speeds up desertification because it reduces shading and lowers the amount of organic matter in the soil [77,81–83], which makes the soil less resistant to erosion. Additionally, vegetation prevents soil erosion, and its loss in arid areas causes topsoil loss and lowers agricultural productivity.
3.3.3 Climate quality index (CQI)
Desertification is a complicated degradation dynamic system and one of the biggest environmental threats in the dry lands, especially in Western Desert of Egypt. The CQI ranged from 1.68 to 2 (Figure 10), suggesting that low climate quality was present in 81.43% (36410.14 ha) of the examined area, and 18.57% (8302.40 ha) was moderate climate quality (Figure 14). This is brought on by high evapotranspiration rates and infrequent, low yearly rainfall. Due to these climatic factors, the entire region’s terrain is unstable and susceptible to desertification. According to Kosmas [10], biomass production is determined by evapotranspiration and precipitation (amount and distribution). Unless provided by sufficient irrigation water, low rainfall combined with high evapotranspiration rates lowers the soil’s available water content, resulting in water stress [84]. On the other hand, runoff and sediment loss could be caused by an uneven distribution of precipitation throughout the year, particularly during the wet winter months [83,85]. The one that can influence the microclimate by controlling isolation, slope aspect, is also thought to be a critical component in land degradation.

Spatial distribution of climate quality index (CQI).
The findings of the study demonstrated that a significant contributing element to the soil’s increased susceptibility to desertification in the western Minya region is the climate. This is because of the high summer temperatures (above 30.2°C) and the precipitation rates, which dropped sharply to less than 28 mm/year. This resulted in higher rates of evapotranspiration, which in turn caused a drop in soil moisture, weak plant growth, and a higher risk of land desertification. These results are in line with many studies [10,86–88], which have claimed that arid settings in arid and Mediterranean regions with high temperatures, little precipitation, high evapotranspiration, and limited water supplies are more susceptible to desertification because they increase evaporation and cause poor soil stability.
3.3.4 Geomorphological quality index (GQI)
The geomorphological quality index ranged between 1 and 1.44 (Figure 11), suggesting that high geomorphological quality was present in 82.24% (36770.52 ha) of the examined area, while the moderate geomorphological condition covers 17.76% (7942.01 ha) of the studied area (Figure 14 and Table 3). This is because the flat topography in most of the examined area, as the common slope in the region is less than 6%, as shown in Figure 3b, which decreases the risk of water erosion. These results are in line with the previous studies that indicated that areas with low slopes are less susceptible to water erosion and therefore have higher geomorphological quality [10]. Due to the slope gradient is the main factor affecting the surface processes such as soil erosion, surface drainage, and geomorphological stability, the studied area is not at risk of severe water erosion. As for the pan and profile curvature, the study area is characterized by the presence of some areas with positive values, where the surface runoff speed is lower, which reduces the risk of water erosion. At the same time, there are also some areas with negative values, where the surface runoff speed is higher, which increases the risk of water erosion. This variation in the curvature of the earth surface contributed to improving the quality of the geomorphology index in the study area. These findings are in line with many previous studies [60,67,68].

Spatial distribution of geomorphological quality index (GQI).
3.3.5 Management quality index (MQI)
While the studied region is adjacent to the western desert and a large portion of the region is uncultivated land, one of the main causes of desertification in the region is unsustainable land management. Given that the MQI ranged from 1.38 to 1.79, the management quality was moderate to low (Figure 12 and Table 3). 55.57% (24846.61 ha) of the total area was made up of areas of moderate quality, whilst 44.43% (19865.93 ha) was made up of areas of low quality (Table 3). Due to insufficient enforcement of the environmental protection policy throughout the region, this geographical variance was mostly associated with the intensity of land use rather than protective policies. Population density and land-use intensity are primarily correlated, with the former placing strain on the latter through intense cultivation [89]. Therefore, MQI values were lower in the freshly reclaimed lands (in the western parts) due to low population density, and greater in the east of the research area due to high density. Accordingly, the region is in danger since poor management practices accelerate soil loss from wind and water erosion and have a detrimental impact on vegetation vigor and soil quality. These results are in line with several studies that have shown that inadequate agricultural planning and unsustainable soil and water use cause soil quality to deteriorate and desertification rates to rise in dry areas [10,25,77,89].

Spatial distribution of management quality index (MQI).
3.4 Desertification sensitivity index (DSI) evaluation
The studied area was categorized as a critically vulnerable to desertification based on the suggested model (Figure 13), as the ESAI ranged from 1.38 to 1.59. According to the spatial distribution of ESAs (Figure 14 and Table 4), the moderately-critical ESAs (C2) accounted for 84.79% (37911.99 ha) of the total area, which is only 2.46% (1102.04 ha) of the total coverage ESAs (C1), while the highly-critical ESAs (C3) occupied 12.74% (5698.51 ha) of the total area. High soil salinity and alkalinity, sparse vegetation, and wind erosion during the dry season are the primary causes of the study area’s high desertification sensitivity. Therefore, the results of this study could be utilized to advise decision-makers on improved land conservation and soil management. To lessen the damage, public authorities should take the necessary actions among these determining traits. The study findings showed that soil and climate have the greatest effects on the land susceptibility to desertification, which is in line with earlier research done in arid areas like the Middle East and North Africa [17,53,64,90]. However, our research revealed that natural forces had a greater impact than environmental management, underscoring the necessity of enhancing land reclamation techniques in dry lands.

Spatial distribution of desertification sensitivity index (DSI).

The quality index classes’ spatial distribution (%) throughout the study area.
Areas and classes of the investigated area’s DSI
| DSI | Range | Area (ha) | % |
|---|---|---|---|
| C1 (Critical 1) | 1.38–1.41 | 1102.04 | 2.46 |
| C2 (Critical 2) | 1.42–1.53 | 37911.99 | 84.79 |
| C3 (Critical 3) | >1.53 | 5698.51 | 12.74 |
| Total | 44712.54 | 100.00 | |
The entire study area was classified as “Critical ESAs” and divided into three sub-types C1, C2, and C3 to improve spatial and functional resolution:
C1 (Critical 1) areas are moderately critical zones with substantially better soil quality, lower salinity, and limited but functional plant cover. These areas may support sustainable farming practices provided urgent conservation measures are implemented, such as employing drought-tolerant crops, improving irrigation efficiency, and adding soil conditioners.
C2 (Critical 2) zones are extremely critical, with higher degrees of soil degradation, moderate to high salinity, low plant cover, and ineffective land management. These zones are unsuitable for direct farming without first undergoing rehabilitation measures such as soil amendment, erosion control structures, and afforestation.
C3 (Critical 3) zones are the most environmentally damaged, with barren or severely degraded vegetation and highly saline or sodic soil. They also suffer from severe wind erosion and a lack of long-term management. These areas are deemed unfit for productive land use and should be prioritized for urgent land restoration and environmental protection initiatives.
Importantly, land reclamation activities have already begun in parts of the region, including C1 and selected C2 zones. These initiatives include practical anti-desertification measures such as windbreak planting, the use of soil conditioners (e.g., compost, gypsum), and increased water efficiency. This proactive approach is consistent with the model’s recommendations and demonstrates the practical utility of the modified MEDALUS classification for guiding sustainable land use planning. In contrast, C3 areas are now unsuited for productive use and must be restored ecologically before any development can be considered. This hierarchical classification provides a useful tool for prioritizing reclamation activities based on degradation severity and rehabilitation feasibility.
4 Conclusions
Desertification is a complicated degradation dynamic system and one of the biggest environmental threats in the dry lands, especially in the Western Desert of Egypt. It was demonstrated by using an adjusted MEDALUS methodology in integration with satellite imagery and geospatial technologies, with field-based work. Essentially, the findings indicated that the whole study area (100%) is within the Critical type of ESA, with no area being assessed as the “Non-Affected” or “Fragile” or “Potential” type. A total of 84.79% (37911.99 ha) of the study area is classified as Critical subtype, 12.74% (5698.51 ha) as subtype 3, and 2.46% (1102.04 ha) as subtype 1. It can be concluded that the study area is identified as a very sensitive areas due to low and moderate soil quality, low climate conditions (high temperature and evapotranspiration), low and moderate vegetation quality (very low vegetation cover), and low and moderate management conditions. Consequently, it may be revealed that the present study emphasizes the West El-Minia region’s ongoing land desertification process as well as other similar regions at risk of desertification.
It is recommended that the proposed multi-criteria GIS modeling (i.e., MEDALUS), which considered many factors that are easy to execute and assess, be used globally, especially in recently reclaimed regions like the western desert of Egypt. Furthermore, it is critical to monitor and evaluate desertification in the Egyptian desert, especially in areas that show promise for land reclamation, to preserve these resources and combat desertification. This study could serve as a good beginning point for obtaining a deeper understanding of desertification in the West El-Minia region and focus on priorities for land protection and preservation. While the findings of this study provide a precise scientific framework for deciding how best to manage land in arid regions, they also promote sustainable agricultural practices, food security, and better living conditions for desertification-affected communities. Therefore, the maps produced by the combined process, which are discussed and shown throughout the manuscript, can also be utilized by local governing authorities to define and implement strategic actions to reduce desertification in these susceptible regions worldwide.
According to these results, a series of practical interventions must be implemented immediately to reduce desertification and improve land sustainability in the studied area. These measures include the following:
Increasing irrigation effectiveness helps lower water usage and improve the sustainability of water resources.
Planting salt-resistant crops and utilizing organic soil conditioners to counteract soil and water salinization effects.
Planting natural windbreaks to lessen the impact of wind erosion on soil.
Improving sustainable land management through the establishment of clear land use regulations that identify the most susceptible regions to desertification and develop management plans for them.
Utilizing geospatial approaches to monitor environmental changes in desertification-prone areas and improve environmental management strategies by improving the usage of remote sensing and geographic information systems (GIS).
Enhancing farmers’ and landowners’ understanding of the significance of implementing sustainable farming methods and efficiently utilizing natural resources.
While the recommended interventions, including windbreak planting, soil conditioner application, and salt-tolerant crop cultivation, are technically viable and environmentally justified, their widespread adoption in West El-Minya must be assessed through a socioeconomic lens. Despite being designated for national agricultural development, the region has several practical problems that may prevent such policies from being implemented immediately. These include high initial expenditures for afforestation and irrigation infrastructure, limited access to inputs like compost and gypsum, a scarcity of salt-tolerant crop types, and a general lack of technical training among local farmers. Nevertheless, recent government-backed land reclamation efforts in the investigated region, paired with private agriculture investments, offer a potential framework for applying sustainable land management principles. Several interventions have already begun in specific zones, such as the installation of windbreak belts and the use of organic amendments to remediate saline soils. However, to secure widespread and long-term adoption, targeted support mechanisms such as financial incentives, cooperative purchasing schemes, access to better seeds, and strong extension services are required. Therefore, it is recommended that future desertification control methods in West El-Minya be incorporated into comprehensive development projects that consider not only biophysical conditions but also the economic viability and institutional capability of local stakeholders. Incorporating socioeconomic feasibility into ESA-based planning will increase the realism and application of land sensitivity models, as well as improve ground-level outcomes.
It is also recommended that future research be done on how climate change affects the rates of desertification, incorporating data from long-term climate models with artificial intelligence and GIS to evaluate the impact of future climate changes on soil, vegetation cover, and potential land degradation, and consequently offer more precise and efficient solutions.
The modified MEDALUS model utilized in this study is intended to be transferable and adaptable to many arid and semi-arid areas. Its modular construction enables quality indicators to be tailored to available data as well as local ecological or socioeconomic conditions. While the model foundation stays consistent, region-specific calibration of criteria and weights is required to ensure accuracy and policy relevance. This adaptability assures that the approach for desertification sensitivity mapping is applicable in a variety of environmental and management settings.
The study’s findings are intended to benefit not only the academic community but also policymakers and land development stakeholders. The geographic outputs and ESAI maps will be shared with the appropriate governmental agencies, such as the land reclamation authority and regional planning offices. Future stages will involve collaborative workshops and policy dialogues to connect land management actions with the study’s results, particularly within the larger context of national desert development strategies.
Acknowledgments
The authors would like to thank RUDN University, as this publication has been supported by the RUDN University Scientific Projects Grant System, project No. <202786-2-000>.
-
Funding information: Authors state no funding involved.
-
Author contributions: The entire content of this publication is the responsibility of all authors, who have also examined all the results and approved the final version before submitting it to the journal. All authors’ contributions have resulted in the completion of this article. I. Y: conceptualization, data curation, formal analysis, investigation, software, writing – original draft, and writing – review & editing. A.S: conceptualization, data curation, formal analysis, resources, and writing – original draft. M.A: conceptualization, data curation, formal analysis, investigation, validation, and writing – original draft. M.S.K.: writing – review & editing, validation, and visualization. E.S. M: conceptualization, project administration, supervision, validation, visualization, and writing – original draft. N.Y.R.: conceptualization, data curation, methodology, supervision, writing – original draft. M.S.S: conceptualization, data curation, formal analysis, funding acquisition, visualization, writing – original draft, and writing – review & editing.
-
Conflict of interest: Authors state no conflict of interest.
-
Data availability statement: All data are included in the manuscript and supplementary materials.
References
[1] Jain S, Srivastava A, Khadke L, Chatterjee U, Elbeltagi A. Global-scale water security and desertification management amidst climate change. Environ Sci Pollut Res. 2024;31(49):58720–44.10.1007/s11356-024-34916-0Search in Google Scholar PubMed
[2] Oswald J, Harris S. Desertification. In: Sivanpillai R, Shroder JF, editors. Biological and environmental hazards, risks, and disasters. 2nd edn. Boston: Elsevier; 2023. p. 369–93.10.1016/B978-0-12-820509-9.00023-XSearch in Google Scholar
[3] Kusserow H. Desertification, resilience, and re-greening in the African Sahel–a matter of the observation period? Earth Syst Dyn. 2017;8(4):1141–70.10.5194/esd-8-1141-2017Search in Google Scholar
[4] D’Odorico P, Rosa L, Bhattachan A, Okin GS. Desertification and land degradation. In: D’Odorico P, Porporato A, Wilkinson Runyan C, editors. Dryland ecohydrology. Amsterdam, Netherlands: Elsevier; 2019. p. 573–602.10.1007/978-3-030-23269-6_21Search in Google Scholar
[5] Lal R. Soil management for carbon sequestration. South Afr J Plant Soil. 2021;38(3):231–7.10.1080/02571862.2021.1891474Search in Google Scholar
[6] Salvati L. Economic causes and consequences of desertification. In: Oxford research encyclopedia of environmental science. Oxford, UK: Oxford University Press; 2021.10.1093/acrefore/9780199389414.013.407Search in Google Scholar
[7] Colglazier W. Sustainable development agenda: 2030. Science. 2015;349(6252):1048–50.10.1126/science.aad2333Search in Google Scholar PubMed
[8] Shukla P, Skeg J, Buendia E, Masson-Delmotte V, Pörtner H, Roberts D, et al. Climate change and land: An IPCC special report on climate change, desertification, land degradation, sustainable land management, food security, and greenhouse gas fluxes in terrestrial ecosystems. Geneva, Switzerland: Intergovernmental Panel on Climate Change (IPCC); 2019.Search in Google Scholar
[9] Akbari M, Modarres R, Noughani MA. Assessing early warning for desertification hazard based on E-SMART indicators in arid regions of northeastern Iran. J Arid Environ. 2020;174:104086.10.1016/j.jaridenv.2019.104086Search in Google Scholar
[10] Kosmas C, Ferrara AMS, Briasouli H, Imeson A. Methodology for mapping environmentally sensitive areas (ESAs) to desertification. In: Brandt J, Thornes JB, editors. The Medalus project: Mediterranean desertification and land use. Manual on key indicators of desertification and mapping environmentally sensitive areas to desertification. Luxembourg: European Commission; 1999. p. 31–47.Search in Google Scholar
[11] Prăvălie R, Bandoc G, Patriche C, Sternberg T. Recent changes in global drylands: Evidences from two major aridity databases. Catena. 2019;178:209–31.10.1016/j.catena.2019.03.016Search in Google Scholar
[12] Prăvălie R, Patriche C, Borrelli P, Panagos P, Roșca B, Dumitraşcu M, et al. Arable lands under the pressure of multiple land degradation processes. A global perspective. Environ Res. 2021;194:110697.10.1016/j.envres.2020.110697Search in Google Scholar PubMed
[13] Huber-Sannwald E, Martínez-Tagüeña N, Espejel I, Lucatello S, Coppock D, Reyes Gómez V, et al. Introduction: international network for the sustainability of drylands—transdisciplinary and participatory research for dryland stewardship and sustainable development. In: Huber-Sannwald E, Martínez-Tagüeña N, Lucatello S, Espejel I, editors. Dryland stewardship: Global environmental change and sustainable development. Cham, Switzerland: Springer; 2020. p. 1–24.10.1007/978-3-030-22464-6_1Search in Google Scholar
[14] Rattanarat J, Jaroensutasinee K, Jaroensutasinee M, Sparrow EB. Government policy influence on land use and land cover changes: A 30-year analysis. Emerg Sci J. 2024;8(5):1783–97.10.28991/ESJ-2024-08-05-06Search in Google Scholar
[15] Gad A. Qualitative and quantitative assessment of land degradation and desertification in Egypt based on satellite remote sensing: urbanization, salinization and wind erosion. In: Marghany M, editor. Satellite remote sensing: A new tool for archaeology. Cham, Switzerland: Springer; 2020. p. 443–97.10.1007/978-3-030-39593-3_15Search in Google Scholar
[16] Haddad SA, Abd El-Azeim MM, Menesi AM, Ismail E, Sambito M, Ahmed MS, et al. Impact of flooding on lands with emerging contaminants on the quality of receiving water bodies. Water. 2024;16(22):3214.10.3390/w16223214Search in Google Scholar
[17] Bakr N, Weindorf DC, Bahnassy MH, El-Badawi MM. Multi-temporal assessment of land sensitivity to desertification in a fragile agro-ecosystem: Environmental indicators. Ecol Indic. 2012;15(1):271–80.10.1016/j.ecolind.2011.09.034Search in Google Scholar
[18] Darwish K, Safaa M, Momou A, Saleh S. Egypt: Land degradation issues with special reference to the impact of climate change. In: Zdruli P, Pagliai M, Kapur S, Faz Cano A, editors. Combating desertification in Asia, Africa and the Middle East: Proven practices. Dordrecht, Netherlands: Springer; 2013. p. 113–36.10.1007/978-94-007-6652-5_6Search in Google Scholar
[19] Brauch HG, Spring ÚO, Mesjasz C, Grin J, Kameri-Mbote P, Chourou B, et al. Coping with global environmental change, disasters and security: threats, challenges, vulnerabilities and risks. Berlin, Germany: Springer Science & Business Media; 2011.10.1007/978-3-642-17776-7Search in Google Scholar
[20] Bakr N, Bahnassy MH. Egyptian natural resources. In: Shalaby A, Gad A, editors. The soils of Egypt. Cham, Switzerland: Springer; 2019. p. 33–49.10.1007/978-3-319-95516-2_3Search in Google Scholar
[21] Elwan A, Khalil M. Quantitative assessment of desertification in Bahariya oasis environment, western desert, Egypt. J Product Dev. 2018;23(3):505–33.10.21608/jpd.2018.42061Search in Google Scholar
[22] Shalaby A, Khedr H, Youssef E, Rostom N, Nour-Eldin H, Mansour R, et al. A GIS-based model for automated land suitability assessment for main crops in north-western desert of Egypt (case study: south of Al-Dabaa Corridor). Appl Geomat. 2023;15(1):15–28.10.1007/s12518-022-00474-8Search in Google Scholar
[23] Adger WN, Benjaminsen TA, Brown K, Svarstad H. Advancing a political ecology of global environmental discourses. Dev Change. 2001;32(4):681–715.10.1111/1467-7660.00222Search in Google Scholar
[24] Thomas DS. Science and the desertification debate. J Arid Environ. 1997;37(4):599–608.10.1006/jare.1997.0293Search in Google Scholar
[25] Yousif IAH, Ahmed AARS. Land evaluation and assessment of land cover change using geospatial techniques: A case study in West Samlout Area, Egypt. Egypt J Soil Sci. 2024;64(2):485–506.10.21608/ejss.2024.260713.1708Search in Google Scholar
[26] Giuliani G, Mazzetti P, Santoro M, Nativi S, Van Bemmelen J, Colangeli G, et al. Knowledge generation using satellite earth observations to support sustainable development goals (SDG): A use case on Land degradation. Int J Appl Earth Obs Geoinf. 2020;88:102068.10.1016/j.jag.2020.102068Search in Google Scholar
[27] Yousif M, Sabet HS, Ghoubachi SY, Aziz A. Utilizing the geological data and remote sensing applications for investigation of groundwater occurrences, West El Minia, Western Desert of Egypt. NRIAG J Astron Geophys. 2018;7(2):318–33.10.1016/j.nrjag.2018.07.002Search in Google Scholar
[28] Worachairungreung M, Kulpanich N, Thanakunwutthirot K, Hemwan P. Monitoring agricultural land loss by analyzing changes in land use and land cover. Emerg Sci J. 2024;8(2):687–99.10.28991/ESJ-2024-08-02-020Search in Google Scholar
[29] Lamqadem AA, Saber H, Pradhan B. Quantitative assessment of desertification in an arid oasis using remote sensing data and spectral index techniques. Remote Sens. 2018;10(12):1862.10.3390/rs10121862Search in Google Scholar
[30] Sidiropoulos P, Dalezios NR, Loukas A, Mylopoulos N, Spiliotopoulos M, Faraslis IN, et al. Quantitative classification of desertification severity for degraded aquifer based on remotely sensed drought assessment. Hydrology. 2021;8(1):47.10.3390/hydrology8010047Search in Google Scholar
[31] Eskandari Dameneh H, Gholami H, Telfer MW, Comino JR, Collins AL, Jansen JD. Desertification of Iran in the early twenty-first century: Assessment using climate and vegetation indices. Sci Rep. 2021;11(1):20548.10.1038/s41598-021-99636-8Search in Google Scholar PubMed PubMed Central
[32] İmamoglu A, Dengiz O. Evaluation of soil quality index to assess the influence of soil degradation and desertification process in sub-arid terrestrial ecosystem. Rend Lincei Sci Fis Nat. 2019;30(4):723–34.10.1007/s12210-019-00833-5Search in Google Scholar
[33] Xu X, Liu L, Han P, Gong X, Zhang Q. Accuracy of vegetation indices in assessing different grades of grassland desertification from UAV. Int J Environ Res Public Health. 2022;19(24):16793.10.3390/ijerph192416793Search in Google Scholar PubMed PubMed Central
[34] Kosmas C, Kairis O, Karavitis C, Ritsema C, Salvati L, Acikalin S, et al. Evaluation and selection of indicators for land degradation and desertification monitoring: methodological approach. Environ Manag. 2014;54:951–70.10.1007/s00267-013-0109-6Search in Google Scholar PubMed
[35] Prăvălie R, Patriche C, Tişcovschi A, Dumitraşcu M, Săvulescu I, Sîrodoev I, et al. Recent spatio-temporal changes of land sensitivity to degradation in Romania due to climate change and human activities: An approach based on multiple environmental quality indicators. Ecol Indic. 2020;118:106755.10.1016/j.ecolind.2020.106755Search in Google Scholar
[36] Abuzaid AS, Abdel-Salam MA, Ahmad AF, Fathy HA, Fadl ME, Scopa AJS. Effect of marginal-quality irrigation on accumulation of some heavy metals (Mn, Pb, and Zn) in TypicTorripsamment soils and food crops. Sustainability. 2022;14(3):1067.10.3390/su14031067Search in Google Scholar
[37] Gabriele M, Previtali M, editors. A GIS and remote sensing approach for desertification sensitivity assessment in Basilicata Region (Italy). Proceedings of the 2020 3rd International Conference on Geoinformatics and Data Analysis. 2020.10.1145/3397056.3397079Search in Google Scholar
[38] Leman N, Ramli MF, Khirotdin RPK. GIS-based integrated evaluation of environmentally sensitive areas (ESAs) for land use planning in Langkawi, Malaysia. Ecol Indic. 2016;61:293–308.10.1016/j.ecolind.2015.09.029Search in Google Scholar
[39] Aliero MM, Ismail MH, Alias MA, Sood AM. Geospatial analysis of desertification vulnerability using Mediterranean desertification and land use (MEDALUS) model in Kebbi State, Nigeria. Appl Geomat. 2021;13(4):527–36.10.1007/s12518-021-00372-5Search in Google Scholar
[40] Wijitkosum S. Reducing vulnerability to desertification by using the spatial measures in a degraded area in Thailand. Land. 2020;9(2):49.10.3390/land9020049Search in Google Scholar
[41] Kaliraj S, Chandrasekar N, Parmar M, Rejith R, Dharumarajan S, Lalitha M, et al. Assessment of land degradation vulnerability in the semi-arid region of Southern India using GIS-based MEDALUS approach. In: Adinarayana J, Sulaiman H, editors. Remote sensing of soils. Amsterdam, Netherlands: Elsevier; 2024. p. 591–608.10.1016/B978-0-443-18773-5.00038-7Search in Google Scholar
[42] Jiang L, Bao A, Jiapaer G, Guo H, Zheng G, Gafforov K, et al. Monitoring land sensitivity to desertification in Central Asia: Convergence or divergence? Sci Total Environ. 2019;658:669–83.10.1016/j.scitotenv.2018.12.152Search in Google Scholar PubMed
[43] Prăvălie R, Săvulescu I, Patriche C, Dumitraşcu M, Bandoc G. Spatial assessment of land degradation sensitive areas in southwestern Romania using modified MEDALUS method. Catena. 2017;153:114–30.10.1016/j.catena.2017.02.011Search in Google Scholar
[44] Abdelsamie EA, Abdellatif MA, Hassan FO, El Baroudy AA, Mohamed ES, Kucher DE, et al. Integration of RUSLE model, remote sensing and GIS techniques for assessing soil erosion hazards in arid zones. Agriculture. 2022;13(1):35.10.3390/agriculture13010035Search in Google Scholar
[45] Planchon O, Darboux FJC. A fast, simple and versatile algorithm to fill the depressions of digital elevation models. Catena. 2002;46(2–3):159–76.10.1016/S0341-8162(01)00164-3Search in Google Scholar
[46] Dobos E, Daroussin J, Montanarella L. An SRTM-based procedure to delineate SOTER Terrain Units on 1: 1 and 1: 5 million scales. Luxembourg: Office for Official Publications of the European Communities; 2005.Search in Google Scholar
[47] Dobos E, Norman B, Worstell B. The use of DEM and satellite data for regional scale soil databases. Agrokém Talajt. 2002;51(1–2):263–72.10.1556/agrokem.51.2002.1-2.31Search in Google Scholar
[48] FAO. Guidelines for soil description. Rome: Fao; 2006.Search in Google Scholar
[49] Burt R. Soil survey field and laboratory methods manual. United States: Department of Agriculture, Natural Resources Conservation …; 2014.Search in Google Scholar
[50] Yousif IA, Sayed AS, Abdelsamie EA, Ahmed AARS, Saeed M, Mohamed ES, et al. Efficiency of geostatistical approach for mapping and modeling soil site-specific management zones for sustainable agriculture management in drylands. Agronomy. 2024;14(11):2681.10.3390/agronomy14112681Search in Google Scholar
[51] Aldabaa A, Yousif IAH. Geostatistical approach for land suitability assessment of some desert soils. Egypt J Soil Sci. 2020;60(3):195–209. 10.21608/ejss.2020.26767.1350.Search in Google Scholar
[52] Shokr MS, Abdellatif MA, El Baroudy AA, Elnashar A, Ali EF, Belal AA, et al. Development of a spatial model for soil quality assessment under arid and semi-arid conditions. Sustainability. 2021;13(5):2893.10.3390/su13052893Search in Google Scholar
[53] Abuzaid AS, Abdelatif AD. Assessment of desertification using modified MEDALUS model in the north Nile Delta, Egypt. Geoderma. 2022;405:115400.10.1016/j.geoderma.2021.115400Search in Google Scholar
[54] Bel-Lahbib S, Ibno Namr K, Rerhou B, Mosseddaq F, El Bourhrami B, Moughli L. Assessment of soil quality by modeling soil quality index and mapping soil parameters using IDW interpolation in Moroccan semi-arid. Modeling Earth Syst Env. 2023;9(4):4135–53.10.1007/s40808-023-01718-1Search in Google Scholar
[55] Chen H, Fan L, Wu W, Liu H-B. Comparison of spatial interpolation methods for soil moisture and its application for monitoring drought. Environ Monit Assess. 2017;189:1–13.10.1007/s10661-017-6244-4Search in Google Scholar PubMed
[56] Srivastava PK, Pandey PC, Petropoulos GP, Kourgialas NN, Pandey V, Singh U. GIS and remote sensing aided information for soil moisture estimation: A comparative study of interpolation techniques. Resources. 2019;8(2):70.10.3390/resources8020070Search in Google Scholar
[57] Li J, Heap AD. Spatial interpolation methods applied in the environmental sciences: A review. Env Model Softw. 2014;53:173–89.10.1016/j.envsoft.2013.12.008Search in Google Scholar
[58] Santos-Santos E, Yarto-Ramírez M, Gavilán-García I, Castro-Díaz J, Gavilán-García A, Rosiles R, et al. Analysis of arsenic, lead and mercury in farming areas with mining contaminated soils at Zacatecas. Mexico. 2006;50(2):57–63.Search in Google Scholar
[59] Prăvălie R, Patriche C, Săvulescu I, Sîrodoev I, Bandoc G, Sfîcă L. Spatial assessment of land sensitivity to degradation across Romania. A quantitative approach based on the modified MEDALUS methodology. Catena. 2020;187:104407.10.1016/j.catena.2019.104407Search in Google Scholar
[60] Prăvălie R, Patriche C, Bandoc G. Quantification of land degradation sensitivity areas in Southern and Central Southeastern Europe. New results based on improving DISMED methodology with new climate data. Catena. 2017;158:309–20.10.1016/j.catena.2017.07.006Search in Google Scholar
[61] Yousif IA, Abdel Hamid A, Aldabaa AA, Hassanein SA, Rebouh NY, Mohamed ES, et al. Soil quality indicator-based land productivity modelling for agricultural sustainability. PLoS One. 2025;20(1):e0316840.10.1371/journal.pone.0316840Search in Google Scholar PubMed PubMed Central
[62] Lee EJ, Piao D, Song C, Kim J, Lim C-H, Kim E, et al. Assessing environmentally sensitive land to desertification using MEDALUS method in Mongolia. Sci Technol. 2019;15(4):210–20.10.1080/21580103.2019.1667880Search in Google Scholar
[63] Lahlaoi H, Rhinane H, Hilali A, Lahssini S, Moukrim S. Desertification assessment using MEDALUS model in watershed Oued El Maleh, Morocco. Geosciences. 2017;7(3):50.10.3390/geosciences7030050Search in Google Scholar
[64] Afzali SF, Khanamani A, Maskooni EK, Berndtsson R. Quantitative assessment of environmental sensitivity to desertification using the modified MEDALUS model in a semiarid area. Sustainability. 2021;13(14):7817.10.3390/su13147817Search in Google Scholar
[65] Saleh A, Belal A, Jalhoum M. Quantitative assessment of environmental sensitivity to desertification in Sidi Abdel-Rahman area, Northern West Coast of Egypt. Egypt J Soil Sci. 2018;58(1):13–26.Search in Google Scholar
[66] Symeonakis E, Karathanasis N, Koukoulas S, Panagopoulos G. Monitoring sensitivity to land degradation and desertification with the environmentally sensitive area index: The case of Lesvos Island. Land Degrad Dev. 2016;27(6):1562–73.10.1002/ldr.2285Search in Google Scholar
[67] Blaga L. Aspects regarding the significance of the curvature types and values in the studies of geomorphometry assisted by GIS. Anal Univ Oradea Ser Geogr. 2012;2012:327–37.Search in Google Scholar
[68] Kornejady A, Ownegh M, Bahremand A. Landslide susceptibility assessment using maximum entropy model with two different data sampling methods. Catena. 2017;152:144–62.10.1016/j.catena.2017.01.010Search in Google Scholar
[69] Baruah TC, Borthakur HP. A textbook of soil analysis. Soil Chemistry. New Delhi: Vikas Publishing House Pvt. Ltd.; 1997. p. 118–32.Search in Google Scholar
[70] Nachshon U. Cropland soil salinization and associated hydrology: Trends, processes and examples. Water. 2018;10(8):1030.10.3390/w10081030Search in Google Scholar
[71] Selmy SA, Jimenez-Ballesta R, Kucher DE, Sayed AS, García-Navarro FJ, Yang Y, et al. Land suitability assessment and crop water requirements for twenty selected crops in an arid land environment. Agronomy. 2024;14(11):2601.10.3390/agronomy14112601Search in Google Scholar
[72] El Behairy RA, El Baroudy AA, Ibrahim MM, Kheir AM, Shokr MS. Modelling and assessment of irrigation water quality index using GIS in semi-arid region for sustainable agriculture. Water Air Soil Pollut. 2021;232(9):352.10.1007/s11270-021-05310-0Search in Google Scholar
[73] Zalacáin D, Martínez-Pérez S, Bienes R, García-Díaz A, Sastre-Merlín A. Salt accumulation in soils and plants under reclaimed water irrigation in urban parks of Madrid (Spain). Agric Water Manag. 2019;213:468–76.10.1016/j.agwat.2018.10.031Search in Google Scholar
[74] Azab YF, Abbas HH, Jalhoum ME, Farid IM, Abdelhameed A-EH, Mohamed ES. Soil erosion assessment in arid region: A case study in Wadi Naghamish, Northwest Coast, Egypt. Egypt J Remote Sens Space Sci. 2021;24(3):1111–8.10.1016/j.ejrs.2021.11.008Search in Google Scholar
[75] Abdellatif MA, El Baroudy AA, Arshad M, Mahmoud EK, Saleh AM, Moghanm FS, et al. A GIS-based approach for the quantitative assessment of soil quality and sustainable agriculture. Sustainability. 2021;13(23):13438.10.3390/su132313438Search in Google Scholar
[76] Basso AS, Miguez FE, Laird DA, Horton R, Westgate M. Assessing potential of biochar for increasing water‐holding capacity of sandy soils. Gcb Bioenergy. 2013;5(2):132–43.10.1111/gcbb.12026Search in Google Scholar
[77] Nour-Eldin H, Shalaby A, Mohamed RM, Youssef E, Rostom NG, Khedr H. Assessment of the desertification sensitivity of northwestern el minya governorate, Egypt using MEDALUS model. Egypt J Remote Sens Space Sci. 2023;26(3):758–67.10.1016/j.ejrs.2023.07.013Search in Google Scholar
[78] Nour-Eldin H, Sheta A-A, Shalaby A, Wahed A-E, El-Shinawy M. Assessment and Spatial Analysis of Sensitivity to Desertification in Wadi El Natrun, Northwestern Egypt using MEDLAUS model. Arab Univ J Agric Sci. 2020;28(2):673–84.10.21608/ajs.2020.30657.1213Search in Google Scholar
[79] Fadl ME, Abuzaid AS, AbdelRahman MA, Biswas A. Evaluation of desertification severity in El-Farafra Oasis, Western Desert of Egypt: Application of modified MEDALUS approach using wind erosion index and factor analysis. Land. 2021;11(1):54.10.3390/land11010054Search in Google Scholar
[80] Thornes J. Erosional equilibria under grazing. 1988;193:210.Search in Google Scholar
[81] Badreldin N, Frankl A, Goossens R. Assessing the spatiotemporal dynamics of vegetation cover as an indicator of desertification in Egypt using multi-temporal MODIS satellite images. Arab J Geosci. 2014;7:4461–75.10.1007/s12517-013-1142-8Search in Google Scholar
[82] Lins CMT, de Souza ER, dos Santos Souza TEM, Paulino MKSS, Monteiro DR, de Souza Júnior VS, et al. Influence of vegetation cover and rainfall intensity on soil attributes in an area undergoing desertification in Brazil. Catena. 2023;221:106751.10.1016/j.catena.2022.106751Search in Google Scholar
[83] Nze CO, Agunwamba JC. Estimation of soil loss using remote sensing data in a regional tropical humid catchment area. Civ Eng J. 2024;10(7):2293–312.10.28991/CEJ-2024-010-07-014Search in Google Scholar
[84] Osman KT. Management of soil problems. Cham, Switzerland: Springer; 2018.10.1007/978-3-319-75527-4Search in Google Scholar
[85] Ostovari Y, Ghorbani-Dashtaki S, Bahrami H-A, Naderi M, Dematte JAM. Soil loss estimation using RUSLE model, GIS and remote sensing techniques: A case study from the Dembecha Watershed, Northwestern Ethiopia. Geoderma Reg. 2017;11:28–36.10.1016/j.geodrs.2017.06.003Search in Google Scholar
[86] Wahba M, Labib F, Zaghloul A. Impact of the global climate change on land degradation in Egypt. Int J Environ Pollut Environ Model. 2019;2(2):48–61.Search in Google Scholar
[87] Abdullahi MB, Elnaggar AA, Omar MM, Murtala A, Lawal M, Mosa AA. Land degradation, causes, implications and sustainable management in arid and semi arid regions: A case study of Egypt. Egypt J Soil Sci. 2023;63(4):659–76.10.21608/ejss.2023.230986.1647Search in Google Scholar
[88] Hadi SH, Alwan HH, Al-Mohammed FM. Analysis of climate change scenarios using the LARS-WG 8 model based on precipitation and temperature trends. Civ Eng J. 2024;10(12):4019–42.10.28991/CEJ-2024-010-12-014Search in Google Scholar
[89] Budak M, Günal H, Çelik İ, Yıldız H, Acir N, Acar M. Environmental sensitivity to desertification in northern Mesopotamia; application of modified MEDALUS by using analytical hierarchy process. Arab J Geosci. 2018;11:1–21.10.1007/s12517-018-3813-ySearch in Google Scholar
[90] Abuzaid AS, AbdelRahman MA, Fadl ME, Scopa A. Land degradation vulnerability mapping in a newly-reclaimed desert oasis in a hyper-arid agro-ecosystem using AHP and geospatial techniques. Agronomy. 2021;11(7):1426.10.3390/agronomy11071426Search in Google Scholar
© 2025 the author(s), published by De Gruyter
This work is licensed under the Creative Commons Attribution 4.0 International License.
Articles in the same Issue
- Research Articles
- Optimization of sustainable corn–cattle integration in Gorontalo Province using goal programming
- Competitiveness of Indonesia’s nutmeg in global market
- Toward sustainable bioproducts from lignocellulosic biomass: Influence of chemical pretreatments on liquefied walnut shells
- Efficacy of Betaproteobacteria-based insecticides for managing whitefly, Bemisia tabaci (Hemiptera: Aleyrodidae), on cucumber plants
- Assessment of nutrition status of pineapple plants during ratoon season using diagnosis and recommendation integrated system
- Nutritional value and consumer assessment of 12 avocado crosses between cvs. Hass × Pionero
- The lacked access to beef in the low-income region: An evidence from the eastern part of Indonesia
- Comparison of milk consumption habits across two European countries: Pilot study in Portugal and France
- Antioxidant responses of black glutinous rice to drought and salinity stresses at different growth stages
- Differential efficacy of salicylic acid-induced resistance against bacterial blight caused by Xanthomonas oryzae pv. oryzae in rice genotypes
- Yield and vegetation index of different maize varieties and nitrogen doses under normal irrigation
- Urbanization and forecast possibilities of land use changes by 2050: New evidence in Ho Chi Minh city, Vietnam
- Organizational-economic efficiency of raspberry farming – case study of Kosovo
- Application of nitrogen-fixing purple non-sulfur bacteria in improving nitrogen uptake, growth, and yield of rice grown on extremely saline soil under greenhouse conditions
- Digital motivation, knowledge, and skills: Pathways to adaptive millennial farmers
- Investigation of biological characteristics of fruit development and physiological disorders of Musang King durian (Durio zibethinus Murr.)
- Enhancing rice yield and farmer welfare: Overcoming barriers to IPB 3S rice adoption in Indonesia
- Simulation model to realize soybean self-sufficiency and food security in Indonesia: A system dynamic approach
- Gender, empowerment, and rural sustainable development: A case study of crab business integration
- Metagenomic and metabolomic analyses of bacterial communities in short mackerel (Rastrelliger brachysoma) under storage conditions and inoculation of the histamine-producing bacterium
- Fostering women’s engagement in good agricultural practices within oil palm smallholdings: Evaluating the role of partnerships
- Increasing nitrogen use efficiency by reducing ammonia and nitrate losses from tomato production in Kabul, Afghanistan
- Physiological activities and yield of yacon potato are affected by soil water availability
- Vulnerability context due to COVID-19 and El Nino: Case study of poultry farming in South Sulawesi, Indonesia
- Wheat freshness recognition leveraging Gramian angular field and attention-augmented resnet
- Suggestions for promoting SOC storage within the carbon farming framework: Analyzing the INFOSOLO database
- Optimization of hot foam applications for thermal weed control in perennial crops and open-field vegetables
- Toxicity evaluation of metsulfuron-methyl, nicosulfuron, and methoxyfenozide as pesticides in Indonesia
- Fermentation parameters and nutritional value of silages from fodder mallow (Malva verticillata L.), white sweet clover (Melilotus albus Medik.), and their mixtures
- Five models and ten predictors for energy costs on farms in the European Union
- Effect of silvopastoral systems with integrated forest species from the Peruvian tropics on the soil chemical properties
- Transforming food systems in Semarang City, Indonesia: A short food supply chain model
- Understanding farmers’ behavior toward risk management practices and financial access: Evidence from chili farms in West Java, Indonesia
- Optimization of mixed botanical insecticides from Azadirachta indica and Calophyllum soulattri against Spodoptera frugiperda using response surface methodology
- Mapping socio-economic vulnerability and conflict in oil palm cultivation: A case study from West Papua, Indonesia
- Exploring rice consumption patterns and carbohydrate source diversification among the Indonesian community in Hungary
- Determinants of rice consumer lexicographic preferences in South Sulawesi Province, Indonesia
- Effect on growth and meat quality of weaned piglets and finishing pigs when hops (Humulus lupulus) are added to their rations
- Healthy motivations for food consumption in 16 countries
- The agriculture specialization through the lens of PESTLE analysis
- Combined application of chitosan-boron and chitosan-silicon nano-fertilizers with soybean protein hydrolysate to enhance rice growth and yield
- Stability and adaptability analyses to identify suitable high-yielding maize hybrids using PBSTAT-GE
- Phosphate-solubilizing bacteria-mediated rock phosphate utilization with poultry manure enhances soil nutrient dynamics and maize growth in semi-arid soil
- Factors impacting on purchasing decision of organic food in developing countries: A systematic review
- Influence of flowering plants in maize crop on the interaction network of Tetragonula laeviceps colonies
- Bacillus subtilis 34 and water-retaining polymer reduce Meloidogyne javanica damage in tomato plants under water stress
- Vachellia tortilis leaf meal improves antioxidant activity and colour stability of broiler meat
- Evaluating the competitiveness of leading coffee-producing nations: A comparative advantage analysis across coffee product categories
- Application of Lactiplantibacillus plantarum LP5 in vacuum-packaged cooked ham as a bioprotective culture
- Evaluation of tomato hybrid lines adapted to lowland
- South African commercial livestock farmers’ adaptation and coping strategies for agricultural drought
- Spatial analysis of desertification-sensitive areas in arid conditions based on modified MEDALUS approach and geospatial techniques
- Meta-analysis of the effect garlic (Allium sativum) on productive performance, egg quality, and lipid profiles in laying quails
- Optimizing carrageenan–citric acid synergy in mango gummies using response surface methodology
- The strategic role of agricultural vocational training in sustainable local food systems
- Agricultural planning grounded in regional rainfall patterns in the Colombian Orinoquia: An essential step for advancing climate-adapted and sustainable agriculture
- Perspectives of master’s graduates on organic agriculture: A Portuguese case study
- Developing a behavioral model to predict eco-friendly packaging use among millennials
- Government support during COVID-19 for vulnerable households in Central Vietnam
- Citric acid–modified coconut shell biochar mitigates saline–alkaline stress in Solanum lycopersicum L. by modulating enzyme activity in the plant and soil
- Review Articles
- Reference dietary patterns in Portugal: Mediterranean diet vs Atlantic diet
- Evaluating the nutritional, therapeutic, and economic potential of Tetragonia decumbens Mill.: A promising wild leafy vegetable for bio-saline agriculture in South Africa
- A review on apple cultivation in Morocco: Current situation and future prospects
- Quercus acorns as a component of human dietary patterns
- CRISPR/Cas-based detection systems – emerging tools for plant pathology
- Short Communications
- An analysis of consumer behavior regarding green product purchases in Semarang, Indonesia: The use of SEM-PLS and the AIDA model
- Effect of NaOH concentration on production of Na-CMC derived from pineapple waste collected from local society