
Exploring rice consumption patterns and carbohydrate source diversification among the Indonesian community in Hungary
-
Triara Juniarsih
 ,
La Ode Nazaruddin
,
La Ode Nazaruddin

Abstract
This study investigates the causal effects of rice consumption patterns and carbohydrate source diversification among the Indonesian community in Hungary. The research aims to understand the interplay of availability, convenience, cultural persistence, and substitution in shaping food consumption behavior and dietary diversity. This study employed a mixed methods research design, with a dominant quantitative approach supported by a non-dominant qualitative component. Data were collected from 125 respondents (drawn from a population of approximately 1,191 persons) via online and offline questionnaires, using snowballing technique. Data were measured on a Likert scale and analyzed using a partial least square structural equation model with RStudio. The reflective measurement model confirms indicator reliability, with all reflective indicator loadings exceeding acceptable thresholds. Although the culture constructs slightly fall below Cronbach’s alpha threshold, it remains reliable based on rhoA and rhoC values. The structural model reveals that increased convenience and cultural persistence significantly enhance rice consumption by 21.3 and 33.8%, respectively, whereas a one-point increase in substitution decreases rice consumption by 35.9% while increasing food diversity by 43%. Collinearity tests show no significant issues, and the model demonstrates moderate explanatory power (R² = 0.351 for consumption and 0.297 for diversity). These findings highlight the critical roles of convenience, culture, and substitution in shaping food consumption patterns and dietary diversity. Under the qualitative side, samples were 125 drawn by snowballing technique. The qualitative data were analyzed using Ms Excel to display a distribution of frequencies. The study contributes to food security discussions by providing insights into how migrant communities balance traditional dietary habits with new food environments. By supporting the Sustainable Development Goal of Zero Hunger, this research offers actionable recommendations to improve food security and dietary diversity among immigrants.
1 Introduction
Rice is the primary staple food for Indonesians. Rice consumption in Indonesia is the third highest in the world and Asian countries, the average rice consumption is 37.674 kt, estimated from 2018 to 2020 [1]. According to a study [2], rice is the carbohydrate-containing product people are most likely to consume in Indonesia. Over the past few years, there has been an increase in rice consumption in line with population growth and changes in dietary patterns in Indonesia. Rice remains the main carbohydrate food source for Indonesians, with an average annual consumption of 80.9 kg/capita in 2023, increasing from 78.4 in 2019 [3]. Rice consumption in Indonesia is higher than other carbohydrate sources (e.g., corn, with an average consumption of 1.9 kg/capita in 2023) [3]. Furthermore, this substantial increase in rice imports highlights the ongoing reliance on imported rice to meet the high demand fueled by Indonesians’ traditional consumption habits and lifestyles. As observed in the data, Indonesia has been importing 3.06 million tons of rice in 2023; in the last 5 years, 2023 has seen the highest amount of rice imports ever [4].
Indonesians have a deeply ingrained habit of consuming rice as their primary staple, typically eating it 2–3 times daily for breakfast, lunch, and dinner [5,6]. For many Indonesians, the act of “eating” is synonymous with “eating rice” [6], a tradition that persists even when they move abroad. For instance, Indonesian students in Taiwan continue to consume rice more than once a day, reflecting their attachment to familiar dietary practices despite being in a foreign food environment [5]. This strong cultural connection to rice demonstrates its role as a food staple and a key aspect of Indonesian identity.
This pattern of dietary continuity is not unique to Indonesians. Other Asian immigrant groups also tend to retain their traditional food habits, especially when it comes to rice. For example, Chinese immigrants in Spain prefer to maintain their rice-based diets despite local food preferences [7], and Filipino immigrants in the United States often go to great lengths to access rice from their home country to sustain their family’s diet [8]. Vietnamese migrant workers in Moscow and Thai workers in South Korea similarly face challenges in fully adopting local cuisines, often continuing to consume traditional foods like sticky rice as a way to preserve their cultural roots [9,10]. These examples show how rice remains a central element in the food consumption patterns of Asian immigrants across diverse settings.
In Hungary, although rice is not a traditional staple, the growing Indonesian population, driven by labor and educational opportunities, continues to prioritize rice in their diets [11,12]. The Indonesian community in Hungary has expanded rapidly, partly due to the Stipendium Hungaricum program and an increase in labor migration [13]. This study examines how Indonesians in Hungary adapt to the local food environment while maintaining their rice consumption patterns. Understanding these dynamics sheds light on broader issues of food security and cultural preservation among immigrant communities and aligns with global food security efforts to ensure access to culturally appropriate and nutritious foods [14,15].
Limited research has examined how convenience, cultural persistence, and substitution influence dietary choices and their impact on food security and diversity. This study addresses this gap by exploring factors affecting rice consumption and food diversity among Indonesians in Hungary. While food diversification is widely discussed in nutrition and food security studies, there is a gap in understanding its relationship with local food sustainability and how it aligns with traditional staple food consumption, such as rice in the Indonesian community.
Framed within the discourse on food security, migration, and dietary adaptation, this research applies a partial least square structural equation model (PLS-SEM) approach to analyze key determinants, and PLS-SEM aims at maximizing the endogenous latent variables’ explained variance by estimating partial model relationships in an iterative sequence of ordinary least squares regressions [16]. The findings provide theoretical insights into migrant food habits and practical recommendations for enhancing food security. This study explores the relationship between rice consumption, food diversity, and key influencing factors. This uniquely explores how Indonesians balance food diversification with rice consumption, providing insights into adaptation strategies that ensure both dietary diversity and staple food sustainability, contributing to SDG Zero Hunger by promoting food security and sustainable consumption. Immigrants from tropical Southeast Asia often retain staples such as rice despite the new environment [6,17–21]. This study provides a new perspective by emphasizing dietary diversification among migrants, in contrast to previous research that emphasizes their continued reliance on staple foods such as rice and their consumption of rice several times a day, reflecting strong dietary attachment. In contrast, this study explores strategies to encourage diverse food choices that promote better nutrition and sustainability in host countries.
1.1 Consumption patterns
Consumption patterns are the regular habits and choices people make about what and how much they consume, influenced by culture, availability, and personal preferences, with rice playing a dominant role in the diets of many Asian communities, including Indonesia [6,17–21]. The continued reliance on rice has slowed dietary diversification efforts within the Indonesian community in Hungary, where rice remains a staple despite the availability of local alternatives such as pasta and bread. Studies on Asian societies demonstrate that traditional food habits often persist in new environments, as seen with the Minangkabau community’s rice and side dish combination [6] and China’s fried rice traditions [22]. This contrasts with European diets, where bread derived from flour – constitutes a significant part of daily consumption [23,24]. While adapting to local carbohydrate sources offers potential dietary diversity for Indonesian immigrants, strong cultural ties to rice continue to shape their consumption patterns [5]. Food consumption can be affected by various factors, including lifestyle, personal attitudes, behaviors, and public health regulations and policies [25].
1.2 Food diversification
Food diversification is essential for enhancing food security and nutrition by encouraging a varied diet and reducing reliance on specific food sources like rice, which has traditionally been a staple for Indonesian communities [5,15]. Diversifying carbohydrate sources, such as incorporating local alternatives like bread and pasta in Hungary, can mitigate risks linked to food dependency, support sustainable agriculture, and improve overall dietary quality [18,26]. By introducing more diverse foods across and within food groups, such as grains and vegetables, dietary quality improves, leading to better nutrition and health outcomes [27]. For the immigrants, these shifts help balance traditional food practices with the need for sustainable and nutritious alternatives [15,18]. Food diversification helps meet nutritional needs and promotes sustainable food systems, offering a solution for food security amid limited rice consumption [28]. Few Indonesians are also aware that dietary diversity has a more significant impact on nutrition, obesity, and chronic diseases than excessive energy intake and that a balanced diet that includes a variety of carbohydrate sources is essential for maintaining health and preventing diet-related diseases [25,29].
1.3 Factors affecting food consumption patterns and food diversification
1.3.1 Food availability
Food availability is essential to achieving food security as it ensures sufficient food to meet consumer needs, with food security challenges often categorized into quality and quantity issues, both of which have a direct impact on availability [14]. Food availability, particularly the supply of rice and local carbohydrate alternatives, is critical in shaping consumption patterns in the South Kivu and Tanganyika provinces in eastern DRC [17]. Access to various types of rice and other staples like pasta and bread directly influences dietary choices, as consumers typically rely on what is accessible and affordable in local markets [30]. According to the study [31], the convenience and availability of familiar foods, such as rice, often lead to high consumption rates, while shortages or market variations encourage the exploration of alternative carbohydrate sources. In this context, households may depend on imported rice varieties due to a limited supply from local market, which underscores the importance of food availability in maintaining traditional consumption habits and supporting dietary diversification [15,32].
1.3.2 Food access
Food access, particularly in immigrant communities, depends on factors such as economic affordability, geographic proximity to food sources, and social equity [18]. For consumers in South Kivu and Tanganyika provinces in eastern DRC, access to rice and other familiar staples is influenced by household income and market prices [17]. The income effect allows consumers to offset rising rice prices by substituting alternative carbohydrates like bread and pasta, which are locally available and often more affordable [30]. Urban consumers tend to spend more on higher-quality imported rice, while rural or lower-income groups prioritize local rice varieties for cost-effectiveness [33]. The ability to obtain nutritious food, as defined by income levels and proximity to food outlets, plays a crucial role in shaping dietary diversity and food security [34]. As food access drives consumption patterns, price fluctuations and income disparities can result in dietary shifts toward cheaper, less diverse food options, undermining food security goals like SDG Zero Hunger [15,18].
1.3.3 Convenience
Food convenience refers to food prepared at home or served in restaurants; convenience is also very important for food service, where consumers must eat the food under time, environmental, and other constraints [35]. Convenience is one of the key influences on food choice and consumption quality [36]. The eating phase, which includes choosing, preparing, and consuming food, is the emphasis of the consumption stage [37]. According to Turner et al., food convenience is related to the time and effort required to prepare, cook, and consume food. As the scholar [37,39] proposes three stages of food consumption related to convenience, the present study suggests the fourth stage of food consumption (i.e., cleaning the dishes) that is also related to convenience because cleaning dishes is part of the stage of food consumption at home that is forgotten by scholars. Convenience is one of the key influences in shaping consumption patterns and positively influences consumers’ intention to purchase local food, as easier access and purchasing processes increase the likelihood of acquisition and fulfill daily consumption needs, as noted by some scholars [39,40]. In a study [30], it was found that rice is the main side dish and is mostly consumed at home, consumers consume it at different stages, from the preparation process to the consumption of rice, with concern for the taste and naturalness of the product.
Food convenience is related to how easily food can be prepared and consumed, whether at home or in restaurants, and is a critical factor influencing food choices [35,36]. The stages of food consumption choosing, preparing, consuming, and, as this study suggests, cleaning dishes are all influenced by convenience, which directly impacts consumer preferences and dietary habits [37,39]. For Indonesian immigrants in Hungary, convenience plays a significant role in their continued preference for rice consumption, as the ease of preparing familiar dishes at home influences their carbohydrate choices [30]. The availability of rice in local markets, combined with its convenience in preparation, contributes to its status as the primary carbohydrate source despite the availability of other options like pasta and bread. Furthermore, easier access to familiar ingredients encourages Indonesian households to maintain their traditional eating habits, even while living abroad [39,40].
1.3.4 Cultural factors
Humans cannot be separated from culture; food culture is the set of deeply embedded food practices and consumption patterns shaped by cultural identity and traditions, which often resist change and define a community’s unique food needs [41]. Food culture encompasses not only the symbolic significance of certain foods within a culture but also includes food production, preparation methods, and eating patterns [42]. Food culture influences shape consumption patterns and food diversity by reflecting and reinforcing personal identity, cultural traditions, and social norms while also influencing the adaptation and integration of local food practices in host countries [17–20]. Food cultural differences between Indonesia and Hungary significantly influence rice consumption preferences, as international students adapt their choices while still maintaining their cultural eating patterns and community values abroad [17]. Three dietary patterns (rice-based, snack-based, and staple and stew/soup) were identified, including a complex interplay of personal and socio-cultural factors influencing dietary intake [20]. The combination of rice and beans introduced in the nineteenth century by Afro-Caribbean migrant railroad workers came to be considered a symbol of Costa Rica’s national identity [19]. Food choices, influenced by personal identity, culture, and social traditions, reflect and shape cultural identity through the types of foods consumed, preparation and eating methods, social interactions during meals, and eating locations, with cultural tradition and gender norms being major drivers of food environments and diets [18].
1.3.5 Substitution/adoption
Substitution influences consumption patterns and food diversity by encouraging individuals to adapt to available options in the host country, leading to a blend of local and traditional food practices [7,26]. Food substitution/adoption refers to how individuals adjust their dietary habits in response to a new cultural environment by incorporating local ingredients, blending culinary practices, or maintaining traditional diets [7,26,43–45]. International students, Chinese, and Indians studying in Australia face difficulties finding the right rice as they consume it at home; therefore, they have to switch to other rice and grain foods [45]. Among international students in Oslo, students from Pakistan, India, and Croatia changed their cooking habits, they started preparing simple meals with familiar staple ingredients such as rice and potatoes from local sources, as international students adapt to new environments, balancing manage budgets, availability of ingredients, and the need for familiar flavors [43]. International students in Hungary adopt local foods from host countries to maintain sustainable diets [26]. At the same time, international students in Australia have had to adapt to the local food environment due to the limited availability of familiar ingredients and high food prices [45]. Portuguese families have tried to adapt to incorporate new food preparation practices, such as traditional feijoada and modern juice diets, influenced by different perceptions of Brazilian food as extreme and unhealthy or beneficial, reflecting these changes while maintaining key Portuguese traditions [7].
An understanding of this background allows us to gain an overview of the factors that influence the rice consumption patterns of Indonesians in Hungary, as illustrated in Figure 1.
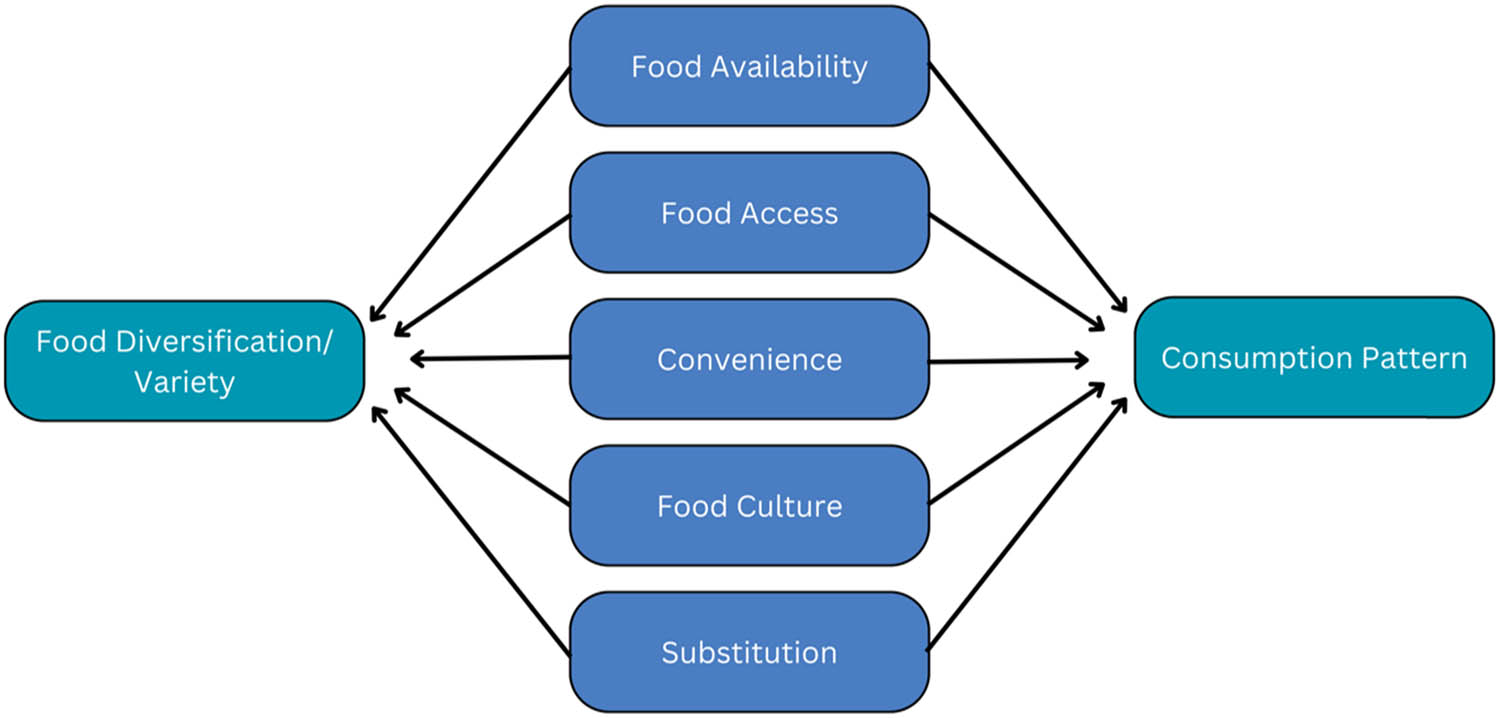
Conceptual model (Source: Authors, original, 2025).
Based on the conceptual model illustrated in Figure 1 and the findings of the previous literature review, the present study summarizes the variables presented in Table 1. The variables have been selected based on their relevance to the research objectives and the theoretical framework. The variables encompass a range of aspects related to rice consumption patterns, food substitution, and the factors influencing dietary choices among the Indonesian community in Hungary. These factors serve as key indicators for analyzing food consumption patterns while also considering the processes of food diversity, cultural retention, and adaptation in a new food environment. This conceptual model illustrates how food diversification influences consumption patterns through five key factors: availability, access, convenience, culture, and substitution. Availability and access determine the variety of foods individuals can obtain, while convenience affects ease of preparation and consumption. Food culture shapes dietary preferences, and substitution reflects adaptations to available alternatives. Together, these factors mediate the relationship between food diversity and consumption behavior.
Variables used in the present study
| Construct | Indicators | Reference |
|---|---|---|
| Availability | Available rice quantity | [15,17,38,46] |
| Available rice quality | ||
| Access | Price | [30,33,38,47] |
| Income | [15,34,47] | |
| Convenience | Preparing time and effort | [30,35–38] |
| Cooking time and effort | ||
| Consuming time allocation | ||
| Cleaning time allocation | ||
| Food culture | Dietary habits | [6–8,10,44,48] |
| Life-span consumption | ||
| Tradition | ||
| Effect/local food | Bread consumption | [7,26,45] |
| Wheat/oat consumption | ||
| Pasta consumption | ||
| Potato/sweet potato consumption | ||
| Salad/fruits | [7] | |
| Consumption pattern | Consuming frequency | [5,6] |
| Consuming limitation/moderation | [18,27,31] | |
| Consuming proportionality/balance | ||
| Diversity/variety | Overall carbohydrate and non-group variety (bread, wheat/oat, rice, pasta, sweet potato/potato, salad/fruit) | [18,27,49] |
| Within-group variety of cereals or carbohydrate source (wheat/oat and rice) |
2 Research methods
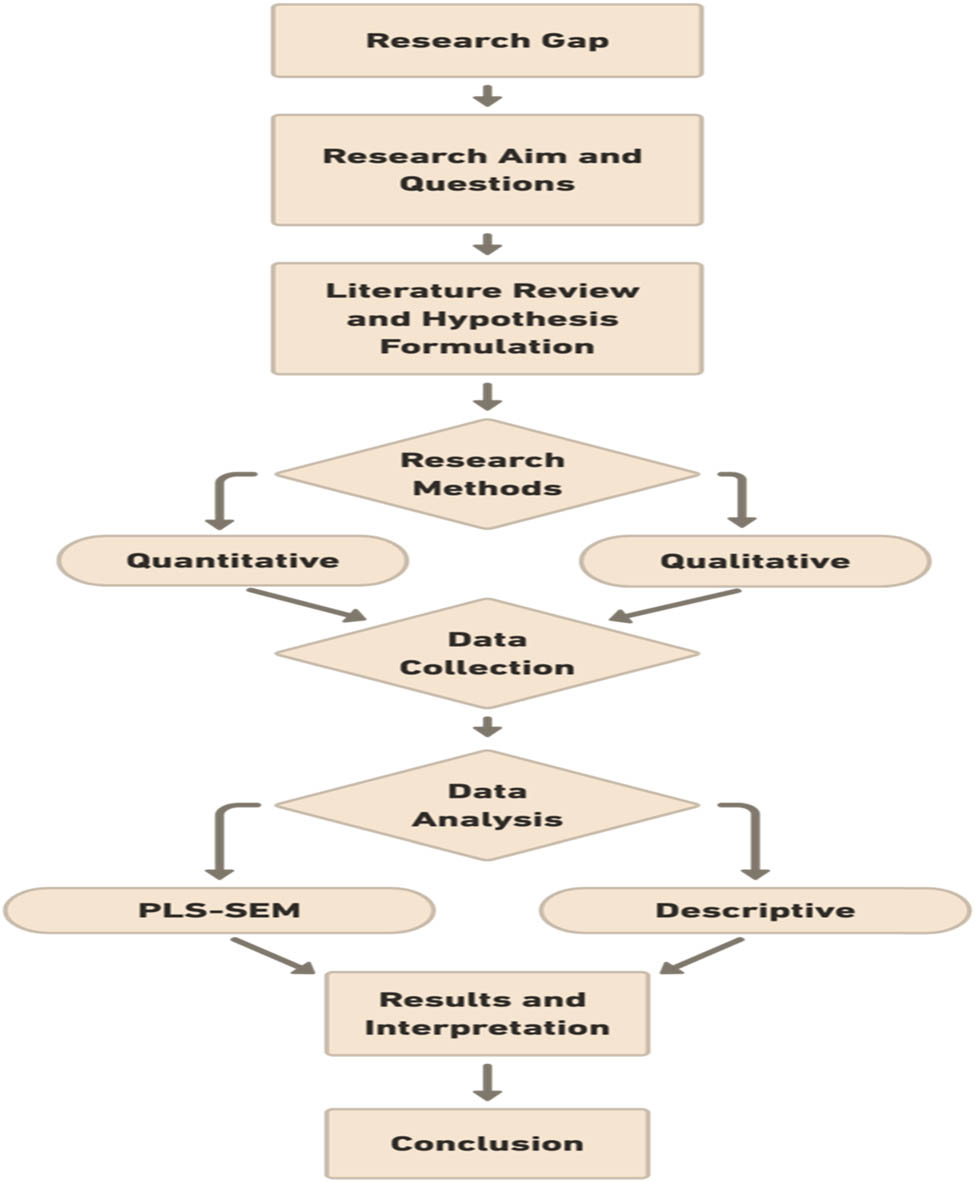
This study adopted the mixed methods research (quantitative methods are dominant and qualitative methods are less dominant but data were collected concurrently), as some scholars [50,51] suggest. Mixed methods research is an attempt to legitimize the use of multiple approaches to answering research questions, rather than to limit or constrain researchers’ choices (i.e., it rejects dogmatism). It is an expansive and creative form of research, not a restrictive form of research. It is inclusive, pluralistic, and complementary, and it suggests that researchers take an eclectic approach to selecting methods and thinking about and conducting research [50]. The quantitative methods were adopted to explain food consumption and diet diversity among Indonesians by performing statistical inference. The qualitative methods were adopted to provide additional information to better explain the findings from the quantitative methods. The research was conducted in Hungary and focused on the Indonesian community from July to October 2024. The procedure of this study is presented in Figure 2.
Flow of the study procedure (source: authors, original, 2025).
2.1 Quantitative method
This study uses a quantitative method, with a survey approach using questionnaires [52]. The unit of analysis is the individual consumer. Data were collected in Hungary by distributing online questionnaires through social media (Google Forms) and offline questionnaires to Indonesians with snowball sampling methods [53]. The offline questionnaire was administered by visiting various public/commercial spaces frequented by Indonesians. The answers to these questionnaire questions are on a Likert scale [52]. A five-point Likert Scale provides respondents with five options, including two extremes, two intermediates, and one neutral opinion, and can be used to measure agreement, likelihood, frequency, importance, quality, and more [54].
Figure 2 outlines the study procedure, starting with the research gap in migrant food consumption and dietary diversity. It examines how availability, convenience, culture, and substitution shape food choices, with policy implications for migrant food security. The study focuses on the Indonesian community in Hungary, hypothesizing that convenience and cultural persistence increase rice consumption while substitution decreases it but enhances dietary diversity. Using a quantitative methods, data from 125 respondents (July–October 2024) is analyzed via PLS-SEM in RStudio and descriptive statistics in Ms Excel. The findings contribute to understanding migrant dietary adaptation and food security.
Before distributing the questionnaires, all participants were informed about the purpose and scope of the research. Participation was voluntary, and informed consent was obtained from each participant. Respondents were explicitly asked for their willingness to participate and were informed that they could withdraw from the study at any time without any consequences. Only those who agreed to participate were included in the study.
During the survey period, responses from 128 respondents were obtained. After a review and sorting process, leaving three respondents who were excluded due to inconsistencies or incomplete information provided, it was determined that 125 of the responses were valid and suitable for analysis. A sample of 125 respondents is sufficient for a population of 1,191 using systematic sampling, the sampling ratio (sample size/population size) is 10.5%, ensuring fair representation if the population is well-randomized [52,55,56]. This comprehensive approach made it possible to collect a solid and valid data set, ensuring that the findings are reliable and representative of the perspectives of Indonesians in Hungary.
The demographic profile of the 125 respondents, presented in Table 2, reveals that the majority are male, productive age (15–58) and non-productive age (59 or above) with postgraduate education, single marital status, students residing in urban areas, living in flats, and typically having one family member. The sample distribution in Hungary shows that half of the respondents were from the Capital City (Budapest, 48%) and the rest (52%) were from other larger cities.
Demographic characteristics respondents (N = 125)
| No. | Socio-demographic characteristics | Total (person) | Proportion (%) | Type of sample | Sample measurement | |
|---|---|---|---|---|---|---|
| 1. | Age* | 15–58 (productive age) | 124 | 99% | Categorical | 15–58 (1); 59 or above (2) |
| 59 or above (pension age/non-productive) | 1 | 1%. | ||||
| 2 | Gender | Male | 64 | 52.2 | Categorical | Male (1) and female (2) |
| Female | 61 | 48.8 | ||||
| 3 | Education level | Senior high school or less | 16 | 12.8 | Categorical | Senior High School or less (1); vocational or undergraduate (2); and Postgraduate or more (3) |
| Vocational and undergraduate | 34 | 27.2 | ||||
| Postgraduate | 75 | 60 | ||||
| 4 | Marital status | Single | 65 | 52 | Categorical | Single (1); married (2) |
| Married | 60 | 48 | ||||
| 5 | Employment status in Hungary | Students | 73 | 58.4 | Categorical | Students (1); employed (2); and unemployed (3) |
| Employed | 40 | 32 | ||||
| Unemployed | 12 | 9.6 | ||||
| 6 | Location | Budapest | 60 | 48 | Categorical | Budapest (1) and outside Budapest (2) |
| Outside Budapest | 65 | 52 | ||||
| 7 | Place of Indonesian origin by region | Java Island | 85 | 68 | Categorical | Java (1); Sumatera (2); Bali, Sulawesi, Kalimantan and Nusa Tenggara (3) |
| Sumatera Island | 24 | 19.2 | ||||
| Bali, Sulawesi Island, Kalimantan Island, and Nusa Tenggara Island | 16 | 12.8 | ||||
| 8 | Income | Less than 100.000 HUF ($274) | 13 | 10.4 | Categorical | Less than 100.000 HUF (1); 100.001–200.000 HUF (2); 200.001–300.000 HUF (3); 300.001–400.000 HUF (4); and 400.001 HUF or more (5) |
| 100.001–200.000 HUF ($274–$548) | 30 | 24 | ||||
| 200.001–300.000 HUF ($549–$823) | 36 | 28.8 | ||||
| 300.001–400.000 HUF ($823.37–$1,097) | 12 | 9.6 | ||||
| 400.001 HUF ($1,098) or more | 34 | 27.2 | ||||
| 9 | Type of residence: | Flat | 77 | 61.6 | Categorical | House (1); flat (2); and dormitory (3) |
| Dormitory | 38 | 30.4 | ||||
| House | 10 | 8 | ||||
| 10 | Family members in Hungary | 1 person | 89 | 71.2 | Categorical | 1 Person (1); 2 Persons (2); 3 Persons and more (3) |
| 2 persons | 20 | 16 | ||||
| 3 persons and more | 16 | 12.8 |
The distribution of samples by the province of origin in Indonesia shows that 90.4% of the respondents came from West Java (21.6%), East Java (19.2%), DKI Jakarta (10.4%), Central Java (8.8%), and North Sumatera (5.6%), and 2–5% of the respondents were from DI Yogyakarta, Bali, Banten, South Sumatera, Riau Islands, Aceh, South Sulawesi, and West Sulawesi. The remaining respondents came from other Indonesian provinces, such as Jambi, East Kalimantan, West Nusa Tenggara, West Kalimantan, South Kalimantan, Central Kalimantan, Lampung, and Riau.
The respondents were then asked some questions, as presented in Table 3, developed from Table 1. The responses to the questionnaire are based on a 5-point Likert scale [54]. In addition, some questions from the convenience construct use open questions.
Type of data collected through a survey
| Construct | Indicators | Statements/questions |
|---|---|---|
| Availability | Availability_1 | Rice sold in stores in Hungary is available in sufficient quantities (not scarce). |
| Answer: 1 = strongly disagree, 2 = disagree, 3 = neutral, 4 = agree, and 5 = strongly agree | ||
| Availability_2 | Rice sold in stores in Hungary is available in sufficient qualities (not scarce). | |
| Answer: 1 = strongly disagree, 2 = disagree, 3 = neutral, 4 = agree, and 5 = strongly agree | ||
| Convenience | Conevenience_1 | How much time (in minutes) do you spend preparing rice and the side dishes? |
| Open question | ||
| Convenience_2 | How much time (in minutes) do you spend cooking rice and the side dishes? | |
| Open question | ||
| Convenience_3 | How much time (in minutes) do you spend consuming rice and the side dishes? | |
| Open question | ||
| Convenience_4 | How much time (in minutes) do you spend cleaning preparation tools, cooking, and consuming rice and side dishes? | |
| Open question | ||
| Food Culture | Culture_1 | How often do you consume rice per day in Indonesia? |
| Answer: 1 = never, 2 = rarely, 3 = occasionally, 4 = often, and 5 = always | ||
| Culture_2 | I have been eating rice since childhood while living in Indonesia. | |
| Answer: 1 = strongly disagree, 2 = disagree, 3 = neutral, 4 = agree, and 5 = strongly agree | ||
| Culture_3 | My family in Indonesia has been consuming rice for generations. | |
| Answer: 1 = strongly disagree, 2 = disagree, 3 = neutral, 4 = agree, and 5 = strongly agree | ||
| Adoption | Subtitution_1 | How often do you substitute rice with bread in a day? |
| Answer: 1 = never, 2 = rarely, 3 = occasionally, 4 = often, and 5 = always | ||
| Subtitution_2 | How often do you substitute rice with wheat/oat in a day? | |
| Answer: 1 = never, 2 = rarely, 3 = occasionally, 4 = often, and 5 = always | ||
| Subtitution_3 | How often do you substitute rice with pasta in a day? | |
| Answer: 1 = never, 2 = rarely, 3 = occasionally, 4 = often, and 5 = always | ||
| Subtitution_4 | How often do you substitute rice with potato/sweet potato in a day? | |
| Answer: 1 = never, 2 = rarely, 3 = occasionally, 4 = often, and 5 = always | ||
| Subtitution_5 | How often do you substitute rice with How often do you substitute rice with vegetables/fruits in a day? | |
| Answer: 1 = never, 2 = rarely, 3 = occasionally, 4 = often, and 5 = always | ||
| Consumption pattern | Consumption_1 | How many times do you include rice as part of your daily routine? |
| Answer: 1 = never, 2 = once, 3 = twice, 4 = three times and 5 = more than three times | ||
| Consumption_2 | I limit my rice consumption in a day. | |
| Answer: 1 = strongly disagree, 2 = disagree, 3 = neutral, 4 = agree, and 5 = strongly agree | ||
| Consumption_3 | What is your estimated portion of rice compared to the side dishes in a single meal? | |
| Answer: 0%, 25%, 50%, and 75% | ||
| Consumption_4 | I consume rice in a balanced/proportional way in a single meal (Note: ‘Unbalanced’ means a high proportion of rice, while ‘balanced’ means that the amount of rice and side dishes is proportionate) | |
| Answer: 1 = very little, 2 = little, 3 = moderate, 4 = a lot and 5 = very much | ||
| Consumption_5 | How much rice do you consume compared to other sources of carbohydrates (bread, pasta, potatoes, wheat/oats)? | |
| Answer: 1 = very little, 2 = little, 3 = moderate, 4 = a lot and 5 = very much | ||
| Diversity/variety | Diversity_1 | I consume various sources of carbohydrates (wheat/oats and rice) as my daily staple foods. |
| Answer: 1 = never, 2 = rarely, 3 = occasionally, 4 = often, and 5 = always | ||
| Diversity_2 | I consume various sources of carbohydrates and non-carbohydrates (bread, wheat/oats, rice, pasta, sweet potatoes/potatoes, vegetable/fruit) as my daily staple foods. | |
| Answer: 1 = never, 2 = rarely, 3 = occasionally, 4 = often, and 5 = always | ||
| Access | Price | The price of rice sold in stores in Hungary is affordable. |
| Answer: 1 = strongly disagree, 2 = disagree, 3 = neutral, 4 = agree, and 5 = strongly agree | ||
| Income | My income is sufficient to buy rice for a month. | |
| Answer: 1 = strongly disagree, 2 = disagree, 3 = neutral, 4 = agree, and 5 = strongly agree |
Data analysis in this study was carried out using a PLS-SEM with RStudio because it can create and analyze PLS path models [16]. SEM enables researchers to simultaneously model and estimate complex relationships among multiple dependent and independent variables, and PLS-SEM aims at maximizing the endogenous latent variables’ explained variance by estimating partial model relationships in an iterative sequence of ordinary least squares regressions [16]. In PLS-SEM, the measurements used use a reflective measurement model that assesses how well the indicators reflect the constructs used, and the structural model tests the causal relationships between these constructs [16,60,61].
The reflective measurement model evaluates reflective indicator loadings, internal consistency reliability (using Cronbach’s alpha, reliability rhoA, and composite reliability rhoC), convergent validity (using average variance extracted or AVE), and discriminant validity (using heterotrait–monotrait or HTMT ratio) with the following criteria [16,60,62]: first, the threshold of reflective indicator loadings is 0.50 for a sample size of 120; second, the threshold of internal consistency reliability (Cronbach’s alpha, reliability rhoA, and composite reliability rhoC) is 0.70 but values above 0.95 might suggest that the items are too similar, reducing the construct’s validity; third, the threshold of convergent validity (AVE) is 0.50 or higher indicates that the construct explains at least 50% of the variance in its indicators; and fourth, threshold discriminant validity (HTMT) is 0.90.
Structural models are used to test theoretical frameworks from a predictive perspective, especially when the model is complex, involves many constructs and relationships, and includes formally measured constructs, with the following criteria [16,61]: First, the significance of path coefficients is assessed using bootstrapping by comparing t-values to critical values (where a t-value for two-tailed is as follow: above 1.645 at significance level of 0.1, 1.96 at significance level 0.05, and above 2.576 at significance level 0.01); second, the value of variance inflation factor (VIF) should be close to 3 and lower for non-collinearity issues; third, the value coefficient of determination (R²) is 0.25 (weak), 0.50 (moderate), 0.75 (substantial), and 0.90 (higher typically indicative of overfitting).
-
Informed consent: All participants provided written informed consent before participating and completing the questionnaire, and their anonymity was protected by coding and secure data storage. The authors declare no conflicts of interest relevant to this research.
2.2 Qualitative method
The concurrent explanatory design demonstrates that while qualitative methods support quantitative findings, the primary focus remains on quantitative methods but both data were collected at the same time, locations, instruments, and samples. This design ensures a comprehensive understanding of the research problem through mixed methods, consistent with the user’s task of emphasizing quantitative over qualitative approaches [63]. A qualitative method was used to provide a more detailed explanation of the questions previously addressed in the quantitative section. The sample is Indonesian immigrants in Hungary (n = 125) which sample was withdrawn by snowballing techniques. The questionnaire asked respondents about the percentages of their food portions. The answers were open questions. Some questions asked to respondents and relevant to this study report are as follows: “Why do you limit your rice consumption?” and “What is the price per kilogram of rice that you buy in Hungarian food retailers?” The collected data were processed using Ms Excel to display the percentage distribution of frequencies. The results were then explained using narrative description only.
3 Results and discussion
This section discusses the results of statistical analysis, consisting of the reflective measurement model (i.e., reflective indicator load, internal consistency reliability, convergent validity, and discriminant validity) and structural model (i.e., path coefficient, collinearity test, explanatory test).
The results of the reflective measurement model are presented in Tables 4 and 5, with the following explanation. First, the results show that all reflective indicator loading values for non-interaction variables are higher than 0.50 (for a sample size greater than 120), which means that all indicators are reliable [16,62]. Second, all internal consistency reliability values (i.e., Cronbach’s alpha, rhoA, and rhoC) for the non-interaction variables were above the minimum value of 0.70 for the construct of availability, convenience, substitution, and diversity, indicating that all constructs (excluding the interaction variable) are reliable [16,61,62]. Cronbach’s alpha measure of reliability ranges from 0 to 1, with values of 0.60 to 0.70 deemed the lower limit of acceptability [62]. The results of reliability indicators of the construct of culture and consumption vary. For the construct of culture, the value of Cronbach’s alpha is 0.690, lower than the threshold (0.70) but the rhoA and rhoC values are, respectively, 0.750 and 0.812. It means the construct of culture is still reliable. For the construct of consumption, the values of Cronbach’s alpha and rhoC are, respectively, 0.327 and 0.657, lower than the threshold value (0.70), but the value of rhoA is 0.811, fulfilling the threshold value of 0.70, meaning that the construct is still reliable, as well [16,61]. Third, all values of AVE for interacting variables fulfill the threshold of 0.50, meaning that all the constructs are valid [16]. Fourth, the values of the HTMT ratio are less than the threshold of 0.85, meaning that all the constructs are valid [16].
Results of the reliability and validity test
| Construct | Indicator | Indicator loading | Cronbach’s alpha | rhoC | AVE | rhoA |
|---|---|---|---|---|---|---|
| Availability | Availability_1 | 0.998 | 0.710 | 0.797 | 0.676 | 7.444 |
| Availability_2 | 0.595 | |||||
| Convenience | Convenience_1 | 0.853 | 0.797 | 0.901 | 0.821 | 0.991 |
| Convenience_2 | 0.956 | |||||
| Convenience_3* | — | |||||
| Convenience_4* | — | |||||
| Culture | Culture_1 | 0.828 | 0.690 | 0.812 | 0.592 | 0.750 |
| Culture_2 | 0.808 | |||||
| Culture_3 | 0.661 | |||||
| Substitution | Substitution_1 | 0.737 | 0.797 | 0.860 | 0.553 | 0.802 |
| Substitution_2 | 0.753 | |||||
| Substitution_3 | 0.773 | |||||
| Substitution_4 | 0.687 | |||||
| Substitution_5 | 0.764 | |||||
| Consumption | Consumption_1 | 0.804 | 0.327 | 0.657 | 0.536 | 0.811 |
| Consumption_2 | −0.771 | |||||
| Consumption_3 | 0.664 | |||||
| Consumption_4 | 0.652 | |||||
| Consumption_5 | 0.759 | |||||
| Diversity | Diversity_1 | 0.886 | 0.751 | 0.889 | 0.801 | 0.754 |
| Diversity_2 | 0.903 | |||||
| Access | Price | 1.000 | 1.000 | 1.000 | 1.000 | 1.000 |
| Income | 1.000 | 1.000 | 1.000 | 1.000 | 1.000 | |
| Substitution × income | Substitution × income | 1.000 | 1.000 | 1.000 | 1.000 | 1.000 |
| Substitution × price | Substitution × price | 1.000 | 1.000 | 1.000 | 1.000 | 1.000 |
*Unreliable indicators.
Result of discriminant validity: HTMT ratio
| Construct | Availability | Convenience | Culture | Substitution | Price | Income | Substitution × income | Substitution × price | Consumption | Diversity |
|---|---|---|---|---|---|---|---|---|---|---|
| Availability | ||||||||||
| Convenience | 0.191 | |||||||||
| Culture | 0.157 | 0.167 | ||||||||
| Substitution | 0.200 | 0.170 | 0.475 | |||||||
| Price | 0.343 | 0.130 | 0.109 | 0.221 | ||||||
| Income | 0.395 | 0.120 | 0.165 | 0.071 | 0.183 | |||||
| Substitution × income | 0.006 | 0.044 | 0.143 | 0.163 | 0.139 | 0.221 | ||||
| Substitution × price | 0.193 | 0.166 | 0.137 | 0.032 | 0.159 | 0.154 | 0.363 | |||
| Consumption | 0.119 | 0.197 | 0.547 | 0.537 | 0.065 | 0.084 | 0.275 | 0.201 | ||
| Diversity | 0.167 | 0.230 | 0.135 | 0.563 | 0.080 | 0.231 | 0.256 | 0.039 | 0.183 |
The lower reliability of the “eating” and “cleaning” aspects of food convenience serves as markedly unreliable indicators for variables 3 and 4 due to important variations in individual views and habits. Preparation and cooking times are often measured objectively; however, the experience of eating as well as cleaning food can vary considerably based on many factors, including eating speed, portion size, and household practices. Additionally, respondents may interpret these aspects differently, leading to greater variability in responses.
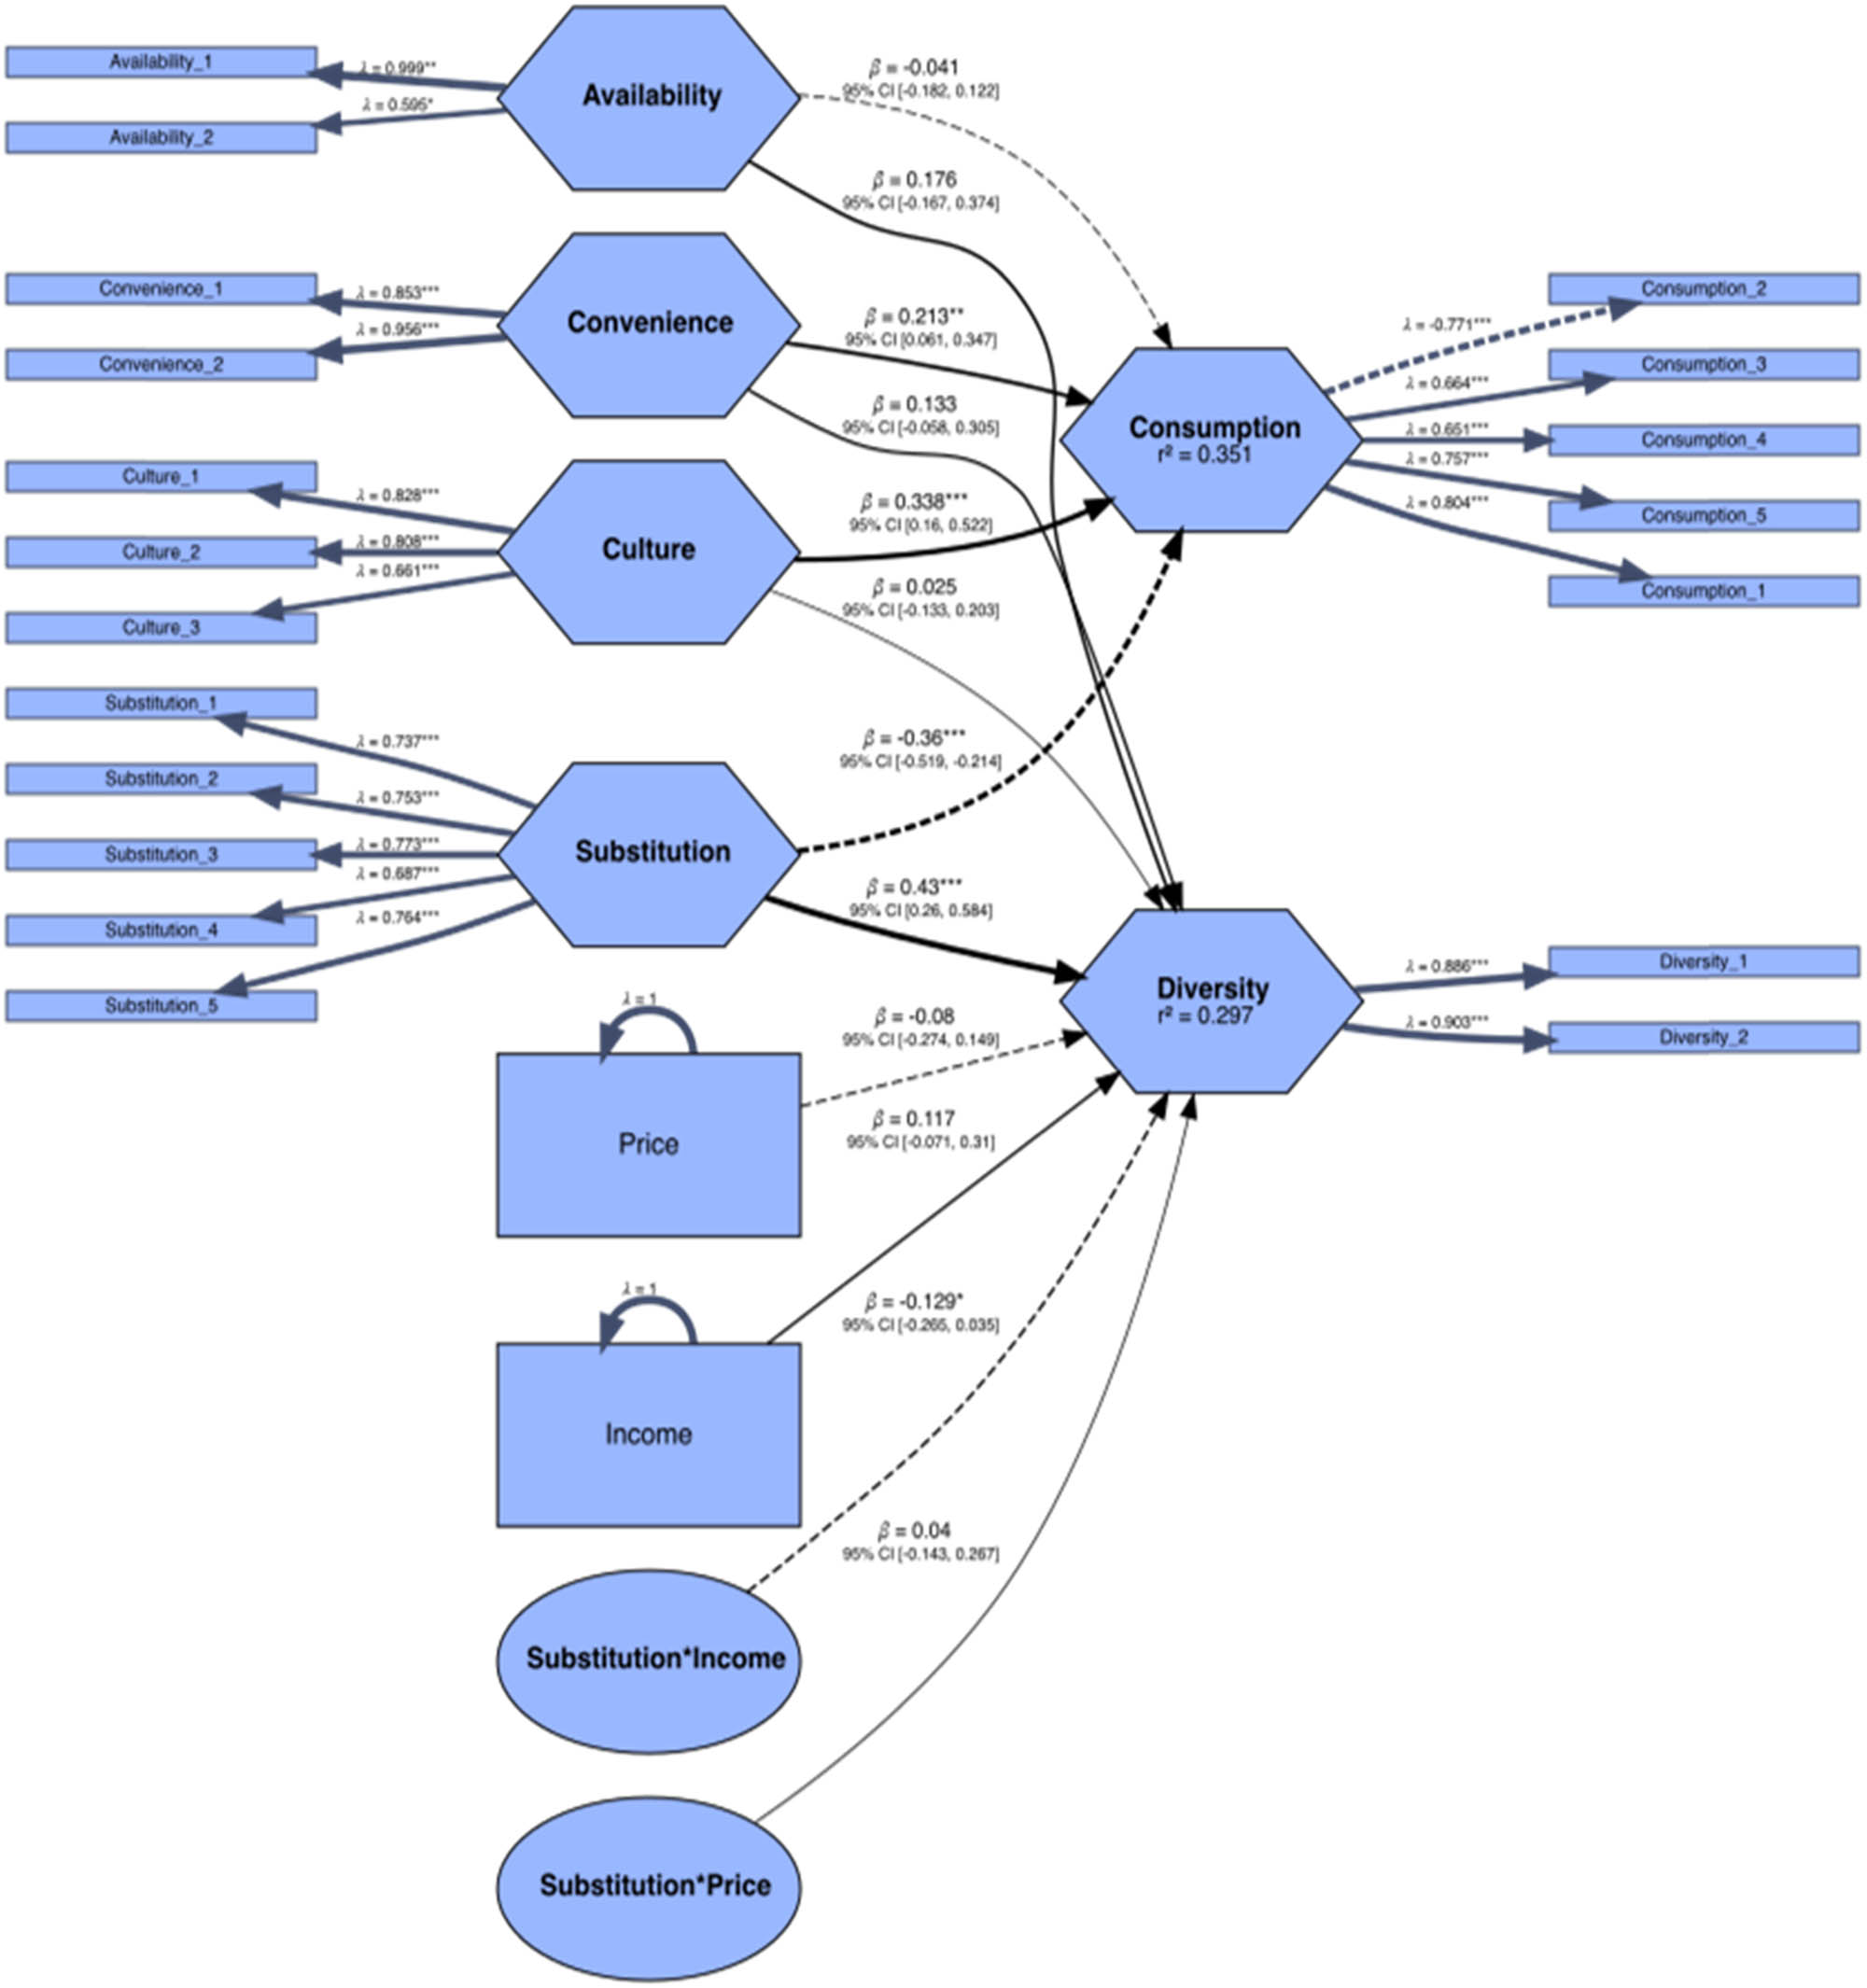
The result of the structural model is reported. The path coefficients are shown in Table 6. First, the path coefficient from convenience to consumption is 0.213 (t statistic = 2.904; P < 0.01). Thus, the argument stating that convenience increases rice consumption among Indonesians in Hungary is supported. A one-point increase in convenience will increase rice consumption among Indonesian immigrants in the host country by 21.3%. Second, the path coefficient from culture to consumption is 0.338 (t statistic = 3.871; P < 0.01). Thus, the argument stating that the culture of rice consumption in the country of origin increases rice consumption in the host country is supported. A one-point increase in cultural persistence will increase rice consumption among Indonesian immigrants in the host country by 33.8%. Third, the path coefficient from substitution to consumption is −0.359 (t statistic = −4.674; P < 0.01). Thus, the argument stating that the substitution factor decreases rice consumption among Indonesians in Hungary is supported. A one-point increase in substitution will decrease rice consumption among Indonesian immigrants by 35.9%. Fourth, the path coefficient from substitution to diversity is 0.430 (t statistic = 5.143; P < 0.01). Thus, the argument stating that the substitution factor increases food diversity among Indonesians in the host country is supported. A one-point increase in food substitution will increase food diversity among Indonesian immigrants in the host country by 43%. Fifth, the path coefficient from the moderating variable of substitution and income to diversity is −0.129 (t statistic = −1.738), which is significant at P < 0.1 level. Thus, the argument stating that the effect of substitution on food diversity is weakening when moderated by income is partially supported. The relationship among the constructs is portrayed in Figure 3.
Result of structural model: path coefficients
| The path coefficient | Original est. | Bootstrap mean | Bootstrap SD | t stat. | 2.5% CI | 97.5% CI | Description |
|---|---|---|---|---|---|---|---|
| Availability → consumption | −0.042 | −0.038 | 0.081 | −0.514 | −0.195 | 0.128 | Unsupported |
| Availability → diversity | 0.176 | 0.149 | 0.137 | 1.282 | −0.191 | 0.368 | Unsupported |
| Convenience → consumption | 0.213** | 0.209 | 0.073 | 2.904 | 0.065 | 0.335 | Supported |
| Convenience → diversity | 0.133 | 0.126 | 0.099 | 1.343 | −0.083 | 0.312 | Unsupported |
| Culture → consumption | 0.338** | 0.348 | 0.087 | 3.871 | 0.177 | 0.518 | Supported |
| Culture → diversity | 0.025 | 0.032 | 0.086 | 0.290 | −0.124 | 0.219 | Unsupported |
| Substitution → consumption | −0.359*** | −0.365 | 0.077 | −4.674 | −0.499 | −0.204 | Supported |
| Substitution → diversity | 0.430*** | 0.433 | 0.084 | 5.143 | 0.264 | 0.585 | Supported |
| Price → diversity | −0.080 | −0.072 | 0.111 | −0.722 | −0.289 | 0.135 | Unsupported |
| Income → diversity | 0.117 | 0.122 | 0.100 | 1.163 | −0.088 | 0.308 | Unsupported |
| Substitution × income → diversity | −0.129* | −0.123 | 0.074 | −1.738 | −0.259 | 0.029 | Supported |
| Substitution × price → diversity | 0.040 | 0.054 | 0.101 | 0.392 | −0.130 | −0.130 | Unsupported |
Note: ***significant under α = 0.01 (2.576), **significant under α = 0.05 (1.96), and * significant under α = 0.1 (1.645) under the two-tailed test.
Determinants of rice consumption and dietary diversity: a structural model. Note: ***significant under α = 0.01 (2.576), **significant under α = 0.05 (1.96), and *significant under α = 0.1 (1.645) under the two-tailed test.
The second result of the structural model is explanatory power (R 2). Consumption has an R 2 of 0.351. It means that the variation of consumption is explained by availability, convenience, culture, and substitution by 35.1%. Therefore, this model has moderate explanatory power [61,62]. In contrast, diversity has an R 2 of 0.297. This indicates that the variation in diversity can be explained by some factors, including availability, convenience, culture, substitution, price, income, and the moderating effects of substitution on income and price, which account for 29.7% of the total variation (Figure 3). Consequently, the explanatory power of this model is somewhat limited [62].
The last result of the structural model is the collinearity test. All values of the VIF of all variables/constructs are less than the threshold of 3 points, meaning all paths have no collinearity issues [16,16,62]. The values of VIF are as follows: availability → consumption (1.015), convenience → consumption (1.023), culture → consumption (1.149), substitution → consumption (1.159), availability → diversity (1.272), convenience→ diversity (1.090), culture → diversity (1.193), substitution → diversity (1.222), price → diversity (1.227), income → diversity (1.249), substitution × income → diversity (1.224), and substitution × price → diversity (1.290).
3.1 Rice consumption
Rice consumption among Indonesian immigrants in Hungary is positively influenced by cultural attachment and convenience and negatively by substitution. This means that the longer the rice tradition and the more convenient rice is perceived to be, the higher the consumption rate. More than half of the respondents in this study confirmed a high or very high proportion of rice compared to side dishes in one-time meals, such as lunch (Figure 4, bottom). This leads to imbalanced consumption, with much more rice than side dishes (Figure 4, top). Additionally, some Indonesians maintain rice consumption with varying frequencies, reflecting strong cultural persistence.
These findings are consistent with studies on other Asian immigrant communities, such as Vietnamese immigrants in Moscow who continue to prefer their native foods [10] and Filipinos in America who maintain strong connections to their home food culture by sending traditional foods to family members [8]. Similarly, studies by some researchers [5,9,64] support the persistence of rice as a staple among many Asian immigrants, emphasizing the deep cultural roots of food preferences despite geographic relocation. Indonesian immigrants in Hungary continue to consume rice due to a combination of cultural identity, lifelong dietary habits, and convenience. As a staple food from childhood, rice remains deeply embedded in their eating patterns, providing a sense of familiarity and emotional connection to home. Family traditions and social influences further reinforce its consumption, as shared meals help maintain cultural ties. In addition, many immigrants find rice more satisfying and versatile than local carbohydrate alternatives, making substitution less appealing. While some moderation and diversification occur, the persistence of rice consumption underscores its role not only as a food but also as a tradition in a foreign environment.
Table 7 provides a comprehensive overview of Figure 4 (bottom) on rice consumption patterns among the Indonesian community in Hungary, with a particular focus on four key areas: a comparison of rice consumption with other carbohydrate sources, the establishment of recommended limits for rice consumption, the frequency of rice intake, and the balance of rice in their overall diet. The majority of respondents (56%) expressed a neutral or moderate preference for rice compared to other carbohydrates. Additionally, a significant proportion (50.4%) indicated a moderate frequency of rice consumption. It is noteworthy that 56% of respondents also indicated that they balance their rice consumption with other food sources. Nevertheless, a smaller proportion (15.2%) indicated a strong preference for limiting their rice intake. The finding that 15.2% of respondents have a strong preference for limiting their rice intake is further clarified by quantitative data and open-ended questionnaire responses. The main reasons for limiting rice consumption among respondents include taste preference or desire for dietary variety (36.6%), weight control or adherence to a specific diet (34%), health concerns (11.8%), price of rice (5.9%), and other miscellaneous reasons (11.7%). This suggests that while price and availability may play a role for some individuals, personal dietary choices and health concerns are the predominant factors influencing reduced rice consumption. The data indicates that while rice remains a staple food, there is a growing trend towards moderation and diversification in carbohydrate consumption.
Distribution of responses on rice consumption in Hungary
| Rice consumption in Hungary | Strongly agree/very much/more than three times | Agree/a lot/three times | Neutral/moderate/twice | Disagree/little/once | Strongly disagree/very little/never |
|---|---|---|---|---|---|
| Rice to other carbohydrates consumption | 2.4% (n = 3) | 20.8% (n = 26) | 7.2% (n = 9) | 13.6% (n = 17) | 56% (n = 70) |
| Rice consumption limit | 15.2% (n = 19) | 25.6% (n = 32) | 16.8% (n = 21) | 17.6% (n = 22) | 24.8% (n = 31) |
| Rice consumption frequency | 3.2% (n = 4) | 15.2% (n = 19) | 5.6% (n = 7) | 25.6% (n = 32) | 50.4% (n = 63) |
| Rice consumption balance | 2.4% (n = 3) | 20.8% (n = 26) | 7.2% (n = 9) | 13.6% (n = 17) | 56% (n = 70) |
Note: n = number of respondents.
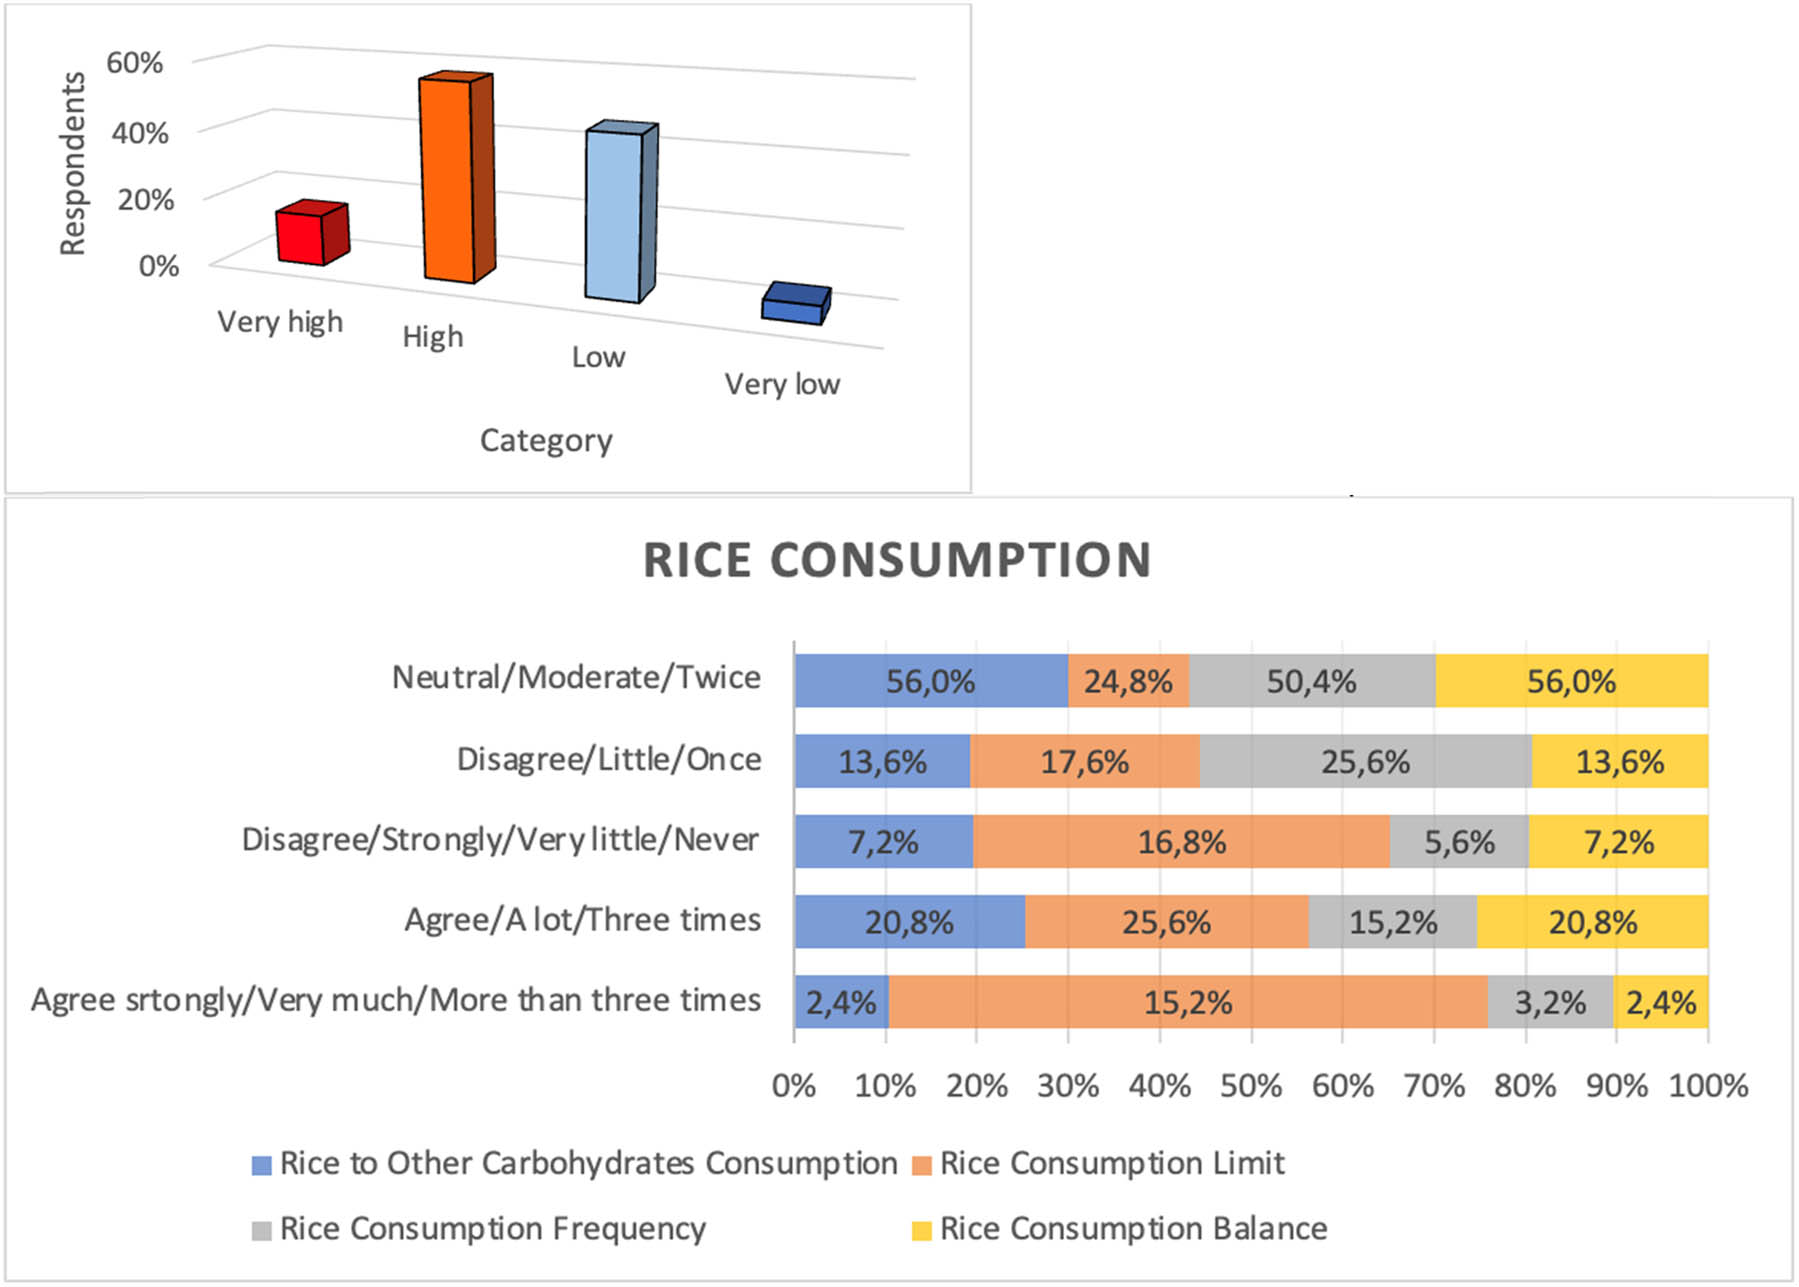
Rice consumption portions (top) rice consumption in Hungary (bottom). *1 = strongly disagree, 2 = disagree, 3 = neutral, 4 = agree, and 5 = strongly agree; **1 = never, 2 = rarely, 3 = occasionally, 4 = often, and 5 = always; and ***1 = never, 2 = rarely, 3 = occasionally, 4 = often, and 5 = always.
Figure 5 The figure highlights the strong rice consumption tradition among Indonesians in Hungary. A majority (83.2%) view rice as a cultural staple, with 50.4% eating it daily in Indonesia. Childhood habits also play a role, as 80.8% developed a rice-eating routine early on. Despite living abroad, many maintain this tradition due to deep-rooted cultural and dietary influences, in which cultural attachment to rice is shaped by lifelong childhood consumption, habits developed in Indonesia, and family traditions [5,6].
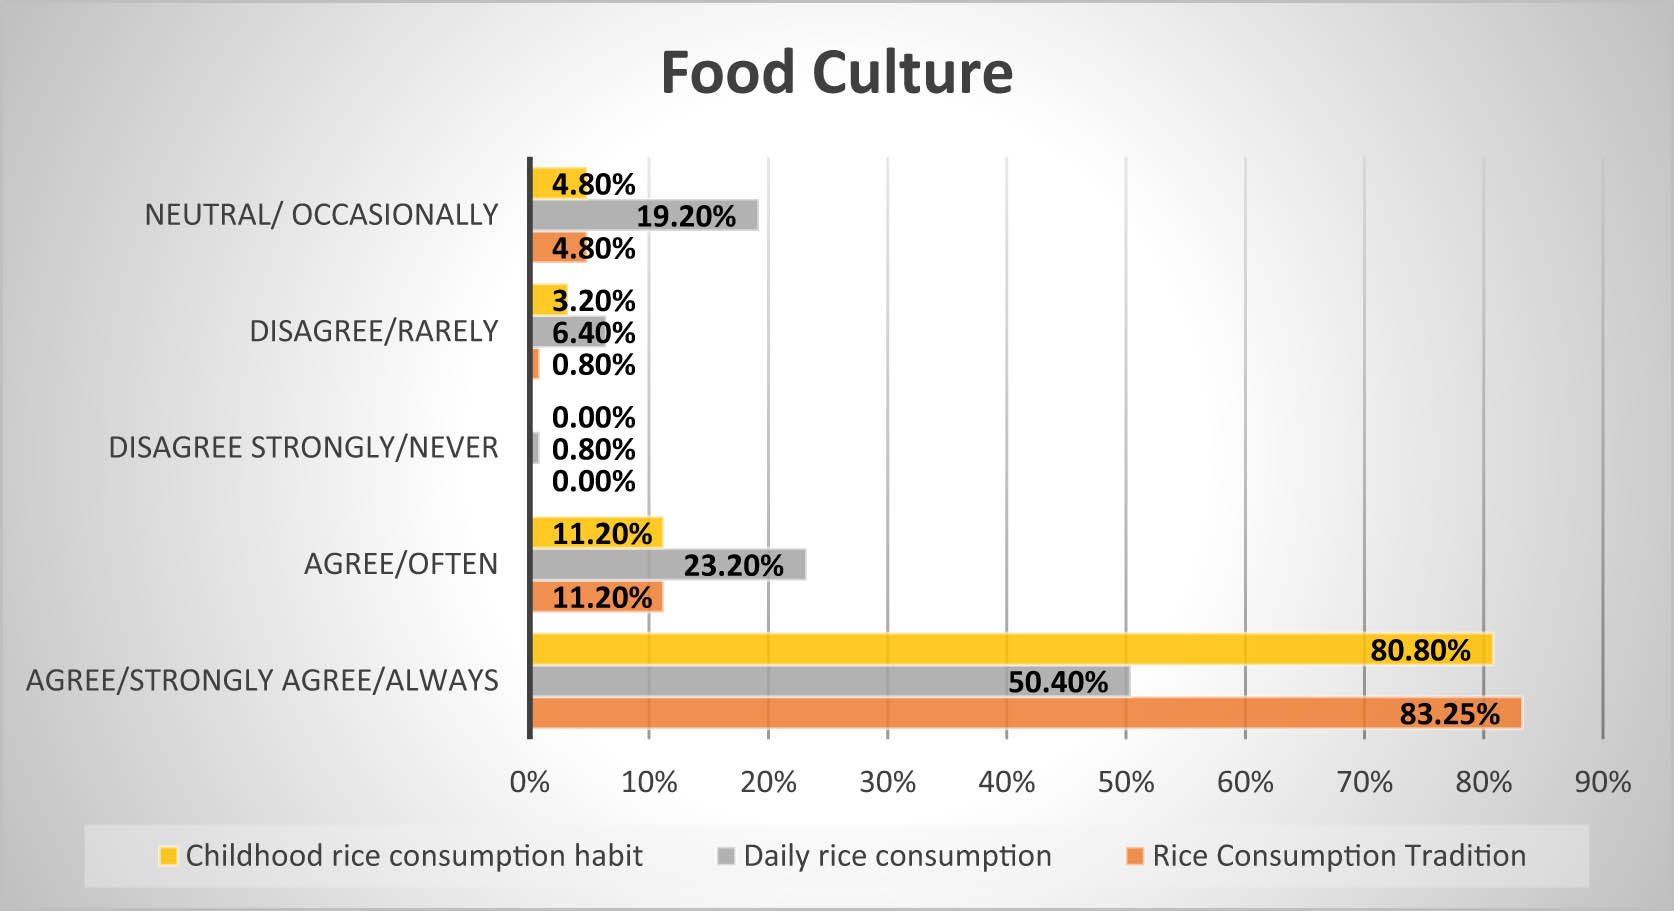
Food culture of Indonesians living in Hungary.
Due to the rice-consuming culture, Indonesians feel it is convenient to consume rice. The convenience of rice consumption is indicated by the lower time (less than 1 h) required to prepare rice, cook, eat rice and side dishes, and clean the dishes, as presented in Figure 6. Convenience is key when choosing foods, as they are easy to prepare, can be cooked simply, and require little time in preparation and clean up afterward [40]. Figure 6 shows the food convenience practices of Indonesians in Hungary, covering preparation, cooking, eating, and cleaning times. Most respondents spend 5–40 min on each activity, indicating a preference for efficiency. A smaller group takes 41–75 min, while very few exceed 76 min. This suggests that Indonesians in Hungary prioritize quick meal preparation and cleanup while maintaining their food habits.
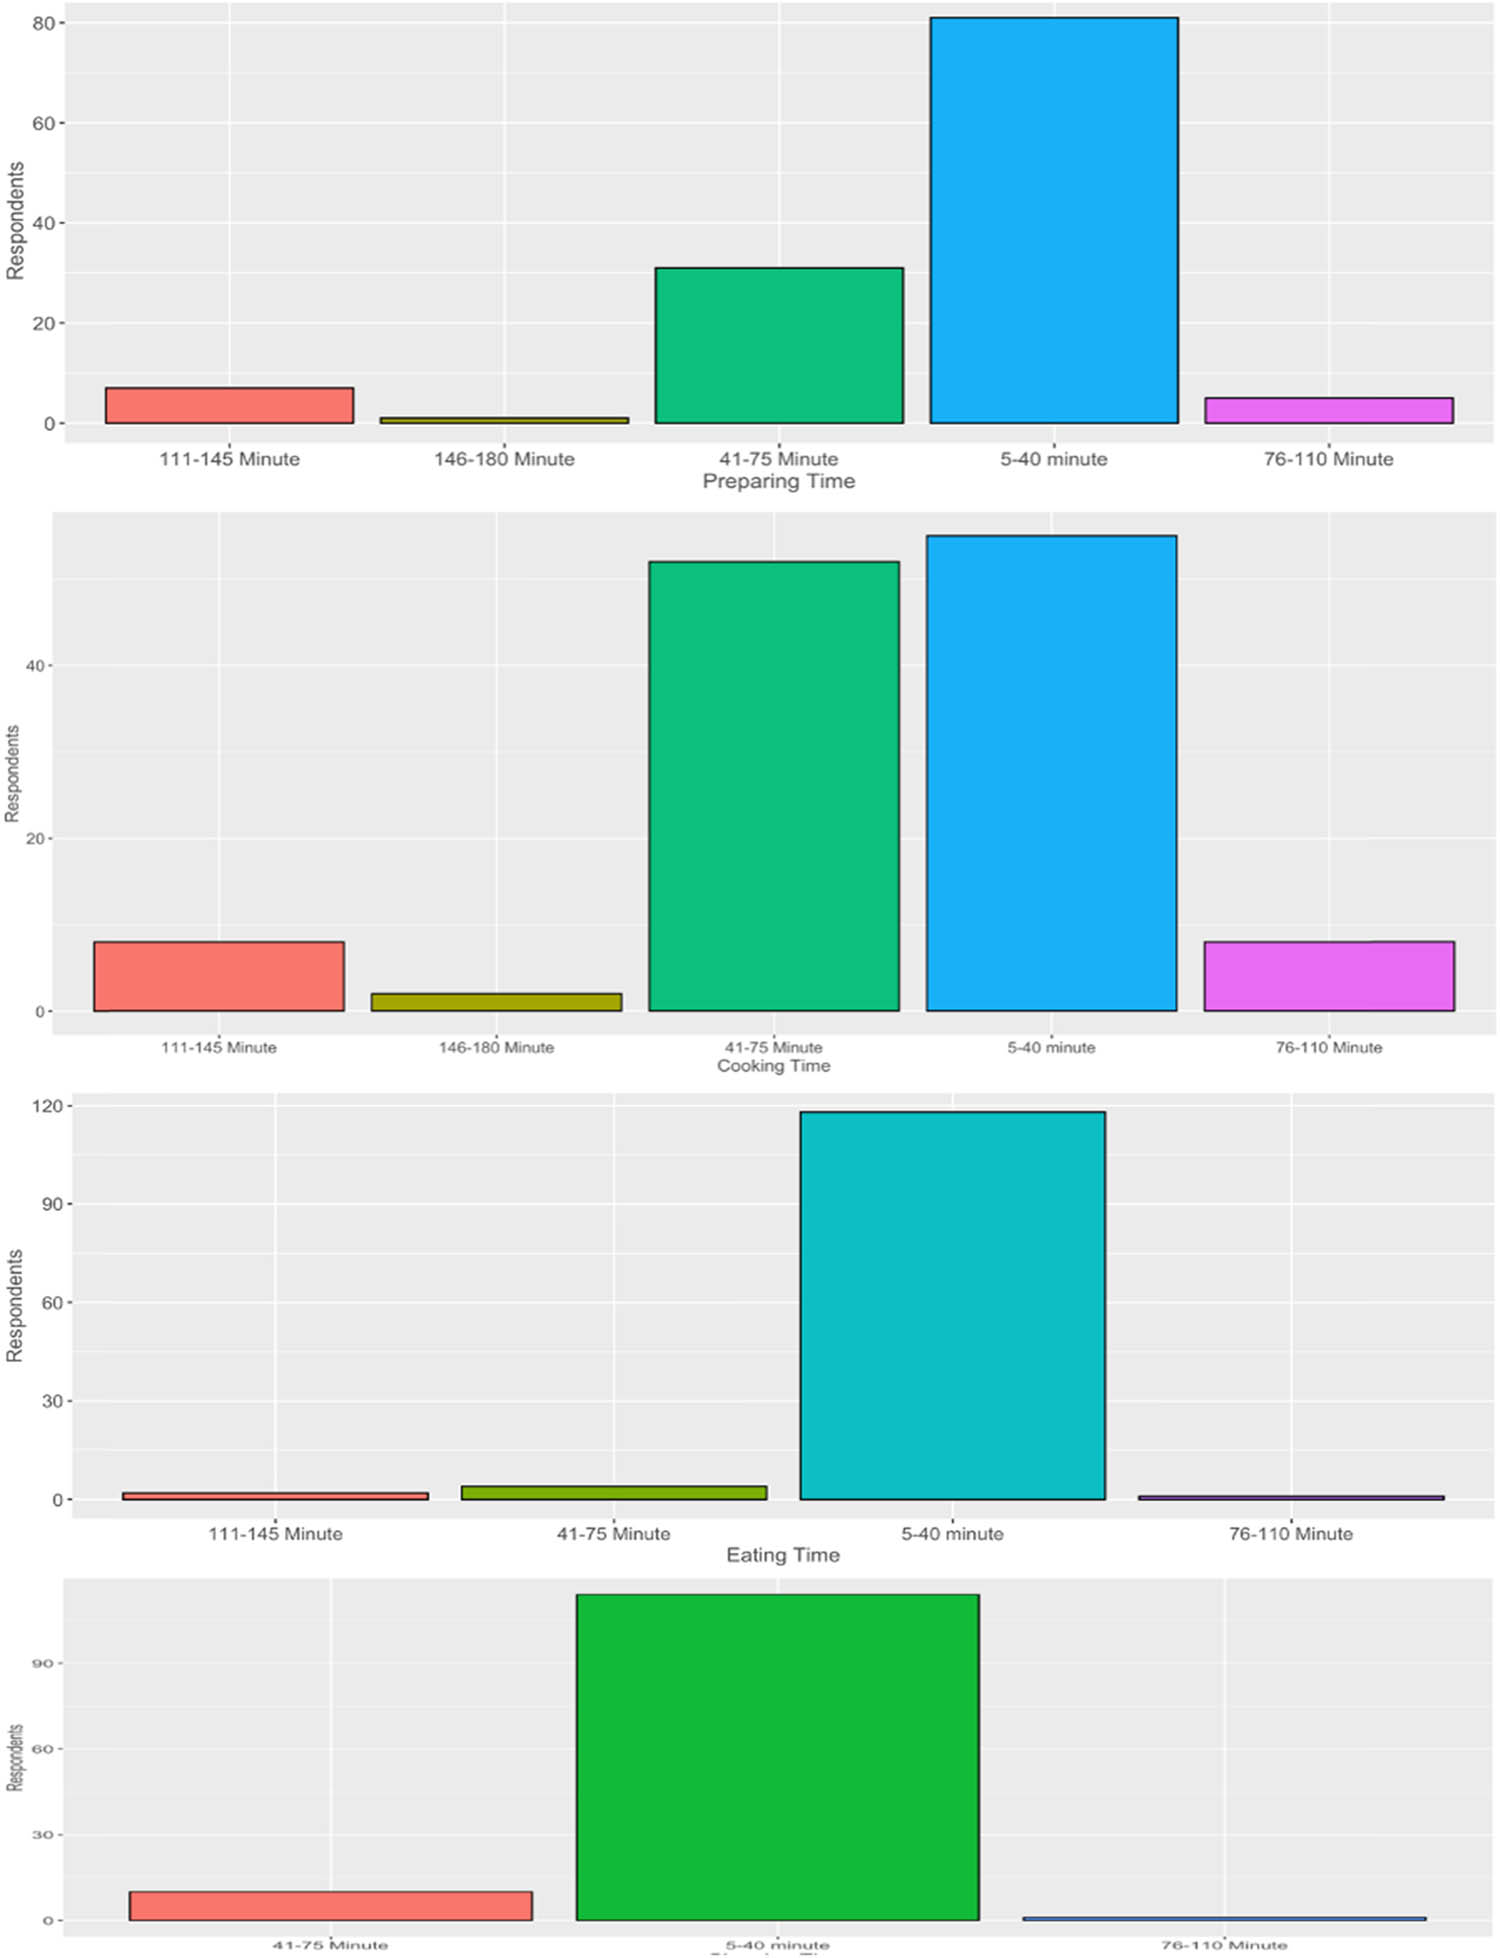
Food convenience of Indonesians living in Hungary (graph 1: food preparation time, 2: cooking time, 3: eating time, and 4: cleaning time).
Food substitution has become an important part of modern eating habits, allowing people to still be able to enjoy their meals while accommodating consumption needs by swapping local foods in the host country, everyone can customize their meals without sacrificing taste or convenience as presented in Figure 7 which is explained food substitution situation among Indonesians to local foods. In line with the research [26,45], clarify that international students in Hungary and Australia adapt to and adopt local food ingredients to meet their consumption needs. Substitution influences consumption patterns and dietary diversity by encouraging individuals to adapt to the available food options in the host country, often leading to a blend of local and traditional food practices [7,26].
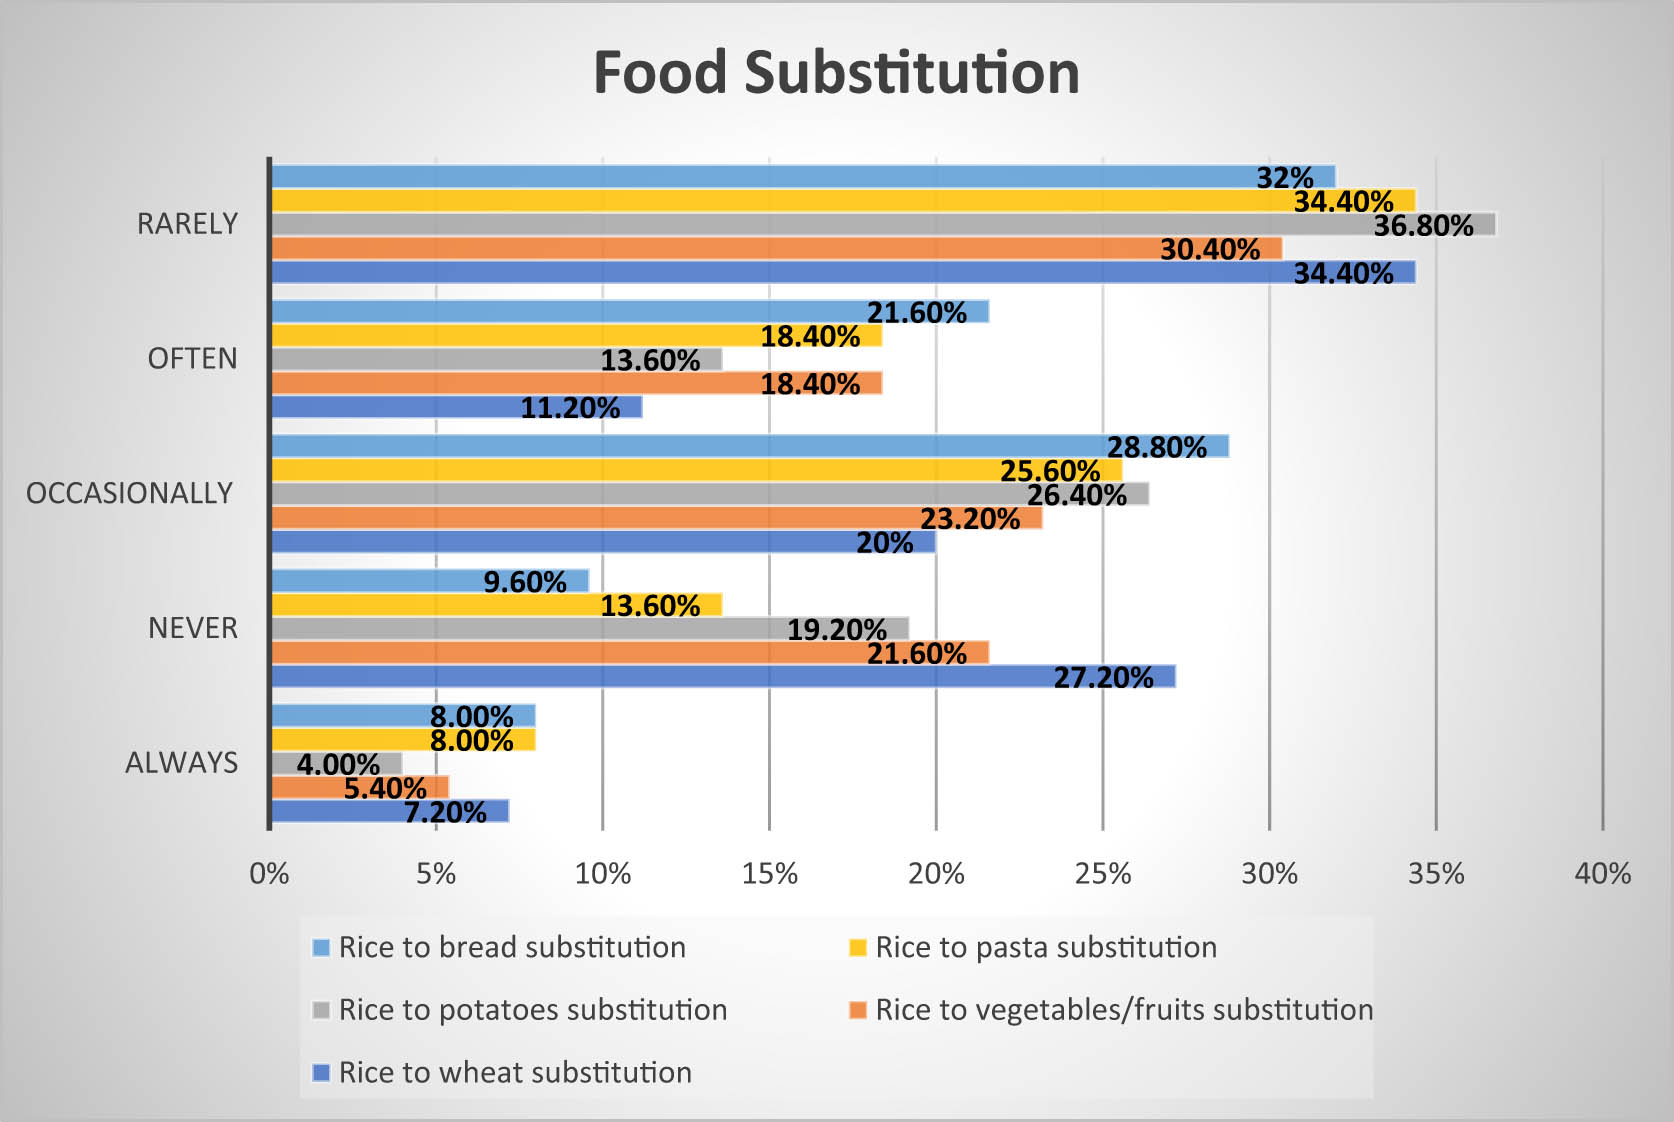
Food substitution of Indonesians living in Hungary.
3.2 Food diversity
Food diversification is important in improving food variety and nutrition, encouraging people to explore and incorporate various foodstuffs into their diets. Figure 8 shows that 32% of Indonesian immigrants in Hungary often diversify their diet with carbohydrates and non-carbohydrate sources, highlighting a shift towards more varied food consumption practices among Indonesians. Some studies [7,27] have demonstrated that some immigrants alter their dietary habits by incorporating local foods into their diet in the host country. The diversification of food sources serves to mitigate risk, bolster the sustainability of farming practices, and enhance the overall sustainability of global food systems while concomitantly reducing reliance on limited food sources [15].
The findings on dietary diversity suggest that individuals substitute rice for other foods to varying degrees, which could be influenced by several factors, including availability, affordability, and nutritional needs. The data in Figure 7 show that a significant proportion of respondents rarely substitute rice, particularly with potatoes (36.8%) and wheat (34.4%), highlighting the continued preference for rice as a staple food. However, a significant number of individuals occasionally substitute rice with other options such as potatoes (26.4%), vegetables and fruits (25.6%), and bread (28.8%), indicating some degree of dietary diversification. This variation in food substitution behavior may be related to the availability of alternative food options in different regions. In Hungary, the food supply includes 119.07 kg per capita per year of wheat and its products and 35.3 kg per capita per year of potatoes, which contribute to the overall food availability, providing an essential carbohydrate source [65]. The staple foods play a crucial role in shaping dietary habits and influencing substitution choices among consumers. Some individuals have access to diverse food sources (affordability), while others rely primarily on rice due to economic constraints (Figure 9). Nutritional considerations may also play a role, as some respondents may choose to replace rice with foods that contain more protein, fiber, or essential vitamins and minerals. For example, potato contains 79.5% of moisture, 21.5% of carbohydrates, 2.5% of protein, and 1.5% others [66]. Fruits contain some health benefits, as follows: apples (94.6 calories, 25.1 g of carbohydrate, 4.37 g of fiber, 95 mg of potassium, 10.9 mg calcium, 8.37 mg vitamin C) and bananas (1.37 g protein, 6.3 mg calcium, 34 mg magnesium, 11 mg vitamin C) [67].
Cultural factors and dietary habits also influence these food choices, and some individuals choose alternatives to add variety to their meals or to adhere to specific diets. As the respondents of this study come from different provinces in Indonesia (e.g., West Java, East Java, DKI Jakarta, Central Java, North Sumatera, DI Yogyakarta, Bali, Banten, South Sumatera, Riau Islands, Aceh, South Sulawesi, and West Sulawesi), it implies the difference of cultures and ethnicities with different dietary patterns. Thus, Figure 7 provides insight into the complexity of dietary diversity, showing that while rice remains a dominant food choice, there is a degree of substitution based on various influencing factors.
Figure 8 shows the food diversity of Indonesians in Hungary, comparing diverse carbohydrates and non-carbohydrates (blue) with diverse carbohydrates alone (orange). “Often” is the most common frequency (32% vs 25.6%), while “never” is the least (5.6% vs 8%).
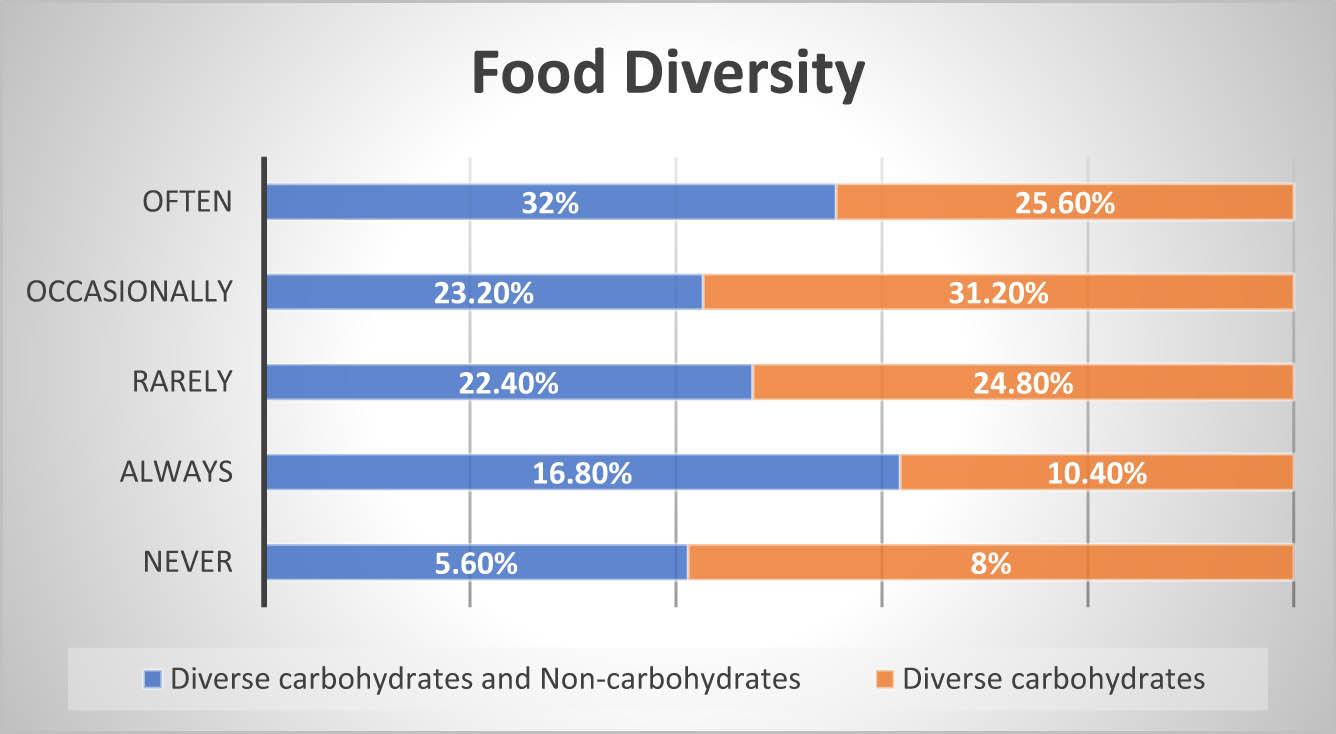
Food diversity of Indonesians living in Hungary.
Figure 9 illustrates the income levels of Indonesians living in Hungary, providing insights into how income influences their food consumption patterns. As highlighted, individuals with higher incomes tend to rely more heavily on staple carbohydrate sources such as rice, as they can afford its higher cost compared to local carbohydrate substitutes. Conversely, lower-income allows one to incorporate more diverse food choices with both carbohydrate and non-carbohydrate sources from foodstuffs available in the host country as they are considered cheaper. This is particularly relevant for international students, who have limited food budgets, forcing them to reduce portions or buy and diversify cheaper substitute foods [45]. Consumers adapt their food consumption patterns in response to changes in food prices across different income levels in various countries [68].
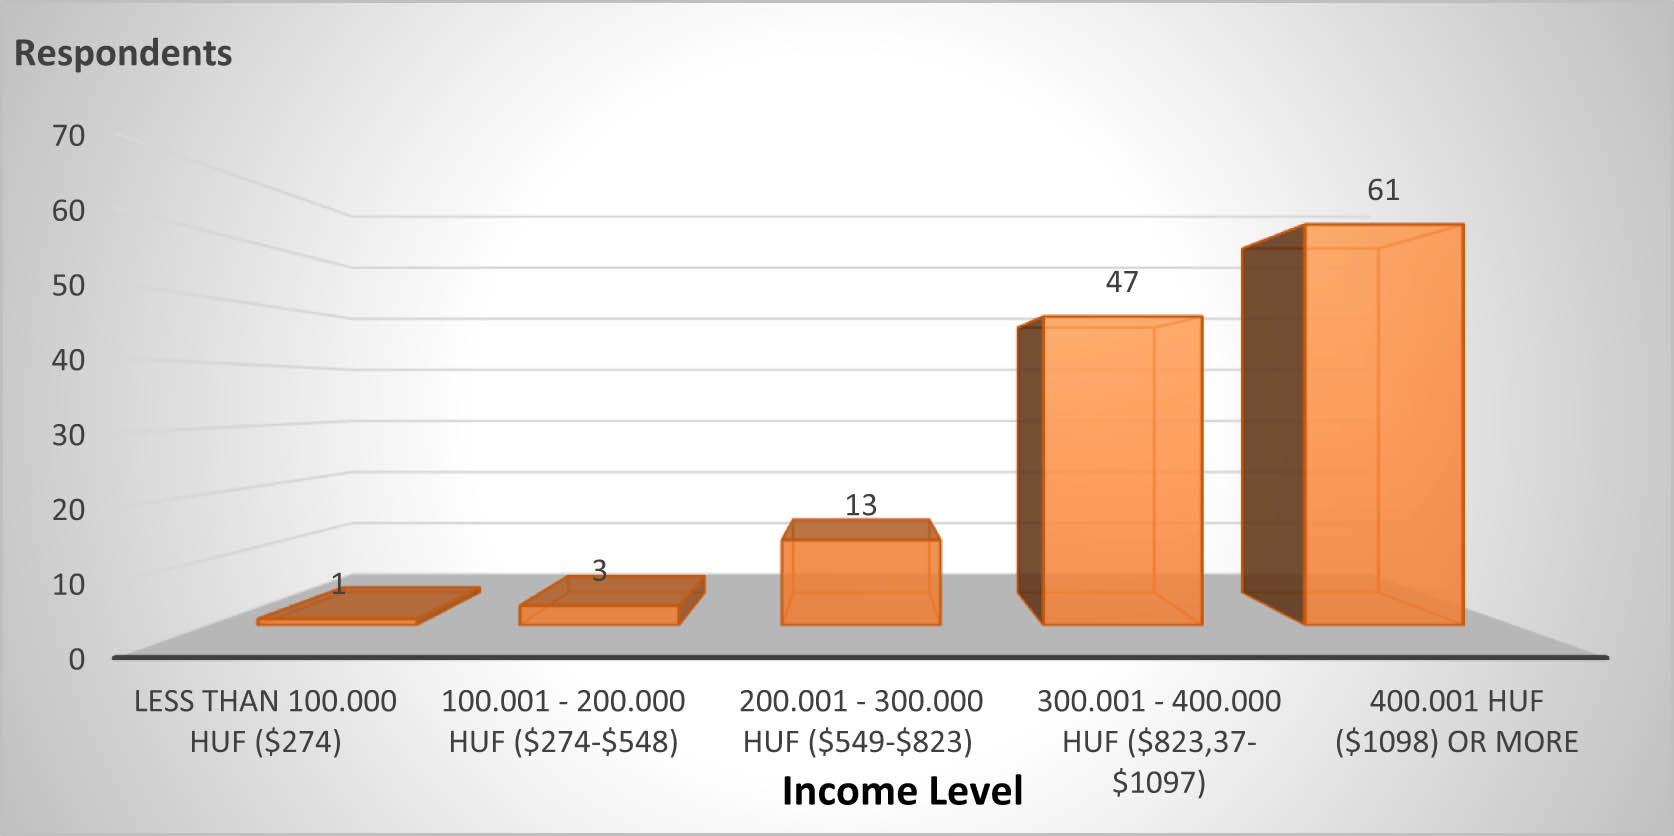
Income level of Indonesians living in Hungary.
3.3 Scientific contributions
The study contributes to the existing body of knowledge on food culture by reinforcing previous research on immigrant food habits, especially among immigrants from tropical Southeast Asian countries. It provides scientific insight into how these immigrants maintain their dietary practices, particularly the consumption of rice, even in four-season countries. This emphasizes the persistence of food culture and habits despite geographical and environmental changes, highlighting the significance of cultural ties to staple foods like rice. Similarly, the habit of immigrants from tropical countries, especially from Southeast Asia, that they continue to consume rice even though they are in a country with four seasons was also found in the studies [5,8–10,22,43,44].
This study makes a scientific contribution to the existing literature on the adaptation and adoption of food practices by immigrants in destination countries. The research demonstrates how immigrants modify their food consumption patterns to align with local availability and customs while concurrently maintaining staple foods that continue to hold cultural significance. The findings of this study underscore the significant role of adaptation in facilitating dietary diversification and food security for immigrant communities in foreign contexts. In line with previous studies [7–10,44,45,48] on food culture, food substitution, and dietary diversity, immigrants from tropical Southeast Asian countries tend to maintain their food habits from their home countries. Finally, it examines the sociocultural significance of rice and how cultural and environmental factors shape food choices in host countries such as Hungary.
By highlighting food diversification, the study underscores its potential to enhance food security, support the SDG Zero Hunger goal, and reduce reliance on a single staple food such as rice by encouraging the consumption of alternative carbohydrate sources. Practical recommendations include raising awareness of diverse food choices, facilitating the adoption of alternative staples, and implementing policies that improve access to nutritious and affordable food. These efforts can help immigrants adapt their diets while contributing to global food sustainability. Furthermore, understanding food culture among immigrants from tropical countries provides insights into how they maintain dietary habits despite climate differences, highlighting adaptation, dietary diversification, and the sociocultural significance of rice in shaping food choices. This study provides a new perspective by highlighting the role of dietary diversification in enhancing food security and promoting dietary adaptation among migrants. Unlike previous research, which has focused primarily on how migrants continue to consume staple foods such as rice without integrating locally available alternatives [7,8], this study emphasizes the potential for dietary diversification. For example, previous research on Indonesian students in Taiwan found that they consistently consumed rice more than once a day, demonstrating their strong attachment to familiar dietary practices despite being in a different food environment [5]. In contrast, this study sheds light on strategies that can encourage migrants to incorporate diverse food sources, thereby promoting both nutritional adequacy and food sustainability in host countries.
4 Conclusion
This research highlights the need to understand the factors shaping food consumption patterns among Indonesian immigrants in Hungary, focusing on rice consumption and dietary diversity. The structural model reveals that convenience, cultural attachment, and substituting local carbohydrates (like pasta and bread) are key influences. A one-point increase in convenience will increase rice consumption among Indonesian immigrants in the host country by 21.3%, while a one-point increase in cultural persistence will increase rice consumption among Indonesian immigrants in the host country by 33.8%. Conversely, a one-point increase in substitution decreases rice consumption among Indonesian immigrants by 35.9% while increasing food diversity by 43%. Socio-economic factors, such as income, also play a role, with higher income slightly weakening the impact of substitution on diversity. The model explains 35.1% of the variation in rice consumption and 29.7% in food diversity, indicating that additional factors need exploration.
These findings align with the Sustainable Development Goal of Zero Hunger by emphasizing the importance of access to culturally appropriate foods and promoting dietary diversity. This is particularly relevant in addressing global food insecurity, especially amid rising food inflation. While cultural food traditions remain significant, adapting to locally available foods can enhance food security for migrant communities. In the case of Hungary, ensuring food accessibility through policy interventions can further support these goals, especially for immigrant communities. Reducing food prices would make food more affordable for everyone, including immigrants (mainly workers) who contribute to economic growth. Increasing the amount of the scholarship’s monthly allowance can improve food access and diversity among international students. This variation suggests that some migrants face higher food costs, which may affect their ability to afford staple foods. As migrant workers are recruited to fill labor shortages in Hungary, the government could help companies provide accessible food options at the workplace. In addition, policies such as employer-sponsored meal programs, government subsidies for staple foods, or food security subsidies could help improve food access and promote dietary diversity. These initiatives would ensure that food remains both accessible and culturally appropriate for diverse communities. As this study found in 2024, the price of rice varies considerably, as follows: HUF 500/kg (49.6%), HUF 700 HUF/kg (26.4%), HUF 900/kg (11.2%), HUF 1,100/kg (11.2%), and less than HUF 500/kg (1.6%).
The study has some limitations, including a relatively small sample size, a specific geographical focus, and reliance on self-reported data. The small sample size may affect the generalizability of the results because most respondents were concentrated in big cities. As a result, the results may not accurately represent populations in rural or less urbanized areas. In addition, the reliance on self-reported data introduces potential biases, such as recall bias or social desirability bias, which could affect the accuracy of responses. Future research could address these limitations by including a more diverse sample from different regions and using objective measures to validate self-reported data.
The constraints of this study highlight the need for broader research across diverse regions and populations. Future studies should explore the socio-cultural and economic factors that influence rice consumption and dietary diversification in different migrant communities. Expanding this research could provide deeper insights into food consumption patterns and contribute to more effective policy recommendations aimed at improving food security globally. A comparative analysis of food security and cultural differences between countries is essential for a more comprehensive understanding of food culture and diversity. In addition, studying food security and dietary diversity among immigrants in different cities could provide valuable insights. Future research should include both qualitative and quantitative approaches, using mixed methods research to investigate food culture and diversity among migrant communities. For quantitative studies, it is recommended that future research include a larger and more representative sample size. In addition, the use of more comprehensive research methods, such as in-depth interviews or longitudinal studies, could help to capture long-term trends and deeper socio-cultural influences on migrant food consumption. To fully understand food diversity, further research is needed to determine whether substitution is primarily driven by availability, economic factors, or efforts to achieve a balanced diet that meets nutritional requirements for carbohydrates, proteins, fats, vitamins, and minerals.
Acknowledgments
The authors thank the support of the Hungarian University of Agriculture and Life Sciences (MATE) – Gödöllő, Hungary, and Stipendium Hungaricum (Tempus Public Foundation). The authors also thank all the Indonesians in Hungary for their help in collecting and filling in the questionnaire.
-
Funding information: This research was funded by the Hungarian University of Agriculture and Life Sciences (MATE) – Gödöllő, Hungary and Stipendium Hungaricum (Tempus Public Foundation).
-
Author contributions: All authors have accepted responsibility for the entire content of this manuscript and consented to its submission to the journal, reviewed all the results and approved the final version of the manuscript. Conceptualization, T.J. and L.O.N.; methodology, T.J. and L.O.N.; software, T.J. and L.O.N.; validation, K.Sz.; formal analysis, T.J. and L.O.N.; investigation, T.J.; data preparation, T.J. and L.O.N.; writing – original draft preparation, T.J.; writing – review and editing, T.J., L.O.N., A.F.R., and K.Sz.; visualization, T.J. and L.O.N.; supervision, K.Sz.; project administration, K.Sz.; funding acquisition, K.Sz.
-
Conflict of interest: Authors state no conflict of interest.
-
Ethical approval: The conducted research is not related to either human or animal use.
-
Data availability statement: The datasets generated and/or analyzed during the current study are available from the corresponding author upon reasonable request.
References
[1] OECD, FAO. OECD-FAO Agricultural Outlook 2021-2030. OECD, Food and Agriculture Organization of the United Nations; 2021 Jul [cited 2024 May 2]. https://www.oecd-ilibrary.org/agriculture-and-food/oecd-fao-agricultural-outlook-2021-2030_19428846-en.Suche in Google Scholar
[2] Wijayati PD, Harianto N, Suryana A. Permintaan Pangan Sumber Karbohidrat di Indonesia. Anal Kebijak Pertan. 2019 Jun;17(1):13.10.21082/akp.v17n1.2019.13-26Suche in Google Scholar
[3] MoA. Statistik Konsumsi Pangan Statistics of Food Consumption, Jakarta: Sekretariat Jenderal - Kementerian Pertanian Secretariate General - Ministry of Agriculture; 2023, 2023.Suche in Google Scholar
[4] ISA. Badan Pusat Statistik/Indonesian Statistics Agency. 2024. Imports of Rice by Major Countries of Origin, 2017-2023. https://www.bps.go.id/id/statistics-table/1/MTA0MyMx/impor-beras-menurut-negara-asal-utama--2017-2023.html.Suche in Google Scholar
[5] Adelina R, Nurwanti E, Paramastri R, Cerdasari C, Chao JCJ. Evaluating the food consumption among Indonesian young adults lived in a different environment. J Gizi Indones Indones J Nutr. 2021 Dec;10(1):36–44.10.14710/jgi.10.1.36-44Suche in Google Scholar
[6] Lipoeto NI, Agus Z, Oenzil F, Masrul M, Wattanapenpaiboon N, Wahlqvist ML. Contemporary Minangkabau food culture in West Sumatra, Indonesia. Asia Pac J Clin Nutr. 2001 Feb;10(1):10–6.10.1046/j.1440-6047.2001.00201.xSuche in Google Scholar PubMed
[7] Rosales MV, Machado VP. Portuguese migrants in Rio de Janeiro: Exploring identity ambivalences through food practices. Anal Soc. 2020;55(237):868–84.Suche in Google Scholar
[8] Patzer H. Unpacking the balikbayan box. Long-distance care through feeding and food consumption in the philippines. Stud Socjol. 2018;4(231):131–48.Suche in Google Scholar
[9] Lee EJ, Lee KR, Lee SJ. Study on the change and acculturation of dietary pattern of Southeast Asian workers living in South Korea. Appetite 2017;117:203–13.10.1016/j.appet.2017.06.022Suche in Google Scholar PubMed
[10] Steinman J. Food practices, transnational identity and belonging of Vietnamese migrants in Moscow: Nostalgic consumption. Routledge Handbook of the Vietnamese Diaspora. Taylor and Francis; 2024. https://www.scopus.com/inward/record.uri?eid=2-s2.0-85191251427&doi=10.4324%2f9781003036104-13&partnerID=40&md5=cd143316c51a5683afaef73c5f8f57c3. Suche in Google Scholar
[11] Nababan HF, Romana F. Stipendium Hungaricum” Scholarship, Bridge of Indonesia-Hungary Relations. Kompas. 2023 Oct [cited 2024 Jun 28]; https://www.kompas.id/baca/internasional/2023/10/16/beasiswa-stipendium-hungaricum-jembatan-relasi-indonesia-hongaria.Suche in Google Scholar
[12] Tordai K. Why is the Asian workforce steadily increasing in the Hungarian labour market? Daily News Hungary. 2022 Jun 28; https://dailynewshungary.com/why-is-the-asian-workforce-steadily-increasing-in-the-hungarian-labour-market/.Suche in Google Scholar
[13] Robiatul E. PPLN Budapest Sebut Jumlah DPT di Hongaria Naik Hampir 4 Kali Lipat. JPNN. 2023 Jun; https://www.jpnn.com/news/ppln-budapest-sebut-jumlah-dpt-di-hongaria-naik-hampir-4-kali-lipat. Suche in Google Scholar
[14] Bazgă B. Food security component of sustainable development – prospects and challenges in the next decade. Procedia Econ Finance. 2015;32:1075–82.10.1016/S2212-5671(15)01570-1Suche in Google Scholar
[15] HLPE. Food security and nutrition: building a global narrative towards 2030. Rome: the High Level Panel of Experts (HLPE) on Food Security and Nutrition of the Committee on World Food Security (FAO); 2020. (Food Security and Nutrition). Report No.: 15. https://openknowledge.fao.org/server/api/core/bitstreams/8357b6eb-8010-4254-814a-1493faaf4a93/content.Suche in Google Scholar
[16] Hair JF, Hult GTM, Ringle CM, Sarstedt M, Danks NP, Ray S. Partial least squares structural equation modeling (PLS-SEM) using R: A workbook. Cham: Springer International Publishing; 2021 [cited 2024 Jul 1]. 10.1007/978-3-030-80519-7.Suche in Google Scholar
[17] Bulambo K, Azadi H, Polepole S, Nabintu M, Bembeleza E, Dontsop P, et al. Consumer preference for rice grain quality in the South Kivu and Tanganyika Provinces, Eastern DR Congo. Foods. 2023;12(21):3–6. 10.3390/foods12213995.Suche in Google Scholar PubMed PubMed Central
[18] Fanzo J, Davis C. Global Food Systems, Diets, and Nutrition: Linking Science, Economics, and Policy. Cham: Springer International Publishing; 2021 [cited 2024 May 2]. (Palgrave Studies in Agricultural Economics and Food Policy). 10.1007/978-3-030-72763-5.Suche in Google Scholar
[19] Jiménez PV. El gallo pinto, Afro-Caribbean rice and beans conquer the Costa Rican national cuisine. Food Cult Soc. 2012;15(2):223–40.10.2752/175174412X13233545145228Suche in Google Scholar
[20] Kushitor SB, Alangea DO, Aryeetey R, de-Graft Aikins A. Dietary patterns among adults in three low-income urban communities in Accra, Ghana. Okpala COR, PLOS ONE. 2023 Nov;18(11):e0293726.10.1371/journal.pone.0293726Suche in Google Scholar PubMed PubMed Central
[21] Varela-Moreiras G, Ávila JM, Cuadrado C, Del Pozo S, Ruiz E, Moreiras O. Evaluation of food consumption and dietary patterns in Spain by the Food Consumption Survey: updated information. Eur J Clin Nutr. 2010 Nov;64(S3):S37–43.10.1038/ejcn.2010.208Suche in Google Scholar PubMed
[22] Long Y, Zhang M, Mujumdar AS, Lin J. Effects of static magnetic fields freezing on starch-based prepared fried rice as staple foods. Int J Refrig. 2024 Sep;165:164–74.10.1016/j.ijrefrig.2024.05.022Suche in Google Scholar
[23] Abramsky L, Dolk H. Should Europe fortify a staple food with folic acid? Lancet. 2007 Feb;369(9562):641–2.10.1016/S0140-6736(07)60309-2Suche in Google Scholar PubMed
[24] Huang G, McClements DJ, He K, Zhang Z, Lin Z, Xu Z, et al. Review of formation mechanisms and quality regulation of chewiness in staple foods: Rice, noodles, potatoes and bread. Food Res Int. 2024 Jul;187:114459.10.1016/j.foodres.2024.114459Suche in Google Scholar PubMed
[25] Wen P, Zhu N, Jia M. Changes in food consumption and nutrition intake of rural residents in central China. Heliyon 2024 Aug;10(16):e36523.10.1016/j.heliyon.2024.e36523Suche in Google Scholar PubMed PubMed Central
[26] Nemeth N, Rudnak I, Ymeri P, Fogarassy C. The role of cultural factors in sustainable food consumption-An investigation of the consumption habits among international students in Hungary. Sustainability. 2019;11(11). https://www.scopus.com/inward/record.uri?eid=2-s2.0-85067229543&doi=10.3390%2fsu11113052&partnerID=40&md5=7e63dc0bb0926c89806543f8ad957fa5. Suche in Google Scholar
[27] Kim S, Haines PS, Siega-Riz AM, Popkin BM. The diet quality index-international (DQI-I) provides an effective tool for cross-national comparison of diet quality as illustrated by China and the United States. J Nutr. 2003 Nov;133(11):3476–84.10.1093/jn/133.11.3476Suche in Google Scholar PubMed
[28] Benvenuti L, Sette S, De Santis A, Riso P, Petroni K, Crosatti C, et al. Simulation of daily iron intake by actual diet considering future trends in wheat and rice biofortification, environmental, and dietary factors: an italian case study. Nutrients. 2024;16(23). https://www.scopus.com/inward/record.uri?eid=2-s2.0-85211912116&doi=10.3390%2fnu16234097&partnerID=40&md5=2ffb3886fc2b285655deb2f1ab64a885. Suche in Google Scholar
[29] Tesafa F, Mulugeta M, Tsehay S. Women empowerment, efficiency and food security nexus in rural Ethiopia: A generalized structural equation modeling. Heliyon. 2025;11(1):3–14. 10.1016/j.heliyon.2024.e41273.Suche in Google Scholar PubMed PubMed Central
[30] Cabral D, Moura AP, Fonseca SC, Oliveira JC, Cunha LM. Exploring rice consumption habits and determinants of choice, aiming for the development and promotion of rice products with a low glycaemic index. Foods. 2024;13(2):15. 10.3390/foods13020301.Suche in Google Scholar PubMed PubMed Central
[31] Lintang M, Layuk P, Sudarti S. J. Identification local food and levels of community preference at the border region of Sangihe Islands District. in Juwaidah SP, Tjale MM and Rozaki Z, (editor), E3S Web Conf. 2021;232:02019.10.1051/e3sconf/202123202019Suche in Google Scholar
[32] Purnomo D, Susilowati I, Sugiyanto F. Mapping food availability and food scarcity in migrants’ hometown. Econ J Emerg Mark. 2014 Oct;6:96–105.10.20885/ejem.vol6.iss2.art3Suche in Google Scholar
[33] Pawlak K, Malak-Rawlikowska A, Hamulczuk M, Skrzypczyk M. Has food security in the EU countries worsened during the COVID-19 pandemic? Analysis of physical and economic access to food. PLoS ONE. 2024;19(4):1. 10.1371/journal.pone.0302072.Suche in Google Scholar PubMed PubMed Central
[34] Venkatesh KK, Walker DM, Yee LM, Wu J, Garner J, McNeil B, et al. Association of living in a food desert and poor periconceptional diet quality in a cohort of nulliparous pregnant individuals. J Nutr. 2023;153(8):2432–41.10.1016/j.tjnut.2023.06.032Suche in Google Scholar PubMed PubMed Central
[35] Jaeger SR, Cardello AV. A construct analysis of meal convenience applied to military foods. Appetite 2007 Jul 1;49(1):231–9.10.1016/j.appet.2007.02.001Suche in Google Scholar PubMed
[36] Aggarwal A, Rehm CD, Monsivais P, Drewnowski A. Importance of taste, nutrition, cost and convenience in relation to diet quality: Evidence of nutrition resilience among US adults using National Health and Nutrition Examination Survey (NHANES) 2007–2010. Prev Med. 2016 Sep;90:184–92.10.1016/j.ypmed.2016.06.030Suche in Google Scholar PubMed PubMed Central
[37] Sobal J, Khan LK, Bisogni C. A conceptual model of the food and nutrition system. Soc Sci Med. 1998;47(7):853–63.10.1016/S0277-9536(98)00104-XSuche in Google Scholar PubMed
[38] Turner C, Aggarwal A, Walls H, Herforth A, Drewnowski A, Coates J, et al. Concepts and critical perspectives for food environment research: A global framework with implications for action in low- and middle-income countries. Glob Food Secur. 2018 Sep;18:93–101.Suche in Google Scholar
[39] Turner C, Aggarwal A, Walls H, Herforth A, Drewnowski A, Coates J, et al. Concepts and critical perspectives for food environment research: A global framework with implications for action in low- and middle-income countries. Glob Food Secur. 2018 Sep;18:93–101.10.1016/j.gfs.2018.08.003Suche in Google Scholar
[40] Steptoe A, Pollard TM, Wardle J. Development of a measure of the motives underlying the selection of food: the food choice questionnaire. Appetite 1995 Dec;25(3):267–84.10.1006/appe.1995.0061Suche in Google Scholar PubMed
[41] Yin J, Yang D, Zhang X, Zhang Y, Cai T, Hao Y, et al. Diet shift: Considering environment, health and food culture. Sci Total Environ. 2020 Jun;719:137484.10.1016/j.scitotenv.2020.137484Suche in Google Scholar PubMed
[42] Williams JD, Crockett D, Harrison RL, Thomas KD. The role of food culture and marketing activity in health disparities. Prev Med. 2012 Nov;55(5):382–6.10.1016/j.ypmed.2011.12.021Suche in Google Scholar PubMed
[43] Bauch C, Torheim LE, Almendingen K, Molin M, Terragni L. Food habits and forms of food insecurity among international university students in oslo: a qualitative study. Int J Environ Res Public Health. 2023;20(3):1. 10.3390/ijerph20032694.Suche in Google Scholar PubMed PubMed Central
[44] Benazizi I, Ferrer-Serret L, Martínez-Martínez JM, Ronda-Pérez E, Casabona iBarbarà J. Factors that influence the diet and eating habits of Chinese immigrant population in Catalonia (Spain). Gac Sanit. 2021;35(1):12–20.10.1016/j.gaceta.2019.08.014Suche in Google Scholar PubMed
[45] Shi Y, Hayba N, Allman-Farinelli M. International tertiary education students experienced difficulties in dietary transitions in Australia: A qualitative study. Health Promot J Aust. 2024;35(1):165–75.10.1002/hpja.728Suche in Google Scholar PubMed
[46] Berry EM, Dernini S, Burlingame B, Meybeck A, Conforti P. Food security and sustainability: Can one exist without the other? Public Health Nutr. 2015;18(13):2293–302.10.1017/S136898001500021XSuche in Google Scholar PubMed PubMed Central
[47] Antriyandarti E, Melati NSK, Maulana RA. Understanding factors affecting rice purchasing decisions in Indonesia: Does rice brand matter? Open Agric. 2024;9(1):1. 10.1515/opag-2022-0303.Suche in Google Scholar
[48] Berggreen-Clausen A, Hseing Pha S, Mölsted Alvesson H, Andersson A, Daivadanam M. Food environment interactions after migration: a scoping review on low- and middle-income country immigrants in high-income countries. Public Health Nutr. 2022 Jan;25(1):136–58.10.1017/S1368980021003943Suche in Google Scholar PubMed PubMed Central
[49] Leroy JL, Ruel M, Frongillo EA, Harris J, Ballard TJ. Measuring the food access dimension of food security: a critical review and mapping of indicators. Food Nutr Bull. 2015 Jun;36(2):167–95.10.1177/0379572115587274Suche in Google Scholar PubMed
[50] Johnson RB, Onwuegbuzie AJ. Mixed methods research: a research paradigm whose time has come. Educ Res. 2004 Oct;33(7):14–26.10.3102/0013189X033007014Suche in Google Scholar
[51] Leech NL, Onwuegbuzie AJ. A typology of mixed methods research designs. Qual Quant. 2009 Mar;43(2):265–75.10.1007/s11135-007-9105-3Suche in Google Scholar
[52] Babbie ER. Pract Soc Res. 13th edn. Belmont, Calif: Wadsworth Cengage Learning; 2013. p. 584.Suche in Google Scholar
[53] Kumar K, Rama Krishna V, Govindaraj M, Pawar V, Sathyakala S, Viswanathan R. Characteristics determining customer’s preferences for OTT video streaming: A multivariate analysis. Entertain Comput. 2025 Jan;52:100746.10.1016/j.entcom.2024.100746Suche in Google Scholar
[54] Khandelwal M. Survey Sensum. 2024 [cited 2024 Oct 8]. Everything You Need to Know About the Likert Scale in 2024. https://www.surveysensum.com/blog/everything-you-need-to-know-about-the-likert-scale#:∼:text=A%205%2Dpoint%20Likert%20scale%20is%20a%20psychometric%20response%20method,%3B%20(5)%20Strongly%20Agree. Suche in Google Scholar
[55] Kyriazos TA. Applied psychometrics: sample size and sample power considerations in factor analysis (efa, cfa) and sem in general. Psychology. 2018;09(08):2207–30.10.4236/psych.2018.98126Suche in Google Scholar
[56] Hox J, McNeish D. Small samples in multilevel modeling. in Small Sample Size Solutions 1st edn London: Routledge; 2020 [cited 2025 Feb 12]. p. 215–25. 10.4324/9780429273872-18.Suche in Google Scholar
[57] Aisyah N. Usia Produktif Diukur dari Rentang Usia Berapa? Ini Penjelasannya. detikcom. 2021 Aug 20 [cited 2025 Mar 22]; https://www.detik.com/edu/detikpedia/d-5689769/usia-produktif-diukur-dari-rentang-usia-berapa-ini-penjelasannya.Suche in Google Scholar
[58] Indraini A. Catat! Usia Pensiun Pekerja di Indonesia Jadi 59 Tahun. detikcom. 2025 Jan 7 [cited 2025 Mar 22]; https://www.detik.com/sumbagsel/berita/d-7721669/catat-usia-pensiun-pekerja-di-indonesia-jadi-59-tahun.Suche in Google Scholar
[59] GoI. Peraturan Pemerintah (PP) Nomor 45 Tahun 2015 tentang Penyelenggaraan Program Jaminan Pensiun. Government of Indonesia; 2015 [cited 2025 Mar 22]. https://peraturan.bpk.go.id/Details/5613/pp-no-45-tahun-2015.Suche in Google Scholar
[60] Dijkstra T, Henseler J. Consistent partial least squares path modeling. MIS Q. 2015;39(2):2. 10.25300/MISQ/2015/39.2.02.Suche in Google Scholar
[61] Hair JF, Risher JJ, Sarstedt M, Ringle CM. When to use and how to report the results of PLS-SEM. Eur Bus Rev. 2019 Jan;31(1):2–24.10.1108/EBR-11-2018-0203Suche in Google Scholar
[62] Hair JF, Black WC, Babin BJ, Anderson RE, Multivariate data analysis. 18th edn. Andover, Hampshire: Cengage; 2019. p. 813.Suche in Google Scholar
[63] Kamid K, Ramalisa Y, Fajriah N, Kurniawan DA, Perdana R, Rivani PA, et al. Collaborative character, cognitive psychology, and process skills: the impact of character-based mathematics learning in high grades of elementary schools. J Educ Res Eval. 2023;7(4):596–607.10.23887/jere.v7i4.55095Suche in Google Scholar
[64] Hannes F, Moon K, Pfanner RM. Optimizing health and nutrition status of migrant construction workers consuming multiple micronutrient fortified rice in Singapore. PLoS ONE. 2023;18(6):e0285708. 10.1371/journal.pone.0285708.Suche in Google Scholar PubMed PubMed Central
[65] FAO. Food and Agriculture Organization of the United Nations. 2022 [cited 2025 Mar 23]. Food Balance (2010-). https://www.fao.org/faostat/en/#data/FBS.Suche in Google Scholar
[66] Tian J, Chen J, Ye X, Chen S. Health benefits of the potato affected by domestic cooking: A review. Food Chem. 2016 Jul;202:165–75.10.1016/j.foodchem.2016.01.120Suche in Google Scholar PubMed
[67] Sissons B. 12 most nutritious fruits. MedicalNewsToday. 2023 Dec 20 [cited 2025 Mar 24]; https://www.medicalnewstoday.com/articles/324431.Suche in Google Scholar
[68] Cornelsen L, Green R, Turner RJ, Dangour AD, Shankar B, Mazzocchi M, et al. What happens to patterns of food consumption when food prices change? evidence from a systematic review and meta-analysis of food price elasticities globally. Health Econ. 2015;24(12):1548–59.10.1002/hec.3107Suche in Google Scholar PubMed
© 2025 the author(s), published by De Gruyter
This work is licensed under the Creative Commons Attribution 4.0 International License.
Artikel in diesem Heft
- Research Articles
- Optimization of sustainable corn–cattle integration in Gorontalo Province using goal programming
- Competitiveness of Indonesia’s nutmeg in global market
- Toward sustainable bioproducts from lignocellulosic biomass: Influence of chemical pretreatments on liquefied walnut shells
- Efficacy of Betaproteobacteria-based insecticides for managing whitefly, Bemisia tabaci (Hemiptera: Aleyrodidae), on cucumber plants
- Assessment of nutrition status of pineapple plants during ratoon season using diagnosis and recommendation integrated system
- Nutritional value and consumer assessment of 12 avocado crosses between cvs. Hass × Pionero
- The lacked access to beef in the low-income region: An evidence from the eastern part of Indonesia
- Comparison of milk consumption habits across two European countries: Pilot study in Portugal and France
- Antioxidant responses of black glutinous rice to drought and salinity stresses at different growth stages
- Differential efficacy of salicylic acid-induced resistance against bacterial blight caused by Xanthomonas oryzae pv. oryzae in rice genotypes
- Yield and vegetation index of different maize varieties and nitrogen doses under normal irrigation
- Urbanization and forecast possibilities of land use changes by 2050: New evidence in Ho Chi Minh city, Vietnam
- Organizational-economic efficiency of raspberry farming – case study of Kosovo
- Application of nitrogen-fixing purple non-sulfur bacteria in improving nitrogen uptake, growth, and yield of rice grown on extremely saline soil under greenhouse conditions
- Digital motivation, knowledge, and skills: Pathways to adaptive millennial farmers
- Investigation of biological characteristics of fruit development and physiological disorders of Musang King durian (Durio zibethinus Murr.)
- Enhancing rice yield and farmer welfare: Overcoming barriers to IPB 3S rice adoption in Indonesia
- Simulation model to realize soybean self-sufficiency and food security in Indonesia: A system dynamic approach
- Gender, empowerment, and rural sustainable development: A case study of crab business integration
- Metagenomic and metabolomic analyses of bacterial communities in short mackerel (Rastrelliger brachysoma) under storage conditions and inoculation of the histamine-producing bacterium
- Fostering women’s engagement in good agricultural practices within oil palm smallholdings: Evaluating the role of partnerships
- Increasing nitrogen use efficiency by reducing ammonia and nitrate losses from tomato production in Kabul, Afghanistan
- Physiological activities and yield of yacon potato are affected by soil water availability
- Vulnerability context due to COVID-19 and El Nino: Case study of poultry farming in South Sulawesi, Indonesia
- Wheat freshness recognition leveraging Gramian angular field and attention-augmented resnet
- Suggestions for promoting SOC storage within the carbon farming framework: Analyzing the INFOSOLO database
- Optimization of hot foam applications for thermal weed control in perennial crops and open-field vegetables
- Toxicity evaluation of metsulfuron-methyl, nicosulfuron, and methoxyfenozide as pesticides in Indonesia
- Fermentation parameters and nutritional value of silages from fodder mallow (Malva verticillata L.), white sweet clover (Melilotus albus Medik.), and their mixtures
- Five models and ten predictors for energy costs on farms in the European Union
- Effect of silvopastoral systems with integrated forest species from the Peruvian tropics on the soil chemical properties
- Transforming food systems in Semarang City, Indonesia: A short food supply chain model
- Understanding farmers’ behavior toward risk management practices and financial access: Evidence from chili farms in West Java, Indonesia
- Optimization of mixed botanical insecticides from Azadirachta indica and Calophyllum soulattri against Spodoptera frugiperda using response surface methodology
- Mapping socio-economic vulnerability and conflict in oil palm cultivation: A case study from West Papua, Indonesia
- Exploring rice consumption patterns and carbohydrate source diversification among the Indonesian community in Hungary
- Determinants of rice consumer lexicographic preferences in South Sulawesi Province, Indonesia
- Effect on growth and meat quality of weaned piglets and finishing pigs when hops (Humulus lupulus) are added to their rations
- Healthy motivations for food consumption in 16 countries
- The agriculture specialization through the lens of PESTLE analysis
- Combined application of chitosan-boron and chitosan-silicon nano-fertilizers with soybean protein hydrolysate to enhance rice growth and yield
- Stability and adaptability analyses to identify suitable high-yielding maize hybrids using PBSTAT-GE
- Phosphate-solubilizing bacteria-mediated rock phosphate utilization with poultry manure enhances soil nutrient dynamics and maize growth in semi-arid soil
- Factors impacting on purchasing decision of organic food in developing countries: A systematic review
- Influence of flowering plants in maize crop on the interaction network of Tetragonula laeviceps colonies
- Bacillus subtilis 34 and water-retaining polymer reduce Meloidogyne javanica damage in tomato plants under water stress
- Vachellia tortilis leaf meal improves antioxidant activity and colour stability of broiler meat
- Evaluating the competitiveness of leading coffee-producing nations: A comparative advantage analysis across coffee product categories
- Application of Lactiplantibacillus plantarum LP5 in vacuum-packaged cooked ham as a bioprotective culture
- Evaluation of tomato hybrid lines adapted to lowland
- South African commercial livestock farmers’ adaptation and coping strategies for agricultural drought
- Spatial analysis of desertification-sensitive areas in arid conditions based on modified MEDALUS approach and geospatial techniques
- Meta-analysis of the effect garlic (Allium sativum) on productive performance, egg quality, and lipid profiles in laying quails
- Optimizing carrageenan–citric acid synergy in mango gummies using response surface methodology
- The strategic role of agricultural vocational training in sustainable local food systems
- Agricultural planning grounded in regional rainfall patterns in the Colombian Orinoquia: An essential step for advancing climate-adapted and sustainable agriculture
- Perspectives of master’s graduates on organic agriculture: A Portuguese case study
- Developing a behavioral model to predict eco-friendly packaging use among millennials
- Government support during COVID-19 for vulnerable households in Central Vietnam
- Citric acid–modified coconut shell biochar mitigates saline–alkaline stress in Solanum lycopersicum L. by modulating enzyme activity in the plant and soil
- Herbal extracts: For green control of citrus Huanglongbing
- Research on the impact of insurance policies on the welfare effects of pork producers and consumers: Evidence from China
- Investigating the susceptibility and resistance barley (Hordeum vulgare L.) cultivars against the Russian wheat aphid (Diuraphis noxia)
- Characterization of promising enterobacterial strains for silver nanoparticle synthesis and enhancement of product yields under optimal conditions
- Testing thawed rumen fluid to assess in vitro degradability and its link to phytochemical and fibre contents in selected herbs and spices
- Protein and iron enrichment on functional chicken sausage using plant-based natural resources
- Fruit and vegetable intake among Nigerian University students: patterns, preferences, and influencing factors
- Bioprospecting a plant growth-promoting and biocontrol bacterium isolated from wheat (Triticum turgidum subsp. durum) in the Yaqui Valley, Mexico: Paenibacillus sp. strain TSM33
- Quantifying urban expansion and agricultural land conversion using spatial indices: evidence from the Red River Delta, Vietnam
- Review Articles
- Reference dietary patterns in Portugal: Mediterranean diet vs Atlantic diet
- Evaluating the nutritional, therapeutic, and economic potential of Tetragonia decumbens Mill.: A promising wild leafy vegetable for bio-saline agriculture in South Africa
- A review on apple cultivation in Morocco: Current situation and future prospects
- Quercus acorns as a component of human dietary patterns
- CRISPR/Cas-based detection systems – emerging tools for plant pathology
- Short Communications
- An analysis of consumer behavior regarding green product purchases in Semarang, Indonesia: The use of SEM-PLS and the AIDA model
- Effect of NaOH concentration on production of Na-CMC derived from pineapple waste collected from local society