Increasing nitrogen use efficiency by reducing ammonia and nitrate losses from tomato production in Kabul, Afghanistan
-
Zikrullah Safi
 ,
Robert Rees
,
Robert Rees

Abstract
Over the past century, the inefficient use of reactive nitrogen (Nr) has raised concerns regarding global food production and planetary sustainability. This study investigates nitrogen (N) losses in tomato production near Kabul, Afghanistan, aiming to improve nitrogen use efficiency (NUE) for enhanced food security and environmental protection. Three fertilizer treatments were tested: (A) animal manure + ¼ dose of chemical fertilizer, (B) night soil + ¼ dose of chemical fertilizer, and (C) full dose of chemical fertilizer, with sub-treatments varying in N application (25% less, 25% excess, and farmers’ practice). A no-fertilizer control treatment was included. Nitrogen losses through ammonia emissions and nitrate–N leaching were monitored, while nitrogen balances and NUE were calculated. The findings revealed that ammonia emissions decreased by 33% in treatment A2 and by 30% in treatment B3 compared to surface application. However, nitrate–N leaching peaked at 145 kg N ha−1 in A2 and 128 kg N ha−1 in B3, with positive N balances observed across treatments, the highest being 300 kg N ha−1 in treatment A. NUE ranged from 30% (A and B) to 55% (control), highlighting the widespread overapplication of N in Afghan agriculture. This study demonstrates that efficient N management practices can reduce environmental losses while maintaining tomato yield, offering a novel pathway toward sustainable farming in the region.
1 Introduction
The availability of reactive nitrogen (Nr) is crucial for sustainable agriculture management, as nitrogen (N) is the nutrient most required by crops. Globally, approximately 120 Tg of nitrogen is used as fertilizer each year, making it essential to maintain appropriate N inputs in agricultural systems to ensure food security. However, in regions like Afghanistan, where agriculture remains largely traditional, inefficient use of N presents unique challenges for both productivity and environmental sustainability. In these regions, N is often used inefficiently, leading to significant losses and environmental damage [1]. Excessive N loss from agricultural systems damages soil, air, and water quality, contributes to climate change and ozone depletion, and threatens biodiversity. The environmental impact of nitrogen losses, including the degradation of local ecosystems, highlights the need for integrated nitrogen management strategies that take into account environmental sustainability alongside agricultural productivity.
Tomato (Solanum lycopersicum L.) ranks among the top six vegetable crops in Afghanistan [2]. Mismanagement of N inputs in intensive tomato production can result in substantial nitrogen losses through nitrate (NO3) leaching, as well as emissions of ammonia (NH3) and nitrous oxide (N2O). These losses not only lead to environmental degradation but also incur economic costs, further burdening farmers in Afghanistan who often face limited resources and financial constraints. The economic burden of inefficient N use is particularly pertinent in Afghanistan, where access to optimal N management practice is limited [3]. Ibukun et al. [3] suggest that reducing N application may not significantly impact tomato yields, indicating that more efficient N use could provide economic benefits while mitigating environmental harm.
Traditional agricultural practices in Afghanistan have remained largely unchanged in recent decades, with a focus on maximum production at the expense of improving nitrogen use efficiency (NUE). With a population of 41,549,080 people and an annual growth rate of 2.57%, the pressure to intensify agricultural practices continues to rise [4]. However, farming methods remain predominantly conventional, characterized by poor nutrient and water management [5]. In particular, poorly targeted applications of inorganic N fertilizers in cherry tomato production have led to severe environmental degradation [6]. A study using resin-based extractants revealed significant Nr accumulation, with NO3–N levels reaching 138 kg ha−1 year−1 and NH4–N levels of 1.9 kg ha−1 year−1 from vegetable gardens [7].
Despite ongoing challenges, there is a limited understanding of the magnitude of N losses related to agricultural management practices, such as N source, tillage, and irrigation [8]. A key gap in the literature is the limited integration of socio-economic factors influencing the adoption of nitrogen-efficient practices in regions like Afghanistan. The integration of socio-economic factors, such as the affordability and accessibility of nitrogen-efficient technologies, is essential to understanding how farmers in Afghanistan can be incentivized to adopt better N management strategies. Quantifying N flows can raise awareness among farmers and help them reevaluate their N management strategies, potentially leading to reduced losses [9]. Agriculture is recognized as the primary contributor to losses of NO3, NH4, and NH3, particularly under intensive farming conditions [10,11,12]. Therefore, improving N management is crucial for mitigating these losses.
Afghanistan currently lacks comprehensive data on reactive-N (Nr) flows in its various forms under both conventional and managed farming systems. This information is essential for developing sustainable agricultural practices. This study directly addresses these knowledge gaps by combining agronomic data with socio-economic insights to propose actionable N management strategies. The objectives of the study are:
To quantify the fate of applied N fertilizers in a typical tomato cropping system in Kabul, partitioning N between the crop and soil, and identifying losses from the system;
To quantify the magnitude and timing of N loss across different pathways and assess crop NUE achieved through various mitigation options; and
To develop a partial N budget for the tomato cropping system in Afghanistan to indicate the magnitude of changes achieved through management interventions.
2 Materials and methods
2.1 Study area and site selection
A field experiment was established at Shewaki, a typical peri-urban village located in the south-east of Kabul city (N: 34°28′45.96; E: 69°12′54.94), at an elevation of 1,767–1,786 m above sea level (m a.s.l.) in the Bagrami District, Kabul Province of Afghanistan (Figure 1). The province receives an average annual precipitation of 300–330 mm, primarily occurring from November to May, which reflects typical seasonal rainfall variations in the area. The average annual temperature ranges from 10 to 13°C, with a relative humidity of 54% (1957–1977) [13,14]. Summer temperatures (May to August) can exceed 40°C. From April 2008 to March 2010, the average annual rainfall ranged from 176 to 346 mm, with a relative humidity of 45.3% and an average temperature of 14.8°C reported by Safi et al. [7]. From January 2020 to May 2021, precipitation was notably lower at 29 mm, with an average temperature of 14.15°C, indicating substantially drier and hotter conditions than normal (MAIL, unpublished data).
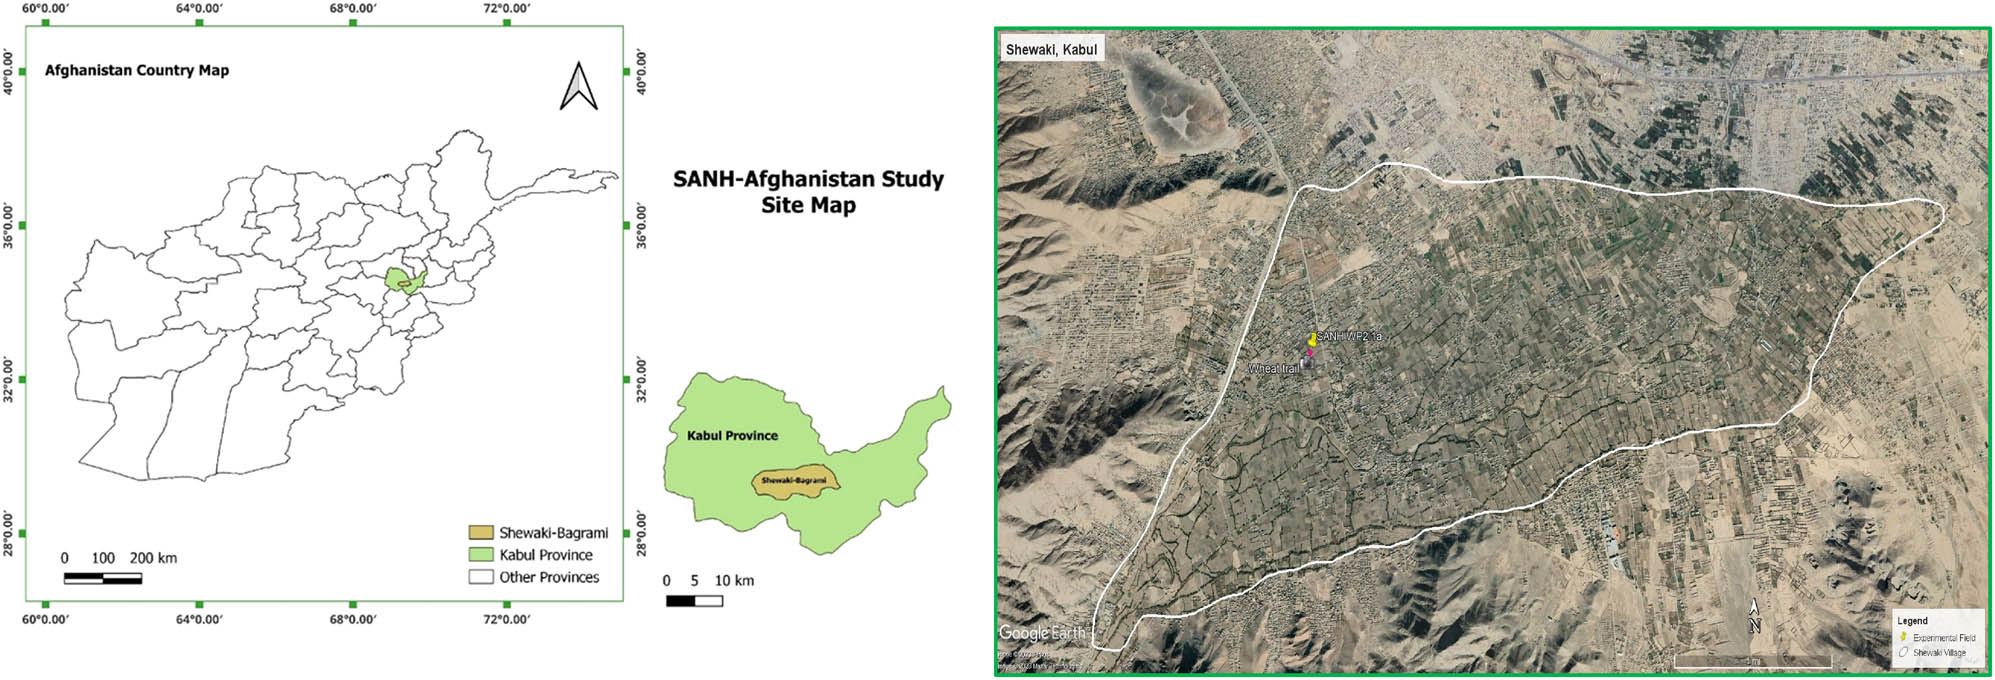
Maps of Greater Kabul in Afghanistan showing the location of the selected village, research site. Created by the author using QGIS.
Cropland in the area is utilized for both subsistence and commercial farming, while the surrounding open land is used by pastoralists, allowing their animals to graze freely within the village. Crop production primarily relies on inputs such as chemical fertilizers (urea and diammonium phosphate [DAP]), and organic fertilizers like animal manure [AM] and night soil [NS]. Additional nutrients are supplied through irrigation water and aerosol dust. The irrigation system is fed by diverted rivers, boreholes, and traditional underground “Karez” channels [7]. The average cultivated area per farm household is approximately 0.6 ha, although some larger households manage irrigated farms exceeding 2.8 ha. The livestock sector in Shewaki predominantly comprises cattle (including dairy cows) and sheep, with goats, donkeys, and poultry also being raised [7].
The soil at the experimental site was classified as Fluvisol [15] of alluvial origin, with a texture of 17.28% sand, 66.06% silt, and 16.66% clay to a depth of 0.15 m and 19.47% sand, 64.83% silt, and 15.70 % clay at depths of 0.15–0.30 m. Calcium carbonate (CaCO3) concentrations were found to be 11% [7].
Prior to the establishment of the tomato crop (cv. Roma) in July 2021, comprehensive assessments of soil parameters were conducted across the experimental treatments. Total N levels at both 0.0–0.15 m and 0.15–0.30 m depths showed consistent values across all treatments, with no statistically significant differences (Tables 1 and 2). Similarly, concentrations of organic matter (OM) and organic carbon (Corg) exhibited uniform trends across the treatment plots. Furthermore, measurements of available phosphorus (P), potassium (K), pH, electrical conductivity (EC), and bulk density (BD) indicated minimal variation across the experimental conditions.
Soil chemo-physical properties of 30 experimental plots at the depth of 0.0–0.15 m prior to the cultivation of tomatoes in Shewaki of Kabul, Afghanistan
| Soil (0 ̶ 0.15 m) properties | A1 | A2 | A3 | B1 | B2 | B3 | C1 | C2 | C3 | Control |
|---|---|---|---|---|---|---|---|---|---|---|
| OM (%) | 6.09a(±0.27) | 6.34a(±0.80) | 6.50a(±0.57) | 6.59a(±0.26) | 6.33a(±0.27) | 6.85a(±1.00) | 6.11a(±0.80) | 6.72a(±0.85) | 6.29a(±0.57) | 6.37a(±0.50) |
| C (%) | 3.53a(±0.16) | 3.68a(±0.47) | 3.77a(±0.33) | 3.82a(±0.15) | 3.67a(±0.15) | 3.97a(±0.58) | 3.55a(±0.47) | 3.90a(±0.49) | 3.65a(±0.33) | 3.70a(±0.29) |
| N (%) | 0.77ae(±0.07) | 1.26b(±0.13) | 1.06a(±0.31) | 1.17c(±0.05) | 0.75a (±0.10) | 0.85de(±0.22) | 0.84ae(±0.19) | 0.87abde(±0.24) | 1.01ae(±0.33) | 0.67e (±0.06) |
| P (%) | 0.01a(±0.00) | 0.01a(±0.00) | 0.01a(±0.00) | 0.01a(±0.00) | 0.01a(±0.01) | 0.01a(±0.00) | 0.01a(±0.00) | 0.01a(±0.00) | 0.01a(±0.00) | 0.01a(±0.00) |
| K (%) | 0.37a(±0.12) | 0.37a(±0.12) | 0.43a(±0.11) | 0.44a(±0.13) | 0.41a(±0.10) | 0.36a(±0.12) | 0.40a(±0.10) | 0.31a(±0.19) | 0.43a(±0.10) | 0.38a(±0.10) |
| BD | 1.14a(±0.04) | 1.10a(±0.01) | 1.07a(±0.09) | 1.11a(±0.05) | 1.07a(±0.03) | 1.08a(±0.08) | 1.12a(±0.05) | 1.11a(±0.02) | 1.06a(±0.04) | 1.09a(±0.01) |
| pH | 7.93a(±0.06) | 7.93a(±0.15) | 7.90a(±0.17) | 7.93a(±0.06) | 7.87a(±0.06) | 7.83a(±0.06) | 7.93a(±0.15) | 7.83a(±0.06) | 7.93a(±0.06) | 7.93a(±0.12) |
| EC (dS m−1) | 1.30a(±0.00) | 1.30a(±0.00) | 1.30a(±0.00) | 1.35a(±0.08) | 1.30a(±0.00) | 1.33a(±0.05) | 1.30a(±0.00) | 1.30a(±0.00) | 1.30a(±0.00) | 1.30a(±0.00) |
Total N, plant available P, K, OM, Corg, BD, and EC. Data show means ± one standard deviation. Details of the treatments are: A1 (−25 % AM + ¼ urea and DAP), A2 (+25% AM + ¼ urea and DAP), A3 (typical farmers’ AM + urea and DAP), B1 (−25% NS + ¼ urea and DAP), B2 (+25% NS + urea and DAP), B3 (typical farmers’ NS + urea and DAP), C1 (−25% urea and DAP), C2 (+25% urea and DAP), and C3 (typical farmers’ urea and DAP). Different letters within a row indicate significant differences (p < 0.05) between the treatments.
Soil chemo-physical properties of 30 experimental plots at the depth of 0.15–0.30 m prior to the cultivation of tomato in Shewaki of Kabul, Afghanistan
| Soil (0.15 ̶ 0.30 m) properties | A1 | A2 | A3 | B1 | B2 | B3 | C1 | C2 | C3 | Control |
|---|---|---|---|---|---|---|---|---|---|---|
| % OM | 6.89abc(±0.22) | 6.76ac(±0.14) | 6.84abc(±0.50) | 7.06abc(±0.36) | 7.41a(±0.78) | 7.44a(±0.38) | 7.70b(±0.82) | 6.97abc(±0.67) | 6.39c(±0.22) | 7.02abc(±0.56) |
| % C | 4.00abc(±0.13) | 3.92ac(±0.08) | 3.97abc(±0.29) | 4.10abc(±0.21) | 4.30a(±0.46) | 4.32a(±0.22) | 4.46b(±0.48) | 4.04abc(±0.39) | 3.71c(±0.13) | 3.51abc(±0.32) |
| % N | 0.43 (±0.14) | 0.52a (±0.09) | 0.41a (±0.16) | 0.43 (±0.14) | 0.52a (±0.18) | 0.49a (±0.25) | 0.58 (±0.19) | 0.51a (±0.09) | 0.49a (±0.18) | 0.52a (±0.18) |
| % P | 0.02a (±0.00) | 0.02a (±0.00) | 0.02a (±0.00) | 0.02a (±0.00) | 0.02a (±0.00) | 0.02a (±0.00) | 0.02a (±0.00) | 0.01a (±0.00) | 0.02a (±0.00) | 0.02a (±0.00) |
| % K | 0.67a (±0.06) | 0.67a (±0.04) | 0.68a (±0.03) | 0.68a (±0.02) | 0.65a (±0.06) | 0.70a (±0.01) | 0.72a (±0.06) | 0.67a (±0.07) | 0.64a (±0.09) | 0.69a (±0.07) |
| BD | 1.03a (±0.05) | 1.02a (±0.03) | 1.11a (±0.03) | 1.04a (±0.08) | 1.07a (±0.12) | 1.09a (±0.10) | 0.97a (±0.03) | 1.07a (±0.05) | 1.08a (±0.08) | 1.04a (±0.03) |
| pH (1:5) | 7.87a (±0.21) | 7.87a (±0.25) | 7.90a (±0.10) | 7.93a (±0.06) | 7.77a (±0.21) | 7.90a (±0.10) | 7.93a (±0.12) | 7.73a (±0.15) | 7.93a (±0.06) | 7.93a (±0.15) |
| EC (dS m−1) | 1.26a (±0.07) | 1.22a (±0.07) | 1.26a (±0.07) | 1.22a (±0.07) | 1.26a (±0.07) | 1.26a (±0.07) | 1.22a (±0.07) | 1.26a (±0.07) | 1.22a (±0.07) | 1.22a (±0.07) |
Total N, plant available P, K, OM, Corg, BD, and EC. Data show means ± one standard deviation. Details of the treatments are: A1 (−25% AM + ¼ urea and DAP), A2 (+25% AM + ¼ urea and DAP), A3 (typical farmers’ AM + urea and DAP), B1 (−25% NS + ¼ urea and DAP), B2 (+25% NS + urea and DAP), B3 (typical farmers’ NS + urea and DAP), C1 (−25% urea and DAP), C2 ( + 25% urea and DAP), C3 (typical farmers’ urea and DAP). Different letters within a row indicate significant differences (p < 0.05) between the treatments.
It is noteworthy that Table 3 represents data aggregated for the entire village, encompassing broader soil characteristics beyond the specific experimental plots. This preliminary assessment underscores the initial homogeneity in soil characteristics before agricultural interventions commenced, providing a foundational baseline for subsequent comparisons and analyses following tomato cultivation.
Overall physiognomies of the village and dominated farming system in Shewaki, Kabul, Afghanistan
| Socio-economics | Characteristics |
|---|---|
| Household orientation | Commercial and subsistence |
| Number of studied households | 212 |
| Agriculture and village area under study (km2) | 7.39* |
| Irrigation type | Flood and furrow |
| Main crops | Cereal and cash crops |
| Other crops grown | Potato, summer squash, tomato, maize, clover, onion, etc. |
| Fertilizers applied | DAP, urea, NS, AM |
| Out-sighted crop nutrients | Aerosol dust, rain, and contaminated irrigation water |
| Soil properties | |
| Soil type (texture) | Silt loam |
| BD (surface and subsurface 0.07 m depth) | 1.29–1.43 |
| pH (0.15–0.30 m surface and subsurface) | 7.82–7.92 |
| EC (dS m−1) | 1.28–1.29 |
| OM 0.15–0.30 m (%) | 5.73–5. 37 |
*Village and fields under study area, measured by Google Earth tools.
2.2 Layout of the experiment and treatments
A tomato (cv. Roma) crop was established in July 2021, comprising 10 treatments grouped under three different management approaches. These were compared with an unfertilized control (Table 4). Each field plot measured 15 m × 1.2 m, featuring one furrow that was 0.5 m wide and 0.3 m deep, with a distance of 0.8 m between furrows. N inputs were supplied from three accessible sources: AM from local animal stables, NS from the city or local toilets, and a combination of urea and DAP which are widely adopted for tomato production by farmers at the standard rate of 250 kg ha−1 urea and 250 kg ha−1 DAP for both urea and DAP. The N rate was modified to include a ±25% N ha−1 variation in the standard N application, allowing for sub-treatments within each management group. This resulted in two approaches: one involving deep placement of fertilizer (2 t ha−1 AM or NS along with a supplemental dose of ±25% urea and ±25% DAP), which was applied by furrow hoeing 10 cm beneath the crops four weeks after transplantation, in line with the local farmer practice; the other involving surface application standard dose of (2 t ha−1 AM and NS and 250 kg ha−1 urea and DAP) by broadcasting, which is the conventional method adopted by farmers. By testing different N management strategies, the research focuses on improving nutrient management practices in a way that benefits local farmers and promotes sustainable tomato production. The results are intended to offer practical, environmentally sustainable solutions that could be adapted to local farming practices while maintaining high crop yields. Irrigation was performed at 3-day intervals according to the crop requirement, providing 341 mm per furrow for each irrigation event.
Layout of the experiment and method of applications
| Group | Treatment | Combination (treatment) | Total N kg ha−1 fertilizer + manure | Crop | Mode of application |
|---|---|---|---|---|---|
| A | A1 | −25% *AM + ¼ urea and DAP | 53.15 | Tomato | Subsurface |
| A2 | +25% AM + ¼ urea and DAP | 65.67 | Subsurface | ||
| A3 | 2 t AM + ¼ urea and DAP | 59.41 | Surface | ||
| B | B1 | −25% *NS + ¼ urea and DAP | 47.71 | Subsurface | |
| B2 | +25% NS + ¼ urea and DAP | 56.60 | Subsurface | ||
| B3 | 2 t NS + ¼ urea and DAP | 52.15 | Surface | ||
| C | C1 | −25% of urea and DAP | 103.13 | Subsurface | |
| C2 | +25% of urea and DAP | 171.88 | Subsurface | ||
| C3 | 250 kg ha−1 urea and 125 kg ha−1 DAP | 137.50 | Surface | ||
| Control | Control | Zero | 0.00 | Not applied |
*AM = animal manure, NS = night soil.
2.3 N inputs measurement and tracking
Tomato farming, following the spring wheat harvest at Shewaki village, involved high inputs of biowaste (AM and NS), irrigation water, and chemical fertilizers. In this experiment, we adjusted farmers’ N application rates by ±25% of the standard rate and introduced an innovative deep placement technique at a depth of 10 cm. Treatments C1, C2, and C3 received higher N inputs of 376, 341, and 307 kg N ha−1, respectively. Other treatments, including the control, received lower N levels. The N contributions from irrigation water (199.7 kg N ha−1) and dust (4.00 kg N ha−1) were kept consistent across all experimental plots (Table 5).
Inputs N, P, and K (kg ha−1) via applied manures (animal and NS), che. fertilizers (urea and DAP), and imported NPK via irrigation water and precipitation of aerosol dust throughout the growing season of the tomato crops
| Treatments | Total inputs | Organic manures | Chemical fertilizers | Irrigation water | Aerosol dust | ||||||||||
|---|---|---|---|---|---|---|---|---|---|---|---|---|---|---|---|
| N kg ha−1 | P kg ha−1 | K kg ha−1 | N kg ha−1 | P kg ha−1 | K kg ha−1 | N kg ha−1 | P kg ha−1 | K kg ha−1 | N kg ha−1 | P kg ha−1 | K kg ha−1 | N kg ha−1 | P kg ha−1 | K kg ha−1 | |
| A1 | 256.85 | 35.45 | 140.73 | 18.78 | 0.04 | 2.54 | 34.38 | 14.38 | 0.00 | 199.70 | 21.01 | 137.26 | 4.00 | 0.03 | 0.93 |
| A2 | 269.37 | 35.47 | 142.43 | 31.30 | 0.06 | 4.24 | 34.38 | 14.38 | 0.00 | 199.70 | 21.01 | 137.26 | 4.00 | 0.03 | 0.93 |
| A3 | 263.11 | 35.46 | 141.58 | 25.04 | 0.05 | 3.39 | 34.38 | 14.38 | 0.00 | 199.70 | 21.01 | 137.26 | 4.00 | 0.03 | 0.93 |
| B1 | 217.03 | 21.10 | 140.50 | 13.33 | 0.07 | 2.31 | 34.38 | 14.38 | 0.00 | 199.70 | 21.01 | 137.26 | 4.00 | 0.03 | 0.93 |
| B2 | 260.29 | 35.52 | 142.05 | 22.22 | 0.11 | 3.86 | 34.38 | 14.38 | 0.00 | 199.70 | 21.01 | 137.26 | 4.00 | 0.03 | 0.93 |
| B3 | 255.85 | 35.50 | 141.28 | 17.78 | 0.09 | 3.09 | 34.38 | 14.38 | 0.00 | 199.70 | 21.01 | 137.26 | 4.00 | 0.03 | 0.93 |
| C1 | 306.82 | 64.16 | 138.19 | 0.00 | 0.00 | 0.00 | 103.13 | 43.13 | 0.00 | 199.70 | 21.01 | 137.26 | 4.00 | 0.03 | 0.93 |
| C2 | 375.57 | 92.91 | 138.19 | 0.00 | 0.00 | 0.00 | 171.88 | 71.88 | 0.00 | 199.70 | 21.01 | 137.26 | 4.00 | 0.03 | 0.93 |
| C3 | 341.20 | 78.54 | 138.19 | 0.00 | 0.00 | 0.00 | 137.50 | 57.50 | 0.00 | 199.70 | 21.01 | 137.26 | 4.00 | 0.03 | 0.93 |
| Control | 203.70 | 21.04 | 138.19 | 0.00 | 0.00 | 0.00 | 0.00 | 0.00 | 0.00 | 199.70 | 21.01 | 137.26 | 4.00 | 0.03 | 0.93 |
Details of the treatments are A1 (−25% AM + ¼ urea and DAP), A2 (+25% AM + ¼ urea and DAP), A3 (typical farmers’ AM + urea and DAP), B1 (−25% NS + ¼ urea and DAP), B2 (+25% NS + urea and DAP), B3 (typical farmers’ NS + urea and DAP), C1 (−25% urea and DAP), C2 (+25% urea and DAP), and C3 (typical farmers’ urea and DAP).
All nitrogen input samples, including those from biowaste, chemical fertilizers, irrigation water, and dust, were collected during the growing season to ensure representative data. Irrigation water samples were collected from two main sources: stream water and borewell water, used alternately for irrigation throughout the growing season. We measured the nitrogen content of both stream and borewell water to determine their nitrogen concentrations accurately. These samples were analyzed using standard laboratory protocols (explained in Section 2.4), including inductively coupled plasma (ICP) spectroscopy, to determine nitrogen concentrations.
Despite these efforts, potential sources of error in nitrogen estimation were identified due to the research farm’s location and environmental conditions. During late spring and rainfall events, plots were irrigated primarily with stream water, which might have contained elevated nitrogen concentrations. The stream, flowing through the middle of the village, was observed to serve as a sanitation resource for the local population, potentially introducing additional nitrogen sources. Additionally, stream sludge that accumulated during winter and spring and subsequently dried after rainfall events may have contributed to nitrogen levels beyond normal expectations.
Analysis of the collected samples and calculations of nitrogen inputs were performed at the end of the growing season. While efforts were made to standardize and monitor nitrogen inputs accurately, these environmental factors and the dual sources of irrigation water may have introduced variability that was challenging to quantify. This underscores the need for careful site-specific considerations in field research and highlights the importance of acknowledging these potential limitations when interpreting results.
2.4 Sampling and measurements
Irrigation water samples were collected at each irrigation event and pooled. To prevent biochemical degradation, one drop of concentrated (32%) HCl was added to each water sample before storage in polyethylene (PE) bottles at a temperature of below <4°C until total N analysis. The N content of chemical fertilizers, specifically urea (46% N) and DAP (18% N), was provided by the manufacturers.
Dust samples were collected monthly using three plastic pans, which were covered with mesh to protect against bird droppings and mounted on individual iron stands 2 m above the ground. Sampling occurred around the experimental field from May to November 2021. Samples were filtered, dried at room temperature, weighed, and sealed in PE zip-lock bags for later analysis [16].
After harvest of the first, second, third, and final tomato crops, approximately 300 g of fruit and shoot samples were collected from five random locations in the field, pooled, and weighed. The pooled samples were dried at 60°C for 48 h until a constant weight was reached and then reweighed for moisture content correction. Dried samples were ground to a particle size of 0.5 mm using a mill (MPD102, Biobase China) and stored in sealed PE zip-lock bags until nitrogen analysis [7].
To measure the N-content in manure, five sub-samples were collected from the manure heap using a 5 cm × 20 cm soil sampler to a depth of 0.2 m. These sub-samples were pooled, air-dried at room temperature for 48 h, ground using a mill (MPD102, Biobase China), and stored in PE bottles for dry matter (DM) and nitrogen analysis.
For soil property determination, surface (0.0–0.15 m) and subsurface (0.15–0.30 m) soil samples were collected in August, prior to cultivation. Five sub-samples from each experimental plot were pooled, spread on paper, and air-dried in the shade at room temperature. Roots and crop residues were removed by passing samples through a 2 mm mesh sieve. Some soil samples were kept in PE containers at a temperature of below <4°C for NO3 and NH4 analysis in the lab.
Additional samples for soil moisture content and BD measurement were taken with a 7 cm × 7 cm auger from both the surface (0.0–0.15 m) and subsurface (0.15–0.30 m) soil layers. These samples were weighed, dried at 105°C, and reweighed for moisture content determination [17].
2.5 Physico-chemical analyses
Soil pH and EC at depths of 0.0–0.15 and 0.15–0.30 m were measured using a portable pH meter (HI9811-5 Portable pH/EC/TDS/temperature meter, Hanna, Romania) in a 1:5 soil–water suspension (5 g of soil and 25 ml of distilled water). Soil textural classes at the depths of 0.0–0.15 and 0.15–0.30 m were determined using the Hydrometer method as described in the ICARDA manual for soil, plant, and water analysis [18].
Total soil N was determined using an Automatic Kjeldahl Distillation Unit (Model – K9840), following the method outlined in the ICARDA Manual for soil, plant, and water analysis [18]. Soil nitrate (NO3) and ammonium (NH4) were measured by mixing 10 g of fresh soil with 40 ml of calcium chloride (CaCl2 2H2O, 0.0125 mol/l), and shaking for 1 h. The samples were then filtered using filter paper (MN 615¼) and analyzed as described below.
Total N in irrigation water samples was analyzed using the Automatic Kjeldahl Distillation Unit, as described in the ICARDA manual for soil, plant, and water analyses [18].
Total N from manure and dust samples were also analyzed using the Automatic Kjeldahl Distillation Unit, following the ICARDA manual for soil, plant, and water analyses [18]. Adherent sand particles (HCl-insoluble ash) were determined according to the method of Naumann and Bassler [19].
Total N in crops was determined using the Automatic Kjeldahl Distillation Unit, ICARDA manual for soil, plant, and water analyses [18]. Soil organic matter was measured according to the method described by Close and Menke [20]. A conversion factor of 1.724 from OM to Corg was used based on the assumption that OM contains 58% of Corg [21].
2.6 Estimation of NH3 emissions
NH₃ emissions were quantified using the boric acid trap method. An acrylic chamber was placed on the soil surface, allowing ammonia emitted from the soil to pass through a boric acid solution, which was then drawn through a suction pump for 30 min. The NH3 concentration was determined by titration with standard sulfuric acid (H2SO4), assuming that one mole of H2SO4 is required for each mole of NH3 [22,23]. This method accurately quantifies ammonia emissions through volatilization. The detailed procedure provided ensures that the process can be replicated in future studies, offering a reliable means of measuring NH3 flux in agricultural systems.
2.7 Estimation of NO3–N and NH4–N leaching
Given the high intensity of tomato production, 10 out of the 30 plots (middle replication) from the experiment were selected for leaching studies during the growing season (August–November). The treatments applied included standard rates of AM (A), NS (B), and urea and DAP (C). Leaching losses were estimated using 30 polyvinyl chloride (PVC) cartridges across the 10 treatments, with three measurements per plot. Each cartridge had a surface area of 19.6 cm2 and was capped with a nylon net at the bottom.
The PVC cartridges were filled with an ion-exchange resin–sand mixture following the procedure described by Lang and Kaupenjohan [24], Predotova et al. [25], and Safi et al. [7]. Cartridges were installed according to the guidelines of TerrAquat Consultancy (Stuttgart, Germany), the patent holder of this method, and were buried below the subsurface layer at a depth of 0.45 m from August to November 2021.
After the cartridges were removed from the soil, the resin-sand mixture was separated into five layers (L1–L5) of approximately 10 mm and stored in a refrigerator until analysis. For ion extraction, 10 ± 0.5 g of the pooled layer was placed in 250 ml PE bottles, mixed with 100 ml of extractant, and shaken horizontally for one hour. Each sample was extracted eight times; extracts from the first four, fifth, sixth, seventh, and eighth were pooled. A 20 ml subsample of each pooled extract was then frozen until analysis for NO3–N and NH4–N using an ICP Spectrometer (Model Spectro-Flame, Spectro Analytica Instruments GmbH & Co. KG, Kleve, Germany). Duplicate samples of the sand used (10 g each) were extracted similarly and served as blanks. Nutrient concentrations in the samples were converted to kg ha−1 season−1 (see below). Leaching losses of N through NO₃–N and NH₄–N were quantified using this method, which involves collecting leachate samples using ion-exchange resin–sand cartridges. The methodology allows for detailed monitoring of nitrogen losses via leaching during the growing season. While this study measures nitrogen losses through volatilization (NH₃) and leaching (NO₃–N, NH₄–N), denitrification, another nitrogen loss pathway, was not directly measured. However, its potential role in nitrogen dynamics will be addressed in future studies.
2.8 Calculations of nutrient balance and apparent NUEs
For each plot, partial (horizontal) N balances were calculated based on the quantity of N inputs and outputs (inorganic and organic fertilizers, dust, and irrigation water applied versus crop biomass harvested) per hectare. Wherever applicable, crop residues were returned to the plot and therefore not considered for the calculation of N outputs. N fluxes were estimated by multiplying the mass of the material by their N concentrations [26]:
where F is the total N removed in the crop (output) over the period of measurement, n is the number of events (application of fertilizer, irrigation water, dust, or harvested crop product), Q i is the quantity of plant DM at event i, and C i is the N concentration in the plant DM at event i.
The N balance equation for each plot was expressed as
where ∆P N , I N, and O N stand for each change in the pool, the input, and the output of N [26].
Applying equation (2) the input flows for N were estimated for dust after sowing (D N, though often negligible), irrigation water (IWN), and for fertilizer (F N), Similarly, the output flows were assessed from harvested crops (H N). If ∆P E is the net change in soil storage of element E (∆soilN), equation (2) can be written as
This approach neglected N deposition from rainfall as it was likely to have been small in Kabul, as well as runoff from the well-leveled fields, N2 fixation in non-symbiotic crops that typically ranges from 2 to 5 kg N ha−1 year−1 [27], and the likely large volatilization of Corg, which unfortunately could not be measured under the local conditions. Calculations were undertaken for tomato crops from planting to harvest over 3–4 months [7].
Apparent NUEs were calculated according to Wang et al. [28] as
where NUE denotes apparent nutrient use efficiency, O stands for the nutrient content in harvested crop, and I is the nutrient input.
Partial factor productivity (PFP) was calculated according to the following equation:
2.9 Statistical analyses
Multivariate analyses of variance were performed using SPSS (Version 23.0, SPSS Inc., Chicago, IL, USA) to assess the significance of differences among the ten treatments in terms of nutrient inputs, outputs, horizontal fluxes, use efficiency, and soil chemical properties, including soil pH, EC, OM, Corg, total N, and plant-available P and K. Physical properties such as BD and soil texture were also analyzed [7].
3 Experimental results
3.1 Nitrogen losses
3.1.1 NH3 emission
Average ammonia emissions over the first seven days were measured in three treatments: managed (A2), typical farmer practice (A3), and control plots. The emissions ranged from 0.14 to 0.17 kg ha−1 day−1. The highest emissions were observed in the typical farmer practice treatment (A3) at 0.17 kg ha−1 day−1, followed by the managed treatment (A2), while the control had the lowest emissions at 0.14 kg ha−1 day−1 (Figure 2). Peak emissions occurred on the first day of measurement and gradually declined over the following days.
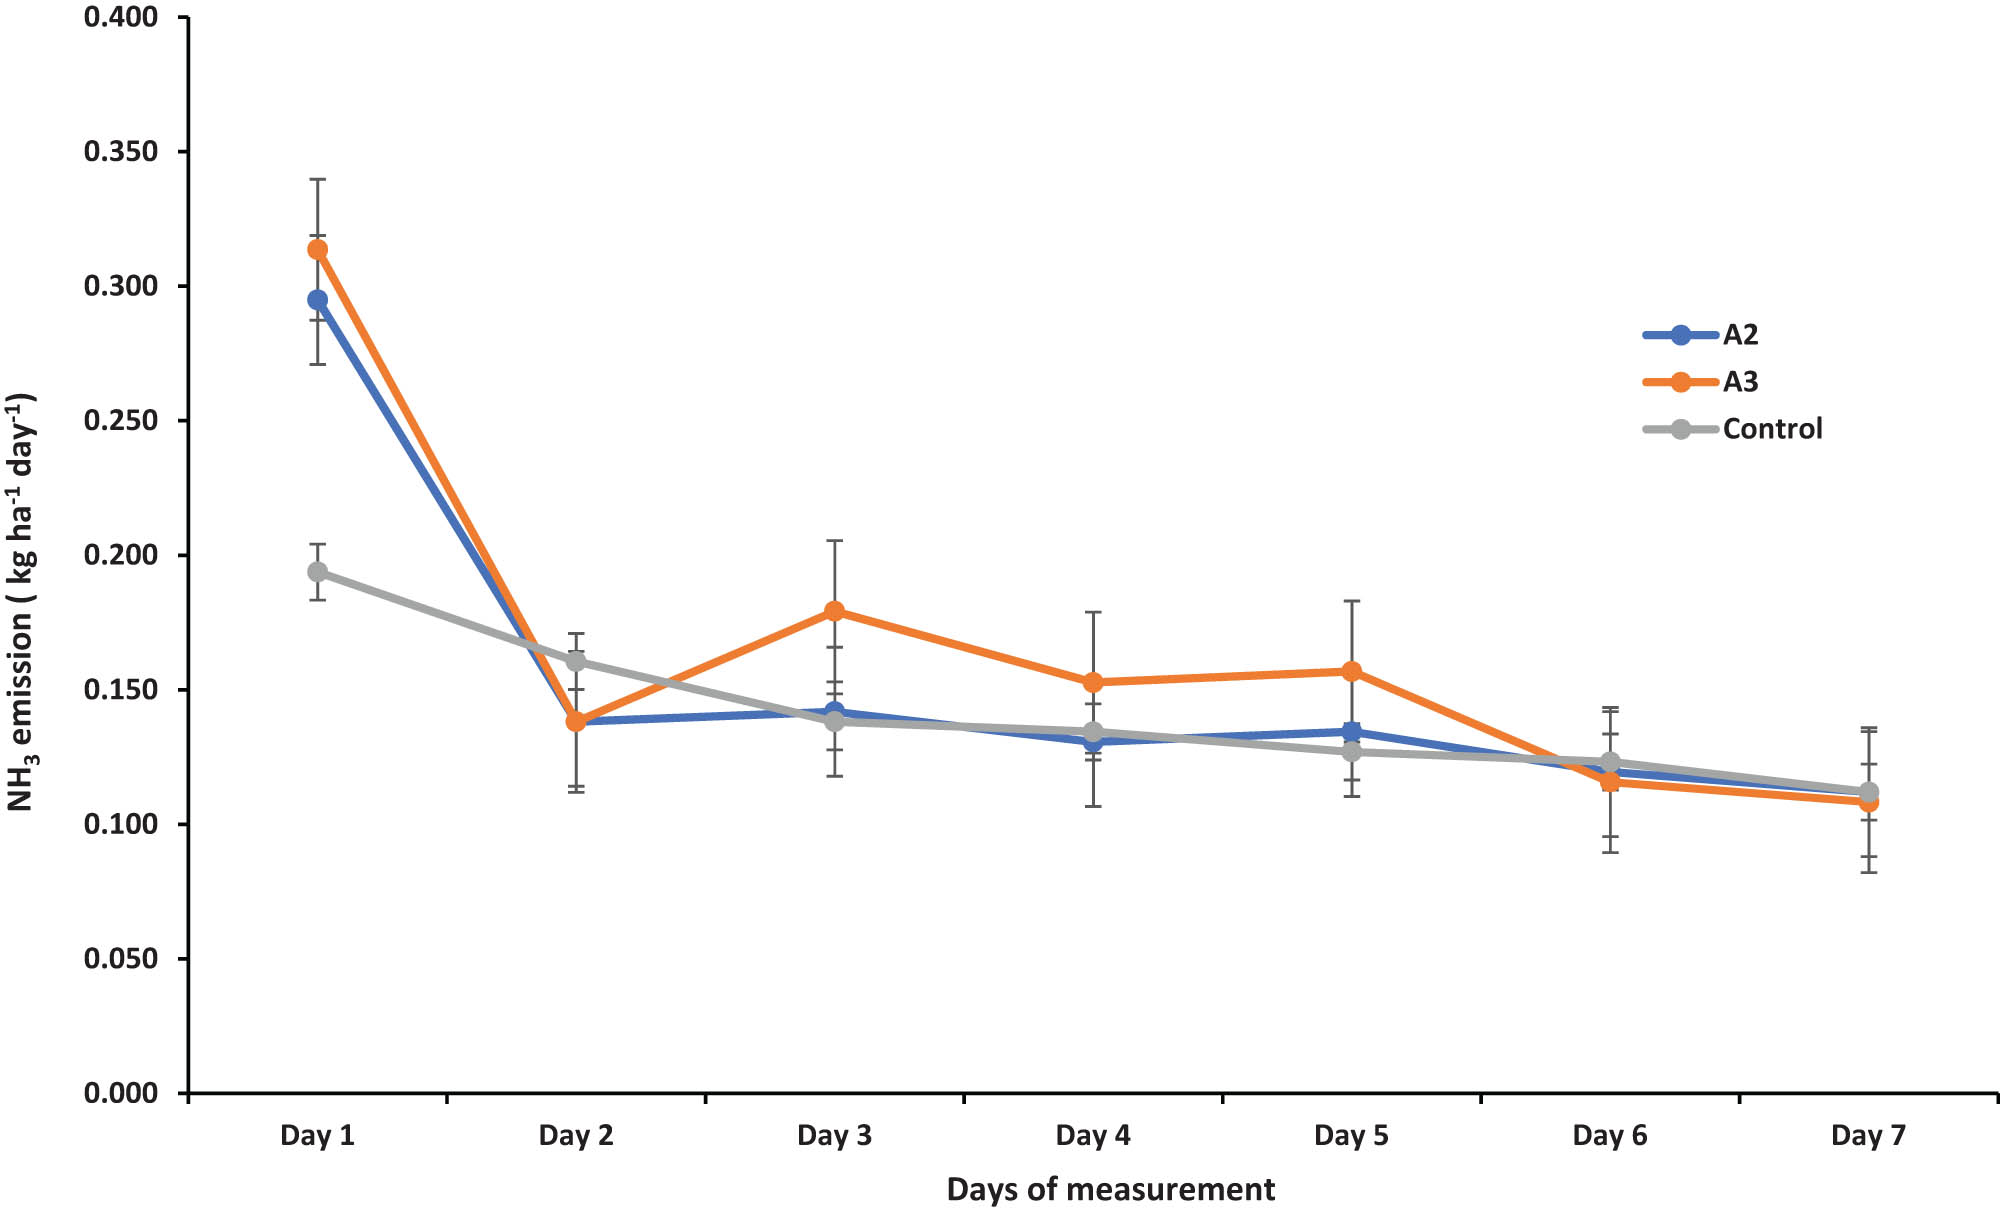
Ammonia (NH3) emission kg ha−1 h−1 from the tomato experimental field from typical farmer practice (A3), managed (A2), and control plots (n = 3) in Shewaki village of Kabul, Afghanistan, in 2021.
3.1.2 Nitrate (NO3–N) and ammonium (NH4–N) leaching
Nitrogen leaching was assessed using ion exchange resins across the experimental plots. The average nitrate (NO3–N) loss was 96 kg N ha−1 for the season, while ammonium (NH4–N) losses were much lower at 8 kg N ha−1 for the entire season. The treatments with the highest NO3–N leaching were the modified (A2) at 145 kg N ha−1, followed by the typical treatment (B3) at 128 kg N ha−1. The modified treatments B2 and C2 had losses of 111 and 103 kg N ha−1, respectively. In contrast, lower NO3–N losses were observed in the typical (A3), modified (B1), typical (C3), and modified (C1) treatments, with leaching amounts of 58, 59, 74, and 78 kg N ha−1, respectively. The control treatment had intermediate NO3–N leaching losses. For NH4–N, the highest losses occurred in the typical treatment (B3) at 17 kg N ha−1, followed by modified (B1) at 10 N ha−1 and the control plots at 8 kg N ha−1 (Figure 3).

Nitrate–N (NO3–N) and ammonium–N (NH4–N) leaching from the typical farmer practice and managed tomato experimental plots in Shewaki village of Kabul, Afghanistan. Details of the treatments are: A1 (−25% AM + ¼ urea and DAP), A2 (+25% AM + ¼ urea and DAP), A3 (typical farmers’ AM + urea and DAP), B1 (−25% NS + ¼ urea and DAP), B2 (+25% NS + urea and DAP), B3 (typical farmers’ NS + urea and DAP), C1 (−25% urea and DAP), C2 (+25% urea and DAP), and C3 (typical farmers’ urea and DAP).
3.2 N uptake, balance, and NUE
3.2.1 N removal and uptake
Average seasonal N removal varied significantly between treatments. The typical farmer practice treatments B3 and C3 and control had the highest yields, with values of 141.7, 86.9, and 91 kg N ha−1, respectively. This was followed by the managed treatments C1, C2, and A2 with yields of 85.9, 75.8, and 75.6 kg N ha−1, respectively. The lowest yields were observed in treatments B2 and A1 at 54.9 and 63.5 kg N ha−1, respectively, and these differences were statistically significant (p < 0.05).
The highest nitrogen uptake occurred in the typical farmer practice treatments B3, C3, and A3 and control, with crop N removals of 142, 87, 78, and 91 kg N ha−1 respectively. In the modified treatment C1, crop N removal was 86 kg N ha−1. Treatments A1 and B2 exhibited the lowest yields with 63 and 55 kg N ha−1, respectively, with these differences also being statistically significant (p < 0.05; Figure 4).
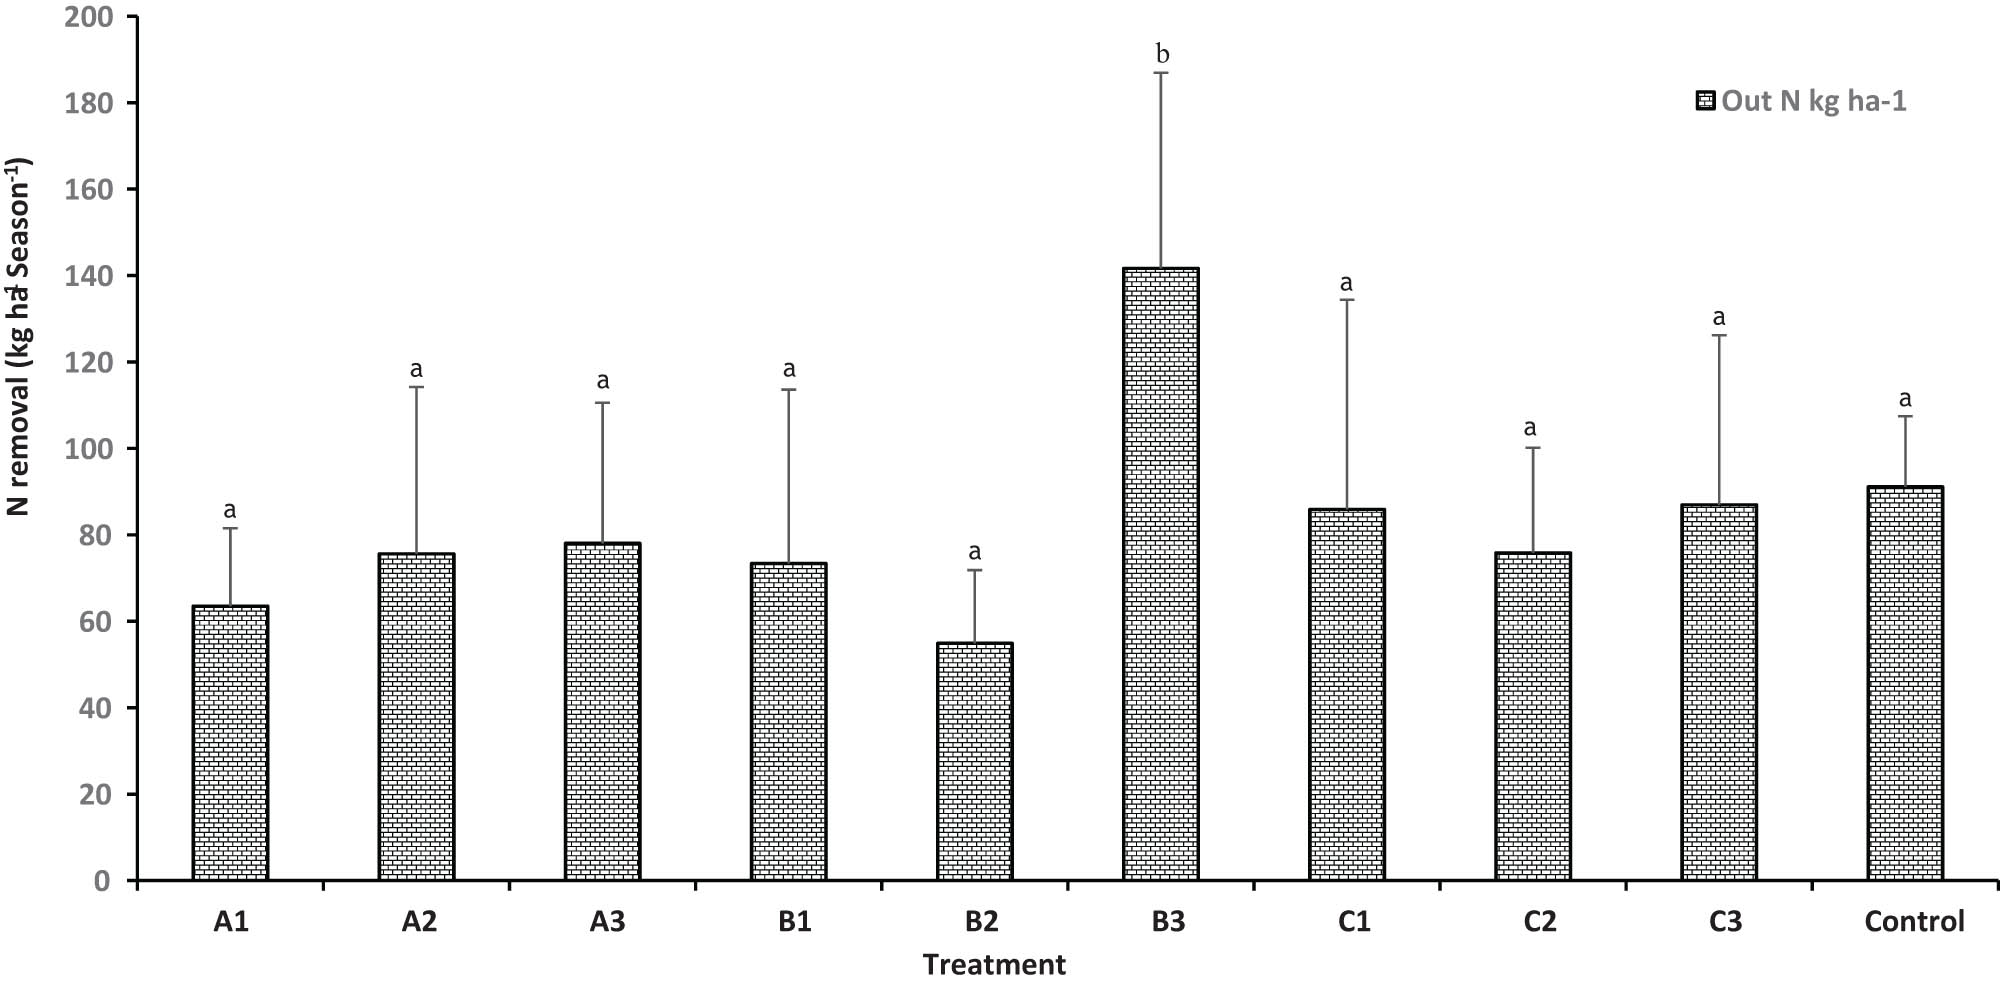
Seasonal removal of N from different treatments of typical farmer practice and managed plots of tomato experimental trial in Kabul, Afghanistan. Bars show the standard deviation of the mean and different letters indicate significant differences (p < 0.05) between the treatments. Details of the treatments are: A1 (−25% AM + ¼ urea and DAP), A2 (+25% AM + ¼ urea and DAP), A3 (typical farmers’ AM + urea and DAP), B1 (−25% NS + ¼ urea and DAP), B2 (+25% NS + urea and DAP), B3 (typical farmers’ NS + urea and DAP), C1 (−25% urea and DAP), C2 (+25% urea and DAP), and C3 (typical farmers’ urea and DAP).
3.2.2 N balance
Throughout the tomato production season, large positive N balances were noted across all treatments. On average, the partial balance of N in the modified and typical farmer practice treatments was 201 kg N ha−1. The modified treatment C2 showed the highest surplus of 300 kg N ha−1, compared to 254 kg N ha−1 in the typical farmer treatment C3. The control had the lowest N surplus of 112 kg N ha−1 (Figure 5).

Seasonal horizontal (partial) balances of N from typical farmer practice and managed potato experimental treatments in Shewaki of Kabul, Afghanistan. Bars show the standard deviation of the mean and different letters indicate significant differences (p < 0.05) between the treatments. Details of the treatments are: A1 (−25% AM + ¼ urea and DAP), A2 (+25% AM + ¼ urea and DAP), A3 (typical farmers’ AM + urea and DAP), B1 (−25% NS + ¼ urea and DAP), B2 (+25% NS + urea and DAP), B3 (typical farmers’ NS + urea and DAP), C1 (−25% urea and DAP), C2 (+25% urea and DAP), and C3 (typical farmers’ urea and DAP).
3.2.3 NUE
NUE across the treatments that received seasonal applications of inputs ranged from 20 to 55%. The highest NUE was observed in the control (55.10%), while the lowest was in treatment B2 at 20.19%. Generally, the modified treatments demonstrated higher NUE (49.67%) than the typical farmer practice treatments (32.00%) (Figure 6), with these differences being statistically significant (p < 0.05). The high levels of N input were reflected in the analysis of PFP. Reducing N inputs increased PFP compared to the N plus plot; however, conventional fertilizer management showed similar PFP to the reduced N plot, albeit inconsistently. Improved PFP with lower applications has also been reported by Irmack et al. [29] and Chen et al. [30].

Apparent inputs NUE by typical farmer practice and managed tomato treatments in Shewaki village, Afghanistan. Bars show the standard deviation of the mean and different letters indicate significant differences (p < 0.05) between treatments. Details of the treatments are: A1 (−25% AM + ¼ urea and DAP), A2 ( + 25% AM + ¼ urea and DAP), A3 (typical farmers’ AM + urea and DAP), B1 (−25% NS + ¼ urea and DAP), B2 (+25% NS + urea and DAP), B3 (typical farmers’ NS + urea and DAP), C1 (−25% urea and DAP), C2 (+25% urea and DAP), and C3 (typical farmers’ urea and DAP).
3.3 Apparent NUE and PFP
NUE of applied nitrogen sources, including AM, NS, urea, DAP, irrigation water, and deposited N by aerosol dust, ranged from 28 to 55% across the plots. Among the treatments, the control treatment exhibited the highest efficiency (55%), followed by C3 (44%), C1 (29%), and B1 (28%) (Figure 6). Treatment B2 had the lowest efficiency at 20%. The NUEs across the treatments were statistically significant (p < 0.05). PFP varied between treatment groups, with lower values (−26%) observed in the N plus treatment and higher values (36%) in both the minus N and standard N applications (Figures 7 and 8). The differences in PFP between treatments were highly significant (p < 0.05).

PFP by typical farmer practice and managed tomato treatments in Shewaki village, Afghanistan. Bars show the standard deviation of the mean and different letters indicate significant differences (p < 0.05) between treatments. Details of the treatments are: A1 (−25% AM + ¼ urea and DAP), A2 (+25% AM + ¼ urea and DAP), A3 (typical farmers’ AM + urea and DAP), B1 (−25% NS + ¼ urea and DAP), B2 (+25% NS + urea and DAP), B3 (typical farmers’ NS + urea and DAP), C1 (−25% urea and DAP), C2 (+25% urea and DAP), and C3 (typical farmers’ urea and DAP).

NUE as N uptake in Fertilized plots - N uptake in unfertilized plots/N applied by typical farmer practice and managed tomato treatments in Shewaki village, Afghanistan. Bars show the standard deviation of the mean and different letters indicate significant differences (p < 0.05) between treatments. Details of the treatments are: A1 (−25% AM + ¼ urea and DAP), A2 (+25% AM + ¼ urea and DAP), A3 (typical farmers’ AM + urea and DAP), B1 (−25% NS + ¼ urea and DAP), B2 (+25% NS + urea and DAP), B3 (typical farmers’ NS + urea and DAP), C1 (−25% urea and DAP), C2 (+25% urea and DAP), and C3 (typical farmers’ urea and DAP).
4 Discussion
4.1 N inputs
This study provides detailed and valuable insights into the substantial nutrient inputs supporting production in Kabul’s peri-urban areas and highlights opportunities to enhance nutrient use efficiency (NUE). The treatments resulted in widely varying nitrogen inputs, with treatments C1 and C2 receiving 307 and 376 kg N ha−1, respectively, highlighting the significant contributions of irrigation water to N inputs and the need for comprehensive assessments of all N sources in similar studies. Notably, this study integrates the role of irrigation water in N dynamics, which has been inadequately addressed in regional studies. These large N inputs exceed the crop requirements, potentially leading to high N losses, a positive N balance, and low NUE. However, the N inputs in this study were substantially lower than those reported in China by He et al. [31], who observed conventional farming inputs of 300–900 kg N ha−1 and over 1,000 kg N ha−1 in greenhouses [32,33].
It is widely recognized that integrated N management must balance N inputs with crop demands [34–37]. When N inputs exceed crop demand, significant losses, particularly through ammonia volatilization and nitrate leaching, can occur [38,39]. A review by Wei et al. [40], encompassing 290 articles from 1991 to 2022, underscores the critical importance of implementing robust management strategies to mitigate N losses, thereby advancing agricultural sustainability and environmental conservation. The extent of N loss pathways is shaped by the agro-ecological conditions of the experimental site, such as temperature and soil pH.
Results from this study showed elevated (NH3) emissions, averaging 0.17 kg N ha−1 day−1, with typical farmer practices showing the highest emissions, and the control plots showing the lowest emissions (0.14 kg ha−1 day−1) (Figure 2). These values are linked to site-specific factors, including high daytime temperatures and a soil pH exceeding 6.5. Management adjustment could lower NH3 losses to approximately 0.15 kg N ha−1 day−1. These losses are comparable to those reported by Personne et al. [41], who found NH3 fluxes ranging from an emission peak of 54,300 NH3 ng m−2 s−1 on the day of slurry application (with a median during the first 24 h of 5,990 NH3 ng m−2 s−1) to a deposition flux of −600 NH3 ng m−2 s−1 (with a median during the last period of −16 NH3 ng m−2 s−1). Rochette et al. [42] also demonstrated that incorporating urea in bands in dry acidic soils can increase NH3 volatilization compared to broadcasting followed by incorporation.
Leaching losses were high in both managed and typical experimental plots. Factors for high leaching rates include the high permeability of the sandy soil, flood irrigation, and excessive N application beyond plant uptake. The use of biowaste, such as AM and NS, contributed to N in the soil, but leaching was also influenced by low OM content, reducing the soil’s N retention capacity. Improper management of biowaste could exacerbate leaching, emphasizing the need for improved handling practices. A decrease in leaching was observed with altered management practices. Even the control plots exhibited relatively high levels of leaching, likely reflecting the significant N inputs received through irrigation water. Leaching values 68.9–138, 5.9, and 32 are consistent with findings from Safi et al. [7], Predetova et al. [25], and Strok et al. [43], respectively. High N leaching, which has contributed to elevated groundwater-N levels in Kabul, was previously documented by Houben et al. [44,45].
4.2 Nutrient outputs and partial balances
Crop N removal and yield showed no significant responses to most N treatments, likely due to elevated background N levels from irrigation water, which may have provided sufficient N for crop growth. Additionally, N leaching, observed in both managed and typical plots, likely resulted in the loss of applied N before plants could use it. High N leaching, may have reduced fertilizers efficiency, limiting their effectiveness in boosting yields. While N is critical for plant growth, other nutrients, such as phosphorus, potassium, and micronutrients, may have been limiting in this study, reducing N treatment’s impact on yield. External factors, such as water stress, temperature fluctuations, and climatic conditions during the growing season, could have constrained plants’ ability to fully utilize available N. Excessive N, particularly under non-ideal climatic conditions, may also lead to nutrient imbalances that limit crop growth. The limited OM in the experimental plots reduced N retention, diminishing the soil’s capacity to support improved yields despite biowaste inputs.
These observations align with findings by Ibukun et al. [3], who noted minimal effects of N application rates on biomass production. Similarly, Benard et al. [46] reported only a slight decrease in commercial fruit yield with reduced N supply (−7.5%) but observed improved fruit quality due to reduced vegetative growth and increased fruit DM content. Tao et al. [6] also found no significant effect on cherry tomato yield with increasing N levels from 160 to 320 kg N ha−1.
Addressing these factors in future studies to improve yield outcomes, optimizing irrigation practices, it will be essential to account for the N content in irrigation water and adjust fertilizer applications accordingly. Using precision irrigation methods and monitoring N levels in the irrigation water can help tailor fertilizer applications more accurately to meet crop demands without overapplying N. Future studies could focus on enhancing soil OM content through the addition of compost or cover crops. Improved soil structure and better N retention would help reduce N losses via leaching and increase N availability to plants over time. Addressing potential nutrient imbalances also will be important. Fertilizer applications should not only focus on N but also ensure that other limiting nutrients are adequately supplied to the crops. Soil testing and nutrient profiling can help in making more informed decisions regarding balanced fertilization. Environmental conditions, particularly water availability, should be closely monitored. Future studies could incorporate climate-controlled setups or focus on regions with more stable weather patterns to better understand the interaction between N inputs and crop yields.
To improve yield outcomes, future studies should optimize irrigation practices and consider N content in irrigation water. Using precision irrigation and monitoring N levels can help tailor fertilizer applications more accurately. Future studies should also focus on enhancing soil OM content through the addition of compost or cover crops to reduce N losses via leaching and increase N availability over time. Fertilizer applications should focus on balancing N and other limiting nutrients to support optimal crop growth. Monitoring environmental conditions and considering the effects of climate on N inputs and crop yields should be a priority in future research.
Throughout the tomato production season, the average total positive partial N balances were 201 kg N ha−1, with managed treatments C2, C1, and A2 showing higher surpluses (up to 254 kg N ha−1) compared to typical farmer practice treatments. Notably, the control treatment demonstrated the lowest surplus at 112 kg N ha−1, suggesting a potential underutilization of N in this scenario. These findings differ from those observed in a wheat field on similar soil, where managed treatments resulted in a net positive N balance, highlighting potential N leakage from farmers’ fields [7]. We observed a discrepancy in the N balance between the tomato production system and the wheat field on similar soil, which warrants further examination. Several factors could explain this variation: tomatoes, being a fruiting crop, have distinct N uptake patterns and nutrient demands compared to wheat. The high N demand for vegetative growth in wheat, versus the fruiting stage of tomatoes, likely leads to different N utilization efficiencies. This disparity may contribute to differences in N uptake and retention between the two systems. Soil conditions such as OM content, microbial activity, and permeability play a significant role in N cycling. The root structures and water requirements of tomatoes differ from those of wheat, affecting how N is absorbed from the soil and how much is retained or leached. These factors could lead to varied N balances between the two crops. The timing, form, and application rates of N fertilizers used for each crop are different, influencing the available N in the soil during the critical growth stages. Tomatoes and wheat might also respond differently to the same N sources depending on their growth stages and N uptake capacity. These findings highlight the need for crop-specific N management strategies. Future studies should focus on optimizing N application for each crop to enhance NUE and minimize environmental impacts. Tailored N management practices could ensure better yields while reducing nitrogen losses.
The positive N balance observed here is lower than those reported by Khai et al. [26] in Hanoi, Vietnam; yet, it exceeds averages typically seen in organic farms and intensive irrigated subtropical farming systems [26]. This discrepancy may stem from significant inputs such as AM, NS, N in irrigation water, aerosol dust, and condensed sewage water, which contribute to higher N surpluses in the system. Partial nutrient balances are valuable indicators for assessing the sustainability of agricultural systems.
Seasonal NUE varied across treatments, ranging from 20 to 55%, with the control treatment showing the highest NUE and treatment B2 the lowest. Overall, managed treatments achieved higher efficiency (49.67%) compared to typical farmer practices, in line with findings by Safi et al. (submitted for publication) in wheat production. This suggests that better management practices can lead to improved NUE, potentially reducing N losses and improving sustainability in the region’s agriculture system.
4.3 Future implications and recommendations for optimizing N use in Kabul’s tomato production
To optimize NUE and reduce N losses in Kabul’s tomato production system, several strategies informed by global research can be explored. First, green ammonia-based fertilizers offer a solution to excessive N applications, helping to minimize N losses, optimize NUE, and reduce ammonia emissions, as suggested by Koestoer et al. [47]. Precision irrigation systems, utilizing IoT-based technologies, can address N leaching, particularly in Kabul’s sandy loam soils, while also improving water use efficiency, which is crucial for the region’s arid climate [48]. Additionally, incorporating soil amendments like biochar can enhance N retention, reduce leaching, and promote better nitrogen uptake, benefiting soil fertility and tomato production [49]. It is also essential to adopt a balanced nutrient management approach, ensuring that other nutrients such as phosphorus and potassium are considered alongside N to optimize crop growth and NUE [50,51]. Finally, customized N management strategies should be tailored to the specific N needs of different crops, taking into account growth patterns, nutrient demands, and local environmental conditions, as suggested by Koestoer et al. [47], to improve NUE and promote sustainable agricultural practices.
5 Conclusions
The study identified substantial nutrient inputs supporting tomato production following wheat in the peri-urban areas of Kabul, Afghanistan. However, the heavy reliance on external N sources poses both potential benefits and challenges. Excessive N inputs can lead to significant N losses and reduced NUE, underscoring the need for careful balance between N inputs and crop demands to minimize losses, particularly through ammonia volatilization and nitrate leaching. Soil type and drainage conditions also play key roles in N loss dynamics. The results indicate that effective management practices can help mitigate NH3–N losses, as demonstrated by modified treatments that reduce N losses. Nonetheless, high N leaching from tomato crops after wheat rotation presents environmental challenges. Additionally, tomato yield showed no significant response to the N treatments, likely due to elevated N levels from irrigation water. These findings highlight the complexities of managing N in peri-urban agriculture, where the combination of high irrigation water N and biowaste inputs can influence soil nutrient balance. Despite these complexities, the study observed a positive average partial N balance, suggesting that more N is retained within the system than lost. Given the average soil pH in Afghan soils, is typically above 8, and the specific site near Kabul where groundwater may no longer be suitable for drinking, the long-term impacts of high N inputs on soil health are particularly concerning. The alkaline pH of the soil in the region may affect the bioavailability of certain nutrients and could exacerbate nutrient imbalances over time, leading to reduced soil fertility. Furthermore, the contamination of underground water sources, a critical issue in Kabul’s peri-urban areas, may compound the challenges of water management and soil health. Further exploration of the long-term impacts of high N inputs on soil health and crop productivity in Kabul’s peri-urban areas is crucial for developing sustainable N management strategies. Soil acidification, although not as prevalent in high-pH soils, may still occur in localized areas due to the continuous application of N fertilizers. This could lead to a decrease in soil pH, impacting nutrient availability and microbial activity. Additionally, excessive N inputs might disrupt the balance of essential nutrients, leading to deficiencies or toxicities that can compromise crop productivity over time. Future research should aim to quantify the long-term effects of N fertilization on soil properties, crop yields, and environmental sustainability, particularly in areas where water contamination is already a major concern. By addressing these concerns, we can improve N management practices, reduce the risks of soil degradation, and enhance agricultural productivity in peri-urban areas of Kabul.
Overall, these findings highlight the complexities of N management in Kabul’s peri-urban agricultural settings and underscore the importance of integrated, site-specific approaches to enhance agricultural sustainability.
Acknowledgments
We extend our sincere gratitude to the University of Kassel and the Agricultural University of Faisalabad, Pakistan, for their invaluable support during the sample analyses. We also thank the staff and students of the College of Agriculture at Kabul University for their assistance throughout this research. Special appreciation goes to the farmers in Shewaki village for their cooperation and active participation in this study. Additionally, we are deeply thankful for the generous support provided by the SANH-UKRI Project at Kabul University in Afghanistan.
-
Funding information: Authors state no funding involved.
-
Author contributions: All authors have accepted responsibility for the entire content of this manuscript and consented to its submission to the journal, reviewed all the results, and approved the final version of the manuscript. The First Author conducted the research, wrote the manuscript, and submitted it to the journal. Professor MS and Professor RR contributed to the conceptual formulation of the research. Dr. AB, Dr. JD, and Dr. SB provided guidance and support in developing the research methodology. Dr. TKA and Dr. AW assisted with data curation by organizing, validating, and preparing the data for analysis to ensure accuracy and consistency.
-
Conflict of interest: Authors state no conflict of interest.
-
Ethics statement: This study did not involve human or animal subjects and therefore did not require ethical approval.
-
Data availability statement: Data supporting the findings of this study are available upon request from the corresponding author.
References
[1] Fowler D, Steadman CE, Stevenson D, Coyle M, Rees RM, Skiba UM, et al. Effects of global change during the 21st century on the nitrogen cycle. Atmos Chem Phys. 2015;15:13849–93.10.5194/acp-15-13849-2015Search in Google Scholar
[2] Food and Agriculture Organization of the United Nations. Survey of the horticulture sector. Afghanistan. 2003 [cited 2023 Feb]. https://www.FAO.Org/3/y5163e/y5163e00.htmSearch in Google Scholar
[3] Ibukun T, Ayankojo T, Kelly TM. Tomato growth, yield, and root development, soil nitrogen and water distribution as affected by nitrogen and irrigation rates on a Florida sandy soil. HortScience. 2020;55(11):1744–55. 10.21273/HORTSCI15177-20.Search in Google Scholar
[4] World Population Review. World population by country 2022. 2022 [cited 2024 Nov 7]. https://www.worldpopulationreview.com/Country-Rankings/World-populationSearch in Google Scholar
[5] Safi Z, Dossa LH, Buerkert A. Economic analysis of cereal, vegetable, and grape production systems in urban and peri-urban agriculture of Kabul, Afghanistan. Exp Agric. 2011;47(4):705–16. 10.1017/S0014479711000482.Search in Google Scholar
[6] Tao Y, Liu T, Wu J, Wu Z, Liao D, Shah F, et al. Effect of combined application of chicken manure and inorganic nitrogen fertilizer on yield and quality of cherry tomato. Agronomy. 2022;12:1574. 10.3390/agronomy12071574.Search in Google Scholar
[7] Safi Z, Predotova M, Schlecht E, Buerkert A. Horizontal matter fluxes and leaching losses in urban agriculture of Kabul, Afghanistan. J Plant Nutr Soil Sci. 2011;174(6):942–51.10.1002/jpln.201000385Search in Google Scholar
[8] Bakhsh A, Kanwar RS, Karlen DL. Effects of liquid swine manure applications on NO3-N leaching losses to subsurface drainage water from loamy soils in Iowa. Agric Ecosyst Env. 2005;109:118–28.10.1016/j.agee.2005.01.018Search in Google Scholar
[9] Schröder JJ, Aarts HF, Ten Berge HF, Van Keulen H, Neeteson JJ. An evaluation of whole-farm nitrogen balances and related indices for efficient nitrogen use. Eur J Agron. 2003;20:33–44.10.1016/S1161-0301(03)00070-4Search in Google Scholar
[10] Guthrie S, Giles S, Dunkerley F, Tabaqchali H, Harshfield A, Ioppolo B, et al. The impact of ammonia emissions from agriculture on biodiversity: An evidence synthesis. Santa Monica (CA): RAND Corporation; 2018. https://www.rand.org/t/RR2695.10.7249/RR2695Search in Google Scholar
[11] European Environment Agency. Ammonia (NH3) emissions. 2019. http://www.eea.europa.eu/data-and-maps/indicators/eea-32-ammonia-nh3-emissions-1/assessment-4. Accessed 2019 Feb 01.Search in Google Scholar
[12] EUROSTAT. Agriculture, forestry and fishery statistics. Brussels, Belgium: European Union; 2016.Search in Google Scholar
[13] Grieser J, Gommes R, Cofield S. On the estimation of monthly precipitation fields in Afghanistan. The Agromet Group, SDRN. Rome, Italy: Food and Agriculture Organization of the UN (FAO); 2006.Search in Google Scholar
[14] Houben G, Tunnermeier T. Hydrogeology of the Kabul Basin, Part I: Geology, aquifer characteristics, climate and hydrography. BGR record no: 10277/05. Foreign Office of the Federal Republic of Germany; 2005.Search in Google Scholar
[15] International Soil Reference and Information Centre (ISRIC). Soils, Afghanistan [Internet]. ArcGIS Hub; 2022. https://hub.arcgis.com/maps/899296a426db447bad95b5cf9076ac9b.Search in Google Scholar
[16] Safi Z, Usmankhail MH, Sherzai FA. Assessments of dust-induced crop nutrient (NPK) and heavy metal (Cd, Pb, Ni, Zn, Cu) deposition in urban agriculture of Kabul, Afghanistan. Int J Agric Res Rev. 2020;8(4):47–58.Search in Google Scholar
[17] Grossman RB, Reinsch TG. Bulk density and linear extensibility. In: Dane JH, Topp GC, editors. Methods of soil analysis. Part 4. Physical methods. Madison (WI): Soil Science Society of America; 2002. p. 201–28.10.2136/sssabookser5.4.c9Search in Google Scholar
[18] Estefan G, Sommer R, Ryan J. Methods of soil, plant, and water analysis. 3rd ed. Beirut (LB): International Center for Agricultural Research in the Dry Areas (ICARDA); 2013.Search in Google Scholar
[19] Naumann C, Bassler R. Die chemische Untersuchung von Futtermitteln, Methodenbuch III. Ergänzungslieferung. Darmstadt (DE): VDLUFA-Verlag; 1988, p. 81.Search in Google Scholar
[20] Close W, Menke KH. Selected topics in animal nutrition. Feldafing (DE): Deutsche Stiftung für Internationale Entwicklung (DSE); 1986, p. 85.Search in Google Scholar
[21] Nelson DW, Sommers LE. Total carbon, organic carbon, and organic matter. In: Page AL, Miller RH, Keeney DR, editors. Methods of soil analysis. Part 2. 2nd edn. Madison (WI): American Society of Agronomy; 1996, p. 961–1010.10.2136/sssabookser5.3.c34Search in Google Scholar
[22] Cowan N, Bahtia A, Drewer J, Jain N, Singh R, Tomer R, et al. Experimental comparison of continuous and intermittent flooding of rice in relation to methane, nitrous oxide and ammonia emissions and the implications for nitrogen use efficiency and yield. Agric Ecosyst Env. 2021;319:107553.10.1016/j.agee.2021.107571Search in Google Scholar
[23] Bremner JM. Total nitrogen. In: Norman AG, editor. Methods of soil analysis. Madison (WI): American Society of Agronomy; 1965.10.2134/agronmonogr9.2.c32Search in Google Scholar
[24] Lang F, Kaupejohann M. Trace element release from forest floor can be monitored by ion exchange resin tubes. J Plant Nutr Soil Sci. 2004;167(2):177–83.10.1002/jpln.200321244Search in Google Scholar
[25] Predotova M, Bischoff WA, Buerkert A. Mineral nitrogen and phosphorus leaching in vegetable gardens of Niamey, Niger. J Plant Nutr Soil Sci. 2010;173(1):42–7. http://onlinelibrary.wiley.com/doi/10.1002/jpln.200900255/pdf.10.1002/jpln.200900255Search in Google Scholar
[26] Khai NM, Ha PQ, Öborn I. Nutrient flows in small-scale peri-urban vegetable farming systems in Southeast Asia - a case study in Hanoi. Agric Ecosyst Env. 2007;122(2):192–202.10.1016/j.agee.2007.01.003Search in Google Scholar
[27] Roy RN, Misra RV, Lesschen JP, Smaling EMA. Assessment of soil nutrient balance approaches and methodologies. FAO Fertilizer and Plant Nutrition Bulletin 14. Rome: FAO; 2003. http://www.fao.org/docrep/006/y5066e/y5066e00.htm.Search in Google Scholar
[28] Wang H-J, Huang B, Shi X-Z, Darilek JL, Yu D-S, Sun W-X, et al. Major nutrient balances in small-scale vegetable farming systems in peri-urban areas in China. Nutr Cycl Agroecosyst. 2007;81:203–18.10.1007/s10705-007-9157-8Search in Google Scholar
[29] Irmak S, Mohammed AT. Maize nitrogen uptake and use efficiency, partial factor productivity of nitrogen, and yield response to different nitrogen and water applications under three irrigation methods. Irrig Drain. 2023;73(1):1–384. 10.1002/ird.2868.Search in Google Scholar
[30] Chen BB, Guo L, Tang J, Li Y, Li C. Comprehensive impacts of different integrated rice-animal co-culture systems on rice yield, nitrogen fertilizer partial factor productivity and nitrogen losses: A global meta-analysis. Sci Total Env. 2024;915:169994. 10.1016/j.scitotenv.2024.169994.Search in Google Scholar PubMed
[31] He F, Chen Q, Jiang R, Chen X, Zhang F. Yield and nitrogen balance of greenhouse tomato with conventional and site-specific nitrogen management in Northern China. Nutr Cycl Agroecosyst. 2007;77:1–14.10.1007/s10705-006-6275-7Search in Google Scholar
[32] Chen Q, Zhang XS, Zhang HY, Christie P, Li XL. Evaluation of current fertilizer practice and soil fertility in vegetable production in the Beijing region. Nutr Cycl Agroecosyst. 2004;69:51–8.10.1023/B:FRES.0000025293.99199.ffSearch in Google Scholar
[33] Ju XT, Liu XJ, Zhang FS, Roelcke M. Nitrogen fertilization, soil nitrate accumulation, and policy recommendations. Ambio. 2004;33(6):300–5.10.1579/0044-7447-33.6.300Search in Google Scholar PubMed
[34] Pan B, Lam SK, Mosier A, Luo Y, Chen D. Ammonia volatilization from synthetic fertilizers and its mitigation strategies: A global synthesis. Agric Ecosyst Env. 2016;232:283–9.10.1016/j.agee.2016.08.019Search in Google Scholar
[35] Sutton MA, Howard CM, Brownlie WJ, Cordovil CMS. Nitrogen opportunities for agriculture, food & environment. UK Centre for Ecology & Hydrology; 2022. Task Force on Reactive Nitrogen, UNECE Convention on Long-range Transboundary Air Pollution. ISBN: 978-1-906698-78-2.Search in Google Scholar
[36] Sutton MA, Howard CM, Erisman JW, Billen G, Bleeker A, Grennfelt P, et al. The European nitrogen assessment: sources, effects and policy perspectives. Cambridge (UK): Cambridge University Press; 2011.10.1017/CBO9780511976988Search in Google Scholar
[37] Sutton MA, Oenema O, Erisman JW, Leip A, van Grinsven H, Winiwarter W. Too much of a good thing. Nature. 2011;472:159–61.10.1038/472159aSearch in Google Scholar PubMed
[38] Bai X, Zhang Z, Cui J, Liu Z, Chen Z, Zhou J. Strategies to mitigate nitrate leaching in vegetable production in China: a meta-analysis. Env Sci Pollut Res. 2020;27:18382–91.10.1007/s11356-020-08322-1Search in Google Scholar PubMed
[39] Prakasa Rao EVS, Puttanna K, Sooryanarayana KR, Biswas AK, Arunkumar JS. Assessment of nitrate threat to water quality in India. In: Abrol YP, editor. The Indian nitrogen assessment. Amsterdam: Elsevier; 2017. p. 323–33.10.1016/B978-0-12-811836-8.00021-5Search in Google Scholar
[40] Wei Q, Xu J, Liu Y, Wang D, Chen A, Qian W, et al. Nitrogen losses from soil as affected by water and fertilizer management under drip irrigation: Development, hotspots, and future perspectives. Agric Water Manag. 2024;296:108791. 10.1016/j.agwat.2024.108791.Search in Google Scholar
[41] Personne E, Tarady F, Genermont S, Decuq C, Gueudet JC, Mascher N, et al. Investigating sources and sinks for ammonia exchanges between the atmosphere and a wheat canopy following slurry application with trailing hose. Agric Meteorol. 2015;207:11–23.10.1016/j.agrformet.2015.03.002Search in Google Scholar
[42] Rochette P, MacDonald DJ, Angers DA, Chantigny MH, Gasser MO, Bertrand N. Banding of urea increased ammonia volatilization in a dry acidic soil. J Environ Qual. 2009;38(5):1383–90. https://acsess.onlinelibrary.wiley.com/doi/10.2134/jeq2008.0103.10.2134/jeq2008.0295Search in Google Scholar PubMed
[43] Stork PR, Jerie PH, Callinan APL. Subsurface drip irrigation in raised bed tomato production. 1. Nitrate and phosphate losses under current commercial practice. Aust J Soil Res. 2003;41:1283–304.10.1071/SR02145Search in Google Scholar
[44] Houben G, Tunnermeier T. Hydrogeology of the Kabul Basin, Part I: Geology, aquifer characteristics, climate and hydrography. Foreign Office of the Federal Republic of Germany; 2005. BGR record no: 10277/05.Search in Google Scholar
[45] Houben G, Tünnermeier T, Eqrar N. Hydrogeology of the Kabul basin (Afghanistan). Part II: Groundwater geochemistry. Hydrol J. 2009;17:935–48, http://www.unicef.org/infobycountry/afghanistan_statistics.html.10.1007/s10040-008-0375-1Search in Google Scholar
[46] Benard C, Gautier H, Bourgaud F, Grasselly D, Navez B, Caris-Veyrat C, et al. Effects of low nitrogen supply on tomato fruit yield and quality with special emphasis on sugars, acids, ascorbate, carotenoids, and phenolic compounds. J Agric Food Chem. 2009;57:4112–23. 10.1021/jf900056z.Search in Google Scholar
[47] Koestoer RH, Ligayanti T, Kartohardjono S, Susanto H. Down-streaming small-scale green ammonia to nitrogen-phosphorus fertilizer tablets for rural communities. Emerg Sci J. 2024 Apr;8(2):625–43. 10.28991/ESJ-2024-08-02-016.Search in Google Scholar
[48] Jaroensutasinee K, Jaroensutasinee M, Boonsanong P, Sparrow E. Mangosteen yield and fruit quality under regulated irrigation with sensors and IoT. J Hum Earth Future. 2024 Jun;5(2):205–15, www.HEFJournal.org.10.28991/HEF-2024-05-02-05Search in Google Scholar
[49] Wijitkosum S, Sriburi T, Krutnoi L. Taking advantage of disposal bamboo chopsticks to produce biochar for greenhouse crop cultivation. Emerg Sci J. 2024 Jun;8(3):917–32. 10.28991/ESJ-2024-08-03-07.Search in Google Scholar
[50] Wu W, Ma B. Integrated nutrient management (INM) for sustaining crop productivity and reducing environmental impact: A review. Sci Total Env. 2015;512–513:415–27. 10.1016/j.scitotenv.2015.01.045.Search in Google Scholar PubMed
[51] Pandian K, Mustaffa MRA, Paramasivam A, Prince AJ, Mahalingam G, Gajendiren M, et al. Synergistic conservation approaches for nurturing soil, food security, and human health towards sustainable development goals. J Hazard Mater Adv. 2024;16:100479. 10.1016/j.hazadv.2024.100479.Search in Google Scholar
© 2025 the author(s), published by De Gruyter
This work is licensed under the Creative Commons Attribution 4.0 International License.
Articles in the same Issue
- Research Articles
- Optimization of sustainable corn–cattle integration in Gorontalo Province using goal programming
- Competitiveness of Indonesia’s nutmeg in global market
- Toward sustainable bioproducts from lignocellulosic biomass: Influence of chemical pretreatments on liquefied walnut shells
- Efficacy of Betaproteobacteria-based insecticides for managing whitefly, Bemisia tabaci (Hemiptera: Aleyrodidae), on cucumber plants
- Assessment of nutrition status of pineapple plants during ratoon season using diagnosis and recommendation integrated system
- Nutritional value and consumer assessment of 12 avocado crosses between cvs. Hass × Pionero
- The lacked access to beef in the low-income region: An evidence from the eastern part of Indonesia
- Comparison of milk consumption habits across two European countries: Pilot study in Portugal and France
- Antioxidant responses of black glutinous rice to drought and salinity stresses at different growth stages
- Differential efficacy of salicylic acid-induced resistance against bacterial blight caused by Xanthomonas oryzae pv. oryzae in rice genotypes
- Yield and vegetation index of different maize varieties and nitrogen doses under normal irrigation
- Urbanization and forecast possibilities of land use changes by 2050: New evidence in Ho Chi Minh city, Vietnam
- Organizational-economic efficiency of raspberry farming – case study of Kosovo
- Application of nitrogen-fixing purple non-sulfur bacteria in improving nitrogen uptake, growth, and yield of rice grown on extremely saline soil under greenhouse conditions
- Digital motivation, knowledge, and skills: Pathways to adaptive millennial farmers
- Investigation of biological characteristics of fruit development and physiological disorders of Musang King durian (Durio zibethinus Murr.)
- Enhancing rice yield and farmer welfare: Overcoming barriers to IPB 3S rice adoption in Indonesia
- Simulation model to realize soybean self-sufficiency and food security in Indonesia: A system dynamic approach
- Gender, empowerment, and rural sustainable development: A case study of crab business integration
- Metagenomic and metabolomic analyses of bacterial communities in short mackerel (Rastrelliger brachysoma) under storage conditions and inoculation of the histamine-producing bacterium
- Fostering women’s engagement in good agricultural practices within oil palm smallholdings: Evaluating the role of partnerships
- Increasing nitrogen use efficiency by reducing ammonia and nitrate losses from tomato production in Kabul, Afghanistan
- Physiological activities and yield of yacon potato are affected by soil water availability
- Vulnerability context due to COVID-19 and El Nino: Case study of poultry farming in South Sulawesi, Indonesia
- Wheat freshness recognition leveraging Gramian angular field and attention-augmented resnet
- Suggestions for promoting SOC storage within the carbon farming framework: Analyzing the INFOSOLO database
- Optimization of hot foam applications for thermal weed control in perennial crops and open-field vegetables
- Toxicity evaluation of metsulfuron-methyl, nicosulfuron, and methoxyfenozide as pesticides in Indonesia
- Fermentation parameters and nutritional value of silages from fodder mallow (Malva verticillata L.), white sweet clover (Melilotus albus Medik.), and their mixtures
- Five models and ten predictors for energy costs on farms in the European Union
- Effect of silvopastoral systems with integrated forest species from the Peruvian tropics on the soil chemical properties
- Transforming food systems in Semarang City, Indonesia: A short food supply chain model
- Understanding farmers’ behavior toward risk management practices and financial access: Evidence from chili farms in West Java, Indonesia
- Optimization of mixed botanical insecticides from Azadirachta indica and Calophyllum soulattri against Spodoptera frugiperda using response surface methodology
- Mapping socio-economic vulnerability and conflict in oil palm cultivation: A case study from West Papua, Indonesia
- Exploring rice consumption patterns and carbohydrate source diversification among the Indonesian community in Hungary
- Determinants of rice consumer lexicographic preferences in South Sulawesi Province, Indonesia
- Effect on growth and meat quality of weaned piglets and finishing pigs when hops (Humulus lupulus) are added to their rations
- Healthy motivations for food consumption in 16 countries
- The agriculture specialization through the lens of PESTLE analysis
- Combined application of chitosan-boron and chitosan-silicon nano-fertilizers with soybean protein hydrolysate to enhance rice growth and yield
- Stability and adaptability analyses to identify suitable high-yielding maize hybrids using PBSTAT-GE
- Phosphate-solubilizing bacteria-mediated rock phosphate utilization with poultry manure enhances soil nutrient dynamics and maize growth in semi-arid soil
- Factors impacting on purchasing decision of organic food in developing countries: A systematic review
- Influence of flowering plants in maize crop on the interaction network of Tetragonula laeviceps colonies
- Bacillus subtilis 34 and water-retaining polymer reduce Meloidogyne javanica damage in tomato plants under water stress
- Vachellia tortilis leaf meal improves antioxidant activity and colour stability of broiler meat
- Evaluating the competitiveness of leading coffee-producing nations: A comparative advantage analysis across coffee product categories
- Application of Lactiplantibacillus plantarum LP5 in vacuum-packaged cooked ham as a bioprotective culture
- Evaluation of tomato hybrid lines adapted to lowland
- South African commercial livestock farmers’ adaptation and coping strategies for agricultural drought
- Spatial analysis of desertification-sensitive areas in arid conditions based on modified MEDALUS approach and geospatial techniques
- Meta-analysis of the effect garlic (Allium sativum) on productive performance, egg quality, and lipid profiles in laying quails
- Optimizing carrageenan–citric acid synergy in mango gummies using response surface methodology
- The strategic role of agricultural vocational training in sustainable local food systems
- Agricultural planning grounded in regional rainfall patterns in the Colombian Orinoquia: An essential step for advancing climate-adapted and sustainable agriculture
- Perspectives of master’s graduates on organic agriculture: A Portuguese case study
- Developing a behavioral model to predict eco-friendly packaging use among millennials
- Government support during COVID-19 for vulnerable households in Central Vietnam
- Citric acid–modified coconut shell biochar mitigates saline–alkaline stress in Solanum lycopersicum L. by modulating enzyme activity in the plant and soil
- Herbal extracts: For green control of citrus Huanglongbing
- Research on the impact of insurance policies on the welfare effects of pork producers and consumers: Evidence from China
- Investigating the susceptibility and resistance barley (Hordeum vulgare L.) cultivars against the Russian wheat aphid (Diuraphis noxia)
- Characterization of promising enterobacterial strains for silver nanoparticle synthesis and enhancement of product yields under optimal conditions
- Testing thawed rumen fluid to assess in vitro degradability and its link to phytochemical and fibre contents in selected herbs and spices
- Protein and iron enrichment on functional chicken sausage using plant-based natural resources
- Fruit and vegetable intake among Nigerian University students: patterns, preferences, and influencing factors
- Bioprospecting a plant growth-promoting and biocontrol bacterium isolated from wheat (Triticum turgidum subsp. durum) in the Yaqui Valley, Mexico: Paenibacillus sp. strain TSM33
- Quantifying urban expansion and agricultural land conversion using spatial indices: evidence from the Red River Delta, Vietnam
- LEADER approach and sustainability overview in European countries
- Influence of visible light wavelengths on bioactive compounds and GABA contents in barley sprouts
- Assessing Albania’s readiness for the European Union-aligned organic agriculture expansion: a mixed-methods SWOT analysis integrating policy, market, and farmer perspectives
- Genetically modified foods’ questionable contribution to food security: exploring South African consumers’ knowledge and familiarity
- The role of global actors in the sustainability of upstream–downstream integration in the silk agribusiness
- Multidimensional sustainability assessment of smallholder dairy cattle farming systems post-foot and mouth disease outbreak in East Java, Indonesia: a Rapdairy approach
- Enhancing azoxystrobin efficacy against Pythium aphanidermatum rot using agricultural adjuvants
- Review Articles
- Reference dietary patterns in Portugal: Mediterranean diet vs Atlantic diet
- Evaluating the nutritional, therapeutic, and economic potential of Tetragonia decumbens Mill.: A promising wild leafy vegetable for bio-saline agriculture in South Africa
- A review on apple cultivation in Morocco: Current situation and future prospects
- Quercus acorns as a component of human dietary patterns
- CRISPR/Cas-based detection systems – emerging tools for plant pathology
- Short Communications
- An analysis of consumer behavior regarding green product purchases in Semarang, Indonesia: The use of SEM-PLS and the AIDA model
- Effect of NaOH concentration on production of Na-CMC derived from pineapple waste collected from local society