Evaluation of tomato hybrid lines adapted to lowland
-
Muh. Alfan Ikhlasul Amal
 and
Muhammad Fuad Anshori
and
Muhammad Fuad Anshori

Abstract
Improving tomato fruit characteristics is a crucial step to address the decline in production, which is primarily caused by biotic stress and the limited adaptability of existing varieties in lowland areas. This improvement can be achieved through plant breeding programs involving crossbreeding techniques. The primary objective of developing superior varieties is to produce tomatoes with high fruit quality and excellent productivity. The selection criteria were further refined using both principal component analysis (PCA) and path analysis. PCA was employed to identify the primary traits contributing to variability, while path analysis helped establish the strength and direction of relationships between key traits and supporting characteristics. The most significant direct impact will be incorporated into the index value to determine the genotype with the best overall performance. The findings identified 12 F1 tomato breeding lines deemed suitable for progression to the next generation, offering significant potential for enhancing tomato production. This study underscores the effectiveness of targeted breeding strategies. It contributes to developing more sustainable and efficient approaches to tomato cultivation, paving the way for improved productivity and quality in future varieties.
1 Introduction
Tomato (Solanum lycopersicum) is one of the important horticultural crops in several countries in the world because it is a commodity that can provide essential nutrients in the form of phosphorus, iron, and vitamin A. In addition, tomatoes also contain a number of essential compounds, such as flavonoids and lycopene [1]. Tomatoes are also useful as a vegetable and are widely used by people to treat several diseases, such as anti-inflammatory, hypertension, coronary heart disease, and anti-cancer [2]. Tomatoes have a unique taste with sweet and sour flavors that can be consumed directly. They play a crucial role as an industrial raw material, making them popular because of their extraordinary benefits [3]. However, the growth of tomato production is considered slow. Tomato production in Indonesia in 2022 was 1,168,744 tons and decreased in 2023 to 1,143,788 tons. The decrease in production was caused by several problems, such as pest and disease attacks and varieties less adaptive to the environment [4]. Therefore, developing the productivity and quality of tomatoes in line with the population rate is one of the keys to stabilizing the rate of production and demand.
The common problem encountered in tomato cultivation in Indonesia is the lack of superior varieties with high yields, good fruit quality, and resistance to pests and diseases. This decline is partly due to biotic stress, such as pests and diseases, as well as the limited adaptability of existing tomato varieties to local agroecological conditions. This effort not only addresses local agricultural challenges but also contributes to breeding programs in tropical and subtropical regions where similar conditions prevail [5,6,7]. This highlights the pressing need for superior varieties that combine high yield potential, good fruit quality, and resistance to environmental stresses. In contrast to prior research focusing primarily on conventional varieties, this study specifically evaluates F1 hybrid tomato lines, which have heterosis advantages offering better yield and disease resistance potential [8,9].
One way to develop tomato varieties is by improving the varieties [10]. Variety improvement is an important step in efforts to increase the declining tomato production. This can be done through a plant breeding program involving crossbreeding techniques. In the process of assembling superior varieties, the main goal is to create tomato varieties that not only have high quality and good productivity but also meet consumer needs and preferences. Thus, the resulting varieties are expected to be well accepted by the community to benefit farmers and the agricultural industry as a whole [11,12]. Hybrids result from the first-generation (F1) crosses from a pair or more pure lines of parents with superior characteristics. The heterozygous genetic composition of hybrid varieties causes these varieties to have more advantages compared to non-hybrid varieties, which generally have homozygous genetic compositions [13]. A plant breeding program’s success in producing superior varieties is based on the diversity of plant populations.
The formation of tomato diversity from crossbreeding is greatly influenced by the method of crossbreeding. In general, there are several cross-breeding methods such as a single cross, double cross, three-way cross, multiple crosses, backcross, and diallel mating [14,15,16]. Crossing a pair of inbred lines will produce a single-cross hybrid, and crossing two unrelated single-cross hybrids can create a double-cross hybrid variety. Crossing is done to improve yield by selecting the offspring from the cross [17]. Crossbreeding will improve tomato genetics to improve yield through the selection of crossbred offspring. Assembling superior varieties is directed to increase yield potential and quality, so that superior varieties have high competitive power. In addition, assembling new varieties is still important to increase genetic variation that can be used as a plant breeding material [11].
Genetic diversity and heritability are absolute requirements for the success of a plant breeding program. Genetic diversity can increase the possibility of obtaining better genotypes through selection. Character diversity and genotype diversity are helpful in determining the pattern of genotype grouping in a particular population based on observed characters. They can be used as a basis for selection activities. Characters with high heritability and genetic values can be used as selection criteria in the early generations. The characteristics observed include measuring variations in observable traits (phenotypic diversity). Genetic correlation between one character and another can be beneficial if the character covers one that is closely related to the results [17]. Testing must first determine the characteristics of plants, yield, and quality of cross-bred lines. This must be carried out under stable environmental conditions, i.e., under conditions of the place where the variety will be cultivated [18]. Diversity analysis can be done with various types of markers; one of the marker types is the morphology of the plant; it is the indicator that the character is genetically controlled based on heritability values [19]. This study aimed to produce tomato strains that have good fruit quality and high productivity in the lowlands.
2 Materials and methods
The study was carried out in the Experimental Farm of the Faculty of Agriculture, Hasanuddin University, Tamalanrea District, Makassar City, South Sulawesi, from June to September 2024. The location has an altitude of 22.4 m above sea level with an average minimum and maximum temperature of 24 and 32°C.
2.1 Experimental design
This study used determinate tomatoes by crossing three types of tomato fruit types, consisting of Karina (Grape), Mawar (Beffstreak), and Chung (Cherry) varieties. This first trial evaluated the diversity of tomato F1 hybrids using a randomized complete block design with three replications. Sixteen F1 hybrid genotypes consisting of G1 (KM30.5.2.6 × MC74.12.6.3), G2 (MC12.3.1.12 × MC74.12.5.6), G3 (MC10.4.5.7 × MC10.7.2.9), G4 (MC8.3.2.6 × KM30.5.2.6), G5 (KM30.5.2.6 × MC10.4.6.3), G6 (MC74.12.8 × MC10.10.1), G7 (MC27.12.6 × KM23.3.3), G8 (MC74.12.8 × KM23.3.3), G9 (KM5.3.6.6 × MC74.12.8.9), G10 (MC12.3.1.12 × MC10.4.5.5), G11 (MC10.4.6.3 × MC10.4.5.5), G12 (MC10.4.5.5 × MC29.4.5.10), G13 (MC10.4.5.7 × MC12.3.5.11), G14 (MC10.4.5.7 × MC74.12.6.3), G15 (MC10.7.2.9 × KM69.6.2.1), and G16 (KM30.5.2.6 × MC8.3.2.6), and three check varieties (Mawar, Natavi, Servo) were used to focus on productivity and other key traits (Figure 1). This setup enabled comprehensive comparisons across genotypes and varieties.
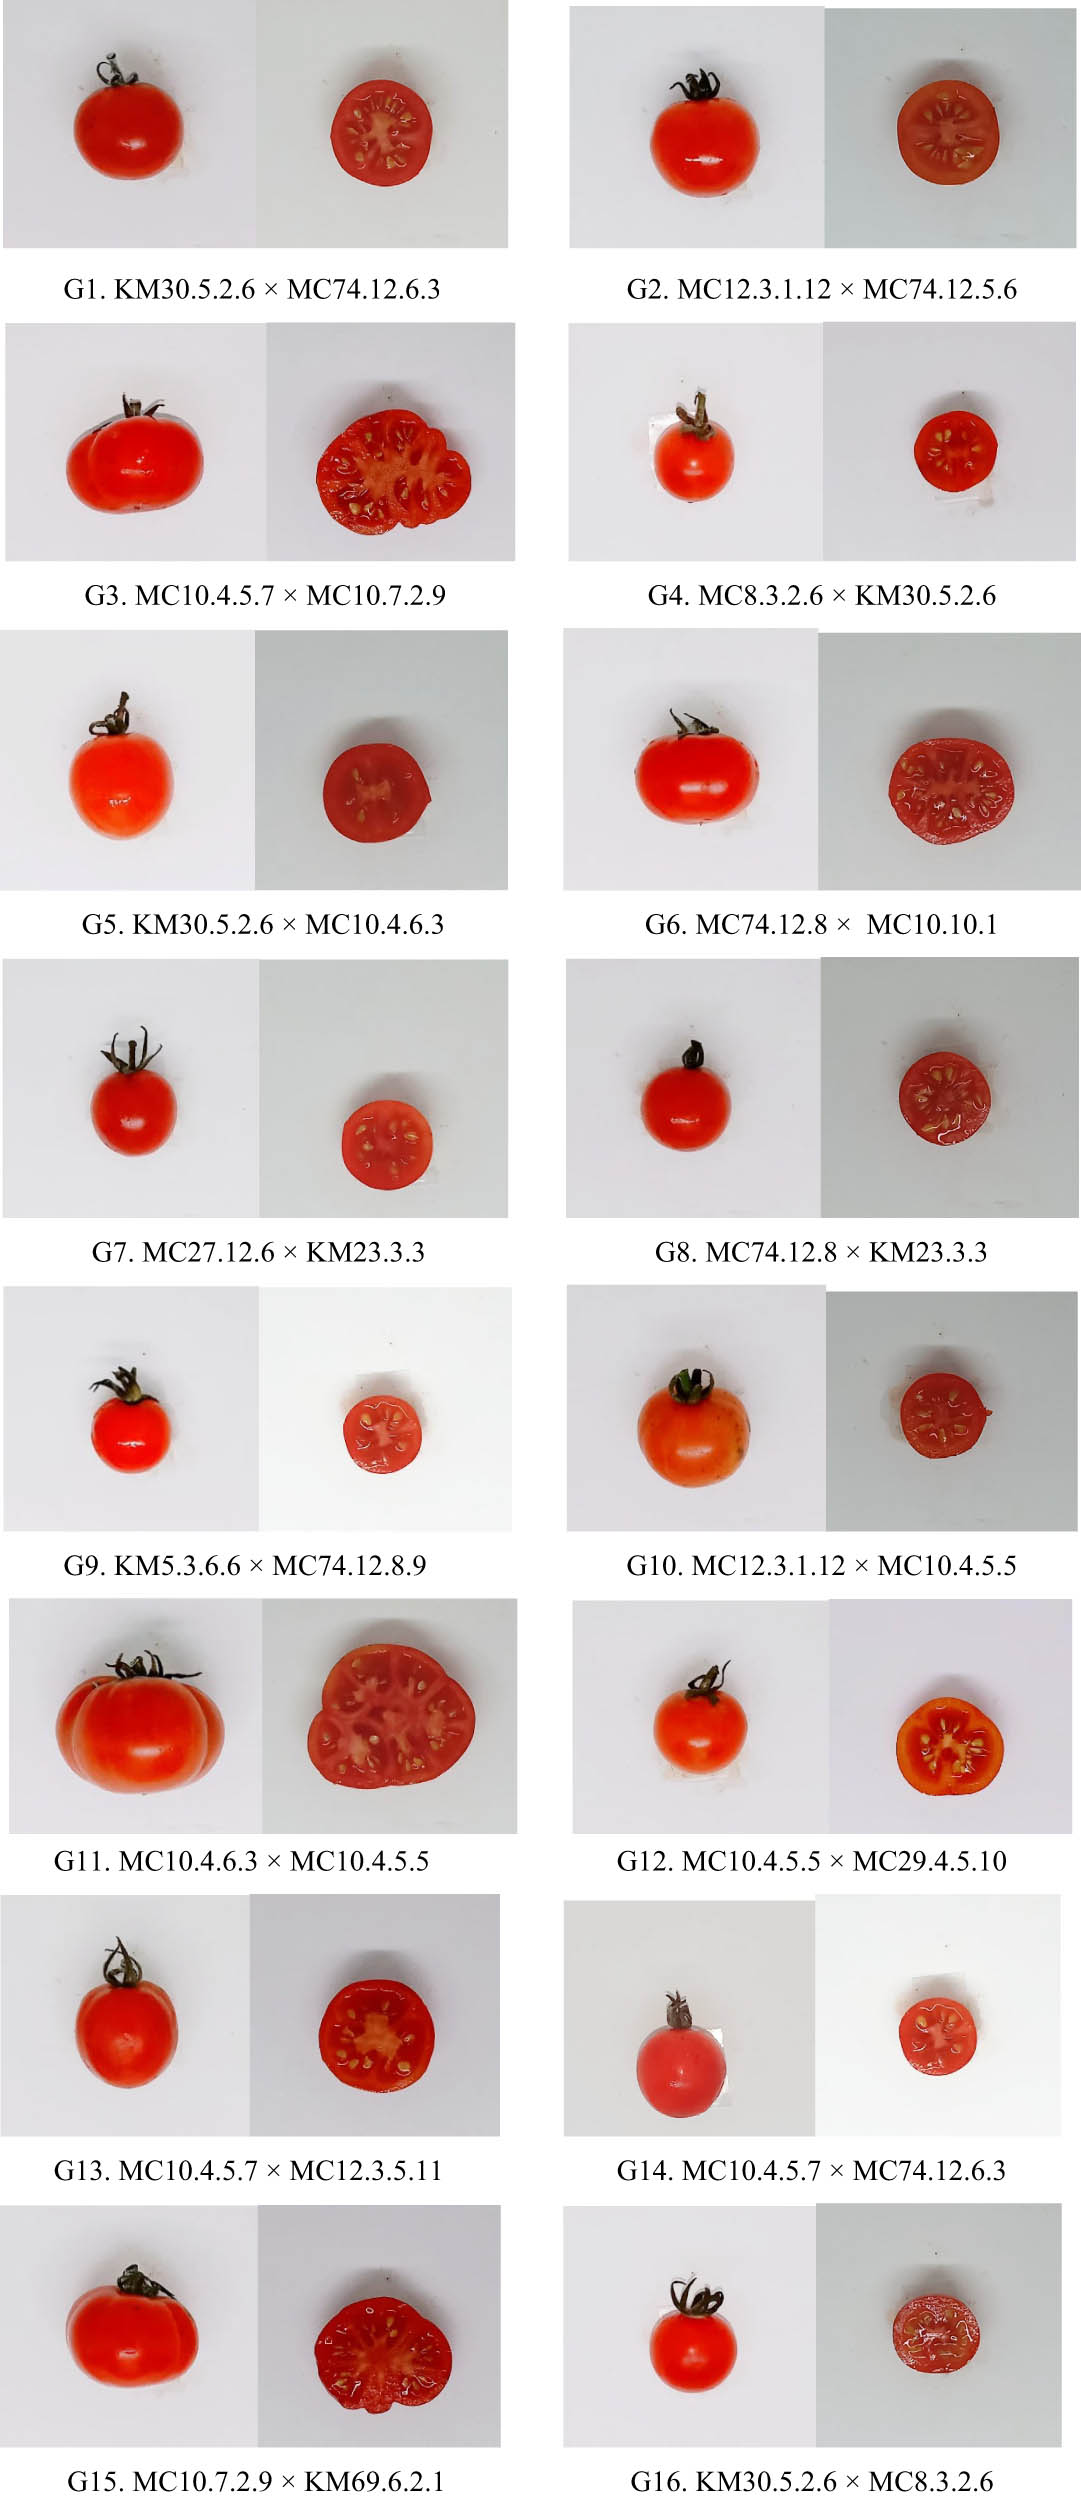
Fruit appearance of all genotypes.
2.2 Research procedure
Plant maintenance consists of several components: watering, replanting, fertilizing, pruning, weeding, and managing pest and disease control. Watering was done twice daily, in the morning and evening, using either a watering can or sprinklers. For tomato plants that exhibited abnormal growth, wilting, or signs of pest or disease damage, replanting was conducted. This process involved replacing the affected plants with seedlings of the same age and genetic code precisely 1 week after planting (WAP) and typically in the afternoon to prevent wilting. Fertilization began at one WAP and continued weekly, using an NPK Mutiara fertilizer solution (10 g/L) at a rate of 250 mL per plant. For subsequent applications, KNO3 was added at a concentration of 5 g/L. Additionally, NPK Mutiara was applied as a root zone solution during the plant’s reproductive stage, and Gandasil B was used during the generative phase.
Pruning was performed at least once a week to remove small or early shoots on the lower stem and other branches, ensuring the plant’s growth was directed toward the main stem. Weeding was also done to eliminate unwanted plants that could hinder tomato growth. Weeds within the planting holes were removed by hand, while those outside the planting beds were cleared using a hoe.
Pest and disease control was conducted weekly, using a mixture of the insecticide Curacron 500 E and the fungicide Antracol 70 WP C at concentrations of 2 cc/L and 2 g/L of water, respectively. Dithane M-45 WP was used at a concentration of 2 g/L of water as a substitute for Antracol 70 WP for more effective results. Pesticides were applied by spraying them onto the plant surfaces while harvesting twice weekly. Fruits were considered ready for harvest when they reached a reddish-yellow color, meeting the desired maturity criteria.
2.3 Observations
2.3.1 Observation of quantitative parameter evaluation of the F1 hybrid
The quantitative characters observed were based on [20] the following:
Plant height (cm) is measured from the ground level to the growing point of the plant at the time of harvest.
Dichotomous height (cm) was observed from the base of the root to the first branching of the plant.
Stem diameter (mm) was observed at the upper base of the root.
Day to flower (DAP), which is calculated from the blossoming of flowers from the day after planting under flowering conditions, had at least one open flower (50%).
Day to harvest (DAP) was observed when the tomatoes were reddish in color; harvesting was done four times during the harvesting period.
Number of branches (branch) is the number of branches observed from the average of the three flowering bunches in each bunch.
Number of flowers per bunch (flower) is the number of flowers observed from the average of three flowering bunches in each bunch.
Number of fruits per bunch (fruit) is the number of fruits per bunch formed and calculated as the average of three bunches of fruits observed from each sample.
Number of inflorescences (fruit) is the number of bunches observed from the average of the three flowering bunches in each cluster.
Weight of fruit sample per plant (g) is the weight of 10 fruits observed in a plant.
Total fruit weight per plant (g) is the total of fruit weights observed in a plant throughout during life cycle.
Fruit thickness (mm) is measured at the largest part of the fruit using a caliper.
Fruit diameter (mm) is measured at the longest part of the fruit using a caliper.
Fruit weight (g) is measured at the largest part of the fruit using an analytical balance.
Number of cavities (cavity) is counted in the cavity of the fruit after splitting it into two parts.
Total soluble solids (Brix) (%), measured scale determined the refractive index as total soluble solids.
Number of seeds per fruit (seed) is the number of seeds obtained from the extracted sample.
Yield (ton/ha) is calculated by the fruit’s weight in the genotype sample.
2.4 Data analysis
The field evaluation data were analyzed using analysis of variance (ANOVA), which provided the foundation for estimating the heritability of various plant traits. The selection criteria were systematically developed through correlation analysis. Correlation analysis is calculated using the Pearson Product Moment correlation technique equation using the following formula:
where r is the Pearson’s correlation coefficient, xi is the the ith observation of variable x, yi is the ith observation of variable y, x̄ is the mean of variable x, ȳ is the mean of variable y, and Σ is the summation symbol.
Cross-sectional analysis was calculated based on the simultaneous equation using the following formula [21]:
Based on this equation, the value of C (direct effect) can be calculated using the following formula:
R
x
is the correlation matrix between independent variables,
Initially, the traits identified as significant were integrated into a selection index based on the yield values derived from the principal component analysis (PCA). Subsequently, the yield values were adjusted using the proportionate contributions of the PCA components and correlation analysis, as referenced in previous studies [22,23,24]. The selection criteria were further refined using both PCA and path analysis. PCA was employed to identify the primary traits contributing to variability [25], while path analysis helped establish the strength and direction of relationships between key traits and supporting characteristics [26]. Combining these methods, a comprehensive selection index was developed, highlighting the traits most strongly associated with yield and other desirable attributes, enabling systematic and informed selection decisions [27]:
where Sn is the standardization, xi is the value of genotype in characters, x̄ is the average value of all genotypes, and SD is the standard deviation.
3 Results
3.1 Average standard deviation
The results of the standard deviation analysis in Tables 1 and 2 show the variation of plant genotypes based on growth parameters and fruit characteristics. Regarding growth, the highest plant height was found in genotype G1 (363.67 cm), while the lowest was T3 (312.85 cm). The number of days until harvest ranged from 171 to 210 days, with differences in the number of branches and fruits per bunch in each genotype. Meanwhile, based on the fruit characteristics, fruit number and weight, fruit thickness and diameter, sweetness level (Brix), and number of seeds varied among genotypes. The genotype with the highest yield was G15 (66.02), while the lowest was G14 (25.61). These data can be used to evaluate and determine the best genotypes based on the desired growth and yield characteristics.
Average and standard deviation of several growth parameters from lowland tomato hybrid
| Genotype | PH | DHe | SD | DF | DH | NB | NFB | NFpB | NI |
|---|---|---|---|---|---|---|---|---|---|
| G1 | 363.67 ± 9.19 | 118.67 ± 5.11 | 32.84 ± 1.74 | 105 ± 2.65 | 171 ± 0 | 17.75 ± 0.56 | 13.54 ± 1.37 | 7.76 ± 0.40 | 52.08 ± 1.75 |
| G2 | 365.27 ± 4.43 | 108.2 ± 6.21 | 30.19 ± 0.66 | 106 ± 1.15 | 189 ± 5.20 | 18.4 ± 1.01 | 16.54 ± 0.98 | 7.39 ± 0.20 | 60.14 ± 2.00 |
| G3 | 359.00 ± 2.73 | 123.6 ± 2.88 | 32.12 ± 1.64 | 104 ± 2.52 | 198 ± 0 | 20 ± 1.01 | 13.46 ± 0.55 | 8.05 ± 0.48 | 44.17 ± 1.42 |
| G4 | 342.08 ± 2.67 | 127 ± 6.10 | 27.7 ± 0.32 | 103 ± 2.08 | 171 ± 0 | 11.5 ± 0.76 | 15.74 ± 0.67 | 10.99 ± 0.03 | 40.14 ± 3.12 |
| G5 | 388.16 ± 5.39 | 121.92 ± 2.86 | 23.65 ± 0.46 | 102 ± 2 | 171 ± 0 | 18.34 ± 0.86 | 20 ± 0.2 | 10.62 ± 0.64 | 36.95 ± 0.33 |
| G6 | 333.83 ± 6.54 | 126.07 ± 2.92 | 24.13 ± 0.59 | 99 ± 1 | 171 ± 0 | 15.93 ± 0.87 | 15.40 ± 0.52 | 10.02 ± 0.26 | 41.67 ± 1.39 |
| G7 | 345.83 ± 2.81 | 102.17 ± 8.48 | 30 ± 1.26 | 99 ± 1 | 180 ± 5.20 | 20.01 ± 0.33 | 19.27 ± 0.19 | 9.91 ± 0.09 | 56.00 ± 0.50 |
| G8 | 314.84 ± 10.72 | 121.25 ± 7.97 | 32.75 ± 2.13 | 99 ± 1 | 171 ± 0 | 16.63 ± 0.39 | 18.07 ± 0.27 | 17.25 ± 0.15 | 48.015 ± 0.33 |
| G9 | 331.67 ± 1.64 | 123.25 ± 4.02 | 27.38 ± 0.59 | 99 ± 1 | 180 ± 5.20 | 16.17 ± 1.13 | 19.07 ± 0.66 | 9.87 ± 0.39 | 51.74 ± 1.26 |
| G10 | 363.50 ± 13.57 | 128.08 ± 3.21 | 29.67 ± 2.02 | 104 ± 3.06 | 171 ± 0 | 19.08 ± 1.05 | 16.87 ± 0.51 | 7.93 ± 0.95 | 38.33 ± 1.43 |
| G11 | 346.24 ± 3.46 | 108.54 ± 3.45 | 28.27 ± 0.71 | 106 ± 2.89 | 198 ± 0 | 17.76 ± 1.40 | 15.93 ± 0.47 | 4.20 ± 0.08 | 44.09 ± 2.60 |
| G12 | 291.75 ± 12.97 | 116 ± 6.66 | 30.56 ± 0.59 | 108 ± 3.61 | 180 ± 5.20 | 17.67 ± 0.76 | 13.87 ± 0.17 | 5.42 ± 0.44 | 47.91 ± 1.57 |
| G13 | 338.7 ± 5.61 | 126.77 ± 3.77 | 26.32 ± 1.30 | 107 ± 2.52 | 209 ± 6.35 | 14.12 ± 0.53 | 15.4 ± 1.27 | 6.69 ± 0.07 | 46.11 ± 6.52 |
| G14 | 345.25 ± 12.90 | 125.67 ± 5.83 | 28.79 ± 0.34 | 107 ± 3.51 | 198 ± 0 | 13 ± 0.34 | 13.8 ± 0.84 | 3.75 ± 0.28 | 44.17 ± 1.70 |
| G15 | 354.83 ± 14.56 | 121.48 ± 2.61 | 31.59 ± 1.11 | 110 ± 4.04 | 189 ± 5.20 | 19.42 ± 0.65 | 11.40 ± 0.29 | 10.8 ± 0.17 | 35.02 ± 1.16 |
| G16 | 361 ± 8.97 | 123.34 ± 2.69 | 31.07 ± 2.27 | 107 ± 3.21 | 180 ± 5.20 | 15.83 ± 0.77 | 14.13 ± 0.79 | 14.67 ± 0.43 | 38.39 ± 0.87 |
| T1 | 329.64 ± 9.19 | 92.84 ± 6.26 | 27.62 ± 0.78 | 105 ± 3 | 210 ± 3.46 | 16.10 ± 0.62 | 10.94 ± 0.50 | 5.6 ± 0.13 | 24.57 ± 2.99 |
| T2 | 239.6 ± 6.18 | 126.42 ± 5.05 | 22.7 ± 0.64 | 104 ± 1.15 | 189 ± 5.20 | 7.13 ± 0.40 | 15.2 ± 1.10 | 4.60 ± 0.12 | 17.08 ± 1.23 |
| T3 | 312.85 ± 9.35 | 131.5 ± 1.01 | 27.55 ± 1.44 | 107 ± 3.21 | 195 ± 0 | 7.65 ± 0.40 | 14.46 ± 1.04 | 4.61 ± 0.17 | 25.00 ± 1.28 |
Note: PH: plant height (cm); DHe: dichotomous height (cm); SD: steam diameter (mm); DF: day to flower (DAP); DH: day to harvest (DAP); NB: number of branches (branch); NFB: number of flowers per bunch (flower); NFpB: number of fruits per bunch (fruit); NI: number of inflorescences (fruit).
Continued average and standard deviation of growth parameters of hybrid lowland tomatoes
| Genotype | WFSP | TFWP | FT | FD | NFC | FW | Brix | NSF | Yield |
|---|---|---|---|---|---|---|---|---|---|
| G1 | 134.08 ± 6.02 | 804.5 ± 36.10 | 74.28 ± 2.05 | 75.54 ± 2.07 | 10.5 ± 0.33 | 31.45 ± 0.47 | 9.95 ± 0.73 | 122.67 ± 3.79 | 56.30 ± 2.93 |
| G2 | 148.2 ± 6.77 | 829 ± 6.51 | 68.9 ± 0.91 | 72.31 ± 0.93 | 10.53 ± 0.43 | 26.42 ± 1.13 | 10.13 ± 0.13 | 105.57 ± 6.81 | 48.59 ± 1.75 |
| G3 | 117.17 ± 3.29 | 703 ± 1.76 | 76.67 ± 6.12 | 83.99 ± 7.45 | 19.56 ± 0.20 | 33.59 ± 1.34 | 8.767 ± 0.32 | 186 ± 2.65 | 52.35 ± 2.17 |
| G4 | 147.00 ± 1.40 | 862 ± 10.69 | 61.74 ± 0.98 | 63.62 ± 1.11 | 8.52 ± 0.17 | 18.75 ± 0.50 | 10.07 ± 0.49 | 115.58 ± 7.20 | 35.97 ± 1.34 |
| G5 | 131.17 ± 8.95 | 817 ± 9.29 | 63.45 ± 1.50 | 66.56 ± 0.34 | 8.18 ± 0.15 | 24.189 ± 0.86 | 8.77 ± 0.23 | 127.17 ± 3.40 | 43.93 ± 1.74 |
| G6 | 139.67 ± 7.71 | 838 ± 46.23 | 67.82 ± 2.57 | 72.62 ± 3.30 | 13.33 ± 0.59 | 27.95 ± 0.91 | 9.83 ± 0.47 | 150.5 ± 6.67 | 52.60 ± 4.63 |
| G7 | 185.00 ± 3.22 | 1,110 ± 19.31 | 55.17 ± 5.21 | 56.64 ± 5.24 | 7.00 ± 0.34 | 18.75 ± 0.59 | 7.5 ± 0.26 | 114.67 ± 1.29 | 46.39 ± 2.23 |
| G8 | 276.17 ± 4.17 | 1,677 ± 16.52 | 51 ± 1.84 | 52.64 ± 1.79 | 9.67 ± 0.58 | 14.00 ± 0.64 | 10.2 ± 0.40 | 97.65 ± 6.75 | 52.12 ± 2.18 |
| G9 | 169.34 ± 2.31 | 992 ± 8.14 | 58.7 ± 1.92 | 60.08 ± 1.84 | 10 ± 0.88 | 16.78 ± 0.66 | 10.63 ± 0.35 | 102.67 ± 3.29 | 36.96 ± 1.35 |
| G10 | 99.00 ± 8.69 | 564 ± 14 | 75 ± 2.56 | 78.77 ± 3.22 | 12.83 ± 0.69 | 34.66 ± 0.81 | 12.7 ± 0.58 | 179 ± 4.42 | 43.37 ± 1.13 |
| G11 | 61.57 ± 3.44 | 369.4 ± 20.64 | 64.59 ± 1.77 | 67.47 ± 1.99 | 12.27 ± 0.50 | 22.09 ± 0.36 | 10.93 ± 0.73 | 77.2 ± 2.53 | 18.06 ± 0.78 |
| G12 | 85.42 ± 4.56 | 512.5 ± 27.39 | 75.66 ± 3.90 | 78.63 ± 3.88 | 13.33 ± 0.51 | 26.12 ± 0.92 | 10.78 ± 0.66 | 153.22 ± 9.53 | 29.87 ± 2.12 |
| G13 | 102.17 ± 13.58 | 613 ± 14.01 | 53.96 ± 4.03 | 55.52 ± 4.21 | 8.53 ± 0.73 | 18.86 ± 0.57 | 11.47 ± 0.24 | 165.83 ± 4.84 | 25.61 ± 0.46 |
| G14 | 54.92 ± 3.89 | 339 ± 8.54 | 60.93 ± 1.12 | 62.6 ± 0.98 | 7.25 ± 0.52 | 19.23 ± 0.68 | 9.72 ± 0.10 | 183.92 ± 1.72 | 14.43 ± 0.36 |
| G15 | 126.08 ± 4.63 | 756 ± 8.19 | 78.03 ± 0.49 | 87.01 ± 0.64 | 14.25 ± 0.04 | 39.31 ± 0.76 | 9.03 ± 0.48 | 216.25 ± 6.00 | 66.02 ± 1.39 |
| G16 | 187.34 ± 4.76 | 1,123 ± 10.69 | 62.23 ± 0.54 | 64.8 ± 0.30 | 10.33 ± 0.19 | 17.83 ± 1.25 | 10.67 ± 0.34 | 130 ± 6.12 | 44.57 ± 3.32 |
| T1 | 46.67 ± 6.87 | 280 ± 14.74 | 79.60 ± 6.53 | 82.45 ± 7.59 | 18.16 ± 0.46 | 48.15 ± 0.26 | 12.38 ± 0.21 | 233.76 ± 8.90 | 29.94 ± 1.52 |
| T2 | 26.17 ± 1.97 | 157 ± 11.84 | 75.8 ± 0.60 | 80.67 ± 0.42 | 7.46 ± 0.17 | 54.71 ± 0.86 | 8.27 ± 0.80 | 120.32 ± 4.33 | 19.03 ± 1.34 |
| T3 | 38.50 ± 2.50 | 231 ± 6.76 | 87.02 ± 1.70 | 90.57 ± 0.93 | 6.7 ± 0.23 | 65.97 ± 1.03 | 12.84 ± 0.73 | 174.35 ± 4.56 | 33.96 ± 1.51 |
Note: WFSP: weight of fruit sample per plant (10 fruits) (g); TFWP: total fruit weight per plant (g); FT: fruit thickness (mm); FD: fruit diameter (mm); FW: fruit weight (g); NFC: number of fruit cavities (cativy); NSF: number of seeds per fruit (seed).
3.2 ANOVA
The ANOVA results (Table 3) indicate that the variance attributed to lines had a significant effect on multiple traits, including the plant height, dichotomous height, stem diameter, days to flower, days to harvest, number of branches, number of flowers per bunch, number of fruits per bunch, total fruit weight per plant, fruit thickness, fruit diameter, fruit weight, number of fruit cavities, Brix, number of seeds per fruit, and yield. Genotype variance demonstrated highly significant effects (**) on several traits, including the plant height (354.39), stem diameter (2.98), days to harvest (57.96), number of branches (4.72), number of flowers per bunch (2.06), number of fruits per bunch (4.29), number of inflorescences (39.62), number of fruits per plant (1264.61), the total number of fruits (45638.96), fruit thickness (32.82), fruit diameter (42.27), number of fruit cavities (65.76), fruit weight (4.37), Brix (0.70), number of seeds per fruit (598.56), and yield (89.24). The only trait that significantly affected genotype variance (*) was days to flower (3.73). Additionally, the coefficient of variation (CV) showed that the character with the highest variability was the number of fruits per plant (16.29%). In comparison, the lowest variability was observed for days to flower (3.98%). These findings highlight the genetic contributions to these traits and provide a foundation for evaluating and selecting lines with desirable attributes in breeding programs.
ANOVA and genetic parameters of the observed characters
| Parameter | MSG | VG | VP | CV | H (%) |
|---|---|---|---|---|---|
| PH | 354.39** | 100.12 | 118.13 | 6.52 | 84.75 |
| DHi | 33.08 | 2.36 | 11.03 | 12.79 | 21.41 |
| SD | 2.98** | 0.73 | 0.99 | 9.35 | 73.16 |
| DF | 3.73* | 0.61 | 1.24 | 3.98 | 48.85 |
| DH | 57.96** | 15.39 | 19.32 | 5.56 | 79.67 |
| NB | 4.72** | 1.42 | 1.57 | 12.88 | 90.10 |
| NFB | 2.06** | 0.52 | 0.69 | 13.62 | 76.15 |
| NFpB | 4.29** | 1.38 | 1.43 | 13.37 | 96.71 |
| NI | 39.62** | 11.57 | 13.21 | 15.96 | 87.60 |
| WFSP | 1264.61** | 407.44 | 421.54 | 16.29 | 96.66 |
| TFWP | 45638.96** | 15094.68 | 15212.99 | 7.91 | 99.22 |
| FT | 32.82** | 8.08 | 10.94 | 12.94 | 73.84 |
| FD | 42.27** | 10.58 | 14.09 | 13.69 | 75.07 |
| NFC | 65.76** | 21.68 | 21.92 | 8.58 | 98.93 |
| FW | 4.37** | 1.38 | 1.46 | 12.79 | 95.00 |
| Brix | 0.70** | 0.16 | 0.23 | 13.61 | 69.14 |
| NSF | 598.56** | 189.24 | 199.52 | 11.48 | 94.85 |
| Yield | 89.24** | 28.40 | 29.75 | 15.27 | 95.47 |
Note: ** significant effect on 1% level, * considerable impact on 5%, ns: not significant; MSg: means square genotypes; V g: variance of genotypes; V p: aariance of phenotypes; CV: coefficient of variance (%); H: heritability (%); PH: plant height (cm); DHe: dichotomous height (cm); SD: steam diameter (mm); DF: day to flower (DAP); DH: day to harvest (DAP); NB: number of branches (branch); NFB: number of flowers per bunch (flower); NFpB: number of fruits per bunch (fruit); NI: number of inflorescences (fruit); WFSP: weight of fruit sample per plant (10 fruits) (g); TFWP: total fruit weight per plant (g); FT: fruit thickness (mm); FD: fruit diameter (mm); FW: fruit weight (g); NFC: number of fruit cavities (cativy); NSF: number of seeds per fruit (seed).
The ANOVA and genetic parameters for various tomato characteristics revealed significant differences in most traits, including plant height, number of fruits, fruit weight, and yield, all of which demonstrated high heritability. This indicates that genetic factors play a major role in determining these traits. Conversely, traits such as dichotomous height and days to flower exhibited lower heritability, suggesting that their variation is more influenced by environmental factors. These findings emphasize the importance of traits like fruit number and yield for selection in breeding programs, particularly in lowland environments. Furthermore, the table illustrates an asymmetry in variance, with genotype variance being significantly greater than phenotype variance for the majority of traits.
3.3 Heritability
The identification of genetic parameters is concentrated on heritability (Table 3). In general, the heritability analysis results indicated a high heritability level. The heritability results align with the results obtained from ANOVA, in which the plant height, steam diameter, day to harvest, number of branches, number of flowers per bunch, number of fruits per bunch, number of inflorescences, number of fruits per plant, total number of fruits, fruit thickness, fruit diameter, fruit weight, number of fruit cavities, brix, number of seeds per fruit and yield show high percentages, except for the dichotomous height and day to flower parameter, which shows a moderate rate.
3.4 Correlation analysis
The correlation analysis results (Table 4) reveal that the plant height, stem diameter, number of branches, number of fruit per bunches, number of inflorescences, number of fruits per plant, the total number of fruits, and number of fruit cavities are very significantly and positively correlated with production, with correlation values of 0.32, 0.32, 0.48, 0.63, 0.28, 0.61, 0.62, and 0.26, respectively. These traits will serve as key considerations for identifying tomato genotypes capable of achieving the desired production levels. Other characteristics did not show significant relationships with yield attributes, indicating that changes in these characteristics did not significantly affect the yield.
Correlation analysis of tomato production based on characters significantly correlated with the yield
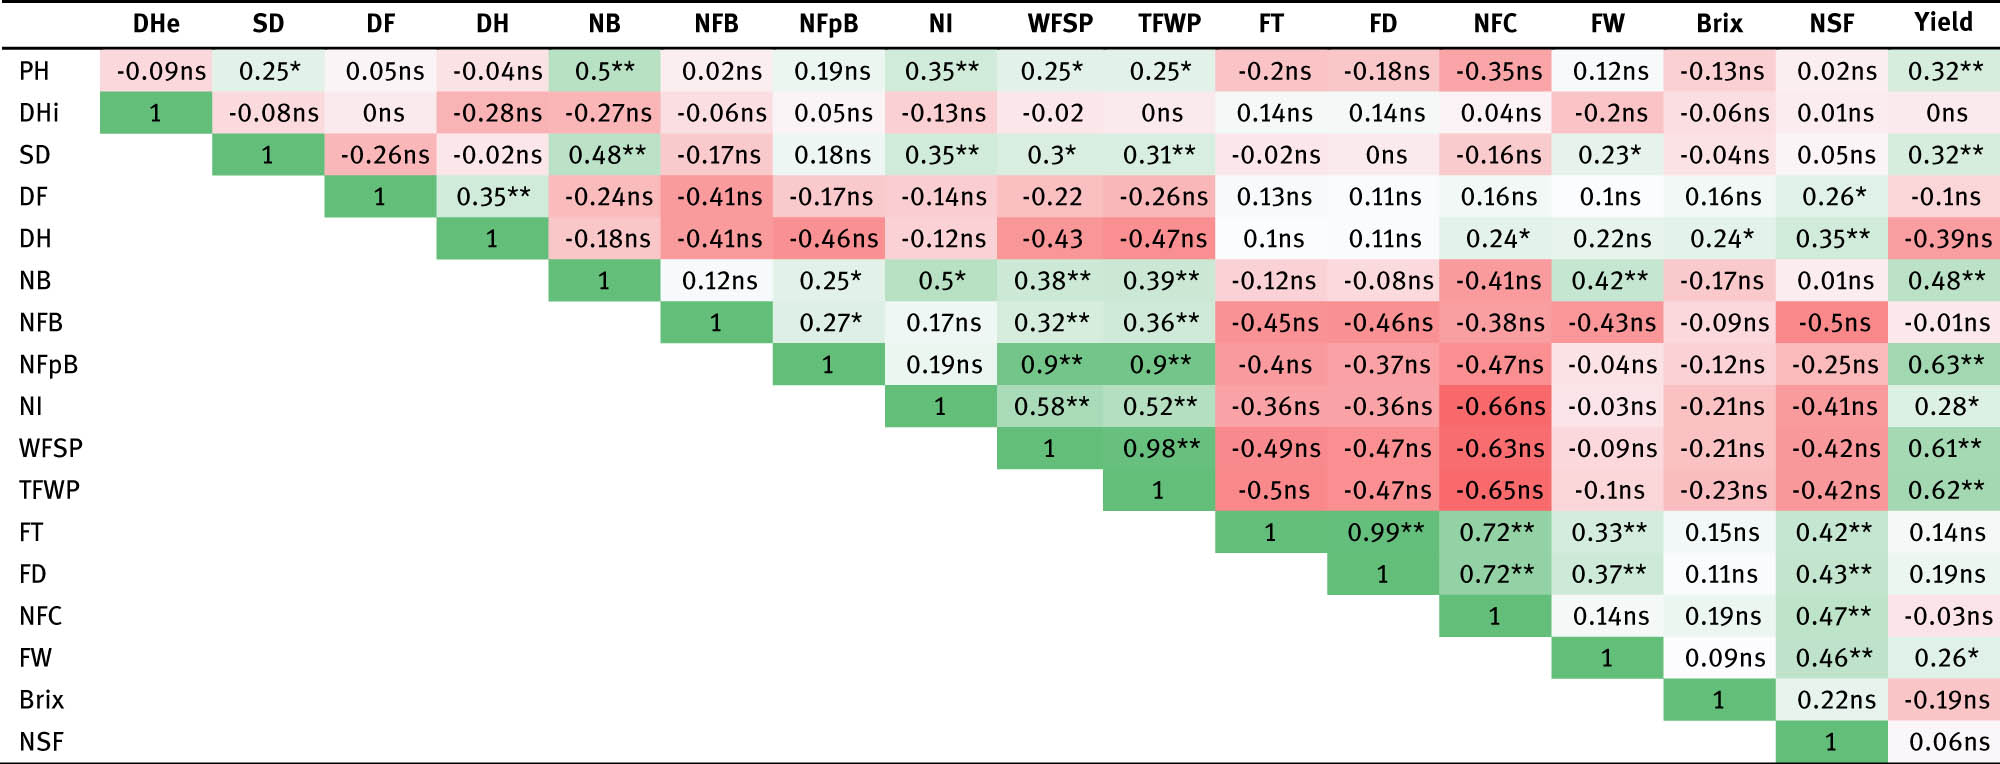 |
Note: **highly significant effect; *significant effect; ns: not significant; PH: plant height (cm); DHe: dichotomous height (cm); SD: steam diameter (mm); DF: day to flower (DAP); DH: day to harvest (DAP); NB: number of branches (branch); NFB: number of flowers per bunch (flower); NFpB: number of fruits per bunch (fruit); NI: number of inflorescences (fruit); WFSP: weight of fruit sample per plant (10 fruits) (g); TFWP: total fruit weight per plant (g); FT: fruit thickness (mm); FD: fruit diameter (mm); FW: fruit weight (g); NFC: number of fruit cavities (cativy); NSF: number of seeds per fruit (seed).
3.5 Path analysis
Based on the correlation analysis, observation parameters showing a positive correlation with productivity were further evaluated using path analysis (Table 5). The path analysis revealed highly significant positive direct effects on yield from key traits, including the number of fruits per bunch (1.28), the total fruit weight per plant (0.55), and the number of inflorescences (0.49). These results emphasize the strong direct influence of these traits on yield, making them critical factors for selection in crop improvement programs.
Path analysis of tomato production based on characters significantly correlated with the yield
| Parameter | Direct effect | Indirect effect | Residual | |||||||
|---|---|---|---|---|---|---|---|---|---|---|
| PH | SD | NB | NFpB | NI | WFSP | TFWP | NFC | |||
| PH | 0.02 | 0.02 | 0.06 | 0.24 | 0.17 | −0.35 | 0.14 | 0.02 | 0.67 | |
| SD | 0.07 | 0.01 | 0.06 | 0.23 | 0.17 | −0.43 | 0.17 | 0.04 | 0.67 | |
| NB | 0.12 | 0.01 | 0.03 | 0.32 | 0.24 | −0.54 | 0.21 | 0.08 | 0.67 | |
| NFpB | 1.28 | 0.00 | 0.01 | 0.03 | 0.09 | −1.28 | 0.49 | −0.01 | 0.67 | |
| NI | 0.49 | 0.01 | 0.02 | 0.06 | 0.24 | −0.82 | 0.28 | −0.01 | 0.67 | |
| WFSP | −1.42 | 0.01 | 0.02 | 0.04 | 1.15 | 0.28 | 0.54 | −0.02 | 0.67 | |
| TFWP | 0.55 | 0.01 | 0.02 | 0.05 | 1.15 | 0.25 | −1.39 | −0.02 | 0.67 | |
| NFC | 0.18 | 0.00 | 0.02 | 0.05 | −0.05 | −0.01 | 0.13 | −0.05 | 0.67 | |
| 0.05 | 0.14 | 0.34 | 3.30 | 1.20 | −4.68 | 1.78 | 0.09 | |||
Note: PH: plant height (cm); SD: steam diameter (mm); NB: number of branches (branch); NFpB: number of fruits per bunch (fruit); NI: number of inflorescences (fruit); WFSP: weight of fruit sample per plant (10 fruits) (g); TFWP: total fruit weight per plant (g); NFC: number of fruit cavities (cavity).
3.6 PCA
The PCA findings are summarized in Table 6 and Figure 2. According to the study, the proportion of variance explained by the first principal component (PC1) is 0.47 (47%), followed by PC2 at 0.23 (23%), PC3 at 0.11 (11%), PC4 at 0.08 (8%), PC5 at 0.06 (6%), PC6 at 0.03 (3%), PC7 at 0.02 (2%), PC8 at 0.01 (1%), and PC9 at 0.00 (0%). The eigenvector coefficients for the plant traits contributing to PC1 are as follows: plant height (−0.31), stem diameter (−0.31), number of branches (−0.39), number of fruits per bunch (−0.16), number of inflorescences (−0.37), number of fruits per plant (−0.42), total number of fruits (−0.42), number of fruit cavities (−0.08), and yield (−0.37). These values indicate the relative influence of each trait on the variability captured by PC1. Among the components, PC1 accounts for the largest share of the observed variability, making it the most significant in explaining differences within the dataset. This implies that the traits with high eigenvector coefficients in PC1 are critical for distinguishing the plant performance. Therefore, in this study, the selection index was primarily based on PC1, emphasizing its importance in identifying traits most strongly associated with variability in plant characteristics.
PCA of tomato production character F1 generation
| Variables | PC1 | PC2 | PC3 | PC4 | PC5 | PC6 | PC7 | PC8 | PC9 |
|---|---|---|---|---|---|---|---|---|---|
| PH | −0.31 | −0.13 | −0.56 | −0.21 | −0.61 | 0.36 | −0.08 | 0.16 | 0.00 |
| SD | −0.31 | −0.29 | 0.27 | 0.59 | −0.20 | 0.06 | 0.54 | 0.23 | 0.01 |
| NB | −0.39 | −0.25 | −0.36 | −0.07 | 0.33 | −0.12 | 0.31 | −0.66 | −0.03 |
| NFpB | −0.16 | 0.57 | −0.29 | −0.19 | 0.29 | −0.09 | 0.49 | 0.44 | 0.02 |
| NI | −0.37 | 0.12 | −0.30 | 0.53 | 0.17 | −0.34 | −0.55 | 0.17 | 0.03 |
| WFSP | −0.42 | 0.24 | 0.33 | −0.08 | 0.08 | 0.32 | −0.16 | −0.07 | −0.72 |
| TFWP | −0.42 | 0.24 | 0.34 | −0.09 | 0.08 | 0.35 | −0.13 | −0.15 | 0.69 |
| NFC | −0.08 | −0.60 | −0.01 | −0.24 | 0.54 | 0.24 | −0.13 | 0.46 | 0.02 |
| Yield | −0.37 | −0.16 | 0.31 | −0.46 | −0.26 | −0.67 | −0.02 | 0.14 | 0.02 |
| Eigen values | 4.21 | 2.09 | 0.95 | 0.73 | 0.52 | 0.23 | 0.19 | 0.08 | 0.00 |
| Proportion | 0.47 | 0.23 | 0.11 | 0.08 | 0.06 | 0.03 | 0.02 | 0.01 | 0.00 |
| Cumulative | 0.47 | 0.70 | 0.81 | 0.89 | 0.95 | 0.97 | 0.99 | 1.00 | 1.00 |
Note: PH: plant height (cm); SD: steam diameter (mm); NB: number of branches (branch); NFpB: number of fruits per bunch (fruit); NI: number of inflorescences (fruit); WFSP: weight of fruit sample per plant (10 fruits) (g); TFWP: total fruit weight per plant (g); NFC: number of fruit cavities (cavity); PCx is a latent variable, which is a new character consisting of the components of the observed characters.
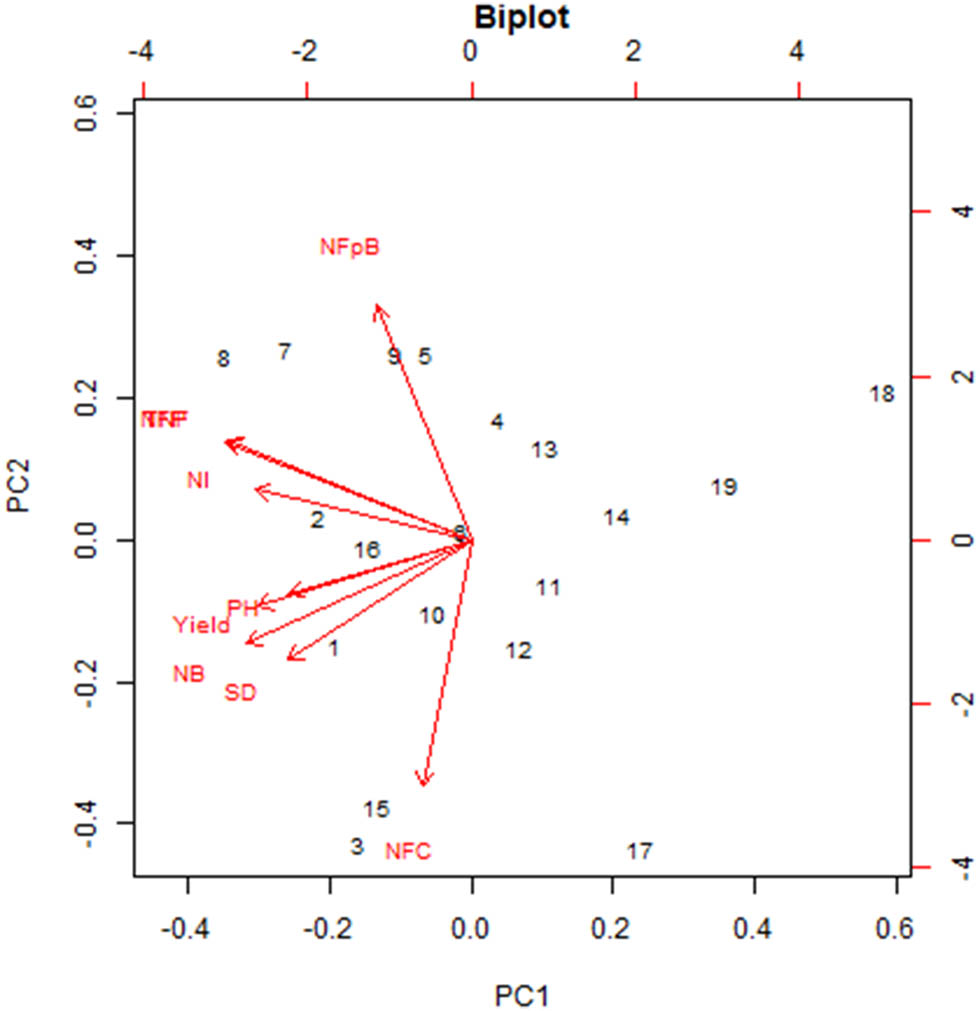
Biplot graph of PCA in relation to all genotypes.
3.7 Index analysis
The analysis results (Table 7) showed 12 F1 tomato plant lines with positive selection index values and were better than their parents. Selection criteria include heritability, path analysis, and PCA to assess the potential of plant lines. These results have implications for the selection of plant lines for breeding programs, improving the quality and productivity of tomato plants. However, it is necessary to validate and monitor the performance of selected plant lines under different environmental conditions.
Selection of F1 tomato lines based on the index value
| Rank | Genotype | Actual value | Standardization | Index | ||||||
|---|---|---|---|---|---|---|---|---|---|---|
| NFpB | NI | TFWP | Yield | NFpB | NI | TFWP | Yield | |||
| 1 | G8 | 6.02 | 16.00 | 559.00 | 17.37 | 1.09 | 0.60 | 2.67 | 0.92 | 1.25 |
| 2 | G7 | 6.42 | 18.67 | 370.00 | 15.46 | 1.59 | 1.35 | 1.10 | 0.50 | 0.96 |
| 3 | G2 | 5.51 | 20.05 | 276.33 | 16.20 | 0.46 | 1.74 | 0.32 | 0.66 | 0.67 |
| 4 | G9 | 6.36 | 17.25 | 330.67 | 12.32 | 1.51 | 0.95 | 0.77 | −0.18 | 0.56 |
| 5 | G1 | 4.51 | 17.36 | 268.17 | 18.77 | −0.78 | 0.98 | 0.25 | 1.22 | 0.49 |
| 6 | G5 | 6.67 | 12.32 | 272.33 | 14.64 | 1.89 | −0.44 | 0.28 | 0.32 | 0.48 |
| 7 | G6 | 5.13 | 13.89 | 279.33 | 17.53 | −0.01 | 0.00 | 0.34 | 0.95 | 0.41 |
| 8 | G15 | 3.80 | 11.67 | 252.00 | 22.01 | −1.67 | −0.63 | 0.11 | 1.93 | 0.27 |
| 9 | G16 | 4.71 | 12.80 | 374.33 | 14.86 | −0.54 | −0.31 | 1.13 | 0.37 | 0.23 |
| 10 | G3 | 4.49 | 14.72 | 234.33 | 17.45 | −0.81 | 0.24 | −0.03 | 0.93 | 0.20 |
| 11 | G10 | 5.62 | 12.78 | 188.00 | 14.46 | 0.60 | −0.31 | −0.42 | 0.28 | 0.07 |
| 12 | G4 | 5.25 | 13.38 | 287.33 | 11.99 | 0.13 | −0.14 | 0.41 | −0.26 | 0.01 |
| 13 | G13 | 5.13 | 15.37 | 204.33 | 8.54 | −0.01 | 0.42 | −0.28 | −1.01 | −0.35 |
| 14 | G12 | 4.62 | 15.97 | 170.83 | 9.96 | −0.64 | 0.59 | −0.56 | −0.70 | −0.41 |
| 15 | G11 | 5.31 | 14.70 | 123.13 | 6.02 | 0.21 | 0.23 | −0.96 | −1.55 | −0.69 |
| 16 | T3 | 4.82 | 8.33 | 77.00 | 11.32 | −0-.40 | −1.57 | −1.34 | −0.40 | −0.78 |
| 17 | G14 | 4.60 | 14.72 | 113.00 | 4.81 | −0.67 | 0.24 | −1.04 | −1.82 | −0.97 |
| 18 | T1 | 3.65 | 8.19 | 93.33 | 9.98 | −1.86 | −1.61 | −1.21 | −0.69 | −1.14 |
| 19 | T2 | 5.07 | 5.69 | 52.33 | 6.35 | −0.09 | −2.32 | −1.55 | −1.48 | −1.26 |
Note: NFpB: number of fruits per bunch (fruit); NI: number of inflorescences (fruit); TFWP: total fruit weight per plant (g).
4 Discussion
ANOVA revealed significant differences among genotypes, enabling comparisons of genetic diversity, heritability, trait correlations, and regression analysis to identify specific characteristics with substantial to highly significant effects [20,28,29]. These findings highlighted that overall growth and production traits significantly influenced the F1 tomato population, including their variation within the population. Genetic diversity is crucial in selecting populations and enhancing desirable characteristics, as evidenced by the varied responses between tolerant and sensitive genotypes under different environmental conditions. This underscores the importance of these traits in determining the effectiveness of selection. Significant variance is a critical indicator of the potential success of selection for specific traits, with diversity within lines and comparisons between lines and control varieties being essential components for evaluating and refining line selection processes [16,30,31].
Based on the standard deviation analysis shown in Tables 1 and 2, there is significant variation among the genotypes regarding growth and fruit characteristics. In terms of growth, genotype G1 showed the highest plant height (363.67 cm), while genotype T3 had the lowest height (312.85 cm). According to research conducted by Zhu et al. [32] and Da Silva Oliveira et al. [33], the plant height is influenced by genetic and environmental factors, such as the availability of light and nutrients, which regulate growth hormones such as auxin and gibberellin. In addition, the time taken to harvest ranged from 171 to 210 days, indicating differences in the ripening speed between genotypes, an essential factor in determining crop production efficiency [34,35].
On the other hand, fruit characteristics also showed considerable differences between genotypes in fruit number and weight, fruit thickness and diameter, sweetness level (Brix), and the number of seeds in each fruit. Genotype G15 recorded the highest yield (66.02), while G14 had the lowest yield (25.61), indicating variations in productivity between genotypes. According to Rasheed et al. [36], yield is influenced by genetic factors and the environment, such as water availability, nutrients, and cultivation techniques applied. In addition, Brix content, which varies among genotypes, is an essential indicator in assessing fruit quality, especially in terms of flavor and marketability, as the level of sweetness is influenced by sugar accumulation during the ripening process [37,38].
Heritability values in Table 3 ranged from 21.41 to 99.22%, falling into medium to high categories. Among the traits analyzed, 16 exhibited high heritability values, while one trait displayed medium heritability. Traits with the highest heritability included the plant height (84.75%), stem diameter (73.16%), days to harvest (79.67%), number of branches (90.1%), number of flowers per bunch (76.15%), number of fruits per bunch (96.71%), number of inflorescences (87.6%), weight of fruit sample per plant (96.66%), the total fruit weight per plant (g) (99.22%), fruit thickness (73.84%), fruit diameter (75.07%), fruit weight (98.93%), number of fruit cavities (95%), Brix (69.14%), number of seeds per fruit (94.85%), and yield (95.47%). In contrast, traits such as dichotomous height (21.41%) and days to flower (48.85%) exhibited medium heritability. High heritability indicates that traits are predominantly influenced by genetic factors rather than environmental conditions, making them valuable selection criteria. According to Del Medico et al. [39] and Singh et al. [40], traits with high heritability are more likely to be inherited and can benefit from additive genetic effects, further enhancing selection efficiency.
Path analysis was used to measure the direct effects of specific traits on yield variation, complementing correlation analysis, which was insufficient for this study. The number of fruits per bunch (1.28), the total fruit weight per plant (g) (0.55), and the number of inflorescences (0.49) suggested that direct selection for these traits could enhance yield per plant [41,42]. Based on path analysis parameters that have a high direct effect, namely the number of fruits per bunch, the number of inflorescences, and the total fruit weight per plant, will be used in the index value to see which genotype has the best performance.
Based on the PCA results, PC1 emerged as the most suitable dimension for forming the selection index, supported by its eigenvalue exceeding 1, whereas PC2 and PC3 had eigenvalues below 1. An eigenvalue of 1 is a critical threshold for determining the effectiveness of a dimension in accumulating multi-trait diversity in PCA [27,43,44]. The selection index derived from the eigenvector values on PC1 was calculated as follows: selection index = 0.31 (plant height) + 0.31 (stem diameter) + 0.39 (number of branches) + 0.16 (number of fruits per bunch) + 0.37 (number of inflorescences) + 0.42 (weight of fruit sample per plant) + 0.42 (total fruit weight per plant) + 0.08 (number of fruit cavities) + 0.37 (yield). However, this index requires further refinement to incorporate factors such as gene action and its correlation with the primary trait.
Primary characters still dominate the selection process, indicating the need to adjust the selection index for secondary characters using PCA variance, path analysis, and correlation analysis. Though correlation analysis is rough, it remains effective for a few secondary characters and can be optimized through the determination value. The corrected index can characterize the optimal conditions in the lineage selection. Therefore, the determination value must be incorporated into the development of the selection index in this study, relying on the correlation determination value. Based on the correlation determination value, the selection index formed is as follows:
Selection Index = (0.42 × 0.47 × 0.55) total fruit weight per plant (g) + (0.37 × 0.47 × 0.49) number of inflorescences + (0.16 × 0.47 × 1.28) number of fruits per bunch.
The selection index analysis identified 16 lines for advancement based on their positive index values and performance relative to the control variety. These criteria align with methodologies reported in previous studies [45,46]. The analysis ultimately recommended 12 F1 tomato breeding lines for advancement, although further testing through within-family ANOVA is needed to evaluate the potential for transgressive segregation. The positive index value is a critical selection criterion at this stage of the F1 generation, where approximately 50% of the lines were selected. Early-generation selection should remain flexible to ensure that promising lines are more likely to succeed, facilitating consistent progress in subsequent generations [27,47].
5 Conclusions
In conclusion, based on heritability analysis, correlation analysis, path analysis, and PCA, 12 tomato plant lines had higher growth and productivity than the parents and other targeted lines. The novelty of this research lies in its integrated use of heritability, correlation, path analysis, and PCA to identify critical yield-related traits. By employing these advanced analytical methods, the study provides a more targeted and efficient breeding strategy for improving tomato yield and quality, particularly in tropical and subtropical lowland regions. These findings provide valuable insights for improving tomato production through targeted breeding strategies and contribute to a more targeted and efficient approach to plant breeding, paving the way for sustainable improvements in tomato cultivation. However, this study has certain limitations. The evaluation was conducted under a single environmental condition, which may limit the applicability of the findings across varying agroecological regions. To build on these findings, future research should include multilocation trials to assess the stability and adaptability of the selected lines. This approach could be extended to support tomato biofortification programs, focusing on increasing the content of essential nutrients such as lycopene, beta-carotene, vitamin C, and minerals. This would not only improve yield and plant resilience but also contribute significantly to food and nutritional security, particularly in lowland.
-
Funding information: This work was supported by the Ministry of Education, Culture, Research, and Technology of the Republic of Indonesia through the scheme of Master to Doctoral Education for Excellent Graduates (PMDSU) with grant number 02035/UN4.22/PT.01.03/2024.
-
Author contributions: All authors confirm responsibility for the conception of the study, presented results, and manuscript preparation. All co-authors reviewed and approved the manuscript before submission. All authors approved the final version of the manuscript. Conceptualization: M.A.I.A., M.F.A., and M.F. Methodology: M.F. and M.F.A. Software: M.F.A. and M.A.I.A. Validation: M.F. and M.F.A. Formal analysis: M.A.I.A. and M.F.A. Investigation: M.A.I.A. and M.F.A. Resources: M.F. Data curation: M.A.I.A. and M.F.A. Writing – original draft: All the authors. Visualization: M.F.A. and M.F. Funding acquisition: M.A.I.A. and M.F.
-
Conflict of interest: Authors state no conflict of interest.
-
Data availability statement: The datasets generated during and/or analysed during the current study are available from the corresponding author on reasonable request.
References
[1] Marviana FE, Hidayatulloh A, Widiastuti T, Hasbullah UHA. Antioxidant potential of tomato extract and moringa leaf extract. J Food Agric Prod. 2021;1(2):41–8.10.32585/jfap.v1i2.1852Search in Google Scholar
[2] Bahri S, Irmayani I, Aulia J, Lathifah MF, Adawiyah R. Efek Estrogenik Ekstrak Buah Tomat (Lycopersicum esculentum) Terhadap Mencit Betina Dewasa (Mus musculus) Galur Balb/C. J Pijar Mipa. 2021;16(2):222–7.10.29303/jpm.v16i2.2420Search in Google Scholar
[3] Yunandra Y, Deviona D, Zuhry E, Syukur M, Ardian A, Effendi A, et al. Selection criteria for lowland tomatoes (Solanum lycopersicum L.). In E3S Web of Conferences. Vol. 373. 2023.10.1051/e3sconf/202337303005Search in Google Scholar
[4] Statistics Indonesia. Statistical yearbook of Indonesia. Jakarta: Statistic Indonesia; 2024. p. 790.Search in Google Scholar
[5] Piosik Ł, Ruta-Piosik M, Zenkteler M, Zenkteler E. Development of interspecific hybrids between Solanum lycopersicum L. and S. sisymbriifolium Lam. via embryo calli. Euphytica. 2019;215(2):1–20.10.1007/s10681-019-2358-9Search in Google Scholar
[6] Liu J, Wang X. Early recognition of tomato gray leaf spot disease based on MobileNetv2-YOLOv3 model. Plant Methods. 2020;16(1):1–16. 10.1186/s13007-020-00624-2.Search in Google Scholar PubMed PubMed Central
[7] Zhang A, Pérez-rodríguez P, San F, Palacios-rojas N, Dhliwayo T, Liu Y, et al. Genomic prediction of the performance of hybrids and the combining abilities for line by tester trials in maize. Crop J. 2022;10(1):109–16. 10.1016/j.cj.2021.04.007.Search in Google Scholar
[8] Wiguna G, Damayanti F, Mubarok S, Ezura H. Anas. Genetic control of fruit shelf-life in a cross between sletr1-2 mutant and some Indonesian tropical tomatoes. Biodiversitas. 2021;22(10):4671–5.10.13057/biodiv/d221060Search in Google Scholar
[9] Avdikos ID, Nteve GM, Apostolopoulou A, Tagiakas R, Mylonas I, Xynias IN, et al. Analysis of re-heterosis for yield and fruit quality in restructured hybrids, generated from crossings among tomato recombinant lines. Agronomy. 2021;11(5):1–24.10.3390/agronomy11050822Search in Google Scholar
[10] Wahyuni S, Yunianti R, Syukur M, Witono J, Syarifah I. Resistance of 25 tomato genotypes (Solanum lycopersicum Mill.) to fruit cracking and its correlations to others characters. J Agron Indones. 2014;42(3):195–202.Search in Google Scholar
[11] Pardosi SK, Ruistikawati R, Suryati D. The growth and yield of sixteen tomato (Solanum lycopersicum L.) genotypes grown in Lowlands. Akta Agrosia. 2016;19(2):118–27.10.31186/aa.19.2.118-127Search in Google Scholar
[12] Roy TK, Sannal A, Tommoy SMMS, Akter S, Bhagyobandhu R, Rana MM, et al. Trait analysis of short duration boro rice (Oryza sativa L.) varieties in northern region of Bangladesh: Insights from heatmap, correlation and PCA. Nov Geod. 2024;4(2):1–14.10.55779/ng42175Search in Google Scholar
[13] Syukur M, Sujiprihati S, Yunianti R. Plant breeding techniques. Depok (ID): Penebar Swadaya; 2015.Search in Google Scholar
[14] Campanelli G, Sestili S, Acciarri N, Montemurro F, Palma D, Leteo F, et al. Multi-parental advances generation inter-cross population, to develop organic tomato genotypes by participatory plant breeding. Agronomy. 2019;9(3):1–13.10.3390/agronomy9030119Search in Google Scholar
[15] Dheemanth TL, Prakash BG, Honnabyraiah MK, Gowda APM, Kumar SM. Evaluation of single cross hybrids in tomato under protected and unprotected conditions for resistance to bacterial wilt and tomato leaf curl virus diseases (Solanum lycopersicum). Int J Curr Microbiol Appl Sci. 2020;9(2):2697–710.10.20546/ijcmas.2020.902.307Search in Google Scholar
[16] Anisa WN, Afifah EN, Murti RH. Selection of tomato breeding lines based on morphological traits associated with high yield potential in a double-cross population. Biodiversitas. 2022;23(6):2973–80.10.13057/biodiv/d230624Search in Google Scholar
[17] Laila F, Zainal A, Alaydrus A, Umarie I, Abdul AJ, Indah H, et al. Fundamentals of plant breeding. Padang: Get Press Indonesia; 2023. p. 1–27. www.getpress.co.id.Search in Google Scholar
[18] Wahyudi A. Karakterisasi Koleksi Plasma Nutfah Tomat Lokal dan Introduksi Characterization of Germplasm Collection in Local and Introduction of Tomato. J Penelit Pertan Ter. 2014;14(1):70–5.Search in Google Scholar
[19] Rosmaina R, Syafrudin S, Hasrol H, Yanti F, Juliyanti J, Zulfahmi Z. Estimation of variability, heritability and genetic advance among local chili pepper genotypes cultivated in peat lands. Bulg J Agric Sci. 2016;22(3):431–6.Search in Google Scholar
[20] Fadhilah A, Farid M, Ridwan I, Anshori M, Yassi A. Genetic parameters and selection index of high-yielding tomato F2 populations. SABRAO J Breed Genet. 2022;54(5):1026–36.10.54910/sabrao2022.54.5.6Search in Google Scholar
[21] Pabendon MB, Efendi R, Santoso SB, Prastowo B. Varieties of sweet sorghum Super-1 and Super-2 and its equipment for bioethanol in Indonesia. In IOP Conference Series: Earth and Environmental Science; 2017. p. 012054. https://iopscience.iop.org/article/10.1088/1755-1315/65/1/012054.10.1088/1755-1315/65/1/012054Search in Google Scholar
[22] Arifuddin M, Musa Y, Farid M, Anshori MF, Nasaruddin N, Nur A, et al. Rice screening with hydroponic deep-flow technique under salinity stress. Sabrao J Breed Genet. 2021;53(3):435–46.Search in Google Scholar
[23] Abduh ADM, Padjung R, Farid M, Bahrun AH, Anshori MF, Nasaruddin, et al. Interaction of genetic and cultivation technology in maize prolific and productivity increase. Pak J Biol Sci. 2021;24(6):716–23.10.3923/pjbs.2021.716.723Search in Google Scholar PubMed
[24] Zörb C, Piepho H-P, Zikeli S, Horneburg B. Heritability and variability of quality parameters of tomatoes in outdoor production. Research. 2020;2020:6707529.10.34133/2020/6707529Search in Google Scholar PubMed PubMed Central
[25] Baraki F, Gebregergis Z, Belay Y, Teame G, Gebremedhin Z, Abadi A, et al. Parametric and non-parametric measures to identify stable and adaptable cotton (Gossypium Hirsutum L.) genotypes. J Nat Fibers. 2024;21(1):1–18.10.1080/15440478.2024.2317426Search in Google Scholar
[26] Roy S, Chatterjee S, Hossain MA, Basfore S, Karak C. Path analysis study and morphological characterization of sweet pepper Path analysis study and morphological characterization of sweet pepper (Capsicum annuum L. var. grossum.). Int J Chem Stud. 2019;7(1):1777–84.Search in Google Scholar
[27] Akfindarwan AK, Farid M, Syaiful SA, Anshori MF, Nur A. Selection criteria and index analysis for the S2 maize lines of double-crosses. Biodiversitas. 2023;24(1):192–9.10.13057/biodiv/d240123Search in Google Scholar
[28] Anshori MF, Purwoko BS, Dewi IS, Ardie SW, Suwarno WB. Selection index based on multivariate analysis for selecting doubled-haploid rice lines in lowland saline prone area. Sabrao J Breed Genet. 2019;51(2):161–74.Search in Google Scholar
[29] Usman M, Ali S, Ismaeel M, Shabir M, Ullah R, Raza H. Genetic variability, heritability and genetic advance in determinate types of tomato (Solanum lycopersicum L.). Int J Agron Agri R. 2022;21(4):6–17.Search in Google Scholar
[30] Fellahi ZEA, Hannachi A, Bouzerzour H. Analysis of direct and indirect selection and indices in bread wheat (Triticum aestivum L.) segregating progeny. Int J Agron. 2018;2018:8312857.10.1155/2018/8312857Search in Google Scholar
[31] Priyanto SB, Azrai M, Syakir M. Genetic variance, heritability, and path analysis on agronomic characters of single crosses hybrid maize. J Agric Inf. 2018;27(1):1–9.Search in Google Scholar
[32] Zhu Y, Gu Q, Zhao Y, Wan H, Wang R, Zhang X, et al. Quantitative extraction and evaluation of tomato fruit phenotypes based on image recognition. Front Plant Sci. 2022;13:1–12.10.3389/fpls.2022.859290Search in Google Scholar PubMed PubMed Central
[33] Da Silva Oliveira CE, Zoz T, Jalal A, Vendruscolo EP, Nogueira TAR, Jani AD, et al. Tolerance and adaptability of tomato genotypes to saline irrigation. Crops. 2022;2(3):306–22.10.3390/crops2030022Search in Google Scholar
[34] Maboko MM, Du Plooy CP. Response of field-grown indeterminate tomato to plant density and stem pruning on yield. Int J Veg Sci. 2018;24(6):612–21. 10.1080/19315260.2018.1458265.Search in Google Scholar
[35] Gao F, Li H, Mu X, Gao H, Zhang Y, Li R, et al. Effects of organic fertilizer application on tomato yield and quality: A meta-analysis. Appl Sci. 2023;13(4):1–17.10.3390/app13042184Search in Google Scholar
[36] Rasheed A, Ilyas M, Khan TN, Mahmood A, Riaz U, Chattha MB, et al. Study of genetic variability, heritability, and genetic advance for yield-related traits in tomato (Solanum lycopersicon MILL.). Front Genet. 2023;13:1–13.10.3389/fgene.2022.1030309Search in Google Scholar PubMed PubMed Central
[37] Patel RN, Gami RA, Joshi AH. Genetic variability, character association and path analysis of forage sorghum [Sorghum Bicolor (L.) Moench]. Forage Res. 2021;47(2):153–8, http://forageresearch.in.Search in Google Scholar
[38] Arunkumar B. Genetic variability, character association and path analysis studies in sorghum (Sorghum bicolor (L) Moench). Bioscan. 2013;8(4):1485–8.Search in Google Scholar
[39] Del Medico AP, Cabodevila VG, Vitelleschi MS, Pratta GR. Multivariate estimate of heritability for quality traits in tomatoes by the multiple factor analysis. Pesqui Agropecu Bras. 2019;54:e00064.10.1590/s1678-3921.pab2019.v54.00064Search in Google Scholar
[40] Singh SK, Shrivastava S, Mishra AK, Kumar D, Pandey VK, Srivastava P, et al. Friedelin: Structure, biosynthesis, extraction, and its potential health impact. Molecules. 2023;28(23):1–22.10.3390/molecules28237760Search in Google Scholar PubMed PubMed Central
[41] Chatterjee S, Mukherjee D, Choudhuri P. Path analysis and quality character studies in some mid late and late cauliflower (Brassica oleracea var. botrytis L.) genotypes. Curr Appl Sci Technol. 2018;31(1):1–7.10.9734/CJAST/2018/45869Search in Google Scholar
[42] Mishra A, Nandi A, Das AK, Das S, Mohanty IC, Pattanayak SK, et al. Correlation and path analysis studies for yield in tomato (Solanum lycopersicum L.). Int J Curr Microbiol Appl Sci. 2019;8(09):489–97.10.20546/ijcmas.2019.809.059Search in Google Scholar
[43] Fadhli N, Farid M, Effendi R, Azrai M, Anshori M. Multivariate analysis to determine secondary traits in selecting adaptive hybrid corn lines under drought stress. Biodiversitas. 2020;21:3617–24.10.13057/biodiv/d210826Search in Google Scholar
[44] Aslam M, Maqbool MA, Zaman QU, Shahid M, Akhtar MA, Rana AS. Comparison of different tolerance indices and PCA biplot analysis for assessment of salinity tolerance in lentil (Lens culinaris) genotypes. Int J Agric Biol. 2017;19(3):470–8.10.17957/IJAB/15.0308Search in Google Scholar
[45] Padjung R, Farid MUH, Musa Y, Anshori MF, Nur A, Masnenong A. Drought-adapted maize line based on morphophysiological selection index. Biodiversitas. 2021;22(9):4028–35.10.13057/biodiv/d220951Search in Google Scholar
[46] Anshori MF, Purwoko BS, Dewi IS, Suwarno WB, Ardie SW. Salinity tolerance selection of doubled-haploid rice lines based on selection index and factor analysis. AIMS Agric Food. 2022;7(3):520–35.10.3934/agrfood.2022032Search in Google Scholar
[47] Fadli MUH, Farid MUH, Yassi A, Anshori MF. Evaluation of the advanced yield trial on tropical wheat (Triticum aestivum) mutant lines using selection index and multivariate analysis. Biodiversitas. 2022;23(1):540–7.10.13057/biodiv/d230158Search in Google Scholar
© 2025 the author(s), published by De Gruyter
This work is licensed under the Creative Commons Attribution 4.0 International License.
Articles in the same Issue
- Research Articles
- Optimization of sustainable corn–cattle integration in Gorontalo Province using goal programming
- Competitiveness of Indonesia’s nutmeg in global market
- Toward sustainable bioproducts from lignocellulosic biomass: Influence of chemical pretreatments on liquefied walnut shells
- Efficacy of Betaproteobacteria-based insecticides for managing whitefly, Bemisia tabaci (Hemiptera: Aleyrodidae), on cucumber plants
- Assessment of nutrition status of pineapple plants during ratoon season using diagnosis and recommendation integrated system
- Nutritional value and consumer assessment of 12 avocado crosses between cvs. Hass × Pionero
- The lacked access to beef in the low-income region: An evidence from the eastern part of Indonesia
- Comparison of milk consumption habits across two European countries: Pilot study in Portugal and France
- Antioxidant responses of black glutinous rice to drought and salinity stresses at different growth stages
- Differential efficacy of salicylic acid-induced resistance against bacterial blight caused by Xanthomonas oryzae pv. oryzae in rice genotypes
- Yield and vegetation index of different maize varieties and nitrogen doses under normal irrigation
- Urbanization and forecast possibilities of land use changes by 2050: New evidence in Ho Chi Minh city, Vietnam
- Organizational-economic efficiency of raspberry farming – case study of Kosovo
- Application of nitrogen-fixing purple non-sulfur bacteria in improving nitrogen uptake, growth, and yield of rice grown on extremely saline soil under greenhouse conditions
- Digital motivation, knowledge, and skills: Pathways to adaptive millennial farmers
- Investigation of biological characteristics of fruit development and physiological disorders of Musang King durian (Durio zibethinus Murr.)
- Enhancing rice yield and farmer welfare: Overcoming barriers to IPB 3S rice adoption in Indonesia
- Simulation model to realize soybean self-sufficiency and food security in Indonesia: A system dynamic approach
- Gender, empowerment, and rural sustainable development: A case study of crab business integration
- Metagenomic and metabolomic analyses of bacterial communities in short mackerel (Rastrelliger brachysoma) under storage conditions and inoculation of the histamine-producing bacterium
- Fostering women’s engagement in good agricultural practices within oil palm smallholdings: Evaluating the role of partnerships
- Increasing nitrogen use efficiency by reducing ammonia and nitrate losses from tomato production in Kabul, Afghanistan
- Physiological activities and yield of yacon potato are affected by soil water availability
- Vulnerability context due to COVID-19 and El Nino: Case study of poultry farming in South Sulawesi, Indonesia
- Wheat freshness recognition leveraging Gramian angular field and attention-augmented resnet
- Suggestions for promoting SOC storage within the carbon farming framework: Analyzing the INFOSOLO database
- Optimization of hot foam applications for thermal weed control in perennial crops and open-field vegetables
- Toxicity evaluation of metsulfuron-methyl, nicosulfuron, and methoxyfenozide as pesticides in Indonesia
- Fermentation parameters and nutritional value of silages from fodder mallow (Malva verticillata L.), white sweet clover (Melilotus albus Medik.), and their mixtures
- Five models and ten predictors for energy costs on farms in the European Union
- Effect of silvopastoral systems with integrated forest species from the Peruvian tropics on the soil chemical properties
- Transforming food systems in Semarang City, Indonesia: A short food supply chain model
- Understanding farmers’ behavior toward risk management practices and financial access: Evidence from chili farms in West Java, Indonesia
- Optimization of mixed botanical insecticides from Azadirachta indica and Calophyllum soulattri against Spodoptera frugiperda using response surface methodology
- Mapping socio-economic vulnerability and conflict in oil palm cultivation: A case study from West Papua, Indonesia
- Exploring rice consumption patterns and carbohydrate source diversification among the Indonesian community in Hungary
- Determinants of rice consumer lexicographic preferences in South Sulawesi Province, Indonesia
- Effect on growth and meat quality of weaned piglets and finishing pigs when hops (Humulus lupulus) are added to their rations
- Healthy motivations for food consumption in 16 countries
- The agriculture specialization through the lens of PESTLE analysis
- Combined application of chitosan-boron and chitosan-silicon nano-fertilizers with soybean protein hydrolysate to enhance rice growth and yield
- Stability and adaptability analyses to identify suitable high-yielding maize hybrids using PBSTAT-GE
- Phosphate-solubilizing bacteria-mediated rock phosphate utilization with poultry manure enhances soil nutrient dynamics and maize growth in semi-arid soil
- Factors impacting on purchasing decision of organic food in developing countries: A systematic review
- Influence of flowering plants in maize crop on the interaction network of Tetragonula laeviceps colonies
- Bacillus subtilis 34 and water-retaining polymer reduce Meloidogyne javanica damage in tomato plants under water stress
- Vachellia tortilis leaf meal improves antioxidant activity and colour stability of broiler meat
- Evaluating the competitiveness of leading coffee-producing nations: A comparative advantage analysis across coffee product categories
- Application of Lactiplantibacillus plantarum LP5 in vacuum-packaged cooked ham as a bioprotective culture
- Evaluation of tomato hybrid lines adapted to lowland
- South African commercial livestock farmers’ adaptation and coping strategies for agricultural drought
- Spatial analysis of desertification-sensitive areas in arid conditions based on modified MEDALUS approach and geospatial techniques
- Meta-analysis of the effect garlic (Allium sativum) on productive performance, egg quality, and lipid profiles in laying quails
- Optimizing carrageenan–citric acid synergy in mango gummies using response surface methodology
- The strategic role of agricultural vocational training in sustainable local food systems
- Agricultural planning grounded in regional rainfall patterns in the Colombian Orinoquia: An essential step for advancing climate-adapted and sustainable agriculture
- Perspectives of master’s graduates on organic agriculture: A Portuguese case study
- Developing a behavioral model to predict eco-friendly packaging use among millennials
- Government support during COVID-19 for vulnerable households in Central Vietnam
- Citric acid–modified coconut shell biochar mitigates saline–alkaline stress in Solanum lycopersicum L. by modulating enzyme activity in the plant and soil
- Review Articles
- Reference dietary patterns in Portugal: Mediterranean diet vs Atlantic diet
- Evaluating the nutritional, therapeutic, and economic potential of Tetragonia decumbens Mill.: A promising wild leafy vegetable for bio-saline agriculture in South Africa
- A review on apple cultivation in Morocco: Current situation and future prospects
- Quercus acorns as a component of human dietary patterns
- CRISPR/Cas-based detection systems – emerging tools for plant pathology
- Short Communications
- An analysis of consumer behavior regarding green product purchases in Semarang, Indonesia: The use of SEM-PLS and the AIDA model
- Effect of NaOH concentration on production of Na-CMC derived from pineapple waste collected from local society