Mapping socio-economic vulnerability and conflict in oil palm cultivation: A case study from West Papua, Indonesia
-
Meky Sagrim
 and
Deny Anjelus Iyai
and
Deny Anjelus Iyai

Abstract
The expansion of oil palm estates in West Papua, Indonesia, has had profound socio-economic and environmental impacts on local communities. This study aims to map and quantify the socio-economic vulnerable and conflict of these communities and actors in the face of increasing land use for oil palm cultivation. We used a mixed-method approach, combining socio-economic indicators to assess vulnerability and conflicts at the household level, involving 94 farmers, both Papua and non-Papua, as well as community actors. Key variables, including income diversification, access to land, social capital, and dependency on palm oil-related activities, were analysed to understand the adaptive capacities of local populations. The importance-performance analysis was conducted using Cartesian, multivariate, and stakeholder analyses, employing tools such as Excel, SmartPLS, and SocNetV software. The results indicate that land use has a positive and significant effect on both economic indicators and social variables. In contrast, perceptions negatively impact both economic participation and social variables. Social factors, while interconnected, appear to have a weaker direct effect on economic participation. Land use shows the strongest positive correlation with revenue generation, while perceptions tend to negatively affect revenue. Although social factors are related, they exert a lesser direct influence on revenue generation. The constructed model explains a considerable proportion of the variance in economic parameters, with a 36% explanatory power. Farmers have roles and functions in inducing vulnerability and conflict, including actors. This correlation matrix reveals the structural dynamics of relationships between actors in the network. Some actors play pivotal roles in connecting multiple actors, while others are more peripheral or disconnected.
1 Introduction
Over 25 million hectares of land in Indonesia are used for oil palm plantations, with a substantial portion located in Papua and Kalimantan [1,2,3]. The oil palm industry in Indonesia generated approximately $35 billion in export revenue in 2023 [4,5]. While the sector employs millions, over 70% of these jobs are low-wage positions, often with limited protections and benefits. Approximately 60–70% of land for oil palm plantations in Indonesia, particularly in Papua [6,7,8], is controlled by corporations, with minimal land allocated for community or smallholder farming. This inequity exacerbates socio-economic vulnerability among local populations who rely on the land for traditional farming, hunting, and fishing. The absence of robust legal frameworks to protect indigenous rights leaves communities vulnerable. Indigenous land rights are often disregarded or inadequately enforced, which results in recurring land disputes and legal battles [9]. Therefore, many actors, communities, and individuals are involved.
Indigenous communities in regions like West Papua often have ancestral claims to land that lack formal legal documentation, making it easier for corporations to claim and convert these lands into plantations. This has led to significant displacement of local communities. In West Papua, oil palm plantations have become a major focus of economic development due to the lucrative global demand for palm oil [10,11]. Promoted as a means to drive economic growth and alleviate poverty, oil palm cultivation has attracted significant investment and interest from both private and public stakeholders [12,13,14,15]. However, the rapid expansion of oil palm has brought complex social and economic challenges, particularly for indigenous communities and local farmers. These populations often face issues related to land ownership, environmental degradation, and unequal distribution of benefits [16]. As a result, oil palm cultivation has led to social conflicts [17,18] and economic vulnerability [19,20], highlighting the need for more sustainable and equitable land management approaches in West Papua.
Oil palm expansion in West Papua poses both opportunities and challenges for local communities. While the industry promises employment, infrastructure development, and an increase in regional revenue, it has also created conflicts over land rights, as well as economic disparities between large corporations and local communities. Often, indigenous communities are pressured to give up ancestral lands, which are then converted into oil palm plantations. This displacement disrupts traditional livelihoods and places local farmers in economically vulnerable positions. Consequently, the socio-economic dynamics in oil palm cultivation areas highlight the pressing need for policies and practices that address both development goals and social welfare [21,22].
Socio-economic resilience has become an increasingly important concept in sustainable development, especially in areas undergoing rapid economic transformation. In West Papua, Indonesia, oil palm estates have played a significant role in reshaping local livelihoods and economic structures [23]. While these estates have contributed to economic growth and provided employment opportunities, concerns have emerged about their long-term impacts on local communities, ecosystems, and socio-economic stability [22]. The sustainability of these estates and the ability of local communities to adapt to changes and challenges brought about by oil palm cultivation have been insufficiently studied.
The reality on the ground reveals that oil palm development in West Papua does not uniformly benefit all stakeholders. Although the industry has generated employment opportunities, most jobs are low-wage and offer limited economic mobility for local workers. Additionally, the commodification of ancestral lands has created social tensions between indigenous communities and the corporations that operate plantations. Without clear and enforceable policies on land rights, indigenous communities remain vulnerable to exploitation. Furthermore, the environmental impacts, including deforestation, soil degradation, and reduced biodiversity, exacerbate these social and economic vulnerabilities. This reality illustrates a widening gap between promised economic benefits and the lived experiences of local communities in West Papua.
Land conflicts occur in West Papua. Indigenous communities often lack legal ownership documentation for their ancestral lands, which facilitates their dispossession by corporations. Studies show that approximately 70% of indigenous land used for oil palm plantations lacks legal clarity [24,25], leading to increased conflicts between local communities and corporate entities. Economic inequality becomes the gap to prosperity [26,27,28]. The oil palm industry primarily benefits large corporations, with minimal economic gains reaching local communities. A significant percentage of revenue is retained by plantation companies, while local laborers receive low wages and limited job security. Environmental degradation cannot be hindered. Deforestation, soil degradation, and loss of biodiversity are common environmental consequences of oil palm plantations in West Papua. These environmental impacts undermine the natural resources that many indigenous communities depend on for traditional farming and hunting.
Local communities, particularly indigenous groups, often lack representation in decision-making processes. The absence of local voices in discussions around land use and development projects has contributed to feelings of disenfranchisement and resentment towards external stakeholders [29]. The expansion of oil palm in West Papua has intensified socio-economic vulnerabilities and land-based conflicts. Addressing these challenges requires a balanced approach that includes safeguarding indigenous land rights, ensuring fair economic opportunities for local communities, and implementing environmental protections to mitigate negative impacts on biodiversity and natural resources [30,31,32].
West Papua is a region rich in natural resources [33,34], with oil palm estates becoming one of the main drivers of economic activity over the last few decades [3]. Oil palm plantations, initially promoted as a means to enhance rural development and alleviate poverty [35,36,37], have brought mixed results. On one hand, the plantations generate income, provide jobs, and contribute to infrastructure development. On the other hand, concerns regarding environmental degradation, displacement of indigenous communities, and disruptions to traditional livelihoods have become pressing issues [38].
Socio-economic vulnerability refers to the ability of a community or system to withstand, adapt, and thrive in the face of economic, environmental, or social changes [39,40,41]. It involves multiple dimensions, including economic diversity, social networks, infrastructure stability, and access to resources. This framework is particularly relevant in analysing the complex dynamics in West Papua, where economic development through oil palm plantations intersects with traditional ways of life, environmental conservation, and social equity [42].
While numerous studies have explored the environmental impacts of oil palm plantations, less attention has been given to their socio-economic consequences, particularly in terms of community conflicts, vulnerability, and resilience. Existing research tends to focus on the economic benefits or ecological detriments in isolation without a comprehensive analysis of how oil palm estates affect the overall socio-economic resilience of local populations, including land right owners and their interlinked actors. Moreover, most of the studies are centred on regions such as Sumatra and Kalimantan [43,44], where oil palm plantations have been established for longer periods, leaving regions like West Papua underexplored. There is also a gap in the quantification of conflicts, vulnerable, and resilience, with much of the literature relying on qualitative assessments without providing measurable indicators of socio-economic vulnerability and conflicts including actors’ involvement [45,46]. This study aims to fill these gaps by providing a robust, data-driven approach to mapping and quantifying socio-economic vulnerability and conflicts in West Papua, with the goal of offering insights that could guide future policy and development strategies in oil palm-producing regions.
2 Literature review
2.1 Introduction
The rapid expansion of oil palm cultivation in Indonesia has become a focal point for discussions on sustainable development, resource management, and social equity. In regions such as West Papua, this expansion is intertwined with complex socio‐economic dynamics and emerging conflicts over land, resources, and cultural identity. This literature review synthesizes scholarly work on three interrelated areas: the socio‐economic impacts of oil palm cultivation, the conceptual frameworks of vulnerability and conflict in resource-dependent regions, and the spatial mapping techniques employed to analyse these phenomena. The review aims to contextualize the case study of West Papua within broader debates in environmental and development studies.
2.2 Oil palm cultivation in Indonesia: Socio-economic and environmental impacts
A substantial body of literature has documented the dual-edged nature of oil palm expansion in Indonesia. On one hand, palm oil is celebrated for its economic contributions, including increased export revenues, job creation, and rural development [2,47]. On the other hand, numerous studies highlight the environmental degradation and socio-economic disruptions associated with large-scale plantations. Deforestation, loss of biodiversity, and the conversion of traditional lands into commercial plantations have been linked to adverse outcomes for local communities [48]. Particularly in West Papua, researchers have pointed to the erosion of indigenous livelihoods and cultural practices, suggesting that economic benefits are often unevenly distributed while exacerbating social vulnerabilities [49].
2.3 Socio-economic vulnerability frameworks in agricultural systems
Understanding vulnerability in the context of oil palm cultivation requires a multi-dimensional framework. Scholars such as Turner [50] and Adger [51] have conceptualized vulnerability as the intersection of exposure, sensitivity, and adaptive capacity. In agrarian settings, these frameworks reveal that communities face increased risks not only from environmental hazards but also from socio-economic transformations induced by commercial agriculture. The transition from subsistence farming to plantation agriculture in Indonesia has led to significant disruptions in traditional economic practices, land tenure systems, and social networks. Such shifts leave local populations more susceptible to external shocks, including market volatility and policy changes, thereby deepening existing vulnerabilities.
2.4 Conflict in resource-dependent regions
The literature on resource-based conflicts provides critical insights into how the extraction and commercialization of natural resources can engender social and political unrest. The concept of the “resource curse” has been applied to explain paradoxical outcomes where resource abundance correlates with increased conflict and reduced governance quality [52,53]. In the context of oil palm cultivation, conflicts often emerge over issues such as land grabbing, unequal benefit sharing, and the displacement of indigenous communities. The reallocation of land for commercial purposes can lead to protracted disputes, as traditional land rights clash with state-led or corporate initiatives. This dynamic is particularly salient in West Papua, where historical grievances and contested land claims intensify the potential for conflict [54].
2.5 Mapping socio-economic vulnerability and conflict
Recent methodological advances have allowed researchers to spatially analyse vulnerability and conflict. Geographic information systems and other mapping techniques have been increasingly used to integrate socio-economic, environmental, and conflict-related data. Studies by Cutter et al. [55] and Birkmann [56] illustrate how spatial mapping can identify “hotspots” of vulnerability and conflict, providing policymakers with critical insights into where interventions may be most needed. However, while these techniques offer powerful visual and analytical tools, challenges remain. Data limitations, scale mismatches, and the need for participatory validation underscore the importance of coupling quantitative mapping with qualitative insights from local communities. In heterogeneous and often remote regions like West Papua, incorporating local knowledge is essential to accurately capture the nuances of socio-economic vulnerability and conflict dynamics.
2.6 The West Papua context: A case of intensified vulnerability and conflict
West Papua serves as a critical case study where the intersecting dynamics of oil palm cultivation, socio-economic vulnerability, and conflict are vividly manifested. Research specific to this region underscores how historical marginalization, combined with rapid economic transitions, has created a fertile ground for local conflicts. The influx of commercial interests in oil palm cultivation has led to the displacement of indigenous populations and the disruption of traditional livelihoods. Scholars argue that state policies favouring large-scale agricultural investments often neglect local socio-cultural contexts, thereby amplifying vulnerabilities and sparking localized conflicts [49,54]. Furthermore, the contested nature of land rights in West Papua – exacerbated by ambiguous tenure systems – intensifies these conflicts, making effective governance and conflict resolution particularly challenging.
2.7 Synthesis and research gaps
The literature reviewed reveals several critical themes. First, oil palm cultivation in Indonesia is a multifaceted phenomenon that simultaneously drives economic growth and exacerbates socio-economic and environmental vulnerabilities. Second, conceptual frameworks that integrate exposure, sensitivity, and adaptive capacity offer valuable lenses through which to assess these vulnerabilities, yet they must be adapted to capture the unique dynamics of local contexts such as West Papua. Third, while spatial mapping techniques have advanced our understanding of vulnerability and conflict, the need for robust, high-resolution data and participatory approaches remains paramount. Finally, despite growing scholarly attention, there is a notable gap in longitudinal and context-specific studies that explore the long-term implications of oil palm-driven socio-economic transformations and conflict in West Papua. Addressing these gaps is crucial for designing policies that promote equitable and sustainable development.
3 Materials and methods
3.1 Research sites
The field research is located between 0ʺ14′ S and 130ʺ31′ E and was carried out in Manokwari Regency [57]. Research areas in the four districts, i.e. Warmare, Prafi, Masni, and Sidey, were selected from nine districts (districts). The four districts were selected by considering large areas of oil palm plantations, fertile land, and a centre for livestock development in Manokwari, West Papua Indonesia.
3.2 Research materials and implementation
The tools used for data collection included questionnaires and measuring instruments (Appendix). The field research was conducted in coordination with the District Heads, Village Heads, and Village Extension Officers. Data were gathered from households located in communities within oil palm plantation areas.
-
Informed consent: Informed consent was obtained from all participants.
-
Ethical approval: Consent has been obtained for this research from the Committee of Animal Ethics, The University of Papua (No. of Reference letter: SP-004/UN42.3/PP/2022).
3.3 Applied parameters
Parameters employed consisted of four groups of indicators (Table 1), i.e. Social (SocVar), Land use (LandVar), Perception (PercepVar), and Economic variables (EconPar). In measuring vulnerability and conflict indicators, we designed indicators such as having customary land, social relationship amongst community, and lack of access to oil palm land, including market places. All these indicators were then mapped amongst grouped farmers, i.e. the first group for Arfak community (P0), the second group for Non Arfak Papuan (P1), and the third group for non-Papuan community (NP). The results were then entered into an Excel spreadsheet for further analysis and calculations.
Parameters, variables, and unit measurements
| Parameters | Definition | Unit/shapes of data |
|---|---|---|
| Sociology parameters (SocVar) | ||
| Soc1 = age | Age of farmers | Year |
| Soc2 = education | Education of farmers | 0 = no education,…, 5 = University |
| Soc3 = number of people in the family | Household size | Head/households |
| Soc4 = land ownership | Land belongs to farmers | Number of land/family |
| Land-use parameters (LandVar) | ||
| Lad1 = distance of land from house | Distances from farmers house (m) | Meter |
| Lad2 = allocation of working time on the land | Time spent during visits | Hours |
| Lad3 = impact of Covid-19 on land visits | Frequency of visits | 0 = no impact,…, 5 = very impact |
| Economic parameters (EconPar) | ||
| Rev1 = total assets | Total earned income | IDR |
| Rev2 = vegetable plants are profitable during a pandemic | Profitable vegetable | 0 = no sold,…, 5 = very sold |
| Rev3 = cassava plants are profitable during a pandemic | Profitable cassava | 0 = no sold,…, 5 = very sold |
| Rev4 = spice plants are profitable during a pandemic | Profitable spice | 0 = no sold,…, 5 = very sold |
| Rev5 = grass fodder plants are profitable during a pandemic | Profitable grass | 0 = no sold,…, 5 = very sold |
| Perception parameters (PercVar) | ||
| Perc1 = perception of security disturbances on land | Perceive land security | 0 = no impact,…, 5 = very impact |
| P2 = perceived feelings on the garden plot | Perceive on garden | 0 = no impact,…, 5 = very impact |
| P3 = impact of Covid-19 on basic needs (eating and drinking) | Perceive on basic need | 0 = no impact,…, 5 = very impact |
| P4 = perception of enjoying natural forests | Perceive on natural forest | 0 = no impact,…, 5 = very impact |
| P5 = perception of enjoying palm oil | Perceive on palm oil | 0 = no impact,…, 5 = very impact |
Farmer income level [58,59] was computed using formulas of cost (Cost), consisting of fixed costs and variable costs (non-fixed costs). Total costs (TC) = fixed costs (FC) + variable costs (VC). Revenue (gross income) is all income obtained from crops and livestock farming during one period calculated from sales or reassessment (IDR/season). Income (revenue) is receipts minus costs. Income = Revenue (Py⸱Y) – Total Cost (TC), where Py is the production price (IDR/kg products) and Y is the amount of production (kg/product).
3.4 Data analysis
To calculate all parameters, descriptive statistical data analysis was used by calculating mean, median, minimum, maximum, and standard deviations [60,61]. Data analysis using Cartesian graphs (often referred to as Quadrant Analysis or Importance-Performance Analysis) involves mapping data into four quadrants on the X and Y axes. Select two main variables to be analysed, for example, threat (importance of factors) as the Y axis and conflict (factor performance) as the X axis. The average of the X and Y variables will be the midpoint on the graph and serve as a boundary to divide the graph into four quadrants. Average X =
3.5 Framework model
The study model framework is created as presented in Figure 1.
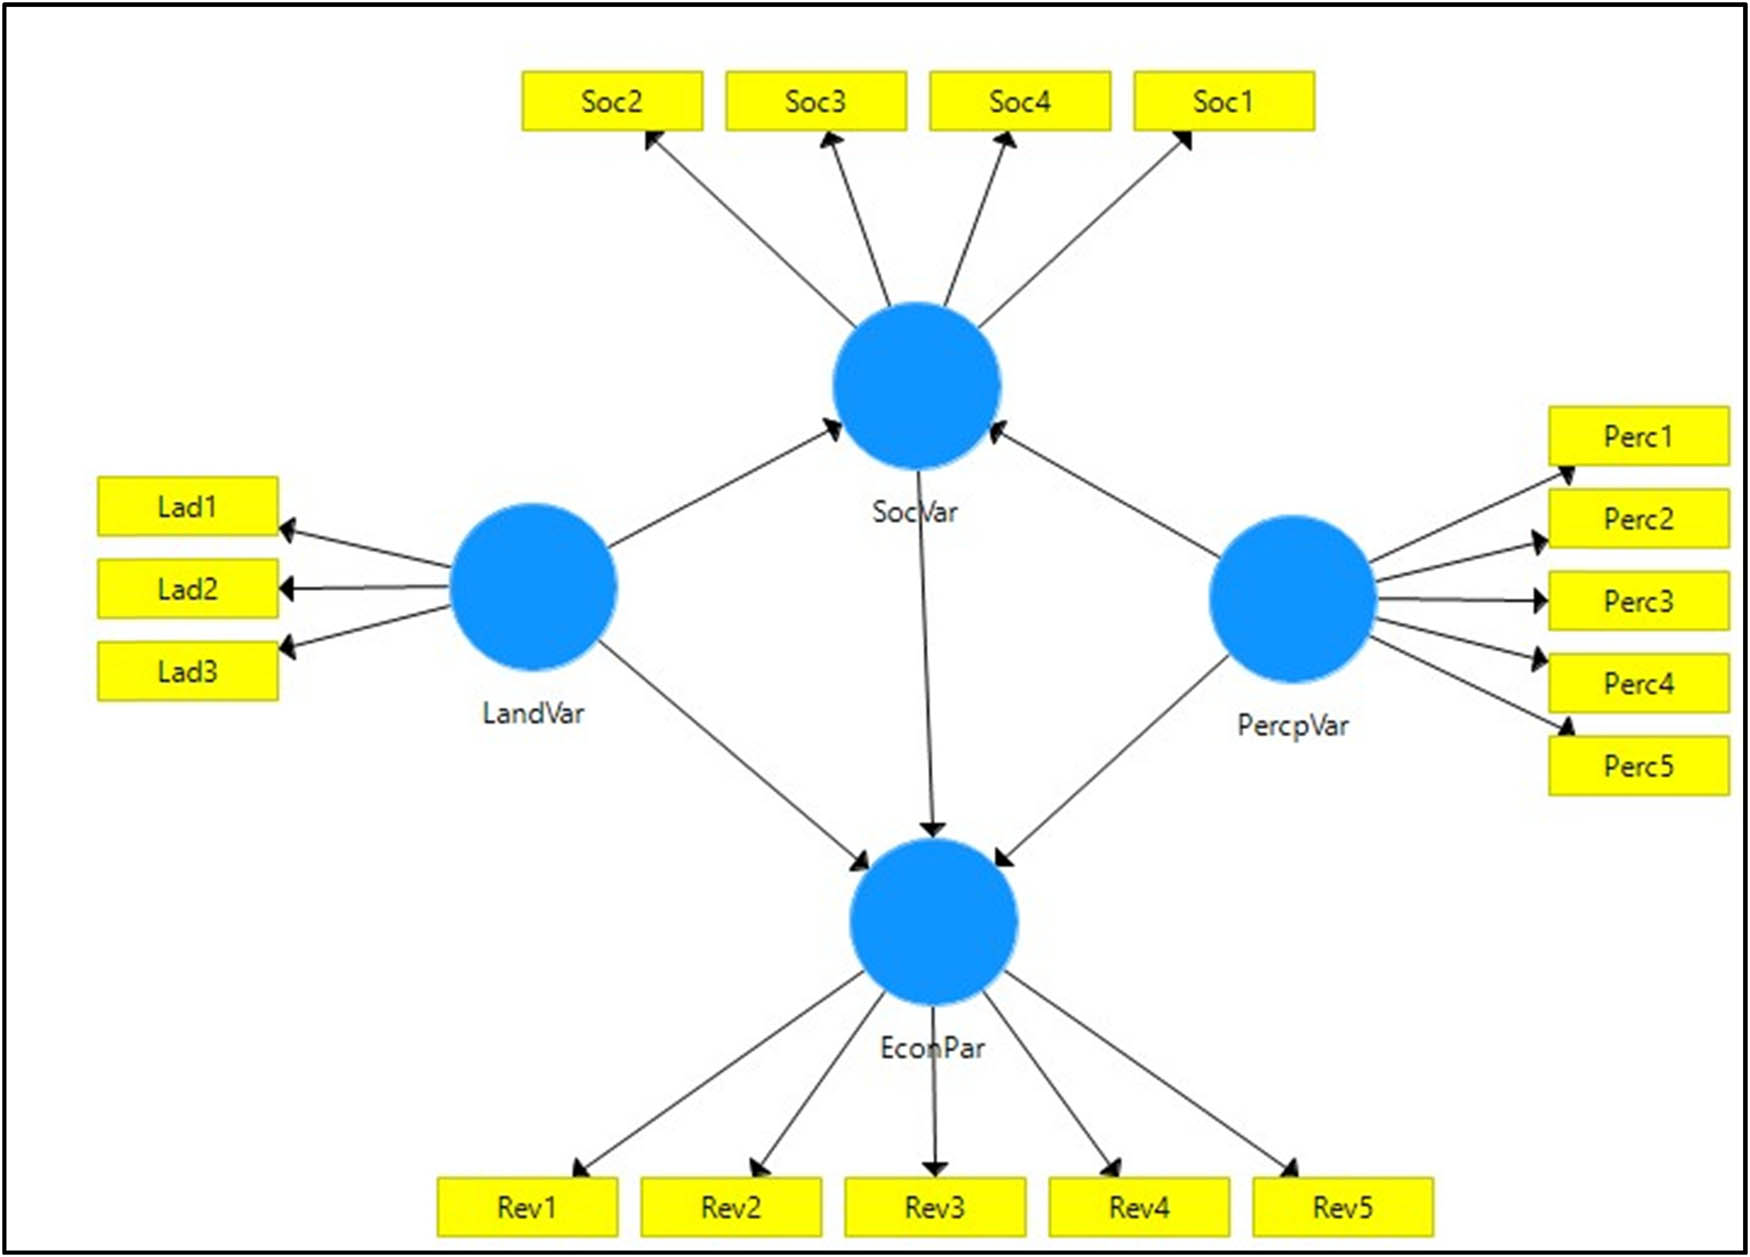
Model of SmartPLS constructed under this study.
3.6 Hypothesis
The hypothesis according to this research is that economic (EconPar) are determined by SocVar, LadVar, and PercVar. In comparison, SocVar are affected by PercVar and LadVar.
4 Results and discussions
4.1 Descriptive characteristics of parameters
The descriptive statistics show varying levels of dispersion and central tendency across the different variables (Table 2). Sociology variables, particularly Soc1 and Soc3, show high variability, while Soc4 is relatively stable.
Descriptive statistics of the parameters used to measure indicators under this study
| Mean | Median | Min | Max | Standard deviation | |
|---|---|---|---|---|---|
| Soc1 | 42.383 | 43.000 | 19.000 | 72.000 | 10.419 |
| Soc2 | 2.649 | 3.000 | 0.000 | 5.000 | 1.218 |
| Soc3 | 6.372 | 5.000 | 2.000 | 30.000 | 4.882 |
| Soc4 | 1.500 | 1.000 | 1.000 | 3.000 | 0.782 |
| Rev1 | 2.723 | 3.000 | 0.000 | 5.000 | 0.994 |
| Rev2 | 2.234 | 3.000 | 0.000 | 4.000 | 1.462 |
| Rev3 | 1.660 | 2.000 | 0.000 | 5.000 | 1.380 |
| Rev4 | 1.330 | 1.000 | 0.000 | 5.000 | 1.454 |
| Rev5 | 2.330 | 3.000 | 0.000 | 5.000 | 1.505 |
| Lad1 | 2.989 | 4.000 | 0.000 | 4.000 | 1.259 |
| Lad2 | 3.819 | 4.000 | 0.000 | 5.000 | 1.296 |
| Lad3 | 2.777 | 3.000 | 0.000 | 5.000 | 1.230 |
| Perc1 | 1.713 | 1.000 | 1.000 | 5.000 | 1.068 |
| Perc2 | 2.649 | 3.000 | 0.000 | 5.000 | 1.302 |
| Perc3 | 2.191 | 2.000 | 0.000 | 5.000 | 1.169 |
| Perc4 | 3.149 | 3.000 | 0.000 | 5.000 | 1.810 |
| Perc5 | 1.447 | 0.000 | 0.000 | 5.000 | 1.686 |
In the Economic variables, Rev2, Rev4, and Rev5 exhibit higher variability, indicating that responses are more spread out. The Land Use and Perception variables also demonstrate moderate variability, with some indicators showing a wider range of responses. These differences in the distribution of responses suggest that participants have diverse perspectives or experiences across these constructs.
4.2 Vulnerability vs conflicts
In Manokwari, West Papua, land use dynamics amongst Arfak Papuan farmers/breeders (P0), non-Arfak Papuans (P1), and NP people present various vulnerabilities and potential conflicts in oil palm plantation and agricultural activities (Figure 2). Several key factors cause them to experience varying levels of vulnerability and conflict, in terms of both socio-economic instability and disputes related to land use for livelihoods. Papuan Arfak (P0) farmers/breeders may experience low vulnerability (Not Vulnerable). This is because Arfak farmers have customary land rights. Arfak farmers also have mastery of local knowledge. High Vulnerability (Very Vulnerable) among Arfak farmers/breeders occurs when they are dependent on subsistence. Lack of Access to Markets and Modern Technology. Low Conflict (No Conflict) is caused by strong social relations within the community. Apart from that, customary land is protected by customs [65,66,67]. High Conflict (Very Conflict) is caused by the expansion of oil palm plantations. There is a factor of government or company intervention [68].
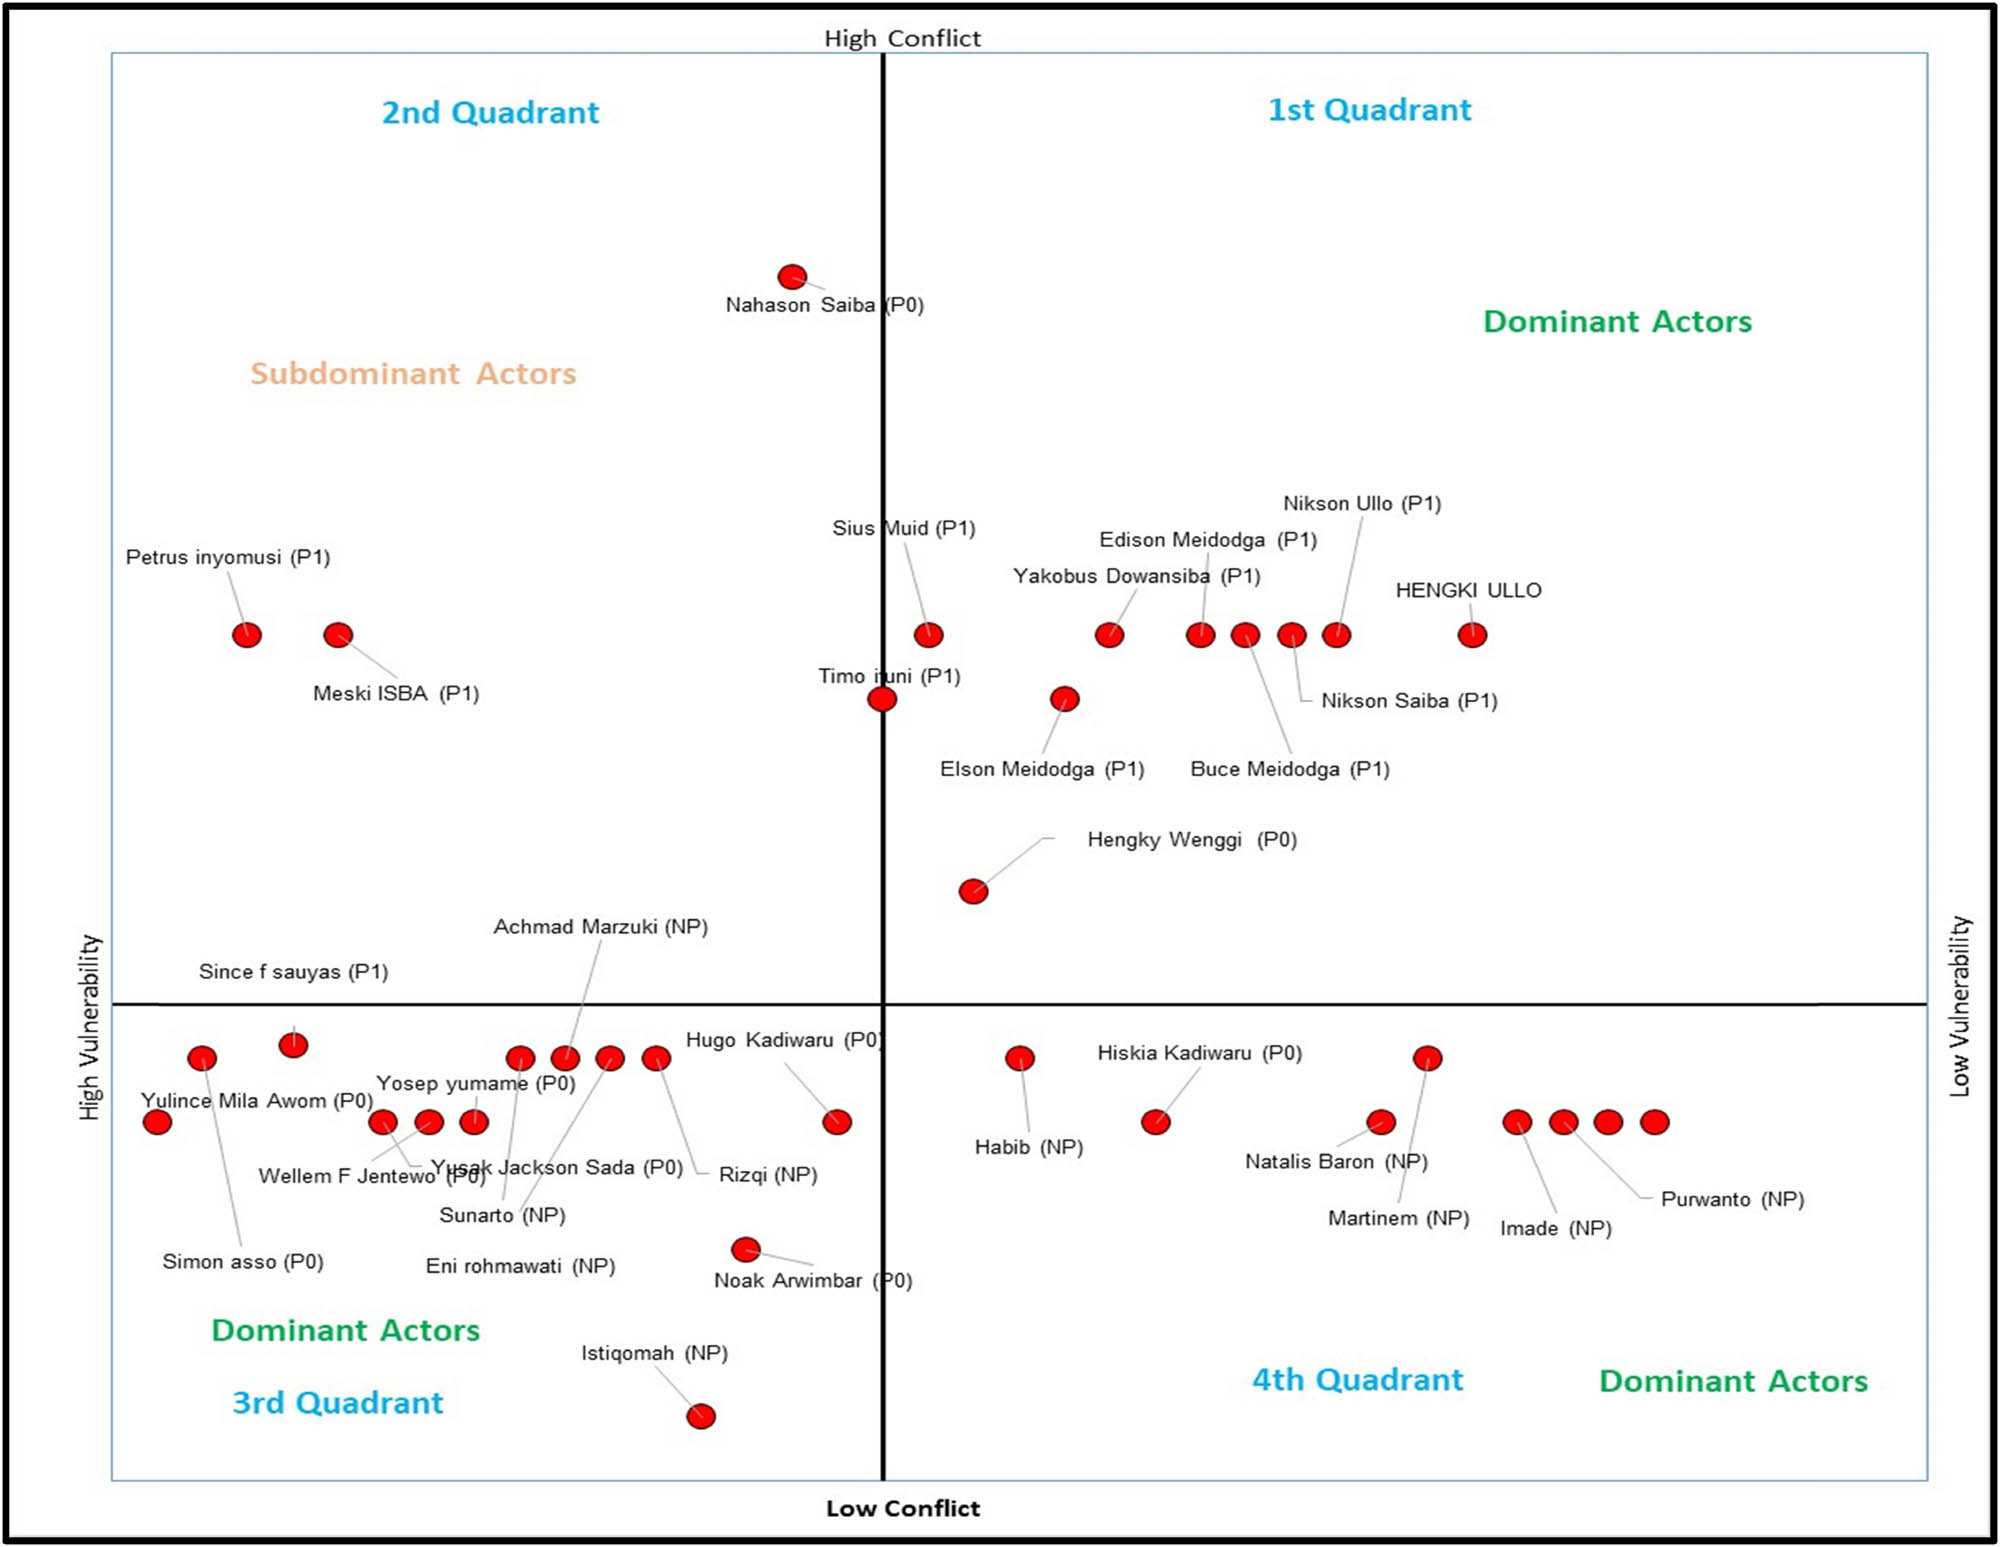
Mapping farmers from oil palm users in Manokwari. P0 = Papua farmers Non Arfak, P1 = Papua farmers (Arfak tribe, land right owners), and NP = Non Papua farmers.
Non-Arfak Papuan Farmers/Ranchers (P1) experience low vulnerability (Not Vulnerable) due to access to customary networks and collectivities. In addition, adaptation to commercial farming. The High Vulnerability (Very Vulnerable) of Non-Arfak Papuan farmers/breeders occurs due to limited land rights [69]. There are obstacles due to lack of capital and technology [21,70,71]. Low Conflict (No Conflict) is possible due to partnerships with local communities. High Conflict (Very Conflict) can occur due to differences in land and economic access. Apart from that, external intervention in land governance exists.
NP can also experience low vulnerability (Not Vulnerable) through access to capital and business networks. Apart from that, they also have the ability to adapt to agricultural technology. High Vulnerability (Very Vulnerable) occurs when there is dependence on Government and Company support. Migrant farmers/ranchers also do not have customary land rights. Low Conflict (No Conflict) can occur when migrant farmers/breeders can partner with Companies and the Government. High Conflict (Very Conflict) usually occurs when there is tension with Local Communities over land control. There may be different economic interests.
Vulnerability and potential conflict in land use in Manokwari, West Papua, is influenced by various factors including customary land rights, access to capital, local knowledge, and orientation towards commercial profits. Government and company intervention in the expansion of oil palm plantations and agricultural activities can lead to social conflict between indigenous communities and immigrants if resource management does not pay attention to local rights and traditions. Policies that respect local wisdom and accommodate economic interests in an inclusive manner can be a solution to minimize conflict and strengthen the economic and social resilience of the community in Manokwari.
4.3 Classic assumption and multicollinearity test
Figure 3 resulted from the running output of SemPLS. Calculated output of SemPLS consisted of classic assumption and multicollinearity test, validity and reliability test, path analysis, and R 2-Adj. Table 3 presents the VIF values for several indicators across different constructs. VIF is a diagnostic tool used to detect multicollinearity among independent variables in regression analysis. A high VIF indicates that an indicator is highly correlated with other indicators, potentially leading to instability in the regression coefficients. Generally, a VIF value above 5 is considered problematic, indicating strong multicollinearity, while values below 3 are acceptable and suggest low multicollinearity.
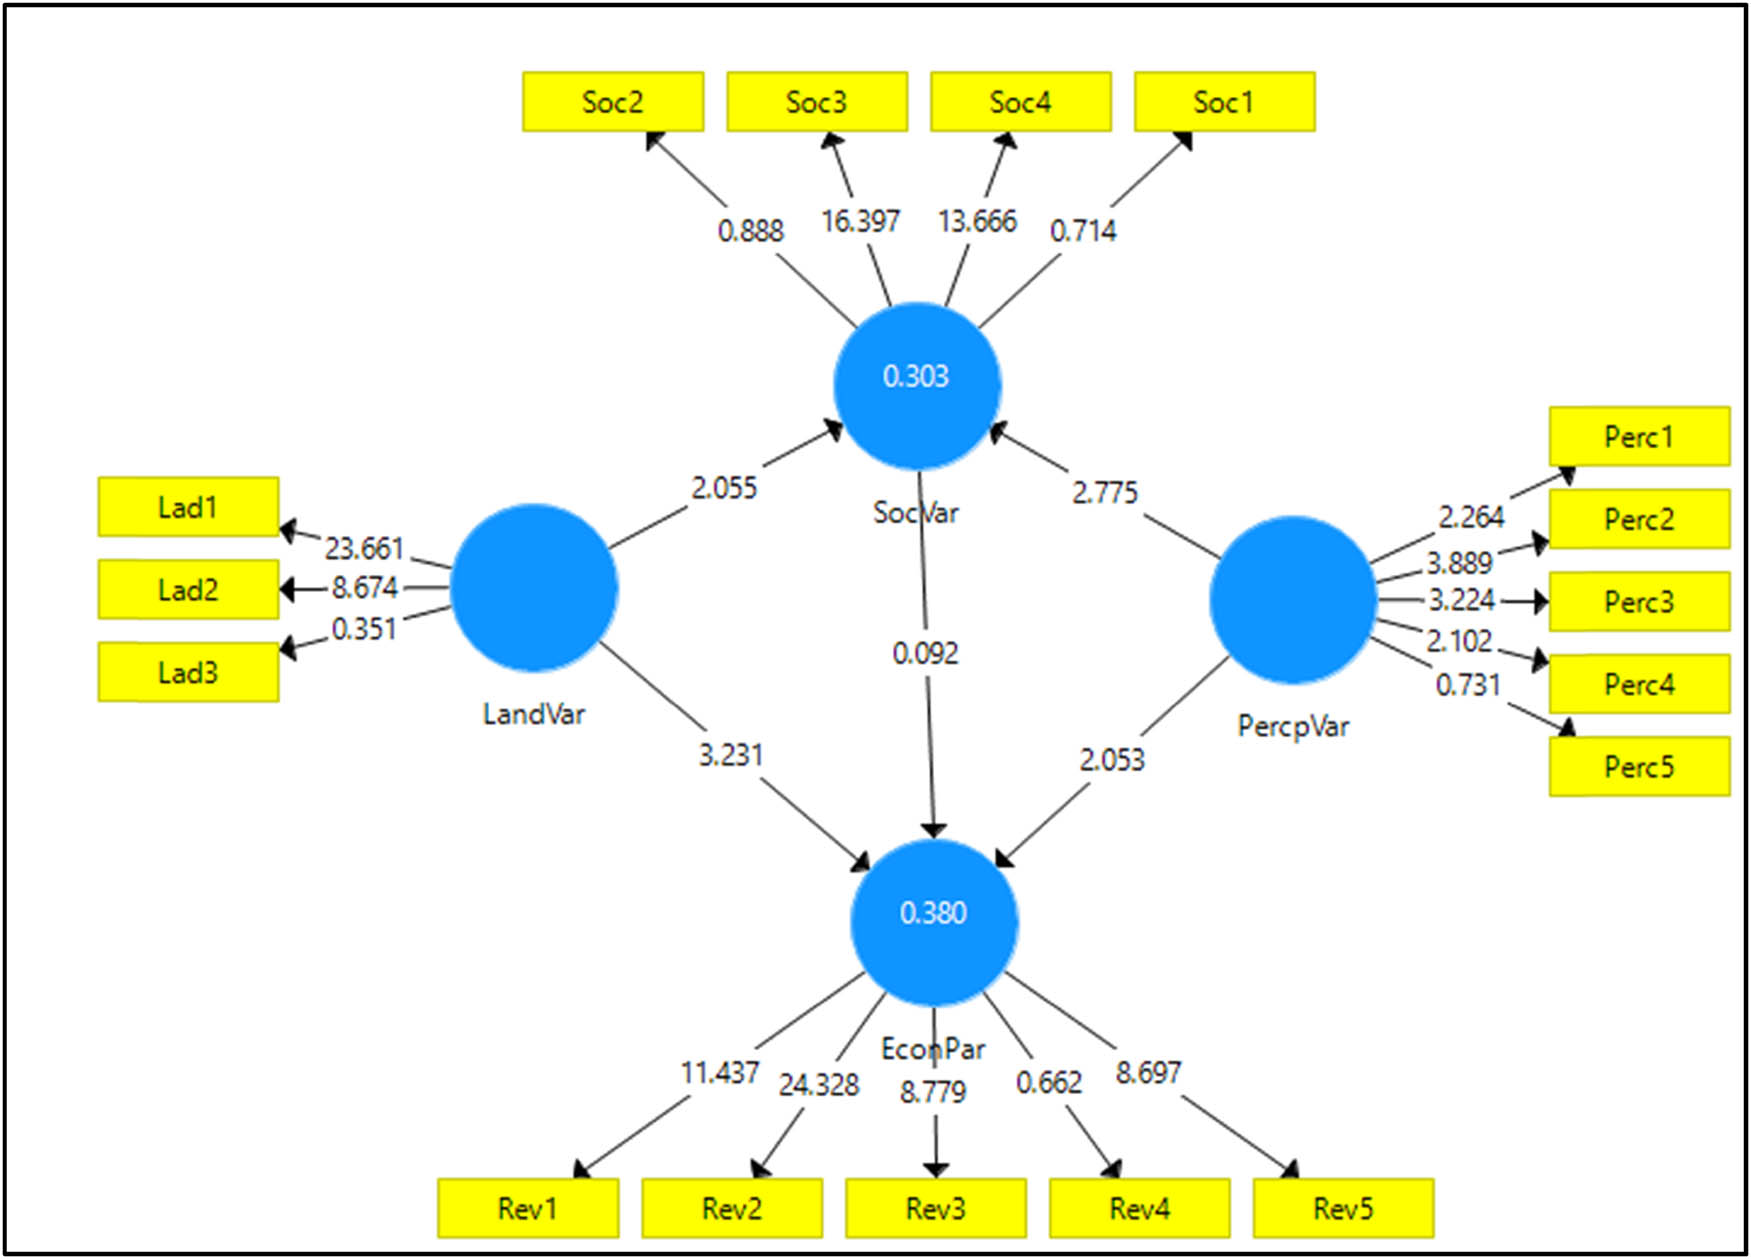
Output of SemPLS under this study.
VIF values for the collinearity test
| Parameters | VIF |
|---|---|
| Lad1 | 1.495 |
| Lad2 | 1.514 |
| Lad3 | 1.072 |
| Perc1 | 1.248 |
| Perc2 | 1.095 |
| Perc3 | 1.418 |
| Perc4 | 1.385 |
| Perc5 | 1.093 |
| Rev1 | 1.367 |
| Rev2 | 2.687 |
| Rev3 | 1.326 |
| Rev4 | 1.123 |
| Rev5 | 2.177 |
| Soc2 | 1.257 |
| Soc3 | 1.558 |
| Soc4 | 1.571 |
| Soc1 | 1.244 |
Lad1 (1.495) and Lad2 (1.514) have moderate VIF values, suggesting that these indicators do not have significant multicollinearity issues with other variables. Lad3 (1.072) shows a very low VIF, indicating minimal correlation with the other indicators. This suggests that Lad3 does not contribute to multicollinearity within the model, making it a relatively independent indicator of the Land Use construct [72].
The VIF values for Perc1 to Perc5 range between 1.093 and 1.418. Perc2 (1.095) and Perc5 (1.093) have the lowest VIF values, showing very low collinearity with other indicators. Perc3 (1.418) and Perc4 (1.385) are slightly higher but still well within the acceptable range. Overall, the Perception indicators exhibit low collinearity, meaning that the indicators for this construct are relatively independent of one another, reducing the risk of multicollinearity affecting the model’s results.
The VIF values for the Economic variable range more widely, with Rev1 (1.367), Rev3 (1.326), and Rev4 (1.123) showing acceptable values. However, Rev2 (2.687) and Rev5 (2.177) have noticeably higher VIF values, although still below the threshold of 5. This suggests that while these two indicators have a stronger correlation with other variables, they do not present severe multicollinearity concerns. Rev2, in particular, approaches a higher range, which may warrant further investigation in terms of its overlap with other economic indicators. The VIF values for the Sociology variable range from 1.244 to 1.571, all within acceptable limits. Soc3 (1.558) and Soc4 (1.571) are at the higher end but do not exceed the threshold, indicating that these variables are slightly more correlated but still manageable within the model. Soc1 (1.244) and Soc2 (1.257) show low VIF values, suggesting minimal collinearity with other indicators.
4.4 Validity and reliability test
Table 4 presents the FL, AVE, and CR values for several variables: Economic, Land Use, Perception, and Sociology. These metrics help to evaluate the validity and reliability of the measurement model in a structural equation modelling framework.
Loading factors, AVE values, and CR
| Variable | Indicators | FL | AVE | CR |
|---|---|---|---|---|
| Economic | Rev1 | 0.686 | 0.466 | 0.788 |
| Rev2 | 0.892 | |||
| Rev3 | 0.697 | |||
| Rev4 | 0.119 | |||
| Rev5 | 0.751 | |||
| Land Use | Lad1 | 0.927 | 0.508 | 0.693 |
| Lad2 | 0.810 | |||
| Lad3 | 0.090 | |||
| Perception | Percp1 | 0.490 | 0.313 | 0.329 |
| Percp2 | 0.756 | |||
| Percp3 | 0.703 | |||
| Percp4 | −0.475 | |||
| Percp5 | −0.176 | |||
| Sociology | Soc1 | −0.219 | 0.416 | 0.569 |
| Soc2 | 0.887 | |||
| Soc3 | 0.889 | |||
| Soc4 | 0.199 |
The Economic variable is represented by five indicators (Rev1 to Rev5). The FL for these indicators range from 0.119 to 0.892. Rev2 (0.892) and Rev5 (0.751) have relatively high factor loadings, indicating that they strongly contribute to the construct. Rev4 (0.119) has a very low factor loading, suggesting it may not be a significant indicator of the Economic variable. The AVE for this construct is 0.466, which is below the recommended threshold of 0.50 for convergent validity. This indicates that the Economic variable explains less than half of the variance in its indicators. The CR for the Economic variable is 0.788, which is acceptable, indicating that the indicators have adequate internal consistency.
The Land Use variable is represented by three indicators (Lad1 to Lad3). The FL range from 0.090 to 0.927. Lad1 (0.927) and Lad2 (0.810) show strong contributions to the Land Use construct, while Lad3 (0.090) has a very low loading, suggesting that it does not meaningfully reflect the construct. The AVE for Land Use is 0.508, which is slightly above the threshold of 0.50, indicating adequate convergent validity. The CR is 0.693, which is marginal but still suggests moderate internal consistency among the indicators.
The Perception variable has five indicators (Percp1 to Percp5), with FL ranging from −0.475 to 0.756. Percp2 (0.756) and Percp3 (0.703) are the strongest contributors to the Perception construct, while Percp4 (−0.475) and Percp5 (−0.176) have negative or weak loadings, indicating poor contribution. The AVE for Perception is 0.313, which is well below the acceptable threshold, indicating that the construct does not adequately explain the variance in its indicators. The CR is also very low at 0.329, suggesting poor internal consistency, meaning that the Perception variable is not measured reliably by its indicators.
The Social variable is measured by four indicators (Soc1 to Soc4). The FL range from −0.219 to 0.889. Soc2 (0.887) and Soc3 (0.889) show strong contributions to the Sociology construct, while Soc1 (−0.219) is negatively loaded, suggesting that it may not be a valid indicator for this variable. The AVE for Social is 0.416, which is below the recommended value, indicating poor convergent validity. The CR for Sociology is 0.569, which is also below the acceptable threshold of 0.70, indicating weak internal consistency among the indicators.
The analysis of Table 5 indicates that some variables, such as Economic and Land Use, demonstrate moderate reliability and validity, with relatively higher factor loadings, AVE, and CR values. However, other variables like Perception and Sociology exhibit poor validity and reliability, with low AVE and CR values and negative or low factor loadings. This suggests that improvements in the measurement model are necessary, especially for the Perception and Sociology constructs, where certain indicators may need to be revised or removed to enhance the model’s overall fit and reliability.
Path analysis of this study
| Original sample (O) | Sample mean (M) | Standard deviation (STDEV) | T-statistics (|O/STDEV|) | P values | |
|---|---|---|---|---|---|
| LandVar → EconPar | 0.375 | 0.369 | 0.116 | 3.231 | 0.001 |
| LandVar → SocVar | 0.199 | 0.208 | 0.097 | 2.055 | 0.040 |
| PercpVar → EconPar | −0.342 | −0.346 | 0.166 | 2.053 | 0.041 |
| PercpVar → SocVar | −0.431 | −0.420 | 0.155 | 2.775 | 0.006 |
| SocVar → EconPar | 0.010 | 0.029 | 0.105 | 0.092 | 0.927 |
Path Coefficient (O) 0.375 indicates a moderate positive relationship between LandVar (Land Use variables) and EconPar (economic parameters). T-statistic 3.231, which exceeds the critical value of 1.96, shows that this relationship is statistically significant. p-value 0.001 confirms strong statistical significance (p < 0.05), indicating that variations in land use have a significant positive effect on economic parameters [7,73]. LandVar to SocVar is shown by Path Coefficient (O) 0.199, indicating a weak positive relationship between LandVar and SocVar (social variables). T-statistic: 2.055 is above the threshold for statistical significance, and the p-value of 0.040 supports that the relationship is significant (p < 0.05). This suggests that land use variation has a modest but significant effect on social variables.
PercpVar to EconPar is shown by Path Coefficient (O) −0.342, indicating a moderate negative relationship between PercpVar (perception variability) and EconPar. T-statistic: 2.053, which meets the significance threshold, and the p-value of 0.041 indicates that this relationship is statistically significant. This implies that variability in perception negatively affects economic variables, meaning that unfavourable or inconsistent perceptions hinder economic parameters.
PercpVar to SocVar is shown by Path Coefficient (O) −0.431, showing a stronger negative relationship between PercpVar and SocVar. T-statistic 2.775, which is well above the significance threshold, and the p-value of 0.006 confirms that this relationship is highly significant (p < 0.01). This indicates that greater variability in perception is strongly associated with a decline in social variables, implying that inconsistent or negative perceptions adversely affect social dynamics. However, SocVar to EconPar shown by Path Coefficient (O) 0.010, suggesting almost no relationship between SocVar and EconPar. T-statistic 0.092, well below the critical value, and the P-value of 0.927 indicate that this relationship is not statistically significant. This suggests that social variables have no direct or significant impact on economic parameters in this model.
Table 6 provides the correlation matrix between various variables, including social factors (Soc1 to Soc4), revenue variables (Rev1 to Rev5), land use variables (Lad1 to Lad3), and perception variables (Perc1 to Perc5). The correlation coefficients range from −1 (perfect negative correlation) to 1 (perfect positive correlation), with 0 indicating no correlation. Soc1 shows weak positive correlations with Soc3 (r = 0.128) and Soc4 (0.082) but a moderate negative correlation with Soc2 (r = −0.432). This suggests that while some social factors are interconnected, Soc1 and Soc2 have opposing effects. Soc2 has a negative correlation with Soc3 (r = −0.096) and Soc4 (r = −0.162), indicating that Soc2 moves inversely with other social factors.
Pearson correlation matrix (r)
| Soc1 | Soc2 | Soc3 | Soc4 | Rev1 | Rev2 | Rev3 | Rev4 | Rev5 | Lad1 | Lad2 | Lad3 | Perc1 | Perc2 | Perc3 | Perc4 | Perc5 | |
|---|---|---|---|---|---|---|---|---|---|---|---|---|---|---|---|---|---|
| Soc1 | 1.000 | ||||||||||||||||
| Soc2 | −0.432 | 1.000 | |||||||||||||||
| Soc3 | 0.128 | −0.096 | 1.000 | ||||||||||||||
| Soc4 | 0.082 | −0.162 | 0.592 | 1.000 | |||||||||||||
| Rev1 | 0.017 | 0.078 | 0.151 | 0.219 | 1.000 | ||||||||||||
| Rev2 | −0.121 | 0.112 | 0.241 | 0.205 | 0.491 | 1.000 | |||||||||||
| Rev3 | −0.080 | −0.084 | 0.308 | 0.365 | 0.350 | 0.477 | 1.000 | ||||||||||
| Rev4 | 0.167 | 0.077 | −0.173 | −0.313 | 0.063 | 0.104 | 0.045 | 1.000 | |||||||||
| Rev5 | 0.046 | 0.127 | 0.209 | 0.122 | 0.275 | 0.695 | 0.305 | 0.296 | 1.000 | ||||||||
| Lad1 | 0.006 | 0.122 | 0.349 | 0.330 | 0.380 | 0.551 | 0.377 | −0.056 | 0.451 | 1.000 | |||||||
| Lad2 | 0.220 | −0.148 | 0.280 | 0.173 | 0.275 | 0.180 | 0.132 | 0.111 | 0.303 | 0.546 | 1.000 | ||||||
| Lad3 | 0.207 | −0.201 | 0.221 | 0.138 | −0.111 | −0.148 | 0.206 | −0.107 | −0.075 | −0.098 | 0.148 | 1.000 | |||||
| Perc1 | −0.229 | 0.151 | −0.116 | 0.019 | −0.125 | −0.155 | 0.006 | 0.054 | −0.093 | 0.014 | −0.099 | −0.049 | 1.000 | ||||
| Perc2 | 0.051 | 0.043 | −0.458 | −0.486 | −0.305 | −0.443 | −0.309 | 0.168 | −0.256 | −0.541 | −0.359 | 0.157 | 0.149 | 1.000 | |||
| Perc3 | −0.201 | 0.144 | −0.275 | −0.337 | −0.220 | −0.095 | −0.348 | −0.025 | −0.193 | −0.035 | −0.153 | −0.162 | 0.368 | 0.191 | 1.000 | ||
| Perc4 | 0.044 | −0.179 | 0.114 | 0.180 | 0.106 | 0.075 | 0.195 | −0.104 | 0.228 | −0.004 | 0.238 | 0.345 | −0.352 | 0.036 | −0.421 | 1.000 | |
| Perc5 | −0.053 | 0.149 | −0.175 | −0.315 | 0.309 | 0.458 | 0.125 | 0.213 | 0.378 | 0.428 | 0.212 | −0.239 | −0.094 | −0.103 | 0.086 | 0.166 | 1.000 |
Revenue variables shown by Rev1 show moderate positive correlations with Rev2 (r = 0.491) and Rev3 (0.350), suggesting that these revenue variables are interrelated. However, Rev4 and Rev5 have relatively weaker relationships with Rev1. Rev2 is strongly correlated with Rev5 (r = 0.695), indicating a close relationship between these two revenue sources. This likely reflects a shared component in how revenue is generated or perceived. Rev4 has a relatively low correlation with other revenue variables but does show a weak correlation with Rev1 (r = 0.063) and Rev5 (r = 0.296).
Lad1 correlates moderately with several revenue variables, such as Rev1 (r = 0.380) and Rev5 (r = 0.451), suggesting that land use is closely related to revenue generation. Lad2 also shows positive correlations with Rev1 (r = 0.275) and Lad1 (r = 0.546), indicating a close relationship between land use variables and some revenue sources. Lad3, however, shows weaker and even some negative correlations with the revenue variables, suggesting that its relationship with revenue generation may not be as strong or straightforward.
Perception parameters shown by Perc1 show negative correlations with Rev1 (r = −0.125) and Perc2 (r = −0.229), indicating that unfavourable perceptions may negatively impact revenue. Perc2 has strong negative correlations with Rev1 (r = −0.305) and Lad1 (r = −0.541), suggesting that negative perceptions significantly affect both revenue and land use. Perc5 shows a moderate positive correlation with **Rev5 (r = 0.378), implying that more positive perceptions are associated with increased revenue generation in some cases.
In social factors and revenue, there are weak to moderate correlations between social factors and revenue, with Soc1 generally having weak relationships with revenue variables. This suggests that social aspects may play a minor role in determining revenue, except for specific cases like Soc4 showing some moderate correlations with revenue. Land use variables, especially Lad1 and Lad2, have strong relationships with revenue variables, emphasizing the importance of land management in economic outcomes. Perception variables, especially Perc2 and Perc3, show strong negative correlations with revenue variables, indicating that negative perceptions may hinder economic success.
The R-squared adjusted value for EconPar is 0.360 (Table 7), indicating that the independent variables in the model explain 36% of the variance in economic parameters. This suggests a moderate level of explanatory power. The T-statistic of 4.250 and the P-value of 0.000 indicate that this model is statistically significant at the 1% significance level. Therefore, the independent variables have a strong and reliable influence on explaining variations in economic parameters. The R-squared adjusted value for SocVar is 0.287, indicating that the model explains 28.7% of the variance in social variables. This represents a somewhat lower level of explanatory power compared to economic participation, but it is still a meaningful result. The T-statistic of 2.738 and the P-value of 0.006 show that the model is statistically significant at the 1% significance level. This confirms that the independent variables have a statistically significant impact on the social variables.
R-squared adjusted
| Original sample (O) | Sample mean (M) | Standard deviation (STDEV) | T-statistics (|O/STDEV|) | P values | |
|---|---|---|---|---|---|
| EconPar | 0.360 | 0.420 | 0.085 | 4.250 | 0.000 |
| SocVar | 0.287 | 0.312 | 0.105 | 2.738 | 0.006 |
The model explains a considerable proportion of the variance in economic parameters, with a 36% explanatory power. The strong statistical significance (P-value = 0.000) confirms that the model effectively captures the key factors influencing economic parameters. This suggests that the independent variables used in the model (likely land use, perceptions, etc.) are reliable predictors of economic outcomes. Although the explanatory power is slightly lower at 28.7%, the model Social Variables is still statistically significant (P-value = 0.006). This suggests that while the independent variables are moderately effective in explaining social outcomes, there may be other unexplored factors that could improve the model’s explanatory power for social variables.
4.5 Actors’ involvement
This correlation matrix presents the relationships between different actors in a network using social network analysis (SNA). It measures the strength and direction of connections between each pair of actors, ranging from −1 (perfect negative correlation) to 1 (perfect positive correlation). These relationships help in understanding how actors are connected and influence each other within the network.
Strong positive correlations were seen in Actor 1 and Actor 10 (r = 0.667). These two actors are highly correlated, indicating that their actions or positions in the network are aligned. They likely share similar roles, functions, or goals within the network. Actor 6 and Actor 15 (r = 0.840) also show a strong positive correlation. This suggests a close working relationship or shared influence in the network. Actor 12 and Actor 13 (r = 1.000) have the perfect positive correlation between these actors. It means they behave identically in the network. They could represent a pair of closely linked or even the same actors in terms of influence or activities. Actor 18 and Actor 6 (r = 0.793) present a positive correlation, indicating that Actor 18 has a significant connection to Actor 6, perhaps relying on similar resources or strategies.
Negative correlations were seen in Actor 1 and Actor 2 (r = −0.167). This slight negative correlation suggests a divergence between the roles or activities of these two actors. They might represent opposing or unrelated influences in the network. While Actor 17 and Actor 16 (r = −0.076) look though weak, the negative correlation indicates a disconnection or potential conflict in goals or resources between these two actors. Actor 17 and Actor 19 (r = −0.076) are similar to the case with Actor 16; Actor 17 seems to have little to no positive interaction with Actor 19.
Identification of actors involved in the oil palm land use conflict in Manokwari district based on the analysis in Figure 2 can be ranked as many as 20 important and strategic actors or partners (Figure 4). The relationship between stakeholders in conflict and land use vulnerability is carried out using the Prominent Index method, namely Power Centrality, Radial Type, and the Force-Directed Model with the Reichterman-Reingold type. The results of the analysis on the Radial Diagram show that the centrality of power is indicated by the colour and size of the circle in the stakeholder number. The larger the circle size (Figure 5) in the stakeholder number and colour (stakeholder number 1–20) shows the level of power or bargaining position or bargaining position from certain stakeholders. It can be said here that the actors who own customary rights (actor number 20 and actor number 5) have a red colour and a relatively large circle size.
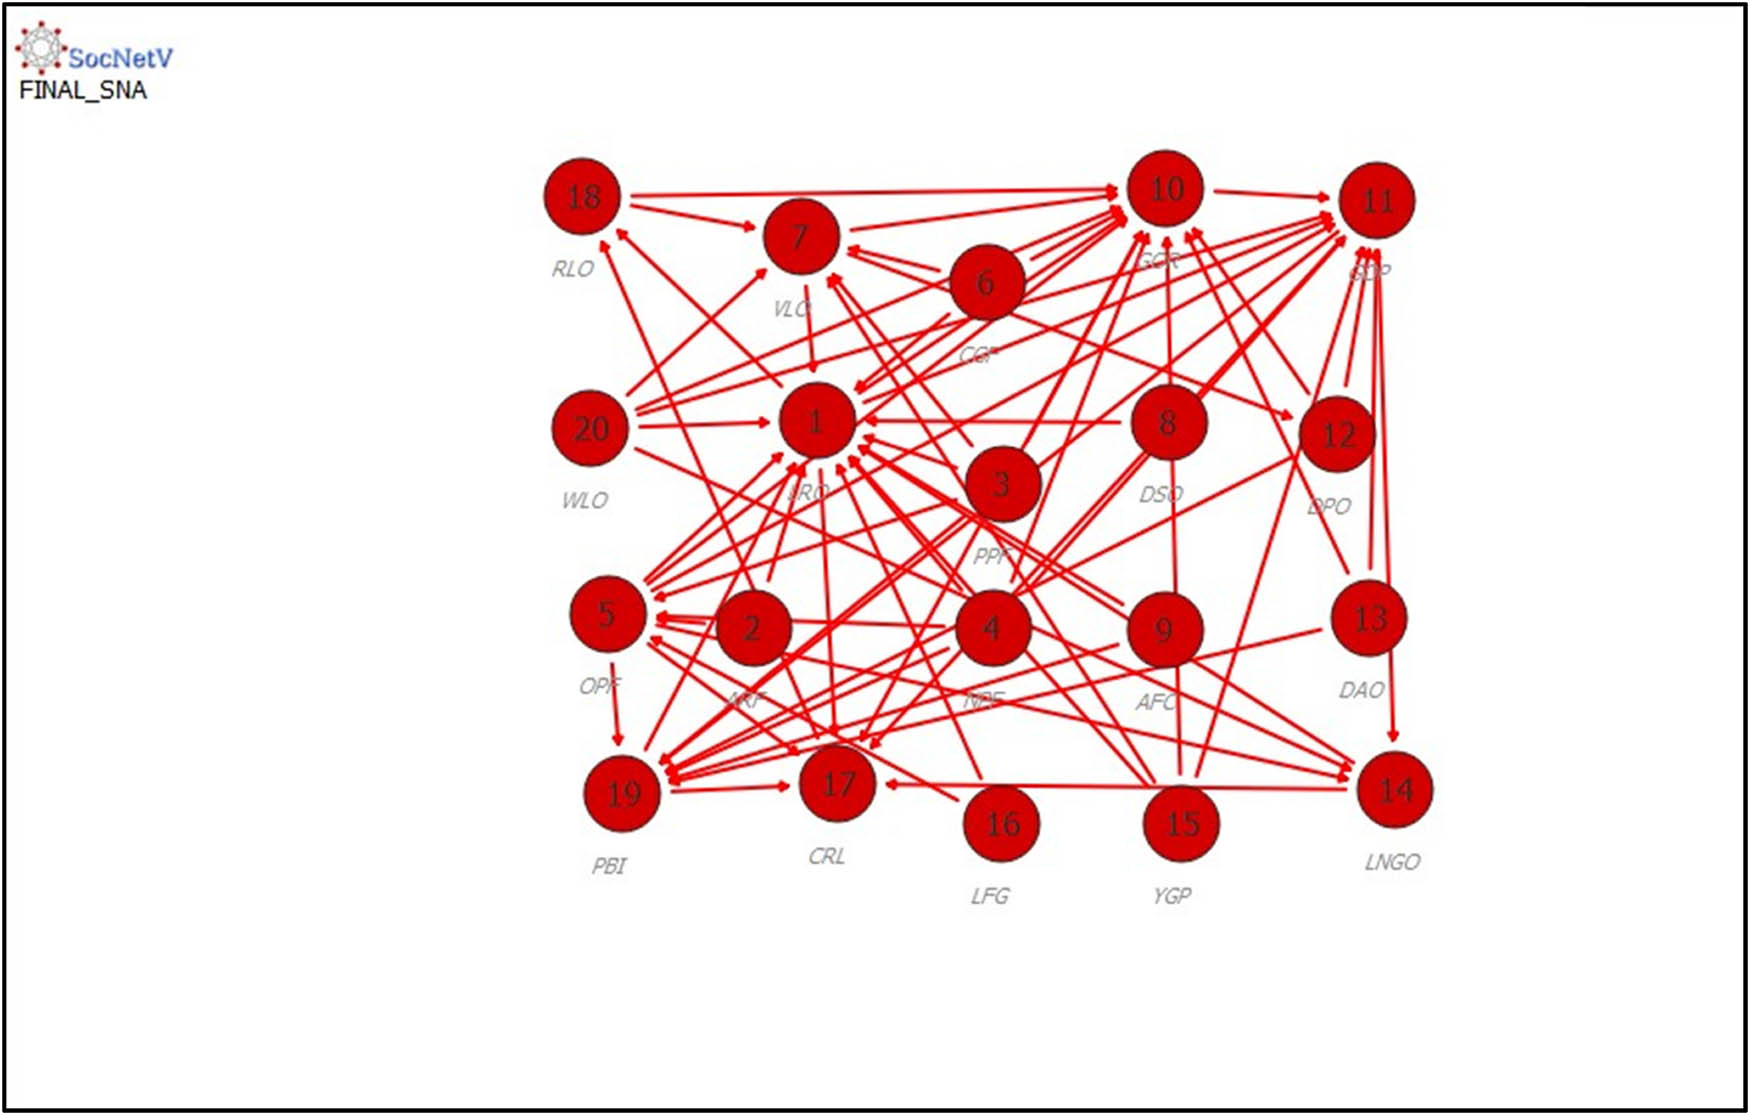
Model of SNA. 1 = LRO: Land right owners, 2 = ARF: Arfak farmers, 3 = PPF: Papuan farmers, 4 = NPF: Non-papuan farmers, 5 = OPF: Oil palm factory, 6 = CGF: Collective group of farmers, 7 = VLO: Village officers, 8 = DSO: District officers, 9 = AFC: Arfak community, 10 = GOR: Government of regency, 11 = GOP: Government of Provincial, 12 = DPO: District Police Officers, 13 = DAO: District army officers, 14 = LNGO: Local NGOs, 15 = YGP: Youth group, 16 = LFG: Livestock farmers group, 17 = CRL: Customary right leader, 18 = RLO: Religion leader officers, 19 = PBI: Private Bank Institutions, 20 = WLO = Women leader organization.
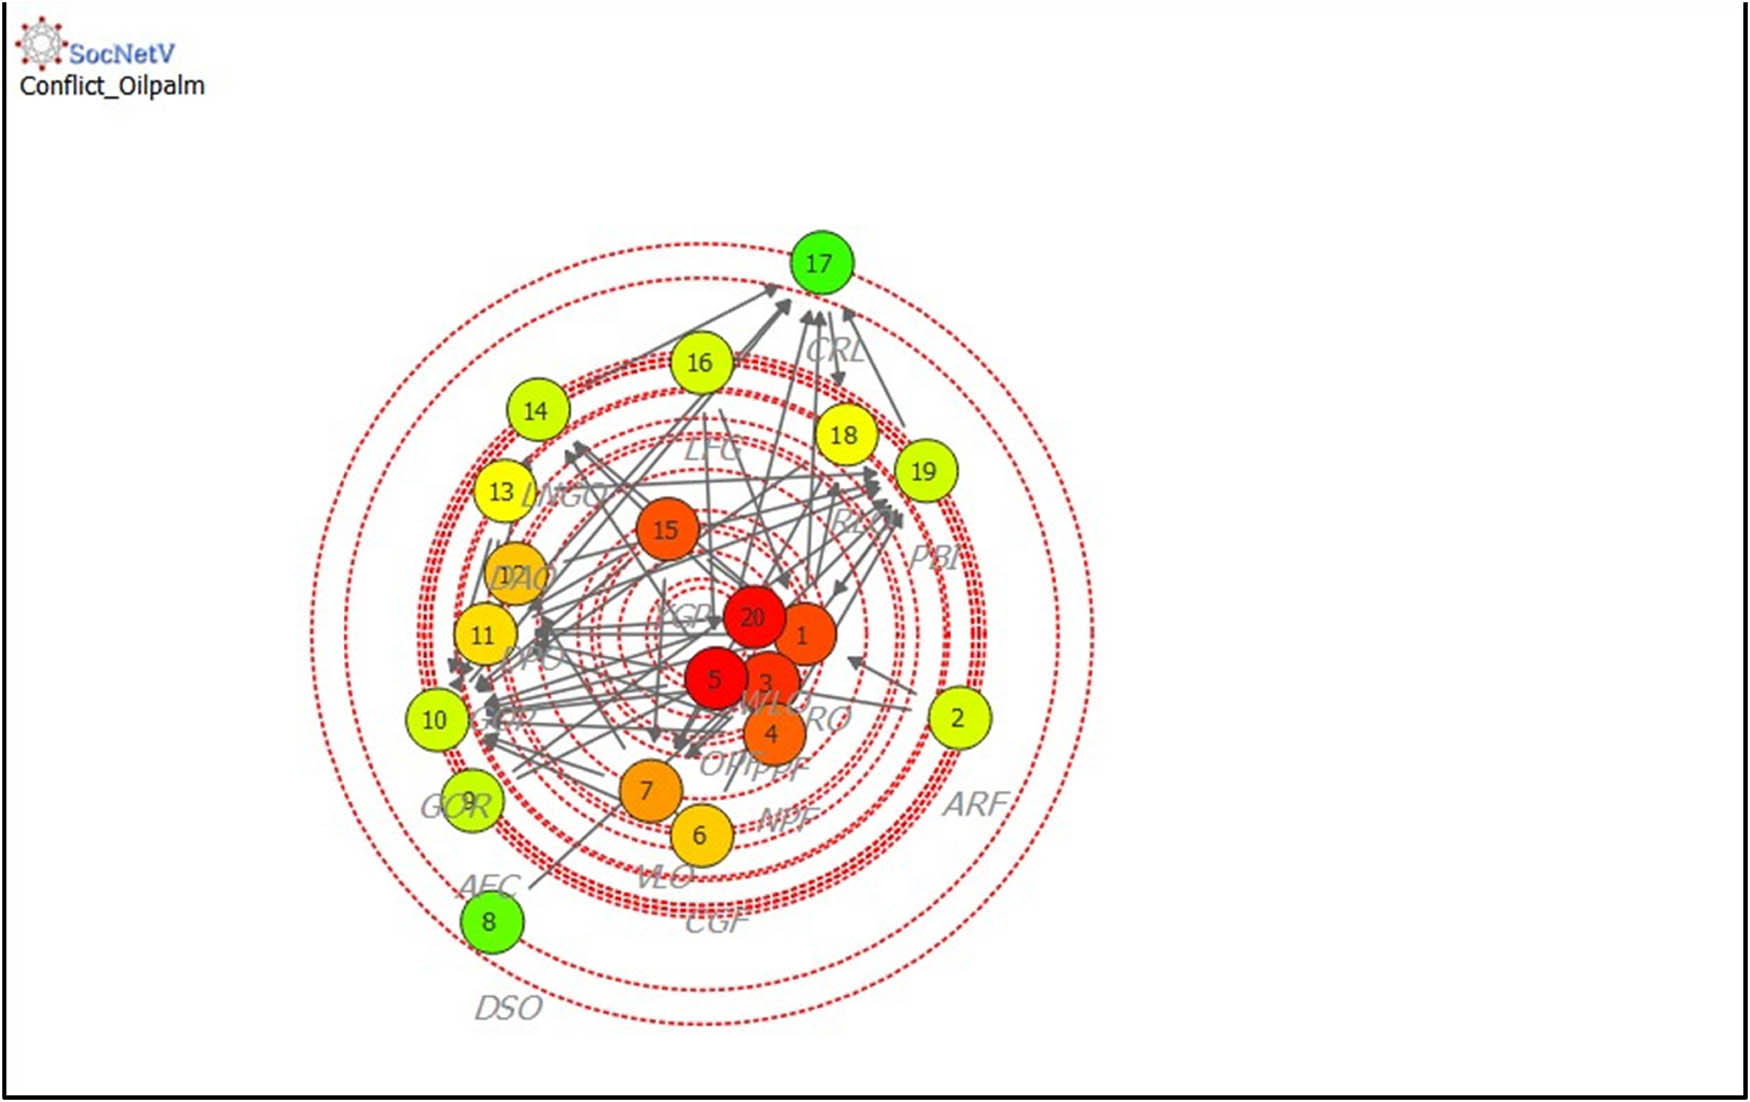
Output of model SNA analysis. 1 = LRO: Land right owners, 2 = ARF: Arfak farmers, 3 = PPF: Papuan farmers, 4 = NPF: Non-papuan farmers, 5 = OPF: Oil palm factory, 6 = CGF: Collective group of farmers, 7 = VLO: Village officers, 8 = DSO: District officers, 9 = AFC: Arfak community, 10 = GOR: Government of regency, 11 = GOP: Government of Provincial, 12 = DPO: District Police Officers, 13 = DAO: District army officers, 14 = LNGO: Local NGOs, 15 = YGP: Youth group, 16 = LFG: Livestock farmers group, 17 = CRL: Customary right leader, 18 = RLO: Religion leader officers, 19 = PBI: Private Bank Institutions, 20 = WLO = Women leader organization.
From the picture above, it can also be said that most of the other actors have quite small roles and relationships. There are 14 actors in this Radial diagram who have low relationships and bargaining positions, including actors’ numbers 17, 8, 2, 9, 10, 14, 16, 19, and followed by actors with numbers 13 and 18. Next are actors’ numbers 6, 11, 12, and 7. Meanwhile, the actors who have power are actors’ numbers 4, 15, 1, 3, 5, and 10. Quantitatively, this is shown by the results of the Pearson coefficient correlation (PCC) correlation analysis (Table 8).
Pearson correlation matrix (PCC, r)
| Actor/Actor | 1 | 2 | 3 | 4 | 5 | 6 | 7 | 8 | 9 | 10 | 11 | 12 | 13 | 14 | 15 | 16 | 17 | 18 | 19 | 20 |
|---|---|---|---|---|---|---|---|---|---|---|---|---|---|---|---|---|---|---|---|---|
| 1 | 1.000 | −0.167 | −0.000 | 0.289 | 0.491 | 0.140 | 0.140 | −0.115 | −0.167 | 0.667 | 0.140 | 0.490 | 0.490 | 0.250 | 0.375 | −0.167 | 0.459 | 0.250 | 0.250 | 0.289 |
| 2 | −0.167 | 1.000 | 0.577 | 0.577 | 0.145 | 0.327 | 0.327 | 0.688 | 0.444 | −0.111 | −0.140 | −0.140 | −0.140 | 0.444 | 0.250 | 1.000 | −0.076 | −0.111 | 0.444 | 0.192 |
| 3 | −0.000 | 0.577 | 1.000 | 0.733 | 0.378 | 0.728 | 0.404 | 0.397 | 0.577 | −0.192 | 0.081 | 0.404 | 0.404 | 0.192 | 0.577 | 0.577 | −0.132 | 0.577 | 0.192 | 0.467 |
| 4 | 0.289 | 0.577 | 0.733 | 1.000 | 0.630 | 0.404 | 0.404 | 0.397 | 0.577 | 0.192 | 0.081 | 0.728 | 0.728 | 0.192 | 0.577 | 0.577 | −0.132 | 0.192 | 0.192 | 0.467 |
| 5 | 0.491 | 0.145 | 0.378 | 0.630 | 1.000 | 0.336 | 0.336 | 0.350 | 0.509 | 0.509 | 0.642 | 0.642 | 0.642 | 0.509 | 0.491 | 0.145 | −0.150 | 0.145 | 0.509 | 0.630 |
| 6 | 0.140 | 0.327 | 0.728 | 0.404 | 0.336 | 1.000 | 0.608 | 0.546 | 0.327 | −0.140 | −0.176 | 0.216 | 0.216 | 0.327 | 0.840 | 0.327 | −0.096 | 0.793 | 0.327 | 0.728 |
| 7 | 0.140 | 0.327 | 0.404 | 0.404 | 0.336 | 0.608 | 1.000 | 0.546 | 0.327 | −0.140 | −0.176 | 0.216 | 0.216 | 0.327 | 0.490 | 0.327 | −0.096 | 0.327 | 0.327 | 0.404 |
| 8 | −0.115 | 0.688 | 0.397 | 0.397 | 0.350 | 0.546 | 0.546 | 1.000 | 0.688 | −0.076 | −0.096 | −0.096 | −0.096 | 0.688 | 0.459 | 0.688 | −0.053 | −0.076 | 0.688 | 0.397 |
| 9 | −0.167 | 0.444 | 0.577 | 0.577 | 0.509 | 0.327 | 0.327 | 0.688 | 1.000 | −0.111 | 0.327 | 0.327 | 0.327 | 0.444 | 0.250 | 0.444 | −0.076 | −0.111 | 0.444 | 0.192 |
| 10 | 0.667 | −0.111 | −0.192 | 0.192 | 0.509 | −0.140 | −0.140 | −0.076 | −0.111 | 1.000 | 0.327 | 0.327 | 0.327 | 0.444 | 0.250 | −0.111 | −0.076 | −0.111 | 0.444 | 0.192 |
| 11 | 0.140 | −0.140 | 0.081 | 0.081 | 0.642 | −0.176 | −0.176 | −0.096 | 0.327 | 0.327 | 1.000 | 0.216 | 0.216 | 0.327 | −0.210 | −0.140 | −0.096 | −0.140 | 0.327 | 0.081 |
| 12 | 0.490 | −0.140 | 0.404 | 0.728 | 0.642 | 0.216 | 0.216 | −0.096 | 0.327 | 0.327 | 0.216 | 1.000 | 1.000 | −0.140 | 0.490 | −0.140 | −0.096 | 0.327 | −0.140 | 0.404 |
| 13 | 0.490 | −0.140 | 0.404 | 0.728 | 0.642 | 0.216 | 0.216 | −0.096 | 0.327 | 0.327 | 0.216 | 1.000 | 1.000 | −0.140 | 0.490 | −0.140 | −0.096 | 0.327 | −0.140 | 0.404 |
| 14 | 0.250 | 0.444 | 0.192 | 0.192 | 0.509 | 0.327 | 0.327 | 0.688 | 0.444 | 0.444 | 0.327 | −0.140 | −0.140 | 1.000 | 0.250 | 0.444 | −0.076 | −0.111 | 1.000 | 0.192 |
| 15 | 0.375 | 0.250 | 0.577 | 0.577 | 0.491 | 0.840 | 0.490 | 0.459 | 0.250 | 0.250 | −0.210 | 0.490 | 0.490 | 0.250 | 1.000 | 0.250 | −0.115 | 0.667 | 0.250 | 0.866 |
| 16 | −0.167 | 1.000 | 0.577 | 0.577 | 0.145 | 0.327 | 0.327 | 0.688 | 0.444 | −0.111 | −0.140 | −0.140 | −0.140 | 0.444 | 0.250 | 1.000 | −0.076 | −0.111 | 0.444 | 0.192 |
| 17 | 0.459 | −0.076 | −0.132 | −0.132 | −0.150 | −0.096 | −0.096 | −0.053 | −0.076 | −0.076 | −0.096 | −0.096 | −0.096 | −0.076 | −0.115 | −0.076 | 1.000 | −0.076 | −0.076 | −0.132 |
| 18 | 0.250 | −0.111 | 0.577 | 0.192 | 0.145 | 0.793 | 0.327 | −0.076 | −0.111 | −0.111 | −0.140 | 0.327 | 0.327 | −0.111 | 0.667 | −0.111 | −0.076 | 1.000 | −0.111 | 0.577 |
| 19 | 0.250 | 0.444 | 0.192 | 0.192 | 0.509 | 0.327 | 0.327 | 0.688 | 0.444 | 0.444 | 0.327 | −0.140 | −0.140 | 1.000 | 0.250 | 0.444 | −0.076 | −0.111 | 1.000 | 0.192 |
| 20 | 0.289 | 0.192 | 0.467 | 0.467 | 0.630 | 0.728 | 0.404 | 0.397 | 0.192 | 0.192 | 0.081 | 0.404 | 0.404 | 0.192 | 0.866 | 0.192 | −0.132 | 0.577 | 0.192 | 1.000 |
Neutral or low connected/correlations actors present are represented by Actor 11 and many others (Actors 12, 13, 14). Actor 11 shows relatively low correlations (r = 0.216) with many actors, indicating it might play a more peripheral role in the network, with fewer strong ties. However, Actor 5 and Actor 10 (r = 0.509) have moderate correlation. It suggests that while there is a connection between these two actors, it is not particularly strong, possibly indicating some shared interests but limited cooperation.
Highly connected actors are shown by Actor 1. This actor shows positive correlations with several others, including Actor 4 (r = 0.289) and Actor 5 (r = 0.491). Actor 1 seems to play a central role in the network, maintaining multiple relationships. Actor 4 is showing strong correlations with several actors (e.g. Actor 3 at r = 0.733 and Actor 5 at r = 0.630), Actor 4 is likely influential in facilitating interactions across the network. Actor 15 with high positive correlations to Actor 6 (r = 0.840) and Actor 1 (r = 0.375). Actor 15 plays a key role in this network, bridging different actors together. Actors 12, 13, and 14 form a tightly connected group, with near-identical correlations across various pairs. This cluster suggests a subgroup within the network, where members are highly interconnected and possibly aligned in their activities or objectives. Actors 6, 7, and 8 show moderate positive correlations with one another, indicating a potential subgroup with shared goals or resources within the broader network.
5 Discussions
5.1 Land and resources in oil palm plantations
In Tables 1, 2, 5 and 7, it can be stated that there is a causal relationship between the parameters and indicators of the model being built. Social aspects of farmers/breeders such as education level [34,74], age maturity [75], and land ownership [20,76,77] can influence the escalation of conflict and vulnerability, thereby reducing the ability and capacity to increase welfare through maximum income. This conflict and vulnerability can build negative perceptions and limit farmers/breeders’ access to land resources and resources on oil palm plantations [78], as well as access to productive forests as a source of livelihood. This is characterized by a strong relationship between social aspects and economic impacts (Table 7). Farmers and breeders without access to land will be vulnerable, losing their ability to contribute significantly or at all to the development of agricultural and livestock activities, which serve as their primary source of income. This group of farmers/livestock will evolve to choose a more promising source of income that is free of conflict and vulnerability according to the skills and abilities they possess.
For this reason, the involvement of strategic actors or stakeholder partners [72] is necessary to immediately intervene such as increasing transparency and legal clarity on land ownership rights, building participatory mechanisms in decision-making, building a fair profit sharing or partnership system, capacity building and assistance for farmers, and application of sustainability principles [79,80,81,82].
5.2 Reduce conflict and address vulnerabilities
It can be indicated that in reducing conflict and overcoming vulnerabilities that occur in the dynamics of farmers/breeders, both as owners of customary land rights and various partners, independence and stable and strong economic strength are the main assets in maintaining harmony in the utilization and use of oil palm land [1,8,83,84,85]. Conflict and vulnerability in graphic image 2 can be grouped into four clusters, namely Low Vulnerable vs High Conflict (quadrant 1), High Vulnerable vs High Conflict (quadrant 2), High Vulnerable vs Low Conflict (quadrant 3), and Low Vulnerable vs Low Conflict (quadrant 44).
5.3 Maximizing the actor’s role
Strategic steps are needed to maximize the role of weak/vulnerable and conflict actors, especially NP community groups and non-Arfak Papuan communities who do not have customary rights to land as a resource (Figure 2). Several key factors cause them to experience varying levels of vulnerability and conflict, in terms of both socio-economic instability and disputes related to land use for livelihoods. Sources of income as presented in Tables 2, 6 and 7 indicate the role of the social, land, and perception sectors in contributing to economic improvement. Land use conflicts in graphs 2 and 5 can be seen to have a relationship of conflict and vulnerability both individually to farmers/breeders and also together with stakeholder partners (Table 9). Therefore, actors who are strong and have a role, such as regional governments, both provincial and district, can act as a buffer in reducing and reducing conflict and escalation of vulnerabilities that easily occur in social life [86].
Matrix conflict and vulnerability of farmers and community underutilization of oil palm land
| Escalation | Conflict | ||
|---|---|---|---|
| Low | High | ||
| Vulnerability | Low |
|
|
| High |
|
|
|
Vulnerability and potential conflict in land use in Manokwari, West Papua, is influenced by various factors including customary land rights [28,65,87,88,89], access to capital [90,91,92], local knowledge [93,94,95], and orientation towards commercial profits [96]. Government and company intervention in the expansion of oil palm plantations and agricultural activities can lead to social conflict between indigenous communities and immigrants if resource management does not pay attention to local rights and traditions. Policies that respect local wisdom and accommodate economic interests in an inclusive manner can be a solution to minimize conflict and strengthen the economic and social resilience of the community in Manokwari.
6 Conclusion
LandVar has a positive and significant effect on both EconPar and SocVar, indicating that effective land use management can enhance both economic and social outcomes. PercpVar negatively affects both economic participation and social variables, highlighting the detrimental impact of inconsistent or negative perceptions on economic and social performance. SocVar do not appear to have a significant direct effect on EconPar, suggesting that social factors in this context might influence economic outcomes indirectly or through other mediating variables. Land use has the strongest positive correlation with revenue generation, while perception tends to negatively affect revenue, suggesting that improving perceptions and effective land management could lead to better economic outcomes. Social factors, although interrelated, have a weaker direct effect on revenue generation.
The model demonstrates good explanatory power for both economic and social variables, with particularly strong results for economic parameters. The statistically significant results reinforce the importance of the independent variables in shaping both economic and social outcomes in the context being studied.
This correlation matrix reveals the structural dynamics of relationships between actors in the network. Some actors play pivotal roles in connecting multiple actors, while others are more peripheral or disconnected. The presence of both positive and negative correlations illustrates the diversity of relationships – ranging from collaboration to opposition – within the network. Understanding these correlations can inform strategies for improving cooperation or managing conflicts between actors.
The constructed model explains a considerable proportion of the variance in economic parameters, with a 36% explanatory power. The model effectively captures the key factors influencing economic parameters. The independent variables used in the model (likely land use, perceptions, etc.) are reliable predictors of economic outcomes. The model of Social Variables is still statistically significant. This suggests that while the independent variables are moderately effective in explaining social outcomes, there may be other unexplored factors that could improve the model’s explanatory power for social variables.
Limitations of the Research can be in terms of geographic scope, sample size and composition, temporal constraints, causality and complexity, and stakeholder representation. This study is limited to a specific region in West Papua, Indonesia, which may not fully represent the broader socio-economic conditions and conflicts related to oil palm cultivation across other regions of Indonesia. The findings may, therefore, have limited generalizability to other oil palm-growing areas. Data collection was conducted over a specific period, and any socio-economic changes or conflicts occurring after this time may not be reflected in the findings. Therefore, the results may not capture long-term trends or seasonal variations in vulnerability and conflict. While the research identifies correlations between socio-economic vulnerability and conflict, it may not fully establish causal relationships due to the complex nature of social, economic, and environmental factors that influence these issues. While the research includes farmers and community actors, it may not adequately represent all relevant stakeholders, such as government officials, corporate representatives, or environmental NGOs, whose perspectives may provide a more comprehensive understanding of the socio-economic issues surrounding oil palm cultivation.
Acknowledgements
We thanked all farmers for allowing collecting and sharing data including information. Statisticians from Papua University were grateful for consulting the statistical methods. We also thanked all blind reviewers for improving this manuscript to be readable and understandable.
-
Funding information: Authors state no funding involved.
-
Author contribution: All authors have accepted responsibility for the entire content of this manuscript and consented to its submission to the journal. MS and DAI conceptualized, managed, and wrote the final manuscript.
-
Conflict of interest: Authors state no conflict of interest.
-
Data availability statement: The data that support the findings of this study are available from the Faculty of Agriculture, Papua University, but restrictions apply to the availability of these data, which were used under license for the current study, and so are not publicly available. Data are however available from the authors upon reasonable request and with permission of the Faculty of Agriculture, Papua University.
Appendix
QUESTIONNAIRE
Research Title:
The impact of Covid-19 on farmers/breeders in utilizing oil palm land in Manokwari district, West Papua Province, Indonesia
Introduction
We will conduct research related to land use for oil palm during the Covid-19 pandemic season. We will record the answers of Farmers/Ranchers and make them into reports in policy making for local governments in formulating policies during the face of the Covid-19 pandemic. We will keep the personal identities of Farmers/Ranchers and will not be published. For this reason, we thank you for your cooperation and assistance.
1. Personal data
a.Surname:
b. Education:
| a. Not going to school, b. Completed elementary school, c. Finished junior high school, d. Graduated from high school, e. Graduated from college |
c. Number of dependents in the family:
2. Social Data
a. Total land assets:
b. Relationship between Farmers and stakeholders:
| Regional/central government | : | 0: no relationship, 1: there is a relationship |
| - 0: Negative, 1: positive | ||
| Owner of customary rights | : | 0: no relationship, 1: there is a relationship |
| - 0: Negative, 1: positive | ||
| Bank | : | 0: no relationship, 1: there is a relationship |
| - 0: Negative, 1: positive | ||
| Breeder group | : | 0: no relationship, 1: there is a relationship |
| - 0: Negative, 1: positive | ||
| Village cooperative | : | 0: no relationship, 1: there is a relationship |
| - 0: Negative, 1: positive | ||
| Village officials | : | 0: no relationship, 1: there is a relationship |
| - 0: Negative, 1: positive | ||
| Security forces (Police/Army) | : | 0: no relationship, 1: there is a relationship |
| - 0: Negative, 1: positive | ||
| College | : | 0: no relationship, 1: there is a relationship |
| - 0: Negative, 1: positive | ||
| Who else has made quite an impact? | : | 0: no relationship, 1: there is a relationship |
| - 0: Negative, 1: positive |
3. Land use data
a. Distance of land from house:
b. Time allocation for working on the land:
c. Are there any impacts while working on your land:
| a. No impact, b. little impact, c. sufficient impact, d. there is an impact, e. very impactful |
4. Economic data
Total financial assets owned:
Does the profit come from selling vegetables:
| a. No sales, b. few sales, c. enough to sell, d. there are sold, e. very sold |
Do profits come from selling cassava:
| a. No sales, b. few sales, c. enough to sell, d. there are sold, e. very sold |
Does the profit come from selling spice plants:
| a. No sales, b. few sales, c. enough to sell, d. there are sold, e. very sold |
Does the profit come from selling animal feed grass:
| a. No sales, b. few sales, c. enough to sell, d. there are sold, e. very sold |
5. Perception data
Have you encountered any safety problems while gardening?
| a. No impact, b. little impact, c. sufficient impact, d. there is an impact, e. very impactful |
What are your feelings about gardening:
| a. No impact, b. little impact, c. sufficient impact, d. there is an impact, e. very impactful |
Are your food and drink needs guaranteed during gardening during the Covid-19 pandemic:
| a. No impact, b. little impact, c. sufficient impact, d. there is an impact, e. very impactful |
Have you enjoyed the natural forest during this Covid-19 period?
| a. No impact, b. little impact, c. sufficient impact, d. there is an impact, e. very impactful |
Do you feel that during this Covid-19 period you enjoy farming on oil palm plantations:
| a. No impact, b. little impact, c. sufficient impact, d. there is an impact, e. very impactful |
Closing: This is how we collected this data. We would like to thank you for your cooperation and assistance in providing data. Greetings.
Manokwari, ……………………………2022
Researcher
References
[1] Argo A, Rahardjo K, Puji Wicaksono K. Optimalisasi Strategi Integrasi Kelapa Sawit-Sapi Pada Badan Usaha Milik Negara (BUMN) Perkebunan Di Indonesia. Profit. 2015;9(1):11–21. 10.21776/ub.profit.2015.009.01.2.Search in Google Scholar
[2] Obidzinski K, Andriani R, Komarudin H, Andrianto A. Environmental and social impacts of oil palm plantations: a critical review. Ambio. 2012;41(1):24–31.Search in Google Scholar
[3] Purba JHV, Sipayung T. Perkebunan kelapa sawit Indonesia dalam perspektif pembangunan berkelanjutan. J Ilmu-Ilmu Sos Indonesia. 2017;43(1):81–94, http://jmi.ipsk.lipi.go.id/index.php/jmiipsk/article/view/717/521.Search in Google Scholar
[4] Brad A, Schaffartzik A, Pichler M, Plank C. Contested territorialization and biophysical expansion of oil palm plantations in Indonesia. Geoforum. 2015;64:100–11. 10.1016/j.geoforum.2015.06.007.Search in Google Scholar
[5] Jafari Y, Othman J, Witzke P, Jusoh S. Risks and opportunities from key importers pushing for sustainability: The case of Indonesian palm oil. Agric Food Econ. 2017;5(1):1–16. 10.1186/s40100-017-0083-z.Search in Google Scholar
[6] Chrisendo D, Siregar H, Qaim M. Oil palm cultivation improves living standards and human capital formation in smallholder farm households. World Dev. 2022;159:106034. 10.1016/j.worlddev.2022.106034.Search in Google Scholar
[7] Tapia JF, Doliente SS, Samsatli S. How much land is available for sustainable palm oil? Land Use Policy. 2021;102:105187. 10.1016/j.landusepol.2020.105187.Search in Google Scholar
[8] Varkkey H, Tyson A, Choiruzzad SA. Palm oil intensification and expansion in Indonesia and Malaysia: Environmental and socio-political factors influencing policy. For Policy Econ. 2018;92:148–59. 10.1016/j.forpol.2018.05.002.Search in Google Scholar
[9] Castellanos-Navarrete A, Tobar-Tomás WV, López-Monzón CE. Development without change: oil palm labour regimes, development narratives, and disputed moral economies in Mesoamerica. J Rural Stud. 2019;71:169–80. 10.1016/j.jrurstud.2018.08.011.Search in Google Scholar
[10] Fatmasari R, Darma R, Salman D, Musa Y. Landscape ecological changes and livelihood dilemma of the rural household around the oil palm plantation. Int J Adv Sci Eng Inf Technol. 2018;8(6):2702–8. 10.18517/ijaseit.8.6.7257.Search in Google Scholar
[11] Glinskis EA, Gutiérrez-Vélez VH. Quantifying and understanding land cover changes by large and small oil palm expansion regimes in the Peruvian Amazon. Land Use Policy. 2019;80:95–106. 10.1016/j.landusepol.2018.09.032.Search in Google Scholar
[12] Bryson JM, Bryson JM. What to do when stakeholders matter analysis techniques. 2007;9037:20–53. 10.1080/14719030410001675722.Search in Google Scholar
[13] Chiduwa G, Chimonyo M, Halimani TE. Herd dynamic and contribution of indigenous pigs to the livelihood of rural farmers in a Semi-Arid Area of Zimbabwe. Trop Anim Health Prod. 2008;40(2):125–36.10.1007/s11250-007-9071-8Search in Google Scholar PubMed
[14] Engen S, Fauchald P, Hausner V. Stakeholders’ perceptions of protected area management following a nationwide community-based conservation reform. PLoS One. 2019;14(4):1–23.10.1371/journal.pone.0215437Search in Google Scholar PubMed PubMed Central
[15] Santos R, Antunes P, Baptista G, Mateus P, Madruga L. Stakeholder participation in the design of environmental policy mixes. Ecol Econ. 2006;60(1):100–10. 10.1016/j.ecolecon.2005.11.025.Search in Google Scholar
[16] Indrawan M, Sumule A, Wijaya A, Kapisa N, Wanggai F, Ahmad M, et al. A time for locally driven development in Papua and West Papua. Dev Pract. 2019;29(6):817–23. 10.1080/09614524.2019.1609907.Search in Google Scholar
[17] Hatting M, Long C. Exploring complex pathways in the climate change, vulnerability and violent conflict nexus: The case of Alta Verapaz, Guatemala; 2018. http://www.risk.lth.se.Search in Google Scholar
[18] McGibbon R, East-West Center Washington. Plural society in peril: migration, economic change, and the Papua Conflict. Policy Studies; 2004. http://books.google.com/books?id=CguBAAAAMAAJ.Search in Google Scholar
[19] Novira N. The vulnerability of Indonesian smallholder oil palm farmers in the times of global crisis. IOP Conf Series: Earth Environ Sci. 2023;1190(1). 10.1088/1755-1315/1190/1/012044.Search in Google Scholar
[20] Anwar Y, Wijaya A, Nanang M, Perdana MG, Samsudin RD. Study of social vulnerability in the land sector in Kutai Kartanegara. IOP Conf Ser: Earth Environ Sci. 2024;1291(1):1–10. 10.1088/1755-1315/1291/1/012023.Search in Google Scholar
[21] Mangkuprawira S. Strategi peningkatan kapasitas modal sosial dan kualitas sumber daya manusia pendamping pembangunan pertanian. Forum Penelit Agro Ekonomi. 2016;28(1):19. 10.21082/fae.v28n1.2010.19-34.Search in Google Scholar
[22] Santika T, Wilson KA, Meijaard E, Budiharta S, Law EE, Sabri M, et al. Changing landscapes, livelihoods and village welfare in the context of oil palm development. Land Use Policy. 2019;87:104073. 10.1016/j.landusepol.2019.104073.Search in Google Scholar
[23] Acosta P, Curt MD. Understanding the expansion of oil palm cultivation: A case-study in Papua. J Clean Prod. 2019;219:199–216. 10.1016/j.jclepro.2019.02.029.Search in Google Scholar
[24] Barri MF, Condro AA, Apriani I, Cahyono E, Prawardani DD, Hamdani A, et al. Papua bioregion: The forest and its people. West Java Indonesia: Forest Watch Indonesia; 2019.Search in Google Scholar
[25] Galudra G, van Noordwijk M, Idris S, Pradhan U. Hot spot of emission and confusion: Land tenure insecurity, contested policies and competing claims in the Central Kalimantan Ex-Mega Rice Project Area. Working Pap. 2010;98:1–40.10.5716/WP16601.PDFSearch in Google Scholar
[26] Cervantes-Godoy D, Dewbre J, Amegnaglo CJ, Soglo YY, Akpa AF, Bickel M, et al. The future of food and agriculture: Trends and challenges. Future Food Agric: Trends Chall. 2014;4:1951–60. www.fao.org/publications%0Ahttp://www.fao.org/3/a-i6583e.pdf%0Ahttp://siteresources.worldbank.org/INTARD/825826-1111044795683/20424536/Ag_ed_Africa.pdf%0Awww.fao.org/cfs%0Ahttp://www.jstor.org/stable/4356839%0Ahttps://ediss.uni-goettingen.de/bitstream/han.Search in Google Scholar
[27] Harrison M, Cheyne SM, Husson SJ, Jeffers KA, Smallcombe JV, Smith DAE. Preliminary Assessment of the Biodiversity and Conservation Value of the Bawan Forest, Central Kalimantan, Indonesia; 2012. www.outrop.com.Search in Google Scholar
[28] Julia, White B. Gendered experiences of dispossession: oil palm expansion in a Dayak Hibun community in West Kalimantan. J Peasant Stud. 2012;39(3–4):995–1016. 10.1080/03066150.2012.676544.Search in Google Scholar
[29] Obidzinski K, Andriani R, Komarudin H, Andrianto A. Environmental and social impacts of oil palm plantations and their implications for biofuel production in Indonesia. Ecol Soc. 2012;17(1):1–20. 10.5751/ES-04775-170125.Search in Google Scholar
[30] Gomiero T, Pimentel D, Paoletti MG. Is there a need for a more sustainable agriculture? Crit Rev Plant Sci. 2011;30(1–2):6–23. 10.1080/07352689.2011.553515.Search in Google Scholar
[31] Sayer J, Ghazoul J, Nelson P, Boedhihartono AK. Oil palm expansion transforms tropical landscapes and livelihoods. Glob Food Secur. 2012;1(2):114–19. 10.1016/j.gfs.2012.10.003.Search in Google Scholar
[32] Teuscher M, Vorlaufer M, Wollni M, Brose U, Mulyani Y, Clough Y. Trade-offs between bird diversity and abundance, yields and revenue in smallholder oil palm plantations in Sumatra, Indonesia. Biol Conserv. 2015;186:306–18. 10.1016/j.biocon.2015.03.022.Search in Google Scholar
[33] Kesaulija FF, Sadsoeitoebeon BM, Peday HF, Tokede MJ, Komarudin H, Andriani R, et al. Oil palm estate development and its impact on forests and local communities in West Papua: A case study on the Prafi Plain; 2014. http://www.cifor.org/publications/pdf_files/WPapers/WP156Komarudin.pdf%5Cnhttp://ebrary.ifpri.org/cdm/ref/collection/p15738coll5/id/4610.Search in Google Scholar
[34] Wahyudin D, Sumule A, Suwirta A. Alternatives of genuine basic education program in Papua Provinces, Indonesia. Tawarikh; J Hist Stud. 2021;12:219–40. www.journals.mindamas.com/index.php/tawarikh.Search in Google Scholar
[35] Abbas K, Li S, Xu D, Baz K, Rakhmetova A. Do socioeconomic factors determine household multidimensional energy poverty? Empirical evidence from South Asia. Energy Policy. 2020;146:111754. 10.1016/j.enpol.2020.111754.Search in Google Scholar
[36] Marcus A, Asmorowati S. Urban poverty and the rural development bias: Some notes from Indonesia. J Dev Soc. 2006;22(2):145–68. 10.1177/0169796X06065800.Search in Google Scholar
[37] Zulaika S, Fauzi FZ, Suryapuspita M. Poverty alleviation in special autonomy systems: dynamics and challenges of asymmetric decentralization. J Kebijak Pemerintah. 2024;7(1):31–42. http://ejournal/.ipdn.ac.id/JKP.10.33701/jkp.v7i1.4286Search in Google Scholar
[38] Hassan A, Akhtar S, Ishaq M. Research article analysis of livelihood asset of agricultural households influencing livelihood strategies in Khyber Pakhtunkhwa Pakistan. Sarhad J Agric. 2024;40(1):54–63. 10.17582/journal.sja/2024/40.1.54.63.Search in Google Scholar
[39] Fiore V, Borrello M, Carlucci D, Giannoccaro G, Russo S, Stempfle S, et al. The socio-economic issues of agroecology: a scoping review. Agric Food Econ. 2024;12(1):16. 10.1186/s40100-024-00311-z.Search in Google Scholar
[40] Hervas A. Cultivating vulnerability: oil palm expansion and the socio-ecological food system in the Lachuá Ecoregion, Guatemala. Reg Environ Change. 2020;20(2):1–16. 10.1007/s10113-020-01630-9.Search in Google Scholar
[41] Kok MTJ, Hilderink HBM. Towards patterns of vulnerability export-oriented agriculture and the oil palm case. Bilthhoven, The Netherlands: 2007.Search in Google Scholar
[42] Poulsen MN. Cultivating citizenship, equity, and social inclusion? Putting civic agriculture into practice through urban farming. Agric Hum Values. 2017;34(1):135–48. 10.1007/s10460-016-9699-y.Search in Google Scholar
[43] Farida WR. Diversitas tumbuhan pakan, habitat dan pemanfaatan landak (Hystrix Sp.) di Sumatera Selatan Dan Kalimantan Timur. Pros Sem Nas Masy Biodiv Indon. 2015;1:673–81. 10.13057/psnmbi/m010348.Search in Google Scholar
[44] Kamal N. Karakterisasi dan potensi pemanfaatan limbah sawit. Bandung: Itenas Library. 2018. p. 61–8.Search in Google Scholar
[45] Iyai DA, Mulyadi M, Wajo MJ, Naibey R, Hayati DN, Noviyanti N, et al. Defining and valuing the relationship pattern of actors’ involvement on cattle farming systems using Stakeholder Network Analysis in West New Guinea, Indonesia. J Ilmu Peternak Dan Vet Trop (J Trop Anim Vet Sci). 2021;11(3):180. 10.46549/jipvet.v11i3.112.Search in Google Scholar
[46] Iyai DA, Nurhayati D, Arim M, Saragih D, Orisu M, Djunaedi M, et al. Analyses of interlinked actors in determining the potential business beneficiaries of small-scale pig farming systems in West Papua, Indonesia. Heliyon. 2021;7(2):1–14. 10.1016/j.heliyon.2021.e05911.Search in Google Scholar PubMed PubMed Central
[47] Clausen L. The politics of oil palm: agricultural transformation and social change in Indonesia. J Dev Stud. 2011;47(5):789–807.Search in Google Scholar
[48] Byerlee D, Clough Y. Social and environmental impacts of oil palm expansion in Indonesia. World Dev. 2005;33(6):989–1000.Search in Google Scholar
[49] Yoseph I. Socio-cultural impacts of oil palm plantations on indigenous communities in West Papua. Indonesian J Dev Environ. 2018;3(1):45–60.Search in Google Scholar
[50] Turner. A framework for vulnerability analysis in social-ecological systems. Glob Environ Change. 2003;13(3):221–32.Search in Google Scholar
[51] Adger WN. Vulnerability. Glob Environ Change. 2006;16(3):268–81.10.1016/j.gloenvcha.2006.02.006Search in Google Scholar
[52] Collier P, Hoeffler A. Greed and grievance in civil war. Oxf Econ Pap. 2004;56(4):563–95.10.1093/oep/gpf064Search in Google Scholar
[53] Ross ML. The oil curse: how petroleum wealth shapes the development of nations. United States: Princeton University Press; 2012.10.1515/9781400841929Search in Google Scholar
[54] Smith J. Land rights and conflict in West Papua: The socio-political impacts of oil palm expansion. J Southeast Asian Stud. 2015;46(2):210–30.Search in Google Scholar
[55] Cutter SL, Boruff BJ, Shirley WL. Social vulnerability to environmental hazards. Soc Sci Q. 2003;84(2):242–61.10.1111/1540-6237.8402002Search in Google Scholar
[56] Birkmann J. Measuring vulnerability to natural hazards: Towards a multi-dimensional framework. Nat Hazards. 2006;39(1):101–18.Search in Google Scholar
[57] BPS, Manokwari. Manokwari Dalam Angka, 2019.Search in Google Scholar
[58] Hartono B, Rohaeni ES. Contribution to income of traditional beef cattle farmer households in Tanah Laut Regency, South Kalimantan, Indonesia. Livest Res Rural Dev. 2014;26(8):2014.Search in Google Scholar
[59] Hilmawan R, Aprianti Y, Vo DT, Yudaruddin R, Bintoro RF, Fitrianto Y, et al. Rural development from village funds, village-owned enterprises, and village original income. J Open Innovation: Technol Market Complex. 2023;9(4):1–11. 10.1016/j.joitmc.2023.100159.Search in Google Scholar
[60] Iyai DA, Ako A, Sirajuddin SN. Interaction of integrating land use systems on pig farming systems, West Papua-Indonesia; Worth or Worse? IOP Conf Series: Earth Environ Sci. 2020;492(1):1–8. 10.1088/1755-1315/492/1/012165.Search in Google Scholar
[61] Ab Rahman AH, Abdullah A, Selvadurai S, Zakaria SZ, Lyndon N, Abidin K. Social media literacy among oil palm smallholders in East Malaysia and association with oil palm integration practices. Sustainability (Switzerland). 2021;13(24):1–17. 10.3390/su132413802.Search in Google Scholar
[62] Kalamaras D. SocNetV: Social network analysis and visualization software; 2019.Search in Google Scholar
[63] Sinclair PA. Network centralization with the gil schmidt power centrality index. Soc Netw. 2009;31(3):214–19. 10.1016/j.socnet.2009.04.004.Search in Google Scholar
[64] Ringle CM, Sven WS, Becker JM. SmartPLS. Germany: SmartPLS GmbH; 2005.Search in Google Scholar
[65] Li TM. After the land grab: Infrastructural violence and the ‘Mafia System’ in Indonesia’s oil palm plantation zones. Geoforum. 2018;96:328–37. 10.1016/j.geoforum.2017.10.012.Search in Google Scholar
[66] Majid Cooke F. Vulnerability, control and oil palm in Sarawak: Globalization and a New Era? Dev Change. 2002;33(2):189–211. 10.1111/1467-7660.00247.Search in Google Scholar
[67] Ngidang D. Contraditions in land development schemes: the case of joint ventures in Sarawak, Malaysia. Asia Pac Viewp. 2002;43(2):157–80. 10.1111/1467-8373.00171.Search in Google Scholar
[68] Toh FA, Angwafo TE, Ndam LM, Antoine MZ. The socio-economic impact of land use and land cover change on the inhabitants of Mount Bambouto Caldera of the Western Highlands of Cameroon. Adv Remote Sens. 2018;7(1):25–45. 10.4236/ars.2018.71003.Search in Google Scholar
[69] Elmhirst R, Siscawati M, Basnett BS. Navigating investment and dispossession: Gendered impacts of the oil palm ‘Land Rush’ in East Kalimantan, Indonesia. An Int Acad Conf. 2015;69:5–6. http://rcsd.soc.cmu.ac.th.Search in Google Scholar
[70] Thurlow J, Dorosh P, Davis B. Demographic change, agriculture, and rural poverty. Sustainable food and agriculture. The food and agriculture organization of the United States; 2019. p. 31–53. 10.1016/b978-0-12-812134-4.00003-0.Search in Google Scholar
[71] Yang L, Liu M, Lun F, Min Q, Li W. The impacts of farmers’ livelihood capitals on planting decisions: A case study of Zhagana Agriculture-Forestry-Animal Husbandry Composite System. Land Use Policy. 2019;86:208–17. 10.1016/j.landusepol.2019.04.030.Search in Google Scholar
[72] Dewaelheyns V, Kerselaers E, Rogge E. A toolbox for garden governance. Land Use Policy. 2016;51:191–205. 10.1016/j.landusepol.2015.11.016.Search in Google Scholar
[73] Dislich C, Hettig E, Salecker J, Heinonen J, Lay J, Meyer KM, et al. Land-use change in oil palm dominated tropical landscapes – An agent-based model to explore ecological and socio-economic trade-offs. PLoS ONE. 2018;13(1):0–20. 10.1371/journal.pone.0190506.Search in Google Scholar PubMed PubMed Central
[74] Ultari T, Khoirunurrofik KU. The role of village-owned enterprises (BUMDes) in village development: Empirical evidence from villages in Indonesia. J Perenc Pembangunan: Indonesian J Dev Plan. 2024;8(2):256–80. 10.36574/jpp.v8i2.559.Search in Google Scholar
[75] Cameron RW, Blanuša T, Taylor JE, Salisbury A, Halstead AJ, Henricot B, et al. The domestic garden - its contribution to urban green infrastructure. Urban For Urban Green. 2012;11(2):129–37. 10.1016/j.ufug.2012.01.002.Search in Google Scholar
[76] Johnston T. Land ownership and rural development in Indonesia: A case study of West Papua. In: McCarthy JF, Robinson K, editors. Land and development in Indonesia: Searching for the people s sovereignty. Singapore: ISEAS–Yusof Ishak Institute; 2018.Search in Google Scholar
[77] Rahut DB, Ali A. Impact of climate-change risk-coping strategies on livestock productivity and household welfare: empirical evidence from Pakistan. Heliyon. 2018;4(10):e00797. 10.1016/j.heliyon.2018.e00797.Search in Google Scholar PubMed PubMed Central
[78] Runtuboi YY, Permadi DB, Sahide MAK, Maryudi A. View of oil palm plantations, forest conservation and indigenous peoples in West Papua Province: What lies ahead? For Soc. 2021;5(1):23–31.10.24259/fs.v5i1.11343Search in Google Scholar
[79] Biermann F, Kanie N, Kim RE. Global governance by goal-setting: the novel approach of the UN sustainable development goals. Curr Opin Environ Sustainability. 2017;26–27:26–31. 10.1016/j.cosust.2017.01.010.Search in Google Scholar
[80] Dharmawan AH, Mardiyaningsih DI, Rahmadian F, Yulian BE, Komarudin H, Pacheco P, et al. The agrarian, structural and cultural constraints of smallholders’ readiness for sustainability standards implementation: the case of Indonesian Sustainable Palm Oil in East Kalimantan. Sustainability (Switzerland). 2021;13(5):1–20. 10.3390/su13052611.Search in Google Scholar
[81] Ogahara Z, Jespersen K, Theilade I, Nielsen MR. Review of smallholder palm oil sustainability reveals limited positive impacts and identifies key implementation and knowledge gaps. Land Use Policy. 2022;120:106258. 10.1016/j.landusepol.2022.106258.Search in Google Scholar
[82] Wong YB, Gibbins C, Azhar B, Phan SS, Scholefield P, Azmi R, et al. Smallholder oil palm plantation sustainability assessment using multi-criteria analysis and unmanned aerial vehicles. Environ Monit Assess. 2023;195(5):577. 10.1007/s10661-023-11113-z.Search in Google Scholar PubMed PubMed Central
[83] Ayob MA, Hj Kabul MA. Cattle integration in oil palm plantation through systematic management sustainability of palm oil industry. Bogor: Faculty of Animal Science, Bogor Agriculture University; 2010. p. 23–4.Search in Google Scholar
[84] Nahlunnisa H, Zuhud EA, Santosa Y. Keanekaragaman spesies tumbuhan di areal nilai konservasi tinggi (NKT) perkebunan kelapa sawit provinsi riau. Media Konservasi. 2016;21(1):91–8.Search in Google Scholar
[85] Soedomo S. Impacts of oil palm plantation on the livelihood of the local communities and the conservation area. IOP Conf Ser: Earth Environ Sci. 2019;336(1):1–9. 10.1088/1755-1315/336/1/012004.Search in Google Scholar
[86] Mahendri IGAP, Sisriyenni D. Pengembangan Integrasi Sapi-Kelapa Sawit Untuk Meningkatkan Taraf Hidup Petani Kecil Di Riau, Indonesia. J Ris Agribisnis Dan Peternak. 2020;5(2):1–13. 10.37729/jrap.v5i2.816.Search in Google Scholar
[87] Pasaribu SI, Vanclay F, Zhao Y. Challenges to implementing socially-sustainable community development in oil palm and forestry operations in Indonesia. Land. 2020;9(3):187–98. 10.3390/land9030061.Search in Google Scholar
[88] Qaim M, Sibhatu KT, Siregar H, Grass I. Environmental, economic, and social consequences of the oil palm boom. Annu Rev Resour Econ. 2020;12:321–44. 10.1146/annurev-resource-110119-024922.Search in Google Scholar
[89] Rist L, Feintrenie L, Levang P. The livelihood impacts of oil palm: smallholders in Indonesia. Biodivers Conserv. 2010;19(4):1009–24. 10.1007/s10531-010-9815-z.Search in Google Scholar
[90] Chauke PK, Motlhatlhana ML, Pfumayaramba TK, Anim FDK. Factors influencing access to credit: a case study of smallholder farmers in the Capricorn District of South Africa. Afr J Agric Res. 2013;8(7):582–85. 10.5897/AJAR2013.6700.Search in Google Scholar
[91] Kehinde AD, Adeyemo R, Ogundeji AA. Does social capital improve farm productivity and food security? Evidence from cocoa-based farming households in Southwestern Nigeria. Heliyon. 2021;7(3):e06592. 10.1016/j.heliyon.2021.e06592.Search in Google Scholar PubMed PubMed Central
[92] Martin S, Rieple A, Chang J, Boniface B, Ahmed A. Small farmers and sustainability: Institutional barriers to investment and innovation in the Malaysian palm oil industry in Sabah. J Rural Stud. 2015;40:46–58. 10.1016/j.jrurstud.2015.06.002.Search in Google Scholar
[93] Arswimba BA, Winarti E, Aquan HM, Paulina C, Sianipar IY. Facilitating the involvement of community leaders in the development of culture-based education in Mappi District, South Papua Province. J Nalar Pendidik. 2023;11(2):94. 10.26858/jnp.v11i2.53613.Search in Google Scholar
[94] Pathan P, Khan AR, Razzaq S, Jariko G. Reduction of disaster vulnerability through Indigenous knowledge. Munich Personal RePEc Archive. 2012;39532:1–16, http://mpra.ub.uni-muenchen.de/39532/1/MPRA_paper_39532.pdf.Search in Google Scholar
[95] Reiss-Woolever VJ, Luke SH, Stone J, Shackelford GE, Turner EC. Systematic mapping shows the need for increased socio-ecological research on oil palm. Environ Res Lett. 2021;16(6):1–20. 10.1088/1748-9326/abfc77.Search in Google Scholar
[96] Azhar B, Saadun N, Prideaux M, Lindenmayer DB. The Global Palm Oil Sector Must Change to Save Biodiversity and Improve Food Security in the Tropics. J Environ Manag. 2017;203:457–66. 10.1016/j.jenvman.2017.08.021.Search in Google Scholar PubMed
© 2025 the author(s), published by De Gruyter
This work is licensed under the Creative Commons Attribution 4.0 International License.
Articles in the same Issue
- Research Articles
- Optimization of sustainable corn–cattle integration in Gorontalo Province using goal programming
- Competitiveness of Indonesia’s nutmeg in global market
- Toward sustainable bioproducts from lignocellulosic biomass: Influence of chemical pretreatments on liquefied walnut shells
- Efficacy of Betaproteobacteria-based insecticides for managing whitefly, Bemisia tabaci (Hemiptera: Aleyrodidae), on cucumber plants
- Assessment of nutrition status of pineapple plants during ratoon season using diagnosis and recommendation integrated system
- Nutritional value and consumer assessment of 12 avocado crosses between cvs. Hass × Pionero
- The lacked access to beef in the low-income region: An evidence from the eastern part of Indonesia
- Comparison of milk consumption habits across two European countries: Pilot study in Portugal and France
- Antioxidant responses of black glutinous rice to drought and salinity stresses at different growth stages
- Differential efficacy of salicylic acid-induced resistance against bacterial blight caused by Xanthomonas oryzae pv. oryzae in rice genotypes
- Yield and vegetation index of different maize varieties and nitrogen doses under normal irrigation
- Urbanization and forecast possibilities of land use changes by 2050: New evidence in Ho Chi Minh city, Vietnam
- Organizational-economic efficiency of raspberry farming – case study of Kosovo
- Application of nitrogen-fixing purple non-sulfur bacteria in improving nitrogen uptake, growth, and yield of rice grown on extremely saline soil under greenhouse conditions
- Digital motivation, knowledge, and skills: Pathways to adaptive millennial farmers
- Investigation of biological characteristics of fruit development and physiological disorders of Musang King durian (Durio zibethinus Murr.)
- Enhancing rice yield and farmer welfare: Overcoming barriers to IPB 3S rice adoption in Indonesia
- Simulation model to realize soybean self-sufficiency and food security in Indonesia: A system dynamic approach
- Gender, empowerment, and rural sustainable development: A case study of crab business integration
- Metagenomic and metabolomic analyses of bacterial communities in short mackerel (Rastrelliger brachysoma) under storage conditions and inoculation of the histamine-producing bacterium
- Fostering women’s engagement in good agricultural practices within oil palm smallholdings: Evaluating the role of partnerships
- Increasing nitrogen use efficiency by reducing ammonia and nitrate losses from tomato production in Kabul, Afghanistan
- Physiological activities and yield of yacon potato are affected by soil water availability
- Vulnerability context due to COVID-19 and El Nino: Case study of poultry farming in South Sulawesi, Indonesia
- Wheat freshness recognition leveraging Gramian angular field and attention-augmented resnet
- Suggestions for promoting SOC storage within the carbon farming framework: Analyzing the INFOSOLO database
- Optimization of hot foam applications for thermal weed control in perennial crops and open-field vegetables
- Toxicity evaluation of metsulfuron-methyl, nicosulfuron, and methoxyfenozide as pesticides in Indonesia
- Fermentation parameters and nutritional value of silages from fodder mallow (Malva verticillata L.), white sweet clover (Melilotus albus Medik.), and their mixtures
- Five models and ten predictors for energy costs on farms in the European Union
- Effect of silvopastoral systems with integrated forest species from the Peruvian tropics on the soil chemical properties
- Transforming food systems in Semarang City, Indonesia: A short food supply chain model
- Understanding farmers’ behavior toward risk management practices and financial access: Evidence from chili farms in West Java, Indonesia
- Optimization of mixed botanical insecticides from Azadirachta indica and Calophyllum soulattri against Spodoptera frugiperda using response surface methodology
- Mapping socio-economic vulnerability and conflict in oil palm cultivation: A case study from West Papua, Indonesia
- Exploring rice consumption patterns and carbohydrate source diversification among the Indonesian community in Hungary
- Determinants of rice consumer lexicographic preferences in South Sulawesi Province, Indonesia
- Effect on growth and meat quality of weaned piglets and finishing pigs when hops (Humulus lupulus) are added to their rations
- Healthy motivations for food consumption in 16 countries
- The agriculture specialization through the lens of PESTLE analysis
- Combined application of chitosan-boron and chitosan-silicon nano-fertilizers with soybean protein hydrolysate to enhance rice growth and yield
- Stability and adaptability analyses to identify suitable high-yielding maize hybrids using PBSTAT-GE
- Phosphate-solubilizing bacteria-mediated rock phosphate utilization with poultry manure enhances soil nutrient dynamics and maize growth in semi-arid soil
- Factors impacting on purchasing decision of organic food in developing countries: A systematic review
- Influence of flowering plants in maize crop on the interaction network of Tetragonula laeviceps colonies
- Bacillus subtilis 34 and water-retaining polymer reduce Meloidogyne javanica damage in tomato plants under water stress
- Vachellia tortilis leaf meal improves antioxidant activity and colour stability of broiler meat
- Evaluating the competitiveness of leading coffee-producing nations: A comparative advantage analysis across coffee product categories
- Application of Lactiplantibacillus plantarum LP5 in vacuum-packaged cooked ham as a bioprotective culture
- Evaluation of tomato hybrid lines adapted to lowland
- South African commercial livestock farmers’ adaptation and coping strategies for agricultural drought
- Spatial analysis of desertification-sensitive areas in arid conditions based on modified MEDALUS approach and geospatial techniques
- Meta-analysis of the effect garlic (Allium sativum) on productive performance, egg quality, and lipid profiles in laying quails
- Optimizing carrageenan–citric acid synergy in mango gummies using response surface methodology
- The strategic role of agricultural vocational training in sustainable local food systems
- Agricultural planning grounded in regional rainfall patterns in the Colombian Orinoquia: An essential step for advancing climate-adapted and sustainable agriculture
- Perspectives of master’s graduates on organic agriculture: A Portuguese case study
- Developing a behavioral model to predict eco-friendly packaging use among millennials
- Government support during COVID-19 for vulnerable households in Central Vietnam
- Citric acid–modified coconut shell biochar mitigates saline–alkaline stress in Solanum lycopersicum L. by modulating enzyme activity in the plant and soil
- Herbal extracts: For green control of citrus Huanglongbing
- Research on the impact of insurance policies on the welfare effects of pork producers and consumers: Evidence from China
- Investigating the susceptibility and resistance barley (Hordeum vulgare L.) cultivars against the Russian wheat aphid (Diuraphis noxia)
- Characterization of promising enterobacterial strains for silver nanoparticle synthesis and enhancement of product yields under optimal conditions
- Testing thawed rumen fluid to assess in vitro degradability and its link to phytochemical and fibre contents in selected herbs and spices
- Protein and iron enrichment on functional chicken sausage using plant-based natural resources
- Fruit and vegetable intake among Nigerian University students: patterns, preferences, and influencing factors
- Bioprospecting a plant growth-promoting and biocontrol bacterium isolated from wheat (Triticum turgidum subsp. durum) in the Yaqui Valley, Mexico: Paenibacillus sp. strain TSM33
- Quantifying urban expansion and agricultural land conversion using spatial indices: evidence from the Red River Delta, Vietnam
- LEADER approach and sustainability overview in European countries
- Influence of visible light wavelengths on bioactive compounds and GABA contents in barley sprouts
- Assessing Albania’s readiness for the European Union-aligned organic agriculture expansion: a mixed-methods SWOT analysis integrating policy, market, and farmer perspectives
- Genetically modified foods’ questionable contribution to food security: exploring South African consumers’ knowledge and familiarity
- The role of global actors in the sustainability of upstream–downstream integration in the silk agribusiness
- Multidimensional sustainability assessment of smallholder dairy cattle farming systems post-foot and mouth disease outbreak in East Java, Indonesia: a Rapdairy approach
- Enhancing azoxystrobin efficacy against Pythium aphanidermatum rot using agricultural adjuvants
- Review Articles
- Reference dietary patterns in Portugal: Mediterranean diet vs Atlantic diet
- Evaluating the nutritional, therapeutic, and economic potential of Tetragonia decumbens Mill.: A promising wild leafy vegetable for bio-saline agriculture in South Africa
- A review on apple cultivation in Morocco: Current situation and future prospects
- Quercus acorns as a component of human dietary patterns
- CRISPR/Cas-based detection systems – emerging tools for plant pathology
- Short Communications
- An analysis of consumer behavior regarding green product purchases in Semarang, Indonesia: The use of SEM-PLS and the AIDA model
- Effect of NaOH concentration on production of Na-CMC derived from pineapple waste collected from local society