A nomogram for predicting metabolic steatohepatitis: The combination of NAMPT, RALGDS, GADD45B, FOSL2, RTP3, and RASD1
-
Shenling Liao
 und
Mei Zhang
und
Mei Zhang

Abstract
Objective
To identify differentially expressed and clinically significant mRNAs and construct a potential prediction model for metabolic steatohepatitis (MASH).
Method
We downloaded four microarray datasets, GSE89632, GSE24807, GSE63067, and GSE48452, from the Gene Expression Omnibus database. The differentially expressed genes (DEGs) analysis and weighted gene co-expression network analysis were performed to screen significant genes. Finally, we constructed a nomogram of six hub genes in predicting MASH and assessed it through receiver operating characteristic (ROC) curve, calibration plot, and decision curve analysis (DCA). In addition, qRT-PCR was used for relative quantitative detection of RNA in QSG-7011 cells to further verify the expression of the selected mRNA in fatty liver cells.
Results
Based on common DEGs and brown and yellow modules, seven hub genes were identified, which were NAMPT, PHLDA1, RALGDS, GADD45B, FOSL2, RTP3, and RASD1. After logistic regression analysis, six hub genes were used to establish the nomogram, which were NAMPT, RALGDS, GADD45B, FOSL2, RTP3, and RASD1. The area under the ROC of the nomogram was 0.897. The DCA showed that when the threshold probability of MASH was 0–0.8, the prediction model was valuable to GSE48452. In QSG-7011 fatty liver model cells, the relative expression levels of NAMPT, GADD45B, FOSL2, RTP3, RASD1 and RALGDS were lower than the control group.
Conclusion
We identified seven hub genes NAMPT, PHLDA1, RALGDS, GADD45B, FOSL2, RTP3, and RASD1. The nomogram showed good performance in the prediction of MASH and it had clinical utility in distinguishing MASH from simple steatosis.
1 Introduction
Metabolic steatohepatitis (MASH), which was once named nonalcoholic steatohepatitis (NASH), is one of the stages of metabolic-associated fatty liver disease (MAFLD), which was named nonalcoholic fatty liver disease (NAFLD). MASH is developed from simple steatosis and can progress to cirrhosis and even liver cancer. A previous study reported that the overall global prevalence of NAFLD diagnosed by imaging was approximately 25.24 and 7–30% of patients with NAFLD had NASH, indicating the overall prevalence of NASH was approximately between 1.5 and 6.45% [1]. NAFLD and NASH are becoming a global economic burden [2] and result in a poor quality of life because of complications, including type 2 diabetes [3,4], cardiovascular disease [5], and chronic kidney disease [4]. The current methods of diagnosing NASH and NAFLD are serum tests and imaging. However, these methods are not specific. Present serum biomarkers are not ideal, and all biomarkers have their limitations [6,7]. Despite NAFLD can be assessed by imaging techniques such as ultrasonography, controlled attenuation parameter, MRI-based proton density fat fraction, magnetic resonance elastography, and transient elastography, these techniques primarily evaluate steatosis and fibrosis, while inflammation is hard to differentiate [8,9]. The gold standard for diagnosing NASH is the biopsy, but the biopsy is an invasive and costly method that is not easy to be accepted by patients. Therefore, developing new, noninvasive, and reliable biomarkers is undergoing. In addition to traditional serum biomarkers, genetic biomarkers are attracting much attention. Some studies identified mRNAs or microRNAs or lncRNAs in NAFLD progression or diagnosis, for instance, UBE2V1, BNIP3L mRNAs [10], miR-192, miR-21, miR-505 [11], and lncARSR [12].
In this study, we aimed to screen potential mRNAs for the diagnosis of MASH. Differentially expressed genes (DEGs) between NASH patients and healthy controls were identified in GSE89632, GSE24807, and GSE63067. Then we constructed weighted gene co-expression modules and screened significant genes in modules mostly related to the status of NAFLD. The common genes in DEGs and significant genes in modules were considered as hub genes related to the disease. Based on the decision curve analysis (DCA) and receiver operating characteristic (ROC) curve, we validated the clinical utility of the nomogram of hub genes in predicting MASH.
2 Materials and methods
2.1 Download microarray datasets
We conducted dataset searches from the Gene Expression Omnibus (GEO) database of the National Center for Biotechnology Information (https://www.ncbi.nlm.nih.gov/geo/), up to March 1, 2020. The searches included the keywords (“NASH” OR “NAFLD” OR “nonalcoholic fatty liver disease” OR “nonalcoholic steatohepatitis” OR “non-alcoholic steatohepatitis” OR “non-alcoholic fatty liver disease”) and (organism: Homo sapiens).
To be included in the bioinformatics analysis, datasets had to fulfill the following criteria: (i) study type was expression profiling by array; (ii) samples were from liver tissue; (iii) studies included control and case samples. The search and selection process are shown in Figure S1. We chose datasets with the top three sample sizes for DEGs and chose datasets that included controls, steatosis and NASH samples for weighted gene co-expression network analysis (WGCNA) and validation.
The datasets GSE89632, GSE24807, GSE63067, and GSE48452 were downloaded from the GEO database. GSE63067 included two steatosis samples, nine NASH samples, and seven healthy samples [13]. GSE89632 included 20 samples with steatosis, 19 with NASH, and 24 healthy controls [14], and the clinical traits are listed in Table 2. GSE24807 included 12 NASH samples and 5 healthy controls [15]. GSE48452 included 14 samples with steatosis, 18 with NASH, 14 controls, 27 with healthy obese [16], and samples’ clinical characteristics are shown in Table S1. The clinical information of GSE63067 and GSE24807 were not available. The data that we download and analyzed were normalized by submitters. The data in each dataset was in the same batch, except GSE24807. Median-centered values in GSE24807 are indicative that the data are normalized and cross-comparable.
GSE63067, GSE24807, and GSE89632 were used to identify DEGs. GSE89632 was analyzed with the weighted gene co-expression network. Finally, GSE48452 was used to construct and validate the prediction nomogram.
2.2 Identify DEGs
The online analysis platform GEO2R (https://www.ncbi.nlm.nih.gov/geo/geo2r/) was used to compare two groups of samples to identify DEGs. DEGs between NASH samples and healthy controls were analyzed in the datasets GSE63067 and GSE89632 respectively. p-value <0.05 and log FC absolute value >1.2 were used as a filter for the datasets GSE63067 and GSE89632. Bioinformatics analysis was based on the R software 3.6. With the Combat function in the SVA version 3.5 R package, the batch effects in GSE24807 were corrected [17], and DEGs were analyzed using the limma R package. As log FC was generally large in the dataset GSE24807, p-value <0.05 and log FC absolute value >2 were used as a filter. The common DEGs were listed and the Venn diagram was made.
2.3 Weighted gene co-expression network analysis
With WGCNA R package, clusters (modules) of highly correlated genes were found and the correlation between modules external sample traits was constructed for GSE89632 [18]. First, the top 25% of the variance of probe expression was screened to WGCNA. Samples were clustered to check samples and two samples were excluded. The soft threshold power of β = 14 (scale-free R 2 = 0.85) was set to construct modules (Figure 2a and b). External traits were related to modules and the correlation index was calculated. Disease, one of the clinical traits, meant the status of NAFLD, including simple steatosis, NASH, and healthy. The two modules most relevant to the disease, brown and yellow modules, were chosen to identify hub genes. To explore the function of genes in brown and yellow modules, Gene ontology (GO) and Kyoto encyclopedia of genes and genomes (KEGG) analyses were performed on the Metascape database [19] (http://metascape.org/gp/index.html#/main/step1).
2.4 Identification of hub genes
Based on the WGCNA R package, gene significance (GS) and connectivity between genes and genes were calculated. Kwithin was the connectivity of a gene and other genes that were in the same module. GS was the correlation between gene expression and clinical data. Then, genes in the brown and yellow module whose Kwithin was top 5% and GS p-value for the disease was <0.05 were considered as significant genes. Hub genes were the intersection of DEGs and significant genes, which were NAMPT, PHLDA1, RALGDS, GADD45B, FOSL2, RTP3, and RASD1. To further observe the relation between hub genes and clinical data, the heatmap of hub genes and samples was drawn with the pheatmap R package.
2.5 Construction and evaluation of the prediction model
GSE48452 was used to construct and validate the prediction model with the rmda, rms, and pROC R package. The data of patients with NASH or simple steatosis were normalized by zero-mean normalization. The logistic regression analysis was performed, and PHLDA1 was little contributed to MASH. Therefore, we constructed a prediction nomogram for MASH which included NAMPT, RALGDS, GADD45B, FOSL2, RTP3, and RASD1, and the predicted value of the nomogram for MASH was obtained. To evaluate the nomogram, the ROC curve, DCA, and calibration plot were performed.
2.6 Cell culture and quantitative real-time PCR
The human normal liver cell line QSG-7701 was obtained from the Cell Bank of Type Culture Collection of the Chinese Academy of Sciences, Shanghai Institutes for Biological Sciences (Shanghai, China). It was cultured in RPMI-1640 medium (Gibco, USA) with 10% fetal bovine serum, and incubated at 37°C in a humidified 5% CO2 atmosphere. At about 70% confluence, the cells were treated with or without 0.2 mM free fatty acid (palmitic acid:oleic acid = 1:2; Sigma, USA). After 16 h treatment, the cells were collected for further experiments.
Total RNA was extracted from collected cells using miRNeasy Mini Kit (Qiagen, Germany) according to the manufacturer’s instructions. The reverse transcription was performed with Reverse Transcription Kit (Qiagen, Germany) and the cDNAs were quantified by real-time PCR by Roche LightCycler96 using QuantiNova SYBR Green PCR Kit (Qiagen, Germany). Primers used for qRT-PCR are listed in Table S2. qRT-PCR was carried out with the condition of 2 min for initial denaturation, 45 cycles for denaturation at 95°C for 10 s, annealing and extension at 55°C for 20 s, and melting curves analysis at default procedure. Relative mRNA levels were calculated by the 2−ΔΔCT method and normalized by β-actin. All operations were repeated thrice.
2.7 Statistical analysis
Data were reported as mean ± SD. Student’s t-test was performed to compare differences between groups. p < 0.05 was statistically significant.
-
Ethics and consent: The ethics approval and consent to participate were not applicable.
3 Results
3.1 Identification of DEGs
The GEO2R and limma R package were applied to analyze DEGs. A total of 296 DEGs were screened in GSE89632 (p-value <0.05, log FC absolute value >1.2); 83 DEGs were screened in GSE63067 (p-value <0.05, log FC absolute value >1.2); and 1,643 DEGs were screened in GSE24807 (p-value <0.05, log FC absolute value >2). The common DEGs were presented in a Venn diagram (Figure 1) and extracted in a list (Table S3).

Venn diagram of differentially expressed genes (DEGs). Different colors represented different datasets, and the cross parts stood for common DEGs. Seven DEGs were shared with GSE24807, GSE63067, and GSE89632; nine DEGs were shared with GSE24807 and GSE63067; 29 DEGs were shared with GSE24807 and GSE89632; 13 DEGs were shared with GSE89632 and GSE63067.
3.2 Construction of weighted gene co-expression module
After the WGCNA, the cluster dendrogram is as shown in Figure 2c. There were 14 modules shown in different colors. Gray module represented genes that cannot be clustered. Brown module was mostly related to disease (correlation index = −0.77, p-value = 2 × 10⁻¹²) and steatosis (correlation index = −0.59, p-value = 2 × 10⁻⁶). Yellow module was second related to disease (correlation index = 0.67, p-value = 1 × 10⁻⁶) and steatosis (correlation index = 0.46, p-value = 3 × 10⁻⁴) (Figure 2d). Brown module and yellow module had a negative and positive relation to disease, respectively. Brown module inhibited the progress of NAFLD, while the yellow module promoted the progress of NAFLD. As a result, brown and yellow modules were selected to further analyze.

Construction of weighted gene co-expression modules and the relationship between module and trait. (a) Analysis of the soft threshold, red line = 0.85. (b) Analysis of mean connectivity. (c) Cluster dendrogram based on the dataset GSE89632. Different colors represented different co-expression gene modules. (d) Heatmap of the relationship between module and clinical trait. Each column represented clinical data, and each row represented each co-expression module. Each small grid stood for each pair of the module and trait, and indicated correlation index and p-value. Blue and red represented negative correlation and positive correlation, respectively. The deeper the color of the grid, the stronger the correlation. (e) Top five significant GO MFs, BPs, and CCs enriched by genes in brown and yellow modules. (f) KEGG pathway enriched by genes in brown and yellow modules (top 15).
There were 551 genes in the brown module and 412 genes in the yellow module. GO and KEGG pathway analyses for genes in the two modules were performed. The top five significant GO molecular functions (MFs), biological processes (BPs), and cellular components (CCs), and top 15 KEGG pathways were demonstrated (Figure 2e and f). The enriched BPs were primarily associated with response to lipopolysaccharide, leukocyte activation, cytokine, and cell death, while MF mainly enriched in DNA-binding transcription activator activity. CC chiefly enriched in secretory granule membrane and extracellular matrix. The KEGG analysis indicated that the principal enriched pathways were TNF signaling pathway, cytokine–cytokine receptor interaction, osteoclast differentiation, and AGE–RAGE signaling pathway in diabetic complications. Together, these genes highlight inflammation and inflammatory cytokines.
3.3 Identification of hub genes
Genes in the brown and yellow modules were calculated Kwithin and GS p-value. The Kwithin of repeated genes were averaged. Screened by Kwithin and GS p-value, brown module and yellow module owned 27 and 20 significant genes, respectively. Intersected by significant genes and DEGs, hub genes, seven in total, were NAMPT, PHLDA1, RALGDS, GADD45B, FOSL2, RTP3, and RASD1 (Table 1).
List of hub genes. From top to bottom, hub genes in each module were arranged by the Kwithin from large to small
| Module | Hub genes | Alias | Ensembl ID | Definition |
|---|---|---|---|---|
| Brown | NAMPT | PBEF, PBEF1, VF, VISFATIN | ENSG00000105835 | Nicotinamide phosphoribosyltransferase |
| PHLDA1 | DT1P1B11, PHRIP, TDAG51 | ENSG00000139289 | Pleckstrin homology like domain family A member 1 | |
| RALGDS | RGDS, RGF, RalGEF | ENSG00000160271 | Ral guanine nucleotide dissociation stimulator | |
| GADD45B | GADD45BETA, MYD118 | ENSG00000099860 | Growth arrest and DNA damage inducible beta | |
| FOSL2 | FRA2 | ENSG00000075426 | FOS like 2, AP-1 transcription factor subunit | |
| Yellow | RTP3 | LTM1, TMEM7, Z3CXXC3 | ENSG00000163825 | Receptor transporter protein 3 |
| RASD1 | AGS1, DEXRAS1 | ENSG00000108551 | Ras-related dexamethasone induced 1 |
The heatmap of hub genes and samples is shown, which aimed to further study the relationship between hub genes and clinical data (Figure 3). NAMPT, PHLDA1, RALGDS, GADD45B, and FOSL2 were all in the brown module, with a lower expression for steatosis and NASH samples and with a higher expression for normal samples. RTP3 in the yellow module was in high expression for steatosis and NASH samples, while RASD1 in the yellow module was in low expression for steatosis and NASH samples.

Heatmap of hub genes and samples. Each column represented one sample in the dataset GSE89632, which was annotated by clinical data in different pairs of colors. Samples were clustered. For disease, 0 (white), 1, 2 (green) represented normal sample, steatosis sample, NASH sample respectively. For steatosis, 0 (white) to 80 (purple) represented steatosis percentage. 0 (white) to 4 (blue) represented the fibrosis stage. Each row represented each hub gene. The expression of each hub gene in each sample was presented by red to blue. Red and blue represented high expression and low expression, respectively.
3.4 Clinical traits and the expression of hub genes
Through the above analysis, we finally kept 19 samples with NASH, 20 samples with simple steatosis, and 18 controls in the dataset GSE89632. The clinical characteristics and the expression of hub genes are shown in Table 2. There was no difference in age and gender, and patients with NASH or simple steatosis had higher BMI than healthy controls. The steatosis of hepatocytes, fibrosis stage, lobular inflammation severity, ballooning intensity, and NAS indicated increasing histological severity from simple steatosis to NASH. The expression of hub genes was higher in samples with NASH than in healthy controls (p-value <0.01). The expression of NAMPT, RALGDS, GADD45B, FOSL2, RASD1, and RTP3 did not statistically differ between NASH and simple steatosis, while the expression of PHLDA1 was higher in NASH than in simple steatosis (p-value <0.05).
Clinical data and the expression of hub genes in dataset GSE89632. Values given are mean (SD) or numbers of valid cases
| Clinical traits | n | NASH | n | Simple steatosis | n | Healthy controls |
|---|---|---|---|---|---|---|
| Age (years) | 19 | 43.47 (12.76) | 20 | 44.70 (9.14) | 18 | 38.67 (11.14) |
| Male, % (n) | 19 | 47.4% (9) | 20 | 70% (14) | 18 | 44.4% (8) |
| BMI (kg/m2) | 18 | 31.77 (5.45) | 19 | 28.78 (4.23) | 18 | 26.21 (4.00) |
| Steatosis (% of hepatocytes) | 19 | 45.00 (26.45) | 20 | 34.00 (24.37) | 14 | 0.39 (0.74) |
| Fibrosis stage, 0/1/2/3/4 (n) | 19 | 4/5/2/4/4 | 20 | 17/3/0/0 | 14 | 9/5/0/0 |
| Lobular inflammation severity, 0/1/2/3 (n) | 19 | 0/11/6/2 | 19 | 19/0/0/0 | 6 | 6/0/0/0 |
| Ballooning intensity, 0/1/2 (n) | 19 | 0/13/6 | 20 | 20/0/0 | 14 | 14/0/0 |
| AST(U/L) | 19 | 58.79 (28.11) | 20 | 27.25 (8.51) | 18 | 21.28 (5.94) |
| ALT (U/L) | 19 | 83.47 (39.59) | 19 | 50.84 (17.62) | 18 | 20.94 (11.50) |
| Triglycerides (mmol/L) | 17 | 2.38 (2.46) | 18 | 1.52 (0.99) | 15 | 0.96 (0.40) |
| Total cholesterol (mmol/L) | 17 | 4.98 (1.23) | 18 | 4.99 (1.17) | 15 | 4.67 (1.09) |
| Fasting glucose (mmol/L) | 17 | 6.18 (2.77) | 17 | 5.71 (1.09) | 18 | 5.03 (0.48) |
| HbA1c | 16 | 6.04% (1.07%) | 16 | 5.49% (0.44%) | 18 | 5.41% (0.50%) |
| NAS, 0–8 | 19 | 4.84 (1.17) | 19 | 1.68 (0.75) | 6 | 0.00 |
| NAMPT | 19 | 13.31 (0.21) | 20 | 13.31 (0.55) | 18 | 14.63 (0.38) |
| PHLDA1 | 19 | 12.37 (0.43) | 20 | 11.86 (0.80) | 18 | 14.28 (0.38) |
| RALGDS | 19 | 12.80 (0.32) | 20 | 12.74 (0.68) | 18 | 14.53 (0.55) |
| GADD45B | 19 | 12.90 (0.23) | 20 | 13.10 (0.60) | 18 | 14.39 (0.15) |
| FOSL2 | 19 | 10.65 (0.27) | 20 | 10.70 (0.84) | 18 | 12.68 (0.46) |
| RTP3 | 19 | 14.30 (0.17) | 20 | 14.17 (0.72) | 18 | 12.36 (1.00) |
| RASD1 | 19 | 9.47 (0.72) | 20 | 9.44 (1.10) | 18 | 11.88 (1.07) |
3.5 Model and the evaluation of nomogram
GSE48452 was used to construct a logistic regression model. The model of NAMPT, RALGDS, GADD45B, FOSL2, RTP3, and RASD1 is shown as the nomogram (Figure 4a). The calibration curve of the nomogram presented when the possibility of actual NASH was 0.4–0.8, and the nomogram might underestimate the probability (Figure 4b). The nomogram showed good prediction performance in differentiating steatosis and MASH (Figure 4c), and the area under the curve (AUC) was 0.897.

Statistical analysis for the prediction nomogram model. (a) Nomogram for distinguishing MASH and simple steatosis. All hub genes were Z-score normalized, and ZNAMPT meant the normalization data of NAMPT, and so on. (b) The calibration plot of the nomogram. The horizontal axis presented the predicted MASH, and the vertical axis was the actual diagnosis. The bias corrected line indicated the performance of the nomogram. (c) ROC curve of the model for the dataset GSE48452 to discriminate patients with simple steatosis from patients with NASH. (d) Decision analysis curve of the model for the dataset GSE48452. The horizontal axis was the threshold probability for NASH, and the probability of samples being NASH was calculated based on the prediction model. When the probability of the sample being NASH was more than the threshold probability, the sample was considered as NASH according to the model. The vertical axis was the net benefit. Gray line represented the net benefit of that all samples were NASH and were received the treatment for NASH. Black line represented the net benefit of that all samples were simple steatosis and forwent the treatment for NASH. Blue line represented the net benefit of that NASH samples predicted by the model received the treatment for NASH.
DCA calculated the net benefit without additional clinical information, such as life-years saved or quality of life improved [20]. In Figure 4d, where the threshold probability for MASH was 0–0.8, the prediction model was valuable, which meant the net benefit of the prediction model was better than treat all and treat none. Where threshold probability was more than 0.8, the prediction model was of no value, which meant the prediction model was as the same result as treat none. Therefore, the prediction model could be used for the dataset GSE48452 if the threshold probability was 0–0.8.
3.6 The relative expression of hub genes in vitro
The expression of hub genes in QSG-7011 cells with or without FFA was quantified by qRT-PCR, and the results are shown in Figure 5. The relative expressions of NAMPT, GADD45B, FOSL2, RTP3, RASD1, and RALGDS in QSG-7011 cells with 0.2 mM FFA were lower than controls, but only the expression of FOSL2 was statistically significant.

Relative expression of NAMPT, GADD45B, FOSL2, RTP3, RASD1, and RALGDS in QSG-7011 cells with or without FFA (*p < 0.05; mean ± SEM; n = 3).
4 Discussion
In the study, we used the analysis of DEGs and WGCNA to identify hub genes. Not a single gene, but clusters of highly correlated genes were detected and related to clinical traits with the use of WGCNA [18]. Through GO and KEGG analyses, we found genes in brown and yellow modules enriched in inflammation such as leukocyte activation, cytokine interaction, and TNF signaling pathway. This further confirmed that the two modules are indeed related to the progression of MASH.
GEO2R analysis obtained the DEGs between NASH samples and controls in the three datasets. These datasets were from different platforms, and so we used common DEGs to reduce the effect of different platforms. We combined common DEGs and significant genes for disease status in WGCNA to get hub genes that were able to predict NASH and distinguish NASH from steatosis. Finally, seven genes overlapped, which were NAMPT, PHLDA1, RALGDS, GADD45B, FOSL2, RTP3, and RASD1. A prediction model was constructed through logistic regression analysis. Then, we visualized the model and performed the ROC curve and decision curve analyses for the model.
Samples with NASH were different from simple steatosis in histology, including steatosis of hepatocytes, lobular inflammation severity, and ballooning intensity. Although there was no significant statistical difference in the expression of hub genes, the decision curve revealed the prediction model had clinical utility, and it had net benefit within certain risk probability. The area under the ROC curve was 0.897, and the curve illustrated that the sensitivity of the model was superior to specificity. However, we did not compare other diagnostic methods for MASH with our model, and whether the model was better than other diagnostic methods still need to be reevaluated [21].
In our study, we identified seven hub genes: NAMPT, PHLDA1, RALGDS, GADD45B, FOSL2, RTP3, and RASD1. These hub genes were considered to have a contribution to the pathogenesis of MASH. Because of the small sample size, PHLDA1 showed little contribution to MASH in regression analysis; therefore, PHLDA1 was excluded and the other six hub genes were made a logistic regression analysis. At the same time, we verified the expression of hub genes in QSG-7701 cells with FFA, and the expression of NAMPT, RALGDS, GADD45B, FOSL2, and RASD1 was consistent with the results of the bioinformatics analysis. However, the relative expression of RTP3 was lower in QSG-7701 cells with FFA than in controls, which was contrary to the WGCNA. The expression of all hub genes between groups was not statistically significant, except FOSL2, possibly because of the small sample size.
NAMPT, nicotinamide phosphoribosyltransferase, or visfatin, promotes nicotinamide to convert to nicotinamide mononucleotide (NMN). NMN finally converts to nicotinamide adenine dinucleotide (NAD), which is a vital coenzyme in cellular redox reactions in all organisms and participates in many signaling pathways [22]. NAMPT plays an important role in inflammation, and it promotes inflammation progress through NAD biosynthesis. Gerner et al. found that the inhibition of NAMPT could decrease the infiltration by inflammatory monocytes, macrophages, and T cells [23]. In our nomogram, the Z-score normalization of NAMPT is higher, and the points are higher, which indicates that NAMPT plays an important role in MASH. However, studies indicated that the deficiency of NAD played a role in aged NAFLD [24,25], and the high expression of NAMPT promoted the biosynthesis of NAD and indirectly reduced the risk of NASH by stimulating Sirt1/SREBP1 signaling pathway probably [26]. Therefore the effect of NAMPT in MASH still needs to be explored. However, a study revealed that the expression of NAMPT was of no difference between simple steatosis and NASH [25]. NAMPT also contributed to the regulation of insulin secretion in the pancreatic β-cells [22] and diabetes mellitus [27,28].
PHLDA1, pleckstrin homology like domain family A member 1, was a phosphatidylinositol-binding protein and it could suppress AKT [29]. Zhang et al. found that a high-fat diet decreased the expression of PHLDA1 in mice study, subsequently, other genes decreasing, and indicated PHLDA1 was an early biomarker of steatosis [30]. JAK2-STAT3 pathway may induce PHLDA1 expression and these proteins probably play a significant role in TLR2-mediated immune and inflammation [31].
RALGDS, Ral guanine nucleotide dissociation stimulator, is an activator of RalA. RalA and RALGDS are important to Ras-induced oncogenic transformation of cells [32]. GADD45B, growth arrest and DNA damage inducible beta, participated in p38 and JNK MAPK pathways to positively regulate apoptosis [33]. GADD45B was abundant in the kidney, liver, and lung. GADD45B was controversial in cell stress response, and it may be protective or harmful [34,35]. FOSL2, FOS like 2, AP-1 transcription factor subunit, one of FOS proteins, was implicated as regulators of cell proliferation, differentiation, and transformation. FOSL2 played an important role in diverse disease processes, mostly through the TGF-β signaling pathway [36,37]. RTP3, receptor transporter protein 3, is specific to the liver, and its expression in other tissues is little [38]. RTP3 was probably a novel candidate gene for femoral neck bone because of the significant association with hip fracture [39]. RASD1, Ras-related dexamethasone induced 1, was an activator of G-protein signaling [40]. RASD1 was probably involved in hepatic insulin resistance [41].
The study contributed to understanding the molecular mechanism of MASH from the perspective of mRNA and provided potential biomarkers for the prediction of MASH. These potential biomarkers showed good performance in predicting MASH and had clinical utility in distinguishing MASH from simple steatosis. Because the biopsy is affected by the quality of the material taken and the experience of doctors, the results of the biopsy may not fully reflect the condition of the patient. By detecting the expression of hub genes in liver cells, a predicted value is calculated by the model and it can help doctors objectively evaluate the patient’s disease status to a certain extent according to the cut-off value, and provide a reference index for less experienced doctors. Although there is still a long way before clinical application, it provides some new targets for future work.
However, the relation between hub genes and MASH or MAFLD has been studied little. It needs further study to provide more precise clinical information about diagnosis and progression. The limitations of our study should be aware of. The samples we used were not large enough. These datasets were not suitable for joint analysis as they were from different platforms. The clinical information of GSE24807 and GSE63067 were not available, which might affect the results. The baseline data of hub genes were not available, and so no comparison with baseline gene expression was made. Our model was from liver tissue, and the specificity for MASH was good. However, the expression of the model in serum needs to be observed for further evaluation.
In conclusion, NAMPT, PHLDA1, RALGDS, GADD45B, FOSL2, RTP3, and RASD1 were identified as the hub genes in the progress of MAFLD. The combination of six genes could act as a potential diagnostic model for MASH and have clinical utility in distinguishing MASH from simple steatosis. However, clinical studies with large samples are needed to further research the applicability of the model in the diagnosis for MASH.
Funding information
This work was supported by the National Natural Science Foundation of China (No. 81902142) and the Key Research and Development Project of Sichuan Science and Technology Department (No. 2020YFH0114 and No. 2020YFS0096).
-
Author contribution: L. Y. and Z. L. accessed literature and screened datasets. Y. Z., H. H., and S. L. analyzed data. S. L. and H. H. wrote the manuscript. Z. A. and M. Z. revised the manuscript and supervised the study.
-
Conflict of interest: The authors declare that the research was conducted in the absence of any commercial or financial relationships that could be construed as a potential conflict of interest.
-
Data availability statement: The datasets analyzed during the current study are available in the in the GEO (https://www.ncbi.nlm.nih.gov/geo/).
Abbreviations
- AGE–RAGE
-
advanced glycation end product–receptor of advanced glycation end product
- BMI
-
body mass index
- DCA
-
decision curve analysis curve
- DEGs
-
differentially expressed genes
- FC
-
fold change
- FOSL2
-
FOS like 2, AP-1 transcription factor subunit
- GADD45B
-
growth arrest and DNA damage inducible beta
- GO
-
gene ontology
- GS
-
gene significance
- KEGG
-
kyoto encyclopedia of genes and genomes
- MAFLD
-
metabolic-associated fatty liver disease
- MASH
-
metabolic steatohepatitis
- MRI
-
magnetic resonance imaging
- NAD
-
nicotinamide adenine dinucleotide
- NAFLD
-
nonalcoholic fatty liver disease
- NAMPT
-
nicotinamide phosphoribosyltransferase
- NAS
-
metabolic-associated fatty liver disease activity score
- NASH
-
nonalcoholic steatohepatitis
- NMN
-
nicotinamide mononucleotide
- PHLDA1
-
pleckstrin homology like domain family A member 1
- RALGDS
-
ral guanine nucleotide dissociation stimulator
- RASD1
-
ras-related dexamethasone induced 1
- ROC
-
receiver operating characteristic
- RTP3
-
receptor transporter protein 3
- SREBP1
-
sterol regulatory element-binding protein 1
- TNF
-
tumor necrosis factor
- WGCNA
-
weighted gene co-expression network analysis
Appendix
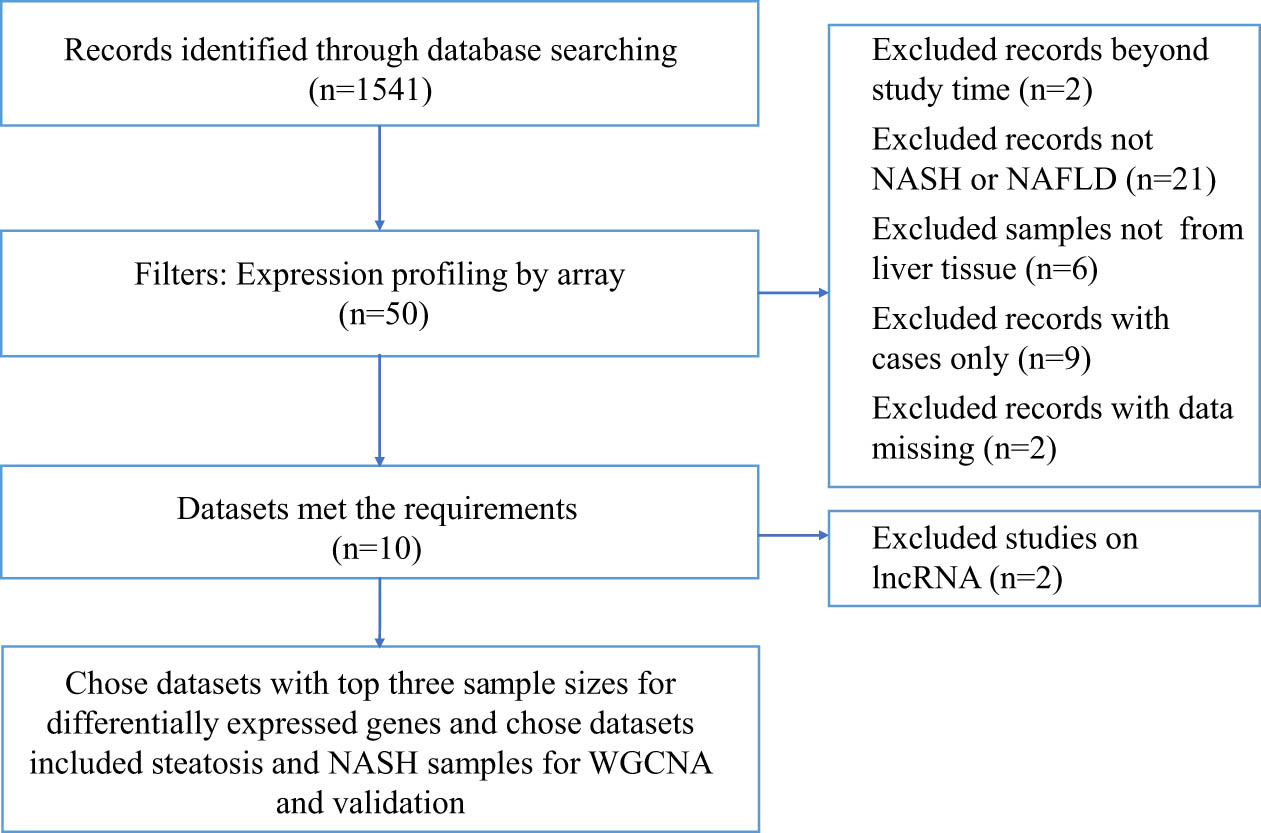
flow chart of screening datasets.
Clinical data of dataset GSE48452. Values given are mean (SD) or numbers of valid cases
| Clinical traits | n | NASH | n | Simple steatosis | n | Healthy controls |
|---|---|---|---|---|---|---|
| Age (years) | 18 | 45.48 (8.93) | 14 | 41.60 (11.22) | 13 | 51.80 (19.21) |
| Male, % (n) | 18 | 22.22% (4) | 14 | 28.6% (4) | 13 | 30.8% (4) |
| BMI (kg/m2) | 18 | 45.97 (12.96) | 14 | 48.28 (6.42) | 13 | 25.10 (3.97) |
| Steatosis (% of hepatocytes) | 18 | 71.94 (16.28) | 14 | 35.74 (22.00) | 13 | 0.69 (1.18) |
| Fibrosis stage, 0/1/2/3/4 (n) | 18 | 3/11/0/2/2 | 14 | 10/4/0/0 | 12 | 8/3/1/0/0 |
| Inflammation severity, 0/1/2/3 (n) | 18 | 0/9/6/3 | 14 | 12/2/0/0 | 13 | 12/1/0/0 |
| NAS | 18 | 5.06 (0.87) | 14 | 1.71 (0.83) | 13 | 0.77 (0.28) |
| Bariatric surgery, NA/after surgery/before surgery (n) | 18 | 14/1/3 | 14 | 2/5/7 | 13 | 11/2/0 |
RT-PCR primers for mRNA expression measurements
| Gene name | Forward | Reverse |
|---|---|---|
| NAMPT | TTGCTGCCACCTTATC | AACCTCCACCAGAACC |
| GADD45B | TGACAACGACATCAACATC | GTGACCAGAGACAATGCAG |
| FOSL2 | CCAGATGAAATGTCATGGC | CTCGGTTTGGTAGACTTGGA |
| RTP3 | CCTTCGCCAGGTTCCAGT | GACTTCTCCTCACTCCAGTTCAT |
| RASD1 | CGACTCGGAGCTGAGTATCC | GGTGGAAGTCCTCGATGGTA |
| RALGDS | TCCCAGCTGAGTCCCATCGA | TCACTAACCCCCGTCTTGCATG |
| β-actin | CTGGAACGGTGAAGGTGACA | CGGCCACATTGTGAACTTTG |
Common differentially expressed genes in the datasets
| Datasets | Total | Common differentially expressed genes |
|---|---|---|
| GSE24807 GSE63067 GSE89632 | 7 | MBNL2, RTP3, PHLDA1, FOSL2, NAMPT, SPSB1, CASP4 |
| GSE24807 GSE63067 | 9 | BBOX1, COL1A1, CHI3L1, MCL1, PLIN1, ENO3, TSLP, CCDC71L, LGALS8 |
| GSE24807 GSE89632 | 29 | TGM2, ATF3, ANXA13, RAB26, CALCA, CYP7A1, KLF6, ANXA9, C2orf82, IER3, ZFP36, CSF3, GRAMD4, DUSP10, GADD45B, IVNS1ABP, SLC22A7, IGFBP1, SLITRK3, RASD1, RRP12, RAB27A, BCL3, MT1A, TRIM15, CYR61, SIK1, C2CD4A, IFIT3 |
| GSE63067 GSE89632 | 13 | NR4A2, SERPINB9, CEBPD, IGFBP2, RALGDS, S100A8, BCL2A1, AVPR1A, IL1RN, S100A12, PEG10, CD274, BIRC3 |
References
[1] Younossi ZM , Koenig AB , Abdelatif D , Fazel Y , Henry L , Wymer M . Global epidemiology of nonalcoholic fatty liver disease-meta-analytic assessment of prevalence, incidence, and outcomes. Hepatology (Baltimore, Md). 2016 Jul;64(1):73–84.10.1002/hep.28431Suche in Google Scholar PubMed
[2] Younossi Z , Anstee QM , Marietti M , Hardy T , Henry L , Eslam M , et al. Global burden of NAFLD and NASH: trends, predictions, risk factors and prevention. Nat Rev Gastroenterol Hepatol. 2018 Jan;15(1):11–20.10.1038/nrgastro.2017.109Suche in Google Scholar PubMed
[3] Akshintala D , Chugh R , Amer F , Cusi K . Nonalcoholic fatty liver disease: the overlooked complication of type 2 diabetes. In: Feingold KR , Anawalt B , Boyce A , Chrousos G , Dungan K , Grossman A , et al. , editors. Endotext. South Dartmouth (MA): MDText.com, Inc.; 2000.Suche in Google Scholar
[4] Vanni E , Marengo A , Mezzabotta L , Bugianesi E . Systemic complications of nonalcoholic fatty liver disease: when the liver is not an innocent bystander. Sem Liver Dis. 2015 Aug;35(3):236–49.10.1055/s-0035-1562944Suche in Google Scholar PubMed
[5] Adams LA , Anstee QM , Tilg H , Targher G . Non-alcoholic fatty liver disease and its relationship with cardiovascular disease and other extrahepatic diseases. Gut. 2017 Jun;66(6):1138–53.10.1136/gutjnl-2017-313884Suche in Google Scholar PubMed
[6] Drescher HK , Weiskirchen S , Weiskirchen R . Current status in testing for nonalcoholic fatty liver disease (NAFLD) and nonalcoholic steatohepatitis (NASH). Cells. 2019 Aug 7;8:8.10.3390/cells8080845Suche in Google Scholar PubMed PubMed Central
[7] Chalasani N , Younossi Z , Lavine JE , Charlton M , Cusi K , Rinella M , et al. The diagnosis and management of nonalcoholic fatty liver disease: practice guidance from the American association for the study of liver diseases. Hepatology (Baltimore, Md). 2018 Jan;67(1):328–57.10.1002/hep.29367Suche in Google Scholar PubMed
[8] Altamirano J , Qi Q , Choudhry S , Abdallah M , Singal AK , Humar A , et al. Non-invasive diagnosis: non-alcoholic fatty liver disease and alcoholic liver disease. Transl Gastroenterol Hepatol. 2020;5:31.10.21037/tgh.2019.11.14Suche in Google Scholar PubMed PubMed Central
[9] Dulai PS , Sirlin CB , Loomba R . MRI and MRE for non-invasive quantitative assessment of hepatic steatosis and fibrosis in NAFLD and NASH: clinical trials to clinical practice. J Hepatol. 2016 Nov;65(5):1006–16.10.1016/j.jhep.2016.06.005Suche in Google Scholar PubMed PubMed Central
[10] Di Mauro S , Scamporrino A , Petta S , Urbano F , Filippello A , Ragusa M , et al. Serum coding and non-coding RNAs as biomarkers of NAFLD and fibrosis severity. Liver Int. 2019 Sep;39(9):1742–54.10.1111/liv.14167Suche in Google Scholar PubMed PubMed Central
[11] Liu J , Xiao Y , Wu X , Jiang L , Yang S , Ding Z , et al. A circulating microRNA signature as noninvasive diagnostic and prognostic biomarkers for nonalcoholic steatohepatitis. BMC Genomics. 2018 Mar 9;19(1):188.10.1186/s12864-018-4575-3Suche in Google Scholar PubMed PubMed Central
[12] Zhang M , Chi X , Qu N , Wang C . Long noncoding RNA lncARSR promotes hepatic lipogenesis via Akt/SREBP-1c pathway and contributes to the pathogenesis of nonalcoholic steatohepatitis. Biochemical Biophys Res Commun. 2018 Apr 30;499(1):66–70.10.1016/j.bbrc.2018.03.127Suche in Google Scholar PubMed
[13] Frades I , Andreasson E , Mato JM , Alexandersson E , Matthiesen R , Martínez-Chantar ML . Integrative genomic signatures of hepatocellular carcinoma derived from nonalcoholic Fatty liver disease. PLoS one. 2015;10(5):e0124544.10.1371/journal.pone.0124544Suche in Google Scholar PubMed PubMed Central
[14] Arendt BM , Comelli EM , Ma DW , Lou W , Teterina A , Kim T , et al. Altered hepatic gene expression in nonalcoholic fatty liver disease is associated with lower hepatic n-3 and n-6 polyunsaturated fatty acids. Hepatology (Baltimore, Md). 2015 May;61(5):1565–78.10.1002/hep.27695Suche in Google Scholar PubMed
[15] Liu W , Baker SS , Baker RD , Nowak NJ , Zhu L . Upregulation of hemoglobin expression by oxidative stress in hepatocytes and its implication in nonalcoholic steatohepatitis. PLoS One. 2011;6(9):e24363.10.1371/journal.pone.0024363Suche in Google Scholar PubMed PubMed Central
[16] Ahrens M , Ammerpohl O , von Schönfels W , Kolarova J , Bens S , Itzel T , et al. DNA methylation analysis in nonalcoholic fatty liver disease suggests distinct disease-specific and remodeling signatures after bariatric surgery. Cell Metab. 2013 Aug 6;18(2):296–302.10.1016/j.cmet.2013.07.004Suche in Google Scholar PubMed
[17] Walsh CJ , Hu P , Batt J , Santos CC . Microarray meta-analysis and cross-platform normalization: integrative genomics for robust biomarker discovery. Microarrays (Basel, Switz). 2015 Aug 21;4(3):389–406.10.3390/microarrays4030389Suche in Google Scholar PubMed PubMed Central
[18] Langfelder P , Horvath S . WGCNA: an R package for weighted correlation network analysis. BMC Bioinforma. 2008 Dec 29;9:559.10.1186/1471-2105-9-559Suche in Google Scholar PubMed PubMed Central
[19] Zhou Y , Zhou B , Pache L , Chang M , Khodabakhshi AH , Tanaseichuk O , et al. Metascape provides a biologist-oriented resource for the analysis of systems-level datasets. Nat Commun. 2019 Apr 3;10(1):1523.10.1038/s41467-019-09234-6Suche in Google Scholar PubMed PubMed Central
[20] Vickers AJ , Elkin EB . Decision curve analysis: a novel method for evaluating prediction models. Med Decis Mak. 2006 Nov-Dec;26(6):565–74.10.1177/0272989X06295361Suche in Google Scholar PubMed PubMed Central
[21] Vickers AJ , Cronin AM , Elkin EB , Gonen M . Extensions to decision curve analysis, a novel method for evaluating diagnostic tests, prediction models and molecular markers. BMC Med Inform Decis Mak. 2008 Nov 26;8:53.10.1186/1472-6947-8-53Suche in Google Scholar PubMed PubMed Central
[22] Revollo JR , Körner A , Mills KF , Satoh A , Wang T , Garten A , et al. Nampt/PBEF/Visfatin regulates insulin secretion in beta cells as a systemic NAD biosynthetic enzyme. Cell Metab. 2007 Nov;6(5):363–75.10.1016/j.cmet.2007.09.003Suche in Google Scholar PubMed PubMed Central
[23] Gerner RR , Klepsch V , Macheiner S , Arnhard K , Adolph TE , Grander C , et al. NAD metabolism fuels human and mouse intestinal inflammation. Gut. 2018 Oct;67(10):1813–23.10.1136/gutjnl-2017-314241Suche in Google Scholar PubMed PubMed Central
[24] Zhou CC , Yang X , Hua X , Liu J , Fan MB , Li GQ , et al. Hepatic NAD(+) deficiency as a therapeutic target for non-alcoholic fatty liver disease in ageing. Br J Pharmacol. 2016 Aug;173(15):2352–68.10.1111/bph.13513Suche in Google Scholar PubMed PubMed Central
[25] Dahl TB , Haukeland JW , Yndestad A , Ranheim T , Gladhaug IP , Damas JK , et al. Intracellular nicotinamide phosphoribosyltransferase protects against hepatocyte apoptosis and is down-regulated in nonalcoholic fatty liver disease. J Clin Endocrinol Metab. 2010 Jun;95(6):3039–47.10.1210/jc.2009-2148Suche in Google Scholar PubMed
[26] Wang LF , Wang XN , Huang CC , Hu L , Xiao YF , Guan XH , et al. Inhibition of NAMPT aggravates high fat diet-induced hepatic steatosis in mice through regulating Sirt1/AMPKalpha/SREBP1 signaling pathway. Lipids Health Dis. 2017 Apr 27;16(1):82.10.1186/s12944-017-0464-zSuche in Google Scholar PubMed PubMed Central
[27] Keren J , Yingcheng W , Jingyi J , Liyang W , Lili S , Huiqun W , et al. The identification of gene signature and critical pathway associated with childhood-onset type 2 diabetes. PeerJ. 2019;7:e6343.10.7717/peerj.6343Suche in Google Scholar PubMed PubMed Central
[28] Zhou Q , Chen B , Ji T , Luo M , Luo J . Association of genetic variants in RETN, NAMPT and ADIPOQ gene with glycemic, metabolic traits and diabetes risk in a Chinese population. Gene. 2018 Feb 5;642:439–46.10.1016/j.gene.2017.10.084Suche in Google Scholar PubMed
[29] Chen Y , Takikawa M , Tsutsumi S , Yamaguchi Y , Okabe A , Shimada M , et al. PHLDA1, another PHLDA family protein that inhibits Akt. Cancer Sci. 2018 Nov;109(11):3532–42.10.1111/cas.13796Suche in Google Scholar PubMed PubMed Central
[30] Zhang P , Chu T , Dedousis N , Mantell BS , Sipula I , Li L , et al. DNA methylation alters transcriptional rates of differentially expressed genes and contributes to pathophysiology in mice fed a high fat diet. Mol Metab. 2017 Apr;6(4):327–39.10.1016/j.molmet.2017.02.001Suche in Google Scholar PubMed PubMed Central
[31] Lyu JH , Huang B , Park DW , Baek SH . Regulation of PHLDA1 expression by JAK2-ERK1/2-STAT3 signaling pathway. J Cell Biochem. 2016 Feb;117(2):483–90.10.1002/jcb.25296Suche in Google Scholar PubMed
[32] Lim KH , Baines AT , Fiordalisi JJ , Shipitsin M , Feig LA , Cox AD , et al. Activation of RalA is critical for Ras-induced tumorigenesis of human cells. Cancer Cell. 2005 Jun;7(6):533–45.10.1016/j.ccr.2005.04.030Suche in Google Scholar
[33] Takekawa M , Saito H . A family of stress-inducible GADD45-like proteins mediate activation of the stress-responsive MTK1/MEKK4 MAPKKK. Cell. 1998 Nov 13;95(4):521–30.10.1016/S0092-8674(00)81619-0Suche in Google Scholar
[34] Zhao Z , Gao Y , Guan X , Liu Z , Jiang Z , Liu X , et al. GADD45B as a prognostic and predictive biomarker in stage II colorectal cancer. Genes. 2018 Jul 19;9:7.10.3390/genes9070361Suche in Google Scholar PubMed PubMed Central
[35] Sha X , Hoffman B , Liebermann DA . Loss of Gadd45b accelerates BCR-ABL-driven CML. Oncotarget. 2018 Sep 7;9(70):33360–7.10.18632/oncotarget.26076Suche in Google Scholar PubMed PubMed Central
[36] Wang J , Sun D , Wang Y , Ren F , Pang S , Wang D , et al. FOSL2 positively regulates TGF-beta1 signalling in non-small cell lung cancer. PLoS One. 2014;9(11):e112150.10.1371/journal.pone.0112150Suche in Google Scholar PubMed PubMed Central
[37] He J , Mai J , Li Y , Chen L , Xu H , Zhu X , et al. miR-597 inhibits breast cancer cell proliferation, migration and invasion through FOSL2. Oncol Rep. 2017 May;37(5):2672–8.10.3892/or.2017.5558Suche in Google Scholar PubMed PubMed Central
[38] Fagerberg L , Hallstrom BM , Oksvold P , Kampf C , Djureinovic D , Odeberg J , et al. Analysis of the human tissue-specific expression by genome-wide integration of transcriptomics and antibody-based proteomics. Mol Cell Proteomics. 2014 Feb;13(2):397–406.10.1074/mcp.M113.035600Suche in Google Scholar PubMed PubMed Central
[39] Zhao LJ , Liu XG , Liu YZ , Liu YJ , Papasian CJ , Sha BY , et al. Genome-wide association study for femoral neck bone geometry. J Bone Miner Res. 2010 Feb;25(2):320–9.10.1359/jbmr.090726Suche in Google Scholar PubMed PubMed Central
[40] Cismowski MJ , Ma C , Ribas C , Xie X , Spruyt M , Lizano JS , et al. Activation of heterotrimeric G-protein signaling by a ras-related protein. Implications for signal integration. J Biol Chem. 2000 Aug 4;275(31):23421–4.10.1074/jbc.C000322200Suche in Google Scholar PubMed
[41] Jiang B , Lv Q , Wan W , Le L , Xu L , Hu K , et al. Transcriptome analysis reveals the mechanism of the effect of flower tea Coreopsis tinctoria on hepatic insulin resistance. Food Funct. 2018 Nov 14;9(11):5607–20.10.1039/C8FO00965ASuche in Google Scholar
© 2021 Shenling Liao et al., published by De Gruyter
This work is licensed under the Creative Commons Attribution 4.0 International License.
Artikel in diesem Heft
- Research Articles
- Identification of ZG16B as a prognostic biomarker in breast cancer
- Behçet’s disease with latent Mycobacterium tuberculosis infection
- Erratum
- Erratum to “Suffering from Cerebral Small Vessel Disease with and without Metabolic Syndrome”
- Research Articles
- GPR37 promotes the malignancy of lung adenocarcinoma via TGF-β/Smad pathway
- Expression and role of ABIN1 in sepsis: In vitro and in vivo studies
- Additional baricitinib loading dose improves clinical outcome in COVID-19
- The co-treatment of rosuvastatin with dapagliflozin synergistically inhibited apoptosis via activating the PI3K/AKt/mTOR signaling pathway in myocardial ischemia/reperfusion injury rats
- SLC12A8 plays a key role in bladder cancer progression and EMT
- LncRNA ATXN8OS enhances tamoxifen resistance in breast cancer
- Case Report
- Serratia marcescens as a cause of unfavorable outcome in the twin pregnancy
- Spleno-adrenal fusion mimicking an adrenal metastasis of a renal cell carcinoma: A case report and embryological background
- Research Articles
- TRIM25 contributes to the malignancy of acute myeloid leukemia and is negatively regulated by microRNA-137
- CircRNA circ_0004370 promotes cell proliferation, migration, and invasion and inhibits cell apoptosis of esophageal cancer via miR-1301-3p/COL1A1 axis
- LncRNA XIST regulates atherosclerosis progression in ox-LDL-induced HUVECs
- Potential role of IFN-γ and IL-5 in sepsis prediction of preterm neonates
- Rapid Communication
- COVID-19 vaccine: Call for employees in international transportation industries and international travelers as the first priority in global distribution
- Case Report
- Rare squamous cell carcinoma of the kidney with concurrent xanthogranulomatous pyelonephritis: A case report and review of the literature
- An infertile female delivered a baby after removal of primary renal carcinoid tumor
- Research Articles
- Hypertension, BMI, and cardiovascular and cerebrovascular diseases
- Case Report
- Coexistence of bilateral macular edema and pale optic disc in the patient with Cohen syndrome
- Research Articles
- Correlation between kinematic sagittal parameters of the cervical lordosis or head posture and disc degeneration in patients with posterior neck pain
- Review Articles
- Hepatoid adenocarcinoma of the lung: An analysis of the Surveillance, Epidemiology, and End Results (SEER) database
- Research Articles
- Thermography in the diagnosis of carpal tunnel syndrome
- Pemetrexed-based first-line chemotherapy had particularly prominent objective response rate for advanced NSCLC: A network meta-analysis
- Comparison of single and double autologous stem cell transplantation in multiple myeloma patients
- The influence of smoking in minimally invasive spinal fusion surgery
- Impact of body mass index on left atrial dimension in HOCM patients
- Expression and clinical significance of CMTM1 in hepatocellular carcinoma
- miR-142-5p promotes cervical cancer progression by targeting LMX1A through Wnt/β-catenin pathway
- Comparison of multiple flatfoot indicators in 5–8-year-old children
- Early MRI imaging and follow-up study in cerebral amyloid angiopathy
- Intestinal fatty acid-binding protein as a biomarker for the diagnosis of strangulated intestinal obstruction: A meta-analysis
- miR-128-3p inhibits apoptosis and inflammation in LPS-induced sepsis by targeting TGFBR2
- Dynamic perfusion CT – A promising tool to diagnose pancreatic ductal adenocarcinoma
- Biomechanical evaluation of self-cinching stitch techniques in rotator cuff repair: The single-loop and double-loop knot stitches
- Review Articles
- The ambiguous role of mannose-binding lectin (MBL) in human immunity
- Case Report
- Membranous nephropathy with pulmonary cryptococcosis with improved 1-year follow-up results: A case report
- Fertility problems in males carrying an inversion of chromosome 10
- Acute myeloid leukemia with leukemic pleural effusion and high levels of pleural adenosine deaminase: A case report and review of literature
- Metastatic renal Ewing’s sarcoma in adult woman: Case report and review of the literature
- Burkitt-like lymphoma with 11q aberration in a patient with AIDS and a patient without AIDS: Two cases reports and literature review
- Skull hemophilia pseudotumor: A case report
- Judicious use of low-dosage corticosteroids for non-severe COVID-19: A case report
- Adult-onset citrullinaemia type II with liver cirrhosis: A rare cause of hyperammonaemia
- Clinicopathologic features of Good’s syndrome: Two cases and literature review
- Fatal immune-related hepatitis with intrahepatic cholestasis and pneumonia associated with camrelizumab: A case report and literature review
- Research Articles
- Effects of hydroxyethyl starch and gelatin on the risk of acute kidney injury following orthotopic liver transplantation: A multicenter retrospective comparative clinical study
- Significance of nucleic acid positive anal swab in COVID-19 patients
- circAPLP2 promotes colorectal cancer progression by upregulating HELLS by targeting miR-335-5p
- Ratios between circulating myeloid cells and lymphocytes are associated with mortality in severe COVID-19 patients
- Risk factors of left atrial appendage thrombus in patients with non-valvular atrial fibrillation
- Clinical features of hypertensive patients with COVID-19 compared with a normotensive group: Single-center experience in China
- Surgical myocardial revascularization outcomes in Kawasaki disease: systematic review and meta-analysis
- Decreased chromobox homologue 7 expression is associated with epithelial–mesenchymal transition and poor prognosis in cervical cancer
- FGF16 regulated by miR-520b enhances the cell proliferation of lung cancer
- Platelet-rich fibrin: Basics of biological actions and protocol modifications
- Accurate diagnosis of prostate cancer using logistic regression
- miR-377 inhibition enhances the survival of trophoblast cells via upregulation of FNDC5 in gestational diabetes mellitus
- Prognostic significance of TRIM28 expression in patients with breast carcinoma
- Integrative bioinformatics analysis of KPNA2 in six major human cancers
- Exosomal-mediated transfer of OIP5-AS1 enhanced cell chemoresistance to trastuzumab in breast cancer via up-regulating HMGB3 by sponging miR-381-3p
- A four-lncRNA signature for predicting prognosis of recurrence patients with gastric cancer
- Knockdown of circ_0003204 alleviates oxidative low-density lipoprotein-induced human umbilical vein endothelial cells injury: Circulating RNAs could explain atherosclerosis disease progression
- Propofol postpones colorectal cancer development through circ_0026344/miR-645/Akt/mTOR signal pathway
- Knockdown of lncRNA TapSAKI alleviates LPS-induced injury in HK-2 cells through the miR-205/IRF3 pathway
- COVID-19 severity in relation to sociodemographics and vitamin D use
- Clinical analysis of 11 cases of nocardiosis
- Cis-regulatory elements in conserved non-coding sequences of nuclear receptor genes indicate for crosstalk between endocrine systems
- Four long noncoding RNAs act as biomarkers in lung adenocarcinoma
- Real-world evidence of cytomegalovirus reactivation in non-Hodgkin lymphomas treated with bendamustine-containing regimens
- Relation between IL-8 level and obstructive sleep apnea syndrome
- circAGFG1 sponges miR-28-5p to promote non-small-cell lung cancer progression through modulating HIF-1α level
- Nomogram prediction model for renal anaemia in IgA nephropathy patients
- Effect of antibiotic use on the efficacy of nivolumab in the treatment of advanced/metastatic non-small cell lung cancer: A meta-analysis
- NDRG2 inhibition facilitates angiogenesis of hepatocellular carcinoma
- A nomogram for predicting metabolic steatohepatitis: The combination of NAMPT, RALGDS, GADD45B, FOSL2, RTP3, and RASD1
- Clinical and prognostic features of MMP-2 and VEGF in AEG patients
- The value of miR-510 in the prognosis and development of colon cancer
- Functional implications of PABPC1 in the development of ovarian cancer
- Prognostic value of preoperative inflammation-based predictors in patients with bladder carcinoma after radical cystectomy
- Sublingual immunotherapy increases Treg/Th17 ratio in allergic rhinitis
- Prediction of improvement after anterior cruciate ligament reconstruction
- Effluent Osteopontin levels reflect the peritoneal solute transport rate
- circ_0038467 promotes PM2.5-induced bronchial epithelial cell dysfunction
- Significance of miR-141 and miR-340 in cervical squamous cell carcinoma
- Association between hair cortisol concentration and metabolic syndrome
- Microvessel density as a prognostic indicator of prostate cancer: A systematic review and meta-analysis
- Characteristics of BCR–ABL gene variants in patients of chronic myeloid leukemia
- Knee alterations in rheumatoid arthritis: Comparison of US and MRI
- Long non-coding RNA TUG1 aggravates cerebral ischemia and reperfusion injury by sponging miR-493-3p/miR-410-3p
- lncRNA MALAT1 regulated ATAD2 to facilitate retinoblastoma progression via miR-655-3p
- Development and validation of a nomogram for predicting severity in patients with hemorrhagic fever with renal syndrome: A retrospective study
- Analysis of COVID-19 outbreak origin in China in 2019 using differentiation method for unusual epidemiological events
- Laparoscopic versus open major liver resection for hepatocellular carcinoma: A case-matched analysis of short- and long-term outcomes
- Travelers’ vaccines and their adverse events in Nara, Japan
- Association between Tfh and PGA in children with Henoch–Schönlein purpura
- Can exchange transfusion be replaced by double-LED phototherapy?
- circ_0005962 functions as an oncogene to aggravate NSCLC progression
- Circular RNA VANGL1 knockdown suppressed viability, promoted apoptosis, and increased doxorubicin sensitivity through targeting miR-145-5p to regulate SOX4 in bladder cancer cells
- Serum intact fibroblast growth factor 23 in healthy paediatric population
- Algorithm of rational approach to reconstruction in Fournier’s disease
- A meta-analysis of exosome in the treatment of spinal cord injury
- Src-1 and SP2 promote the proliferation and epithelial–mesenchymal transition of nasopharyngeal carcinoma
- Dexmedetomidine may decrease the bupivacaine toxicity to heart
- Hypoxia stimulates the migration and invasion of osteosarcoma via up-regulating the NUSAP1 expression
- Long noncoding RNA XIST knockdown relieves the injury of microglia cells after spinal cord injury by sponging miR-219-5p
- External fixation via the anterior inferior iliac spine for proximal femoral fractures in young patients
- miR-128-3p reduced acute lung injury induced by sepsis via targeting PEL12
- HAGLR promotes neuron differentiation through the miR-130a-3p-MeCP2 axis
- Phosphoglycerate mutase 2 is elevated in serum of patients with heart failure and correlates with the disease severity and patient’s prognosis
- Cell population data in identifying active tuberculosis and community-acquired pneumonia
- Prognostic value of microRNA-4521 in non-small cell lung cancer and its regulatory effect on tumor progression
- Mean platelet volume and red blood cell distribution width is associated with prognosis in premature neonates with sepsis
- 3D-printed porous scaffold promotes osteogenic differentiation of hADMSCs
- Association of gene polymorphisms with women urinary incontinence
- Influence of COVID-19 pandemic on stress levels of urologic patients
- miR-496 inhibits proliferation via LYN and AKT pathway in gastric cancer
- miR-519d downregulates LEP expression to inhibit preeclampsia development
- Comparison of single- and triple-port VATS for lung cancer: A meta-analysis
- Fluorescent light energy modulates healing in skin grafted mouse model
- Silencing CDK6-AS1 inhibits LPS-induced inflammatory damage in HK-2 cells
- Predictive effect of DCE-MRI and DWI in brain metastases from NSCLC
- Severe postoperative hyperbilirubinemia in congenital heart disease
- Baicalin improves podocyte injury in rats with diabetic nephropathy by inhibiting PI3K/Akt/mTOR signaling pathway
- Clinical factors predicting ureteral stent failure in patients with external ureteral compression
- Novel H2S donor proglumide-ADT-OH protects HUVECs from ox-LDL-induced injury through NF-κB and JAK/SATA pathway
- Triple-Endobutton and clavicular hook: A propensity score matching analysis
- Long noncoding RNA MIAT inhibits the progression of diabetic nephropathy and the activation of NF-κB pathway in high glucose-treated renal tubular epithelial cells by the miR-182-5p/GPRC5A axis
- Serum exosomal miR-122-5p, GAS, and PGR in the non-invasive diagnosis of CAG
- miR-513b-5p inhibits the proliferation and promotes apoptosis of retinoblastoma cells by targeting TRIB1
- Fer exacerbates renal fibrosis and can be targeted by miR-29c-3p
- The diagnostic and prognostic value of miR-92a in gastric cancer: A systematic review and meta-analysis
- Prognostic value of α2δ1 in hypopharyngeal carcinoma: A retrospective study
- No significant benefit of moderate-dose vitamin C on severe COVID-19 cases
- circ_0000467 promotes the proliferation, metastasis, and angiogenesis in colorectal cancer cells through regulating KLF12 expression by sponging miR-4766-5p
- Downregulation of RAB7 and Caveolin-1 increases MMP-2 activity in renal tubular epithelial cells under hypoxic conditions
- Educational program for orthopedic surgeons’ influences for osteoporosis
- Expression and function analysis of CRABP2 and FABP5, and their ratio in esophageal squamous cell carcinoma
- GJA1 promotes hepatocellular carcinoma progression by mediating TGF-β-induced activation and the epithelial–mesenchymal transition of hepatic stellate cells
- lncRNA-ZFAS1 promotes the progression of endometrial carcinoma by targeting miR-34b to regulate VEGFA expression
- Anticoagulation is the answer in treating noncritical COVID-19 patients
- Effect of late-onset hemorrhagic cystitis on PFS after haplo-PBSCT
- Comparison of Dako HercepTest and Ventana PATHWAY anti-HER2 (4B5) tests and their correlation with silver in situ hybridization in lung adenocarcinoma
- VSTM1 regulates monocyte/macrophage function via the NF-κB signaling pathway
- Comparison of vaginal birth outcomes in midwifery-led versus physician-led setting: A propensity score-matched analysis
- Treatment of osteoporosis with teriparatide: The Slovenian experience
- New targets of morphine postconditioning protection of the myocardium in ischemia/reperfusion injury: Involvement of HSP90/Akt and C5a/NF-κB
- Superenhancer–transcription factor regulatory network in malignant tumors
- β-Cell function is associated with osteosarcopenia in middle-aged and older nonobese patients with type 2 diabetes: A cross-sectional study
- Clinical features of atypical tuberculosis mimicking bacterial pneumonia
- Proteoglycan-depleted regions of annular injury promote nerve ingrowth in a rabbit disc degeneration model
- Effect of electromagnetic field on abortion: A systematic review and meta-analysis
- miR-150-5p affects AS plaque with ASMC proliferation and migration by STAT1
- MALAT1 promotes malignant pleural mesothelioma by sponging miR-141-3p
- Effects of remifentanil and propofol on distant organ lung injury in an ischemia–reperfusion model
- miR-654-5p promotes gastric cancer progression via the GPRIN1/NF-κB pathway
- Identification of LIG1 and LIG3 as prognostic biomarkers in breast cancer
- MitoQ inhibits hepatic stellate cell activation and liver fibrosis by enhancing PINK1/parkin-mediated mitophagy
- Dissecting role of founder mutation p.V727M in GNE in Indian HIBM cohort
- circATP2A2 promotes osteosarcoma progression by upregulating MYH9
- Prognostic role of oxytocin receptor in colon adenocarcinoma
- Review Articles
- The function of non-coding RNAs in idiopathic pulmonary fibrosis
- Efficacy and safety of therapeutic plasma exchange in stiff person syndrome
- Role of cesarean section in the development of neonatal gut microbiota: A systematic review
- Small cell lung cancer transformation during antitumor therapies: A systematic review
- Research progress of gut microbiota and frailty syndrome
- Recommendations for outpatient activity in COVID-19 pandemic
- Rapid Communication
- Disparity in clinical characteristics between 2019 novel coronavirus pneumonia and leptospirosis
- Use of microspheres in embolization for unruptured renal angiomyolipomas
- COVID-19 cases with delayed absorption of lung lesion
- A triple combination of treatments on moderate COVID-19
- Social networks and eating disorders during the Covid-19 pandemic
- Letter
- COVID-19, WHO guidelines, pedagogy, and respite
- Inflammatory factors in alveolar lavage fluid from severe COVID-19 pneumonia: PCT and IL-6 in epithelial lining fluid
- COVID-19: Lessons from Norway tragedy must be considered in vaccine rollout planning in least developed/developing countries
- What is the role of plasma cell in the lamina propria of terminal ileum in Good’s syndrome patient?
- Case Report
- Rivaroxaban triggered multifocal intratumoral hemorrhage of the cabozantinib-treated diffuse brain metastases: A case report and review of literature
- CTU findings of duplex kidney in kidney: A rare duplicated renal malformation
- Synchronous primary malignancy of colon cancer and mantle cell lymphoma: A case report
- Sonazoid-enhanced ultrasonography and pathologic characters of CD68 positive cell in primary hepatic perivascular epithelioid cell tumors: A case report and literature review
- Persistent SARS-CoV-2-positive over 4 months in a COVID-19 patient with CHB
- Pulmonary parenchymal involvement caused by Tropheryma whipplei
- Mediastinal mixed germ cell tumor: A case report and literature review
- Ovarian female adnexal tumor of probable Wolffian origin – Case report
- Rare paratesticular aggressive angiomyxoma mimicking an epididymal tumor in an 82-year-old man: Case report
- Perimenopausal giant hydatidiform mole complicated with preeclampsia and hyperthyroidism: A case report and literature review
- Primary orbital ganglioneuroblastoma: A case report
- Primary aortic intimal sarcoma masquerading as intramural hematoma
- Sustained false-positive results for hepatitis A virus immunoglobulin M: A case report and literature review
- Peritoneal loose body presenting as a hepatic mass: A case report and review of the literature
- Chondroblastoma of mandibular condyle: Case report and literature review
- Trauma-induced complete pacemaker lead fracture 8 months prior to hospitalization: A case report
- Primary intradural extramedullary extraosseous Ewing’s sarcoma/peripheral primitive neuroectodermal tumor (PIEES/PNET) of the thoracolumbar spine: A case report and literature review
- Computer-assisted preoperative planning of reduction of and osteosynthesis of scapular fracture: A case report
- High quality of 58-month life in lung cancer patient with brain metastases sequentially treated with gefitinib and osimertinib
- Rapid response of locally advanced oral squamous cell carcinoma to apatinib: A case report
- Retrieval of intrarenal coiled and ruptured guidewire by retrograde intrarenal surgery: A case report and literature review
- Usage of intermingled skin allografts and autografts in a senior patient with major burn injury
- Retraction
- Retraction on “Dihydromyricetin attenuates inflammation through TLR4/NF-kappa B pathway”
- Special Issue Computational Intelligence Methodologies Meets Recurrent Cancers - Part I
- An artificial immune system with bootstrap sampling for the diagnosis of recurrent endometrial cancers
- Breast cancer recurrence prediction with ensemble methods and cost-sensitive learning