Preprocessing of unipolar signals acquired by a novel intracardiac mapping system
-
Salina Huck
 ,
Tobias Oesterlein
,
Tobias Oesterlein

Abstract
The novel high-density mapping system RhythmiaTM Medical (Boston Scientific, Marlborough, USA) allows a fast and automatic acquisition of intracardiac electrograms (EGMs). For recording the ORION mini-basket catheter is used. Due to the small electrode surface, the spatial averaging is smaller than with other commonly used mapping catheters. This results in a higher quality of unipolar signals. However, these are still corrupted by noise such as high frequency interference. Within this project, methods were developed and benchmarked that can be applied to detect and remove these undesired components. An algorithm was implemented to detect and eliminate artificial peaks in the spectrum of the EGM. The filtered signals showed improved quality in time domain. The performance of the spectral peak detection resulted in a median sensitivity of 92.1% and in a median positive predictive value of 91.9%.
1 Introduction
Catheter ablation is a common treatment for atrial arrhythmias such as atrial flutter and atrial fibrillation. Prior to ablation, electro-anatomical mapping systems are applied for the identification of the arrhythmogenic sites. The novel high-density mapping system RhythmiaTM Medical (Boston Scientific, MA, USA) was installed in two centers. It allows an automatic and fast sequential recording of unipolar electrograms, using the ORION mini-basket catheter which consists of 64 electrodes. Due to the small spatial averaging which results from the small electrode surfaces, the quality of unipolar EGMs increases. This leads to a low noise level which is smaller than 0.01 mV [1]. However, unipolar signals still are disturbed by high frequency interference and far-fields. Thus, the preprocessing of the EGMs is a necessary aspect for further processing of the data. An export of the raw data which were recorded during mapping was enabled. Goal of this research is the preprocessing and evaluation of unipolar EMGs by the implementation of different filtering techniques. These have the requirement to automatically detect and eliminate artificial components in the spectrum of the EGM which may be different from lab to lab. The implementation of a simple low-pass filter is not sufficient since these artifacts also can be located in the lower frequency domain where the wanted signal is expected.
2 Methods
2.1 Clinical data
The evaluated and processed data in this research were derived from the RhythmiaTM Mapping System. Unipolar EGMs were acquired by use of the ORION mini-basket catheter. It consists of eight splines in which eight electrodes are arranged in an equal distance of 2.5 mm. The surface area of a single electrode is 0.4 mm2. The catheter can be deployed to a sphere with a maximal diameter of 22 mm. The localization occurs by a magnetic sensor and impedance sensing of the electrodes [2]. Five clinical data sets were recorded at Städtisches Klinikum in Karlsruhe and another five at German Heart Center in Munich. In total 28 maps were recorded in these ten data sets. Unipolar EGMs were recorded with a sample rate of 953.674 Hz.
2.2 Transformation to the frequency domain
The transformation of the EGMs to the frequency domain was the first necessary step. Therefore, the power spectral density (PSD) was calculated using Welch’s method [3]. The time signal was divided into overlapping segments with a window of 10 s and an overlap of 50%. For each segment the periodogram, an estimation of the PSD, was calculated. Then, each periodogram was windowed by the use of a Hamming window. Afterwards the averaged PSD of all segments was computed.
2.3 Detection of artificial peaks
In Figure 1 a unipolar signal recorded by the ORION mini-basket catheter (A) and the corresponding PSD (B) are illustrated. An overlay of noise is visible in the EGM. The PSD shows artificial discrete peaks at frequencies above 50 Hz. The signal of intracardiac EGMs is lying in the frequency domain up to 150 Hz. For this reason, all peaks above 70 Hz were not caused by physiological processes and can be considered as noise.
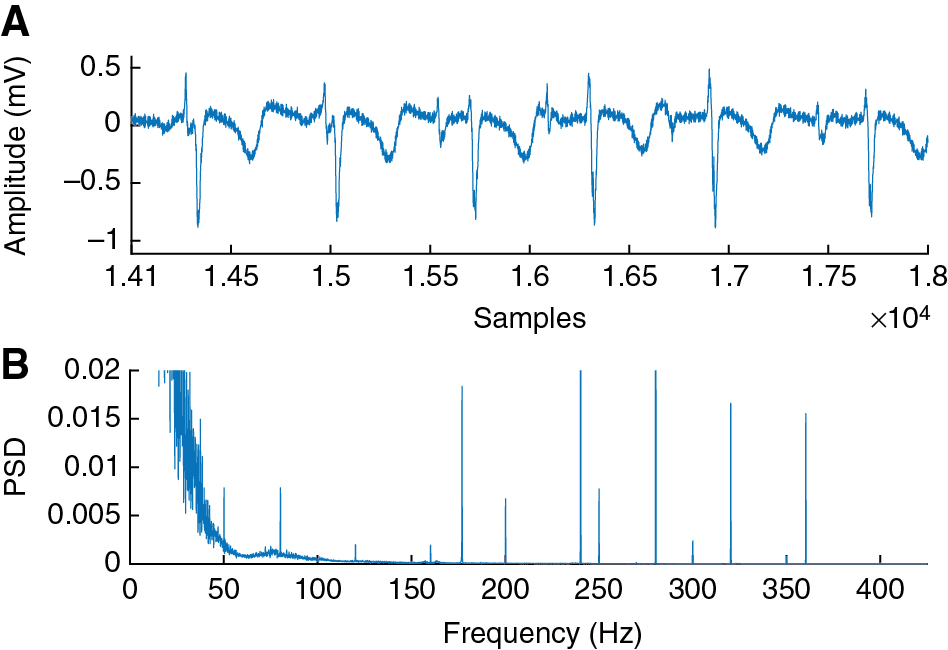
Unipolar EGM which is overlain with noise, recorded with ORION (A). A cutout of the corresponding PSD is illustrated in (B). Several artificial discrete peaks are visible.
An automatic peak detection algorithm was developed for identification of these peaks. To this end, the PSD was scanned using a sliding window, with a window width of 2 Hz and a shift of 1 Hz. For each step, the median and the maximum was calculated. A peak was detected if the maximum exceeded a threshold T, which was defined as the product of a variable coefficient c, the p-quantile Qp of the relative heights in the PSD and the median within the window:
Furthermore, the peak had to be located in the frequency domain above 70 Hz, to ensure that it was not caused by physiological processes. The relative height was defined as
and was computed within a window width of 2 Hz for every second integer frequency in a range of 70 – 400 Hz. This resulted in
An extended algorithm, the fundamental frequency (f0) calculation, was developed which additionally considered if these detected peaks were harmonics of f0. It was an iterative calculation with the basic idea that a candidate of f0 was the difference between two detected peaks.
2.4 Filtering
For peak suppression a Gaussian Notch filter with a band width of 1 Hz was used. The applied Gaussian Notch filter also filtered the harmonic frequencies of the notch frequency. This was the purpose of the f0 calculation. By clinical default, unipolar signals are examined in a frequency domain from 1 Hz - 300 Hz. Therefore, unipolar signals were filtered with a third order Butterworth high-pass filter with a cut-off frequency of 1 Hz and a third order Butterworth low-pass filter with a cut-off frequency of 300 Hz.
2.5 Evaluation of signal quality
To evaluate the quality of the signals the SNR defined as
was examined. Only the quality of the measured activity of the endocardium was considered. Therefore, the SNR was calculated in time segments without ventricular far fields (VFF). These were identified by applying a QRS detection algorithm, developed by Lenis [4], to a simultaneously recorded reference ECG signal. Psignal was defined as the power of the signal after filtering and Pnoise as the power of the difference between the signal before filtering and after filtering.
2.6 Performance evaluation
2.6.1 Performance evaluation of peak detection
Statistical measures were computed for the evaluation of the peak detection performance. Therefore, the PSDs of the 28 considered maps were manually annotated. The peak detection algorithm was applied to the PSDs and respectively the sensitivity (Se) and the positive predictive value (PPV) were computed.
2.6.2 Performance evaluation of filtering
For the evaluation of the filtering the power P of a peak before and after filtering was assessed. Therefore, the area under the peak in a window of 2 Hz was calculated before and after filtering. The relative peak power defined as
quoted the quality of the filtering. In ideal case the power of the peak after filtering is zero. According to the definition, an ideal filtering resulted in a relative peak power of one.
3 Results
3.1 Performance evaluation
The manual annotation yielded artificial peaks at multiples of 40 Hz and 50 Hz. Additionally, single peaks occurred which differed between data recorded in different labs. The peak detection algorithm was optimized by applying the algorithm for various values of the coefficient c to all PSDs. For each value of c the averaged Se and the PPV was computed. The optimization resulted in a median PPV of 91.9% and a median sensitivity of 92.1%. The extended f0 calculation achieved a median Se and PPV of 100%. The filtering resulted a median relative peak power of 0.992 by the use of the peak detection algorithm and a median relative peak power of 0.991 using the f0 calculation. The evaluation of the quality of the EGM which is illustrated in Figure 3 resulted in an SNR of 1.3 dB.
3.2 Filtering
Resulting PSDs of an exemplary EMG are illustrated in Figure 2. At the top (A), a cutout of the PSD of the unfiltered signal is shown. Since most peaks appear at multiples of 40 Hz and 50 Hz, the assumption was made that these were harmonics of f0 of 40 Hz and 50 Hz. The middle plot (B) illustrates the PSD after filtering by the automatic peak detection. It is visible that all peaks above 70 Hz were detected and filtered. At the bottom (C), the PSD after filtering using the f0 calculation is illustrated. As can be seen, 40 Hz and 50 Hz, as well as the harmonic frequencies, were filtered. In Figure 3 the corresponding EGMs are plotted. At the top (A) the reference ECG is shown. The VFFs are clearly visible in the corresponding EGM.
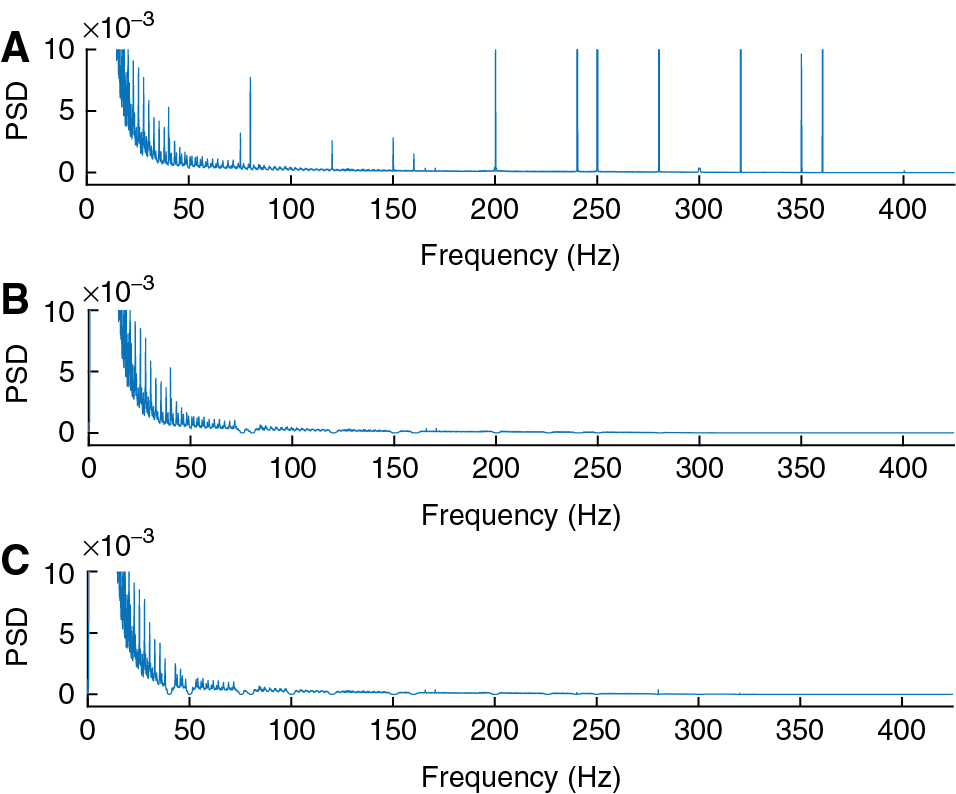
The PSD before filtering (A), after filtering using the peak detection algorithm (B) and after filtering using the f0 calculation (C).
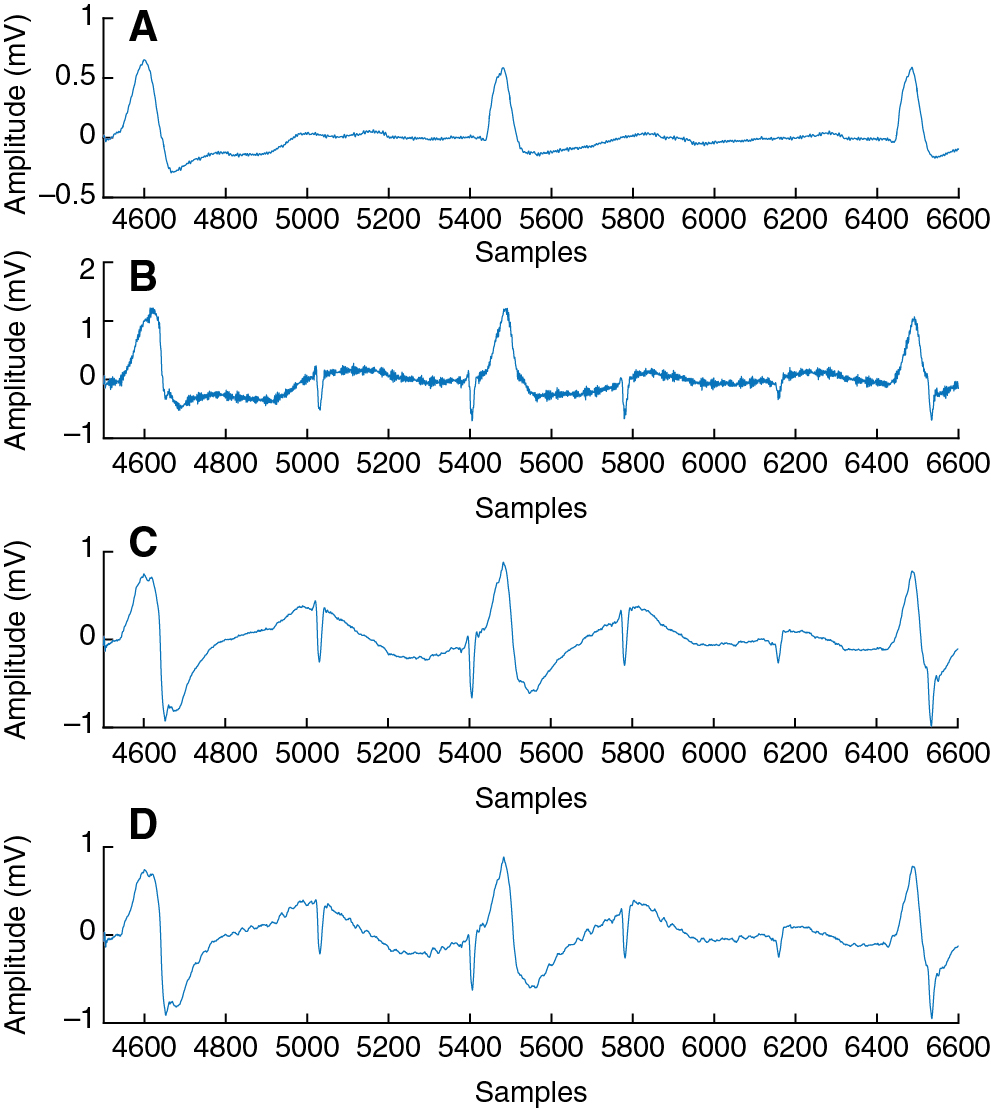
The EGM before filtering (B), after filtering using the peak detection algorithm (C) and after filtering using the f0 calculation (D). The signals in (C) and (D) are filtered with a band-pass of 1 Hz – 300 Hz. The reference ECG is illustrated in (A).
4 Discussion
The preprocessing of the unipolar signals showed good results. The peak detection resulted in a median sensitivity of 92.1% and a PPV of 91.9% and the f0 calculation resulted in a median Se and PPV of 100%. The performance of the filtering was measured considering the relative peak power with an ideal value of one. The results were very good with a median of 0.992 using the peak detection and a median of 0.991 using the f0 calculation. The results in time domain looked quite well using both filtering techniques. Removal of the 40 Hz component does not seem reasonable due to the introduced artifact.
5 Outlook
In this research, the preprocessing techniques only were applied to ten data sets which were recorded in Munich and Karlsruhe. The methods should be applied to more data, preferable derived from other clinics. Additionally, the quality of the signal should be enhanced by preprocessing in the time domain. Artifacts such as VFFs or stimulation artifacts should be suppressed, since they strongly disturb the unipolar EGMs. Furthermore, the filtered data should be further processed. The preprocessed data can be analyzed with novel algorithms (5). Local activation time maps (LAT maps) can be generated by the processing of the filtered raw data. An exemplary LAT map which was generated by the processing of the raw data is illustrated in Figure 4.

LAT map generated out of the processed raw data. The left atrium is illustrated. A roof-dependent flutter circuit around the left pulmonary veins is visible. This was in agreement with the clinical diagnosis. The scale is specified in milliseconds.
Author’s Statement
Research funding: The author state no funding involved. Conflict of interest: Authors state no conflict of interest. Material and Methods: Informed consent: Informed consent has been obtained from all individuals included in this study. Ethical approval: The research related to human use complies with all the relevant national regulations, institutional policies and was performed in accordance with the tenets of the Helsinki Declaration, and has been approved by the authors’ institutional review board or equivalent committee.
References
[1] Nakagawa H, Ikeda A, Sharma T, Lazzara R, Jackman WM. “Rapid high resolution electroanatomical mapping: evaluation of a new system in a canine atrial linear lesion model. Circulation. Arrhythmia and Electrophysiology. 2012;5:417–24.10.1161/CIRCEP.111.968602Search in Google Scholar PubMed
[2] Ptaszek LM, Chalhoub F, Perna F, Beinart R, Barrett CD, Danik SB, et al. “Rapid acquisition of high-resolution electroanatomical maps using a novel multielectrode mapping system”. J Interv Card Electrophysiol. 2013;36:233–-42.10.1007/s10840-012-9733-ySearch in Google Scholar PubMed
[3] Welch P. The use of fast fourier transform for the estimation of power spectra: a method based on time averaging over short, modified periodograms. Audio and Electroacoustics, IEEE Transactions. 1967;15:70–-3.10.1109/TAU.1967.1161901Search in Google Scholar
[4] Lenis G, Pilia NA, Oesterlein T, Luik A, Schmitt C, Dössel O. P wave detection and delineation in the ECG based on the phase free stationary wavelet transform and using intracardiac atrial electrograms as reference. Biomed Tech (Berl). 2016;61:37–56.10.1515/bmt-2014-0161Search in Google Scholar PubMed
[5] Oesterlein TG, Schmid J, Bauer S, Jadidi A, Schmitt C, Dössel O, et al. Analysis and visualization of intracardiac electrograms in diagnosis and research: concept and application of KaPAVIE. Comput Methods Programs Biomed. 2016;127:165–73.10.1016/j.cmpb.2015.12.007Search in Google Scholar PubMed
©2016 Salina Huck et al., licensee De Gruyter.
This work is licensed under the Creative Commons Attribution-NonCommercial-NoDerivatives 4.0 License.
Articles in the same Issue
- Synthesis and characterization of PIL/pNIPAAm hybrid hydrogels
- Novel blood protein based scaffolds for cardiovascular tissue engineering
- Cell adhesion and viability of human endothelial cells on electrospun polymer scaffolds
- Effects of heat treatment and welding process on superelastic behaviour and microstructure of micro electron beam welded NiTi
- Long-term stable modifications of silicone elastomer for improved hemocompatibility
- The effect of thermal treatment on the mechanical properties of PLLA tubular specimens
- Biocompatible wear-resistant thick ceramic coating
- Protection of active implant electronics with organosilicon open air plasma coating for plastic overmolding
- Examination of dielectric strength of thin Parylene C films under various conditions
- Open air plasma deposited antimicrobial SiOx/TiOx composite films for biomedical applications
- Systemic analysis about residual chloroform in PLLA films
- A macrophage model of osseointegration
- Towards in silico prognosis using big data
- Technical concept and evaluation of a novel shoulder simulator with adaptive muscle force generation and free motion
- Usability evaluation of a locomotor therapy device considering different strategies
- Hypoxia-on-a-chip
- Integration of a semi-automatic in-vitro RFA procedure into an experimental setup
- Fabrication of MEMS-based 3D-μECoG-MEAs
- High speed digital interfacing for a neural data acquisition system
- Bionic forceps for the handling of sensitive tissue
- Experimental studies on 3D printing of barium titanate ceramics for medical applications
- Patient specific root-analogue dental implants – additive manufacturing and finite element analysis
- 3D printing – a key technology for tailored biomedical cell culture lab ware
- 3D printing of hydrogels in a temperature controlled environment with high spatial resolution
- Biocompatibility of photopolymers for additive manufacturing
- Biochemical piezoresistive sensors based on pH- and glucose-sensitive hydrogels for medical applications
- Novel wireless measurement system of pressure dedicated to in vivo studies
- Portable auricular device for real-time swallow and chew detection
- Detection of miRNA using a surface plasmon resonance biosensor and antibody amplification
- Simulation and evaluation of stimulation scenarios for targeted vestibular nerve excitation
- Deep brain stimulation: increasing efficiency by alternative waveforms
- Prediction of immediately occurring microsleep events from brain electric signals
- Determining cardiac vagal threshold from short term heart rate complexity
- Classification of cardiac excitation patterns during atrial fibrillation
- An algorithm to automatically determine the cycle length coverage to identify rotational activity during atrial fibrillation – a simulation study
- Deriving respiration from high resolution 12-channel-ECG during cycling exercise
- Reducing of gradient induced artifacts on the ECG signal during MRI examinations using Wilcoxon filter
- Automatic detection and mapping of double potentials in intracardiac electrograms
- Modeling the pelvic region for non-invasive pelvic intraoperative neuromonitoring
- Postprocessing algorithm for automated analysis of pelvic intraoperative neuromonitoring signals
- Best practice: surgeon driven application in pelvic operations
- Vasomotor assessment by camera-based photoplethysmography
- Classification of morphologic changes in photoplethysmographic waveforms
- Novel computation of pulse transit time from multi-channel PPG signals by wavelet transform
- Efficient design of FIR filter based low-pass differentiators for biomedical signal processing
- Nonlinear causal influences assessed by mutual compression entropy
- Comparative study of methods for solving the correspondence problem in EMD applications
- fNIRS for future use in auditory diagnostics
- Semi-automated detection of fractional shortening in zebrafish embryo heart videos
- Blood pressure measurement on the cheek
- Derivation of the respiratory rate from directly and indirectly measured respiratory signals using autocorrelation
- Left cardiac atrioventricular delay and inter-ventricular delay in cardiac resynchronization therapy responder and non-responder
- An automatic systolic peak detector of blood pressure waveforms using 4th order cumulants
- Real-time QRS detection using integrated variance for ECG gated cardiac MRI
- Preprocessing of unipolar signals acquired by a novel intracardiac mapping system
- In-vitro experiments to characterize ventricular electromechanics
- Continuous non-invasive monitoring of blood pressure in the operating room: a cuffless optical technology at the fingertip
- Application of microwave sensor technology in cardiovascular disease for plaque detection
- Artificial blood circulatory and special Ultrasound Doppler probes for detecting and sizing gaseous embolism
- Detection of microsleep events in a car driving simulation study using electrocardiographic features
- A method to determine the kink resistance of stents and stent delivery systems according to international standards
- Comparison of stented bifurcation and straight vessel 3D-simulation with a prior simulated velocity profile inlet
- Transient Euler-Lagrange/DEM simulation of stent thrombosis
- Automated control of the laser welding process of heart valve scaffolds
- Automation of a test bench for accessing the bendability of electrospun vascular grafts
- Influence of storage conditions on the release of growth factors in platelet-rich blood derivatives
- Cryopreservation of cells using defined serum-free cryoprotective agents
- New bioreactor vessel for tissue engineering of human nasal septal chondrocytes
- Determination of the membrane hydraulic permeability of MSCs
- Climate retainment in carbon dioxide incubators
- Multiple factors influencing OR ventilation system effectiveness
- Evaluation of an app-based stress protocol
- Medication process in Styrian hospitals
- Control tower to surgical theater
- Development of a skull phantom for the assessment of implant X-ray visibility
- Surgical navigation with QR codes
- Investigation of the pressure gradient of embolic protection devices
- Computer assistance in femoral derotation osteotomy: a bottom-up approach
- Automatic depth scanning system for 3D infrared thermography
- A service for monitoring the quality of intraoperative cone beam CT images
- Resectoscope with an easy to use twist mechanism for improved handling
- In vitro simulation of distribution processes following intramuscular injection
- Adjusting inkjet printhead parameters to deposit drugs into micro-sized reservoirs
- A flexible standalone system with integrated sensor feedback for multi-pad electrode FES of the hand
- Smart control for functional electrical stimulation with optimal pulse intensity
- Tactile display on the remaining hand for unilateral hand amputees
- Effects of sustained electrical stimulation on spasticity assessed by the pendulum test
- An improved tracking framework for ultrasound probe localization in image-guided radiosurgery
- Improvement of a subviral particle tracker by the use of a LAP-Kalman-algorithm
- Learning discriminative classification models for grading anal intraepithelial neoplasia
- Regularization of EIT reconstruction based on multi-scales wavelet transforms
- Assessing MRI susceptibility artefact through an indicator of image distortion
- EyeGuidance – a computer controlled system to guide eye movements
- A framework for feedback-based segmentation of 3D image stacks
- Doppler optical coherence tomography as a promising tool for detecting fluid in the human middle ear
- 3D Local in vivo Environment (LivE) imaging for single cell protein analysis of bone tissue
- Inside-Out access strategy using new trans-vascular catheter approach
- US/MRI fusion with new optical tracking and marker approach for interventional procedures inside the MRI suite
- Impact of different registration methods in MEG source analysis
- 3D segmentation of thyroid ultrasound images using active contours
- Designing a compact MRI motion phantom
- Cerebral cortex classification by conditional random fields applied to intraoperative thermal imaging
- Classification of indirect immunofluorescence images using thresholded local binary count features
- Analysis of muscle fatigue conditions using time-frequency images and GLCM features
- Numerical evaluation of image parameters of ETR-1
- Fabrication of a compliant phantom of the human aortic arch for use in Particle Image Velocimetry (PIV) experimentation
- Effect of the number of electrodes on the reconstructed lung shape in electrical impedance tomography
- Hardware dependencies of GPU-accelerated beamformer performances for microwave breast cancer detection
- Computer assisted assessment of progressing osteoradionecrosis of the jaw for clinical diagnosis and treatment
- Evaluation of reconstruction parameters of electrical impedance tomography on aorta detection during saline bolus injection
- Evaluation of open-source software for the lung segmentation
- Automatic determination of lung features of CF patients in CT scans
- Image analysis of self-organized multicellular patterns
- Effect of key parameters on synthesis of superparamagnetic nanoparticles (SPIONs)
- Radiopacity assessment of neurovascular implants
- Development of a desiccant based dielectric for monitoring humidity conditions in miniaturized hermetic implantable packages
- Development of an artifact-free aneurysm clip
- Enhancing the regeneration of bone defects by alkalizing the peri-implant zone – an in vitro approach
- Rapid prototyping of replica knee implants for in vitro testing
- Protecting ultra- and hyperhydrophilic implant surfaces in dry state from loss of wettability
- Advanced wettability analysis of implant surfaces
- Patient-specific hip prostheses designed by surgeons
- Plasma treatment on novel carbon fiber reinforced PEEK cages to enhance bioactivity
- Wear of a total intervertebral disc prosthesis
- Digital health and digital biomarkers – enabling value chains on health data
- Usability in the lifecycle of medical software development
- Influence of different test gases in a non-destructive 100% quality control system for medical devices
- Device development guided by user satisfaction survey on auricular vagus nerve stimulation
- Empirical assessment of the time course of innovation in biomedical engineering: first results of a comparative approach
- Effect of left atrial hypertrophy on P-wave morphology in a computational model
- Simulation of intracardiac electrograms around acute ablation lesions
- Parametrization of activation based cardiac electrophysiology models using bidomain model simulations
- Assessment of nasal resistance using computational fluid dynamics
- Resistance in a non-linear autoregressive model of pulmonary mechanics
- Inspiratory and expiratory elastance in a non-linear autoregressive model of pulmonary mechanics
- Determination of regional lung function in cystic fibrosis using electrical impedance tomography
- Development of parietal bone surrogates for parietal graft lift training
- Numerical simulation of mechanically stimulated bone remodelling
- Conversion of engineering stresses to Cauchy stresses in tensile and compression tests of thermoplastic polymers
- Numerical examinations of simplified spondylodesis models concerning energy absorption in magnetic resonance imaging
- Principle study on the signal connection at transabdominal fetal pulse oximetry
- Influence of Siluron® insertion on model drug distribution in the simulated vitreous body
- Evaluating different approaches to identify a three parameter gas exchange model
- Effects of fibrosis on the extracellular potential based on 3D reconstructions from histological sections of heart tissue
- From imaging to hemodynamics – how reconstruction kernels influence the blood flow predictions in intracranial aneurysms
- Flow optimised design of a novel point-of-care diagnostic device for the detection of disease specific biomarkers
- Improved FPGA controlled artificial vascular system for plethysmographic measurements
- Minimally spaced electrode positions for multi-functional chest sensors: ECG and respiratory signal estimation
- Automated detection of alveolar arches for nasoalveolar molding in cleft lip and palate treatment
- Control scheme selection in human-machine- interfaces by analysis of activity signals
- Event-based sampling for reducing communication load in realtime human motion analysis by wireless inertial sensor networks
- Automatic pairing of inertial sensors to lower limb segments – a plug-and-play approach
- Contactless respiratory monitoring system for magnetic resonance imaging applications using a laser range sensor
- Interactive monitoring system for visual respiratory biofeedback
- Development of a low-cost senor based aid for visually impaired people
- Patient assistive system for the shoulder joint
- A passive beating heart setup for interventional cardiology training