Spatial distribution and potential ecological risk assessment of some trace elements in sediments and grey mangrove (Avicennia marina) along the Arabian Gulf coast, Saudi Arabia
-
Hameed Alsamadany
 ,
Hassan S. Al-Zahrani
,
Hassan S. Al-Zahrani

Abstract
To assess trace element concentrations (Zn, Cu, Pb, Cr, Cd and Ni) in the mangrove swamps along the Saudi coast of the Arabian Gulf, thirteen samples of surface sediment and leaves of grey mangrove, Avicennia marina were collected and analyzed. The detected trace element contents (μg g-1) in surface sediments were in the following descending order according to their mean values; Cr (49.18) > Zn (48.48) > Cu (43.06) > Pb (26.61) > Ni (22.88) > Cd (3.21). The results showed that the average concentrations of Cd and Pb exceeded their world average concentration of shale. The geo-accumulation, potential ecological risk and toxicity response indices demonstrated that trace elements have posed a considerable ecological risk, especially Cd. The inter-relationships between physico-chemical characters and trace elements suggests that grained particles of mud represent a noteworthy character in the distribution of trace elements compared to organic materials. Moreover, the results revealed that Zn was clearly bioaccumulated in leaf tissues A. marina. Dredging, landfilling, sewage effluents and oil pollution can be the paramount sources of pollution in the area under investigation.
1 Introduction
Mangrove ecosystem is the main intertidal wetlands along the coastlines of tropical and subtropical ecosystems between 30oN and 30oS latitude, covering an area between 160,000 and 200,000 km2 [1]. It has unique ecological benefits in balance of the marine ecosystems [2]. It acts as a natural barrier against global warming, coastal erosion and storm surge besides storing huge quantities of carbon in sediments [3,4]. Moreover, mangrove ecosystem is one of the most productive ecosystems in the world, with a net primary production of about 149 mg C m-2 y-1 [3], and it is considered as habitat for many wild animals and provides nursery areas for many fish and invertebrate species [5]. They play a major role in steadying sediments and striking shoreline erosion by binding and deposition of soil particles [6]. Furthermore, mangroves can be recognized as potential accumulators for soil-borne contaminants, including trace elements [7].
Trace elements contamination is a major ecological crisis in marine environments because they are potentially destructive, non-degradable, and bio-accumulative in tissues of organisms through the food web [8]. Marine sediments involve complexes of different particles with cohesive properties such as clays and muds and non-cohesive properties such as sands. Hence, they act as a sink and transporter for trace elements in the marine ecosystems [8,9]. Therefore, the movement and accumulation of trace elements are influenced by complicated issues like sediment composition and structure [10], reduction/ oxidation processes, grain-size distribution, contents of organic carbon, and hydrodynamic conditions [11]. Sediment contamination has been recognized as a major source of diminishing the quality of the aquatic environment, and various methods have been developed for their monitoring and management. Hence, sediment quality guidelines (SQGs) have been used to describe the levels of different contaminants in sediments along with various categories of adverse effects and are often used to understand the chemical properties of sediments [12,13].
Nowadays, the mangrove ecosystem has been increasingly threatened as a result of human interference, including manufacturing and agro-based industries, huge urbanization, oil spills, domestic wastes and human pressure of dredging and land reclamation that led to serious pollutants [e.g. 14, 15, 16, 17, 18, 19]. Unfortunately, because of a serious threat due to the contamination of trace elements, some areas of mangroves are being devastated all over the world [19]. However, characterizing the distribution of trace elements in the mangrove sediment could provide a better understanding of the mechanisms controlling the dispersal, accumulation, and fate of the metals in the mangrove surroundings. The shorelines of the Arabian Gulf are shallow with low sea level and frequent curves, creating many morphological features such as creeks and bays. Mangroves along the western Arabian Gulf of the Saudi Arabia cover an area of about 10.36 km2 constituting about 6% of the total area in the Indian Ocean [20]. The coastal waters along Saudi Arabian coasts on the Arabian Gulf were subjected to anthropogenic activities and pollutants such as landfilling and reclamation, sewage effluents, desalination discharge, oil leakages and solid wastes [e.g. 20,21, 22, 23]. For example, mangrove in Tarut Bay has declined significantly by 55.93% between 1972 and 2011 [20]. Several studies investigated the concentration of trace elements in sediments of coastal areas along the central Arabian Gulf shoreline of Saudi Arabia, including some mangrove stands [24]. More recently, Al-Kahtany et al. [15] and Almahasheer [25] assessed the concentrations of trace elements in the mangrove swamps of Tarut Island. Results obtained from previous studies were significantly different. Therefore, the current study aimed to clarify the ambiguous situation in Tarut Island as well as other mangrove stands along the Saudi Arabian coast of the gulf. It also aimed to study the spatial distribution of trace elements in sediments and mangrove leaves and to assess toxicity by trace elements using sediment quality guidelines (SQGs).
2 Materials and methods
2.1 Study area
The study area is located mostly within Tarut bay, which is situated on the Saudi Arabian coast of the Arabian Gulf. Its area is about 440 km2 and is characterized by its shallowness (average depth of 5m) and sandy texture at the bottom. This bay is located in an arid-hot environment with high air temperature more than 50oC in summer and very little rainfall rate [26]. Surface water temperatures in the Saudi Arabian coastal waters fluctuate between 10 and 35oC in winter and summer, respectively [27]. Sediments and leaves of the grey mangrove Avicennia marina were collected from thirteen mangrove stands along the Saudi coast of the Arabian Gulf (Figure 1) that extends to about 175 km. These sites are settled from south to north as follows: Dammam (one site), Saihat (two sites), Tarut Island (three sites), Safwa (three sites), Ras Tanura (three sites) and Abu Ali Island (one site). Dammam is represented by one site that is characterized by the presence of obliterated mangrove trees due to continuous dredging. Saihat has two sites; one is isolated from the open water by a sand bank and is subjected to sewage effluents, and the other site is located north to the previous stand and is not subjected to any type of discharge. Three sites were selected in Tarut Island; the first and third sites receive sewage effluents from Tarut treatment plant. Whereas the second was located away from this discharge. Finally, Ras Tanura region includes three sites and Abu Ali Island to the north was represented by one site. All of these sites are adjacent to Aramco refinery plants and harbors.
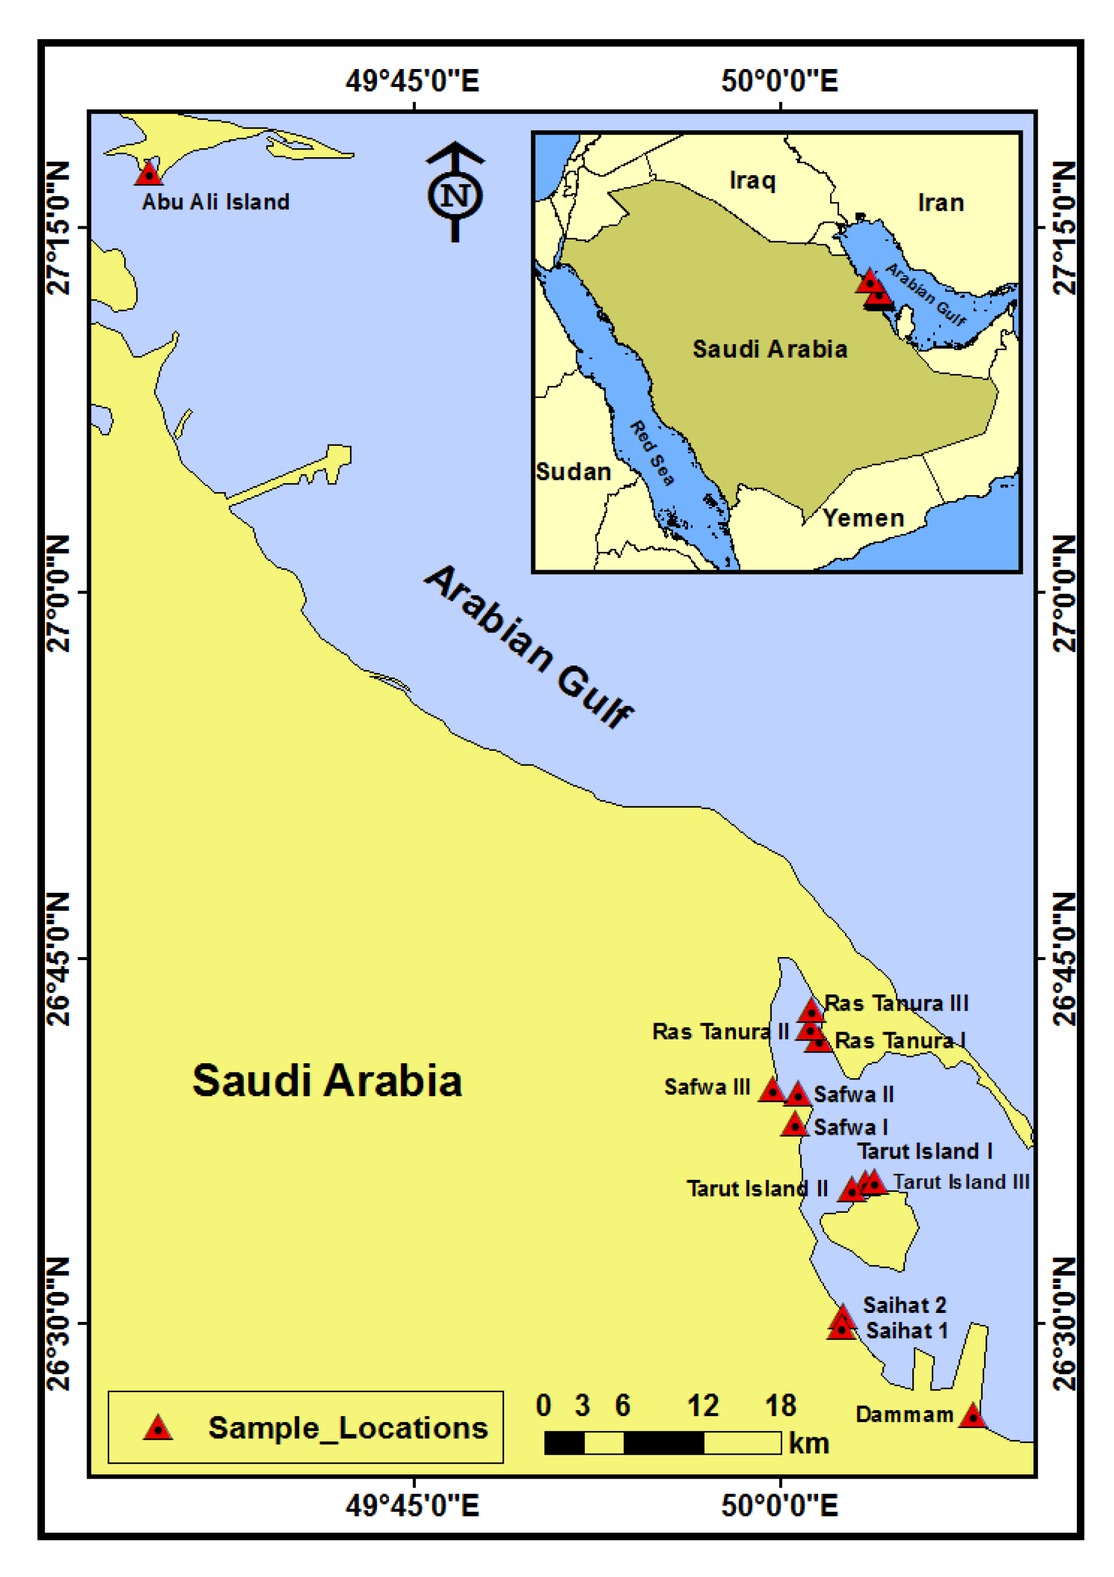
Sampling sites along the Saudi Arabian coast of the Arabian Gulf.
2.2 Sampling
From each sampling site, triplicate surface sediment samples (top 10cm) were collected during March-April 2017 using an acid-washed PVC core. These samples were transferred to the laboratory in plastic bottles where sediment samples were air-dried at approximately 25oC and stored for further analyses. For trace metal analyses, the dried samples were homogenized with a grinder, sieved through 63μm nylon mesh sieve and were kept in a desiccator until further analyses. Meanwhile, non-sieved samples were used for other physico-chemical analyses. Mangrove leaves were collected and kept in clean plastic zip lock pouches. In the laboratory, the leaves were gently cleaned, washed with deionized water to remove any sticking dust particles, oven-dried at 70oC until constant weight and homogenized with a clean grinder.
2.3 Sediment characteristics
The particle size distributions for sediment samples were performed using the pipette method [28]. The pH was measured in deionized water (at ~27oC) with 1:2.5 sediment to solution ratio using a pH meter supported with a Beckman glass electrode and the electrical conductivity (EC) was measured in saturated soil paste extract, while the total carbonates was determined using Collins Calcimeter according to Hesse [29]. In addition, the percentage of organic matter was also determined through the oxidation method using K2Cr2O7 as described by Walkley and Black [30]. All analyses were performed in triplicates and the three values were averaged.
2.4 Trace elements digestion and analysis
From each site, 200 mg of sieved sediment samples (<63μm) was digested with 10 ml of HNO3 and 4 ml of HCl for approximately 3 hours until a clear solution was obtained to ensure appropriate digestion according to EPA method 3052 [31]. Then, the digested sediment samples were cooled to room temperature, diluted to a total volume of 50 ml after being filtered through Whatman No.1 filter paper and then kept at 4oC until analysis. Similarly, 0.5g of dried and homogenized leaf samples was digested with 5ml concentrated HNO3 and 2ml of H2O2 in polyethylene tubes at digestion systems for 2h at 100°C and finally made to a total volume of 50ml [32]. The concentrations of trace elements (Zn, Cu, Pb, Cr, Cd and Ni) in sediments and leaves were analyzed using inductively coupled plasma-atomic emission spectrometry (Optima 5300 DV Perkin Elmer, with an auto-sampler Model AS 93 Plus/ S10). A standard sediment reference material (BCSS-1) was processed at the same time along with the samples. The average recoveries of the measures trace elements were 103±2.7%, 95±1.0%, 105±1.1%, 104±4.7%, 88±0.02% and 108±3.7% for Zn, Cu, Pb, Cr, Cd and Ni, respectively.
2.5 Ecological risk assessment indices
Different risk or contamination indices, namely geo-accumulation index (Igeo), contamination factor (Cf), potential ecological risk index (Eri) and potential toxicity response index (RI) have been utilized to assess the trace elements pollution in the current study. The geo-accumulation index (Igeo) was adopted by Müller [33] and is calculated using the following equation:
where, Cn is the concentration of metal (n) in sediment and Bn is the geochemical background value in the shale [34]. The constant 1.5 was used to account for potential variability in reference value due to the lithogenic inputs.
Then, seven criteria were applied as proposed by Müller [33]: uncontaminated (UC), uncontaminated to moderately contaminated (UMC), moderately contaminated (MC), moderately to heavily contaminated (MHC), heavily contaminated (HC), heavily to extremely contaminated (HEC) and an extremely contaminated (EC) at Igeo of <0, 1, 1-2, 2-3, 3-4, 4-5 and >5, respectively. The contamination factor (Cf) is the ratio obtained by dividing the concentration of each metal in the sediment background and considered as a major tool for identifying the pollution and the contamination level in the environmental matrix. It is calculated as follows:
where Mx is metal concentration in sediment and Mb is the background value, which refers to the concentration of metal in the sediments when there is no anthropogenic input [34]. The protocols of Håkanson [35] categorized the levels of contamination in terms of the following factors: Cf<1 represents low levels of contamination; 1≤Cf<3 indicates moderate levels of contamination; 3≤Cf <6 is a category, which can be considered as below the higher-level contamination; and Cf≥6 indicates higher levels of contamination. The degrees of contamination (Cd) are normally a reflection of the sum of total contamination factors and are calculated according to the following method: Cd≤7 can be considered a low degree of contamination; 7≤Cd<14 moderate degree of contamination 14≤Cd<28 considerable degree of contamination and Cd≥28 very high degree of contamination The overall degree of contamination is given by the following equation:
The potential ecological risk coefficient (Eri) was estimated using the formula mentioned by Håkanson [35] as follows:
where Tri is the metals toxic response factors (Pb=5, Cd=30, Cr=2, Cu=5, Zn=5 and Ni=5), Ci is trace elements concentration in the sediment, and C0 is the background value for trace elements. Moreover, the potential toxicity response index (RI) was used to determine the trace metal toxicity in sediments and the subsequent environmental response. The potential ecological risk index (RI) was calculated as follows:
Then, the classification criteria for RI classes by trace elements are according to the calculations of Håkanson [35], and it is as follows: Eri <40 falls in low risk (LR), 40≤ Eri <80 in moderate risk (MR), 80≤ Eri <160 as considerable risk (CR), 160≤ Eri <320: high risk (HR) and 320≤ Eri very high risk (VHR). While, RI was classified into four levels: RI<150: low risk (LR), 150≤RI<300: moderate risk (MR), 300≤RI<600: considerable risk (CR) and 600≤RI: very high risk (VHR).
2.6 Sediment quality guidelines (SQGs)
To describe the potential negative effects of contaminated sediments on the biological systems, the sediment quality guidelines (SQGs) were used [36]. Generally, these effects are termed as threshold effect levels (TEL), probable effect levels (PEL) according to the Canadian Council of Ministers of the Environment [37]. Meanwhile, effect range low (ERL) and effect range median (ERM) were used based on Long et al. [36]. In order to find out the possible and realistic measure of predicted toxicity, the mean quotient of ERM or PEL were calculated according to Long et al. [36].
2.7 Toxic units (ΣTUs)
The potential acute toxicity of contaminants in sediment samples was estimated as the sum of the toxic units (ΣTUs), where a toxic unit (TU) is defined as the ratio of each determined trace metal concentration to its PEL value according to Pederson et al. [38].
2.8 Biological concentration factor (BCF)
The plant’s ability to accumulate different trace elements from surrounding sediment was estimated using bioconcentration factor (BCF) calculated using the following formula:
where, Cleaves and C sediments represent the concentrations of trace elements in leaves and sediments, respectively.
2.9 Statistical Analysis
Descriptive statistical analysis of the studied characteristics was performed using SPSS software (version 23.0). In addition, Pearson’s correlation coefficient was calculated to determine the interrelationships among the physico-chemical properties of sediments and the observed trace elements concentration in sediment and leaf samples. Principal Component Analysis (PCA) was performed as an explorative data analysis to figure out the systematic variation in the data and to identify the patterns hidden in the results.
Ethical approval: The conducted research is not related to either human or animal use.
3 Results and Discussion
3.1 Sediment characteristics
The particle size distribution in sediments normally considered as an effective tool to study the parental origin and lithogenic pathways in its deposition [39]. In the current study, sediments mainly composed of sand (80.26%) and varied between 64.10 and 94.60% at sites 7 and 13, respectively (Table 1). While the mud fraction fluctuated from 5.40% at site 13 to 35.90% at sites 7 (average: 19.74±9.21%). The obtained sand fractions were also classified based on their nature to siliceous, hyperthermic, to aquic Torripsamments. The occurrence of fine sediments in almost all the sediment samples is probably due to many reasons such as lithogenic origin, nature of the parent material, resultant of urban encroachment and degradation of coastal shorelines along the study area. Additionally, many aspects can affect the sediment grain size difference in the marine environment, such as sediment transportation and sedimentary process [35]. There are many studies that showed that the mangrove ecosystems can increase the suspension solid deposited by reducing the water dynamics and thereby releasing maximum time for fine-grained sediments, which are a main sink for trace elements [40]. Moreover, continuous remobilizing of trace elements ascended in water bodies as a result of the physical, chemical and biological operations in the sediments [41]. The pH values, which was in the majority of the studied sediment samples were alkaline, fluctuated between 7.49 and 8.51 at sites 6 and 13, respectively (average: 8.02±0.27). Salinity values showed a variation between 5.27 dSm-1 at site 13 to 14.55 dSm-1 at site 3 with an average of 7.37 dSm-1±2.57 (Table 1). The differences in salinity can be explained by variations in grain size and mineralogical composition of sediments [42]. The most important salinity controlled minerals are carbonate-bearing (calcite and aragonite) and evaporite minerals (halite).
Descriptive statistics of physico-geochemical properties of sediments along the west coast of Arabian Gulf, Saudi Arabia.
| Site no. | Location | Particle size distribution (%) | Sediment Texture | Sediment Taxonomy | pH | EC (dSm-1) | OM (%) | CaCO3 (%) | |
|---|---|---|---|---|---|---|---|---|---|
| Sand | Mud | ||||||||
| 1 | DAMMAM | 81.00 | 19.00 | S L | Torripsamments | 8.25 | 8.50 | 3.20 | 34.65 |
| SAIHAT | |||||||||
| 2 | Saihat I | 79.30 | 20.70 | SC L | Fluvaquents | 8.16 | 6.38 | 2.86 | 31.20 |
| 3 | Saihat II | 66.80 | 33.20 | SC L | Fluvaquents | 7.65 | 14.55 | 4.55 | 31.20 |
| TARUT ISLAND | |||||||||
| 4 | Tarut I | 79.60 | 20.40 | SC L | Fluvaquents | 7.99 | 6.70 | 3.90 | 31.20 |
| 5 | Tarut II | 83.80 | 16.20 | S L | Torripsamments | 8.35 | 6.49 | 2.69 | 25.90 |
| 6 | Tarut III | 84.10 | 15.90 | S L | Torripsamments | 7.49 | 6.42 | 3.76 | 40.02 |
| SAFWA | |||||||||
| 7 | Safwa I | 64.10 | 35.90 | S C. | Fluvaquents | 8.10 | 7.22 | 2.51 | 37.90 |
| 8 | Safwa II | 86.00 | 14.00 | S L | Torripsamments | 7.95 | 6.21 | 3.15 | 37.90 |
| 9 | Safwa III | 65.90 | 34.10 | S C | Fluvaquents | 7.98 | 10.46 | 4.08 | 38.40 |
| RAS TANOURA | |||||||||
| 10 | Ras Tanura I | 85.10 | 14.90 | L S | Torripsamments | 7.88 | 6.85 | 3.58 | 29.00 |
| 11 | Ras Tanura II | 86.60 | 13.40 | L S | Torripsamments | 8.00 | 5.36 | 1.61 | 40.00 |
| 12 | Ras Tanura III | 86.50 | 13.50 | L S | Torripsamments | 7.89 | 5.45 | 2.86 | 35.70 |
| 13 | ABU ALI ISLAND | 94.60 | 5.40 | S | Quartzipsamments | 8.51 | 5.27 | 1.43 | 22.30 |
| Minimum | 64.10 | 5.40 | 7.49 | 5.27 | 1.43 | 22.33 | |||
| Maximum | 94.60 | 35.90 | 8.51 | 14.55 | 4.55 | 40.02 | |||
| Average | 80.26 | 19.74 | 8.02 | 7.37 | 3.09 | 33.49 | |||
| Standard deviation | 9.21 | 9.21 | 0.27 | 2.57 | 0.91 | 5.58 | |||
Sediment textures: Sand S; Loam L; Sandy Loam SL; Coarse Loam CL; Fine Loam FL; Sandy Clay Loam SCL; Coarse Silt CS; Silty Clay Loam SLCL; Fine Silt FS; Silty Clay SC; Clay C; Fine clay FC
The organic matter (OM) of mangrove sediments may be derived from terrigenous materials and/or decay of animals and plants as well as its assimilation pathways [43]. The percent of organic matter content in the collected sediments fluctuated from 1.43 to 4.55% at sites 13 and 3, respectively (average: 3.09±0.91%, Table 1). Interestingly, the OM content in the current study followed the same trend as the salinity values at sites 3 and 9. Furthermore, spatial distribution of OM with finer sediments in the present study showed that hydrodynamic processes could play a vital role in the accumulation of organic matter within the surface sediments [44]. It is worth mentioning that OM values obtained from the surface sediments of mangrove areas of Arabian Gulf were low in comparison with the global mean of 7.9% of the estuarine tropical mangrove systems [45]. Rapid tidal export that may eventually export the locally formed organic materials to the coastal zone might be a possible reason for the lower values [45]. In addition, the limited absorption of the organic substances due to the presence of negatively charged coarse grains that originate from terrigenous sediments can also result in lower values of organic matter [46]. In the present study, carbonate contents of sediments showed its minimum of 22.30% at site 13 and a maximum of 40.02% at site 6 (average: 33.49%). This carbonate content originated mainly from land-derived terrigenous materials as well as biogenic sources. It is documented that it plays a key-role in controlling the availability of potentially toxic elements [47].
3.2 Spatial distribution of trace elements in sediments and sediment quality guidelines (SQGs)
The concentrations of the analyzed trace elements in sediments were in the ranges of 34.98-64.28, 12.51-67.09, 20.90-40.54, 21.77-77.18, 1.09-7.30 and 13.87-32.00 μg g-1, for Zn, Cu, Pb, Cr, Cd and Ni, respectively (Table 2). The mean concentrations of various trace elements were in the following descending order: 49.18±18.22 for Cr> 48.48±7.96 for Zn> 43.06±17.48 for Cu> 26.61±6.29 for Pb> 22.88±6.39 for Ni> 3.21±1.71 for Cd. It is clear that most of the measured trace elements showed higher values at Tarut Island sites (Figure 2). For example, maximum concentrations of both Cu (67.09 μg g-1) and Cr (77.18 μg g-1) were observed at site 5. Similarly, site 6 exhibited the maximum concentrations of Pb (40.54 μg g-1) and Cd (7.30 μg g-1). Relatively higher concentration of Ni (32.00 μg g-1) was detected at site 4. Whereas, the highest concentration of Zn (64.28 μg g-1) was observed at site 13. These high concentrations can be related to human activities in Tarut Island. These anthropogenic contributions include sewage effluents, landfilling, urban encroachment and ports activity. This conclusion is similar to the findings obtained by Youssef et al. [22] and Almasoud et al. [23] in the same area. Almasoud et al. [23] stated that sediments around Tarut Bay were enriched with Zn, Cu, Cr and Pb from anthropogenic sources, while Ni originated from the soil parent materials and natural process. Moreover, higher concentration of trace elements observed in the study can be considered as a result of the presence of fine-grained sediments. For example, sites 3, 7 and 9 had the highest percent of mud (33.20, 35.90 and 34.10%, respectively) and accounted for the raised trace element concentrations. In comparison with the mean continental shale [34], it is assumed that the averages of Pb and Cd exhibited higher values than the shale background, while Cu, Pb, Cr, Cd and Ni display greater values with reference to upper continental crust values (UCC) [48] (Table 3). The obtained trace element concentrations were also compared with other mangrove sediments from all over the world. The average concentration of Cu (43.06 μg g-1) was higher in comparison to the most studies carried in coastal areas of the Arabian Gulf and the Red Sea. Similarly, the average concentrations of Cr, Cd and Ni were also found to be greater than the previous studies in the Arabian Gulf [49,50]. In addition, the average concentration of Pb (26.61 μg g-1) was higher than those recorded in some areas reported in the previous studies except for Shriadah [49] and Usama et al. [51] in Abu-Dhabi and Farasan Island, respectively. The average concentration of Zn (48.48 μg g-1) was higher than those recorded in the coastal areas of the Arabian Gulf and the Red Sea except for Tubli, Bahrain [15], Hara Biosphere Reserve, Iran [50] and Farasan Island [51] (Table 3). Recently, trace elements were studied in the same area and it was found that data obtained through the current study could be comparable with previous studies [15,22,23]. However, results of Almahasheer [25] were incredibly higher than that recorded in mangrove sediments in the current study as well as previous studies all over the world. Reasons of the hundred-fold concentrations of trace elements reported by Almahasheer [25] were not given. In comparison to some mangrove sediments worldwide, the current study revealed that the average concentrations of most trace elements were higher (Table 3). This is mainly due to huge discharges of both domestic and municipal wastewaters as well as effluents from different industrial activities in the study area [22, 23, 24]. Appropriate assessment of organisms that live in the mangrove-sediment ecosystem can deliver comprehensive baseline on the impact of such high concentrations of Cd on their health and can be useful in drawing future strategies to restrict the contamination [52].

Spatial distribution of different trace elements (µg g-1) in sediments and mangrove leaves along the Arabian Gulf coastal area.
Spatial distribution of trace elements (μg g-1) in surface sediments and sediment quality guidelines along the west coast of the Arabian Gulf, Saudi Arabia.
| Site no. | Location | Concentrations of trace elements in sediments (μg g-1) | |||||
|---|---|---|---|---|---|---|---|
| Zn | Cu | Pb | Cr | Cd | Ni | ||
| 1 | DAMMAM | 48.89 | 60.98 | 27.30 | 56.10 | 2.87 | 31.90 |
| SAIHAT | |||||||
| 2 | Saihat I | 51.04 | 46.90 | 32.78 | 53.06 | 2.53 | 27.30 |
| 3 | Saihat II | 52.80 | 58.75 | 20.90 | 21.77 | 1.97 | 15.78 |
| TARUT ISLAND | |||||||
| 4 | Tarut I | 44.36 | 49.78 | 23.30 | 67.90 | 2.30 | 32.00 |
| 5 | Tarut II | 50.64 | 67.09 | 26.00 | 77.18 | 4.20 | 21.50 |
| 6 | Tarut III | 40.00 | 38.45 | 40.54 | 41.85 | 7.30 | 28.98 |
| SAFWA | |||||||
| 7 | Safwa I | 55.56 | 23.89 | 21.36 | 23.89 | 1.09 | 17.89 |
| 8 | Safwa II | 34.98 | 12.51 | 34.10 | 34.02 | 4.50 | 16.00 |
| 9 | Safwa III | 40.00 | 14.51 | 21.40 | 29.25 | 1.90 | 23.97 |
| RAS TANURA | |||||||
| 10 | Ras Tanura I | 43.20 | 34.00 | 23.90 | 43.80 | 2.77 | 24.89 |
| 11 | Ras Tanura II | 48.34 | 57.00 | 21.70 | 69.29 | 2.89 | 13.87 |
| 12 | Ras Tanura III | 56.21 | 47.88 | 21.10 | 63.83 | 1.96 | 26.89 |
| 13 | ABU ALI ISLAND | 64.28 | 48.00 | 31.60 | 57.46 | 5.40 | 16.46 |
| Minimum | 34.98 | 12.51 | 20.90 | 21.77 | 1.09 | 13.87 | |
| Maximum | 64.28 | 67.09 | 40.54 | 77.18 | 7.30 | 32.00 | |
| Average | 48.48 | 43.06 | 26.61 | 49.18 | 3.21 | 22.88 | |
| Standard deviation | 7.96 | 17.48 | 6.29 | 18.22 | 1.70 | 6.39 | |
| Sediment quality guidelines (SQGs) | |||||||
| Threshold effect level (TEL)[a] | 124 | 18.70 | 30.20 | 52.30 | 3.65 | 32.00 | |
| Probable effect level (PEL)[a] | 271 | 108.0 | 112.0 | 160.4 | 4.20 | 43.00 | |
| Effect range low (ERL)[b] | 150 | 34.00 | 46.70 | 81.00 | 1.20 | 20.90 | |
| Effect range median (ERM)[b] | 410 | 270 | 218 | 370 | 9.60 | 51.60 | |
Comparison of trace elements concentrations (µg g-1) in marine sediments with regional and worldwide studies.
| Location | Zn | Cu | Pb | Cr | Cd | Ni | References |
|---|---|---|---|---|---|---|---|
| Minimum | 34.98 | 12.51 | 20.90 | 21.77 | 1.09 | 13.87 | Current study |
| Maximum | 64.28 | 67.09 | 40.54 | 77.18 | 7.30 | 32.00 | |
| Average | 48.48 | 43.06 | 26.61 | 49.18 | 3.21 | 22.88 | |
| Standard deviation | 7.96 | 17.48 | 6.29 | 18.22 | 1.70 | 6.39 | |
| Mean Continental Shale | 95 | 45 | 20 | 90 | 0.30 | 68 | [34] |
| UCC | 71 | 25 | 20 | 35 | 0.098 | 20 | [46] |
| Arabian Gulf | |||||||
| Saudi Arabia | |||||||
| Tarut Bay and Gurmah Island | 7.28 | 1.83 | 11.78 | 6.68 | 1.06 | 8.21 | [54] |
| Tarut Bay | 26.9 | 6.9 | 144.82 | 26.2 | 1.45 | - | [22] |
| Tarut Bay | 789 | 4503 | 4207 | 1486 | 1686 | 2459 | [25] |
| Tarut Island | 28.35 | 209.8 | 4.39 | 50.65 | 1.67 | 81.05 | [15] |
| Bahrain | |||||||
| Tubli Bay | 49.00 | 18.46 | - | 2.45 | - | 6.55 | [15] |
| Tubli Bay | 891.0 | 3782.0 | 4113.0 | 1549.0 | 4150 | 2677 | [25] |
| Abu-Dhabi, UAE | 9.05 | 6.33 | 37.3 | 8.28 | 5.17 | 14.00 | [49] |
| Hara Biosphere Reserve, Iran | 49.39 | 20.98 | 7.94 | 194.29 | 2.63 | 101.48 | [50] |
| Coastal areas of the Red Sea | |||||||
| Saudi Arabia coastal area | - | 22.87 | 3.82 | 46.11 | 0.75 | 21.11 | [70] |
| Farasan Island | 57.0 | 112.0 | 45.2 | 9.6 | 1.23 | 8.50 | [51] |
| Egypt | 35.67 | 13.54 | 11.12 | - | 0.75 | 11.03 | [60] |
| Worldwide | |||||||
| Muthupet, India | 27.96 | 13.49 | 13.49 | - | 0.29 | - | [71] |
| Sunarban, Bangladesh | 58.59 | 31.73 | 17.88 | 38.69 | 0.07 | 167.29 | [46] |
| Punta Piuta, Costa Rica | 11.40 | 9.80 | 25.60 | 19.80 | 6.00 | 99.00 | [72] |
| Punta Mala Bay, Panama | 105.0 | 56.3 | 78.20 | 23.3 | <10 | 27.3 | [73] |
| Port Klang, Malaysia | 51.05 | 17.43 | 59.45 | 46.4 | 0.83 | 11.44 | [74] |
| Guanabara Bay, Brazil | 483.0 | 98.6 | 160.8 | 42.4 | 1.32 | - | [75] |
| Hainan Island, China | 57.0 | 18.0 | 19.00 | 40.0 | 0.11 | - | [76] |
| Hong Kong | 96.00 | 43.00 | 2.60 | 2.90 | 1.08 | 31.20 | [7] |
| Hong Kong | 293.0 | 46.00 | 199.0 | 14.00 | 0.60 | 66.00 | [77] |
* Only data of mangrove sediments
Concerning sediment quality guidelines, numerous studies have been carried out in order to evaluate the potential toxicity of sediment and its adverse effect on the ecosystem [37]. Based on Canadian council of ministers of the environment, there are mainly two categories of sediment quality guidelines (SQGs) established (TEL-PEL). The concentration below which has less adverse biological effects and termed as TEL; while the concentration above which has adverse biological effects frequently occur and termed as PEL. With respect to threshold effect concentration (TEC), it is evident from Table (2) that the maximum concentrations of Cu, Pb, Cr, Cd and Ni (67.09, 40.45, 77.18, 7.30 and 32.00 μg g-1, respectively) exceeded the TEL limit, while that of Zn (64.28 μg g-1) was below TEL. The comparison between TEL-PEL SQGs and Zn, Cu, Pb, Cr, Cd and Ni contents in sediment samples exhibited percentages below TEL values with 100, 15.38, 69.23, 46.15, 69.23 and 92.23%, respectively. Meanwhile, the concentrations of Zn, Cu, Pb, Cr, Cd and Ni in the sediments have values between TEL and PEL (0.0, 84.62, 30.77, 53.85, 30.77 and 7.69%, respectively). The maximum concentrations of Cu, Cd and Ni were higher than those of the ERL SQGs values (Table 2). The abundances of Zn, Cu, Pb, Cr, Cd and Ni in sediment samples with those of ERL-ERM SQGs showed percentages below the ERL levels of 100, 23.08, 100, 100, 7.69 and 38.46%, respectively. On the other hand, Cu (76.92%), Cd (92.31%) and Ni (61.54%) fall-in between ERL-ERM SQGs ranges. From the obtained results, there is scarce or no adverse biological impact on biological pathways due to trace element contents in the mangrove-sediment ecosystem.
3.3 Trace elements accumulation in mangrove leaves
The obtained results revealed that the average concentrations of detected trace elements were in the following descending order; 27.96> 14.45> 9.25> 5.06> 2.83> 1.28 for Zn, Pb, Cr, Ni, Cu and Cd, respectively (Table 4). The concentration of Zn in leaf tissues ranged from 18.19 at site 13 to 36.30 μg g-1 at site 3 (Figure 2). The concentration of Cu fluctuated between 1.30 and 6.00 μg g-1 at sites 2 and 3, respectively. While, the concentration of Pb ranged from 7.20 at site 2 to 17.40 μg g-1 at site 4. Moreover, Cr concentrations fluctuated between 5.30 at site 12 to 18.20 μg g-1 at site 1. Both Cd and Ni concentrations in the leaves varied between minimum of 0.45 and 1.60 at site 7 to maximum of 2.98 and 15.26 μg g-1 at site 6, respectively (Figure 2).
Comparison of trace element contents (μg g-1 DW) in mangrove leaves with regional and around the world.
| Location | Trace elements concentration (μg g-1 DW) | References | |||||
|---|---|---|---|---|---|---|---|
| Zn | Cu | Pb | Cr | Cd | Ni | ||
| Minimum | 18.19 | 1.30 | 7.2 | 5.30 | 0.45 | 1.60 | |
| Maximum | 36.60 | 6.00 | 17.40 | 18.20 | 2.98 | 15.26 | |
| Average | 27.96 | 2.83 | 14.45 | 9.25 | 1.28 | 5.06 | |
| Standard deviation | 5.14 | 1.43 | 2.88 | 3.72 | 0.70 | 4.27 | |
| Excessive Levels | 100-400 | 20-100 | 30-300 | 5-30 | 5-30 | 10-100 | [54] |
| Coastal areas of Arabian Gulf | |||||||
| Tarut Bay, Saudi Arabia | 196.0 | 370.0 | 1075.0 | 540.0 | 839.0 | 706.0 | [25] |
| Tubli Bay, Bahrain | 189.0 | 323.0 | 1120.0 | 567.0 | 894.0 | 699.0 | [25] |
| United Arab Emirates | 2.46 | 0.01 | 0.06 | 0.01 | - | - | [59] |
| Coastal areas of the Red Sea | |||||||
| Coastal area, Red Sea | - | 13.24 | 3.79 | 14.96 | 0.18 | 7.56 | [70] |
| Farasan Island, Red Sea | 29.5 | 356.6 | - | 9.30 | 1.04 | 2.30 | [51] |
| Egypt | 79.74 | 12.60 | 21.63 | - | 0.83 | 6.21 | [60] |
| Worldwide | |||||||
| FAO | - | 40.00 | 5.00 | 5.00 | 0.20 | 1.50 | [1] |
| Peninsular, Malaysia | 5.90 | 26.80 | 35.50 | 9.50 | 1.0 | - | [18] |
| China | 143.00 | 15.50 | 2500 | - | 0.48 | 3.32 | [58] |
Even though the concentrations of most of the elements in leaf tissues of mangrove plants were lower than that those in the surrounding sediments (Figure 2), Zinc exhibited comparatively higher values indicating its importance as an essential micronutrient that mediate several enzyme pathways such as respiration and hormone synthesis [53]. According to the excessive levels mentioned by Kabata-Pendias and Pendias [54], Cr in the mangrove leaves is categorized between the level of 5-30 μg g-1 DW at site 13. While, Ni concentrations fall in between the excessive level of 10 and100 μg g-1 at sites 6 and 8, respectively. The non-essential trace elements such as Pb, Cd and Ni exhibited higher values in leaves at site 6 might be a result of huge discharge of untreated or semi-treated domestic and municipal wastes along with the additions from different industries [25,55]. Moreover, higher concentrations of Zn in the leaf tissues analyzed within the studied mangrove-sediment indicates the inability of mangroves to intake this particular micronutrient owing to the resistance of mangrove leaves to trace elements [56]. In the current study, the higher concentrations of trace elements in the mangrove tissues further explain the capability of mangrove plants to uptake and accumulate many metal ions such as Pb and Cd in their tissues [57]. This is very important in order to avoid the trace metal pollution in coastal areas, and thereby, preserving the biodiversity in the Arabian Gulf coast. The obtained results revealed that the elevated concentrations of Cr at site 13, Cd and Ni at site 6 within the mangrove tissues were higher than that in the leaves of A. marina from various mangroves grown on the other areas worldwide (Table 4). However, the Pb concentration (17.40 μg g-1) was lower than that in the leaves of mangrove in Peninsular, Malaysia [18], China [58] and Egypt [60]. Furthermore, the concentration of Cu in the mangrove tissues in this study was higher than that in mangrove leaves (6.00 μg g-1) measured in United Arab Emirates [59]. Only the highest concentration of Zn in the mangrove tissues at site 3 (36.30 μg g-1) was lower than that in the leaves of A. marina in China [58] and Egypt [60]. Thus, the regions and level of trace metal pollutions significantly influence the process of trace metal bioaccumulation in the mangrove ecosystem.
3.4 Biological Concentration Factor (BCF)
In the current study, the descending mean values of BCF for all mangrove samples followed the sequence of Zn (0.59) > Pb (0.57) > Cd (0.41) > Ni (0.24) > Cr (0.22) > Cu (0.09). The greatest value of BCF among the various study sites for Zn was 0.84 at site 8 indicating that Zn is clearly bioaccumulated in leaf tissues of A. marina. On the other hand, the lowest value of BCF was recorded for Cu (0.02) at site 11 (Figure 3). This can be attributed to the low minimal mobility of this particular metal (Cu) in the respective sediments.
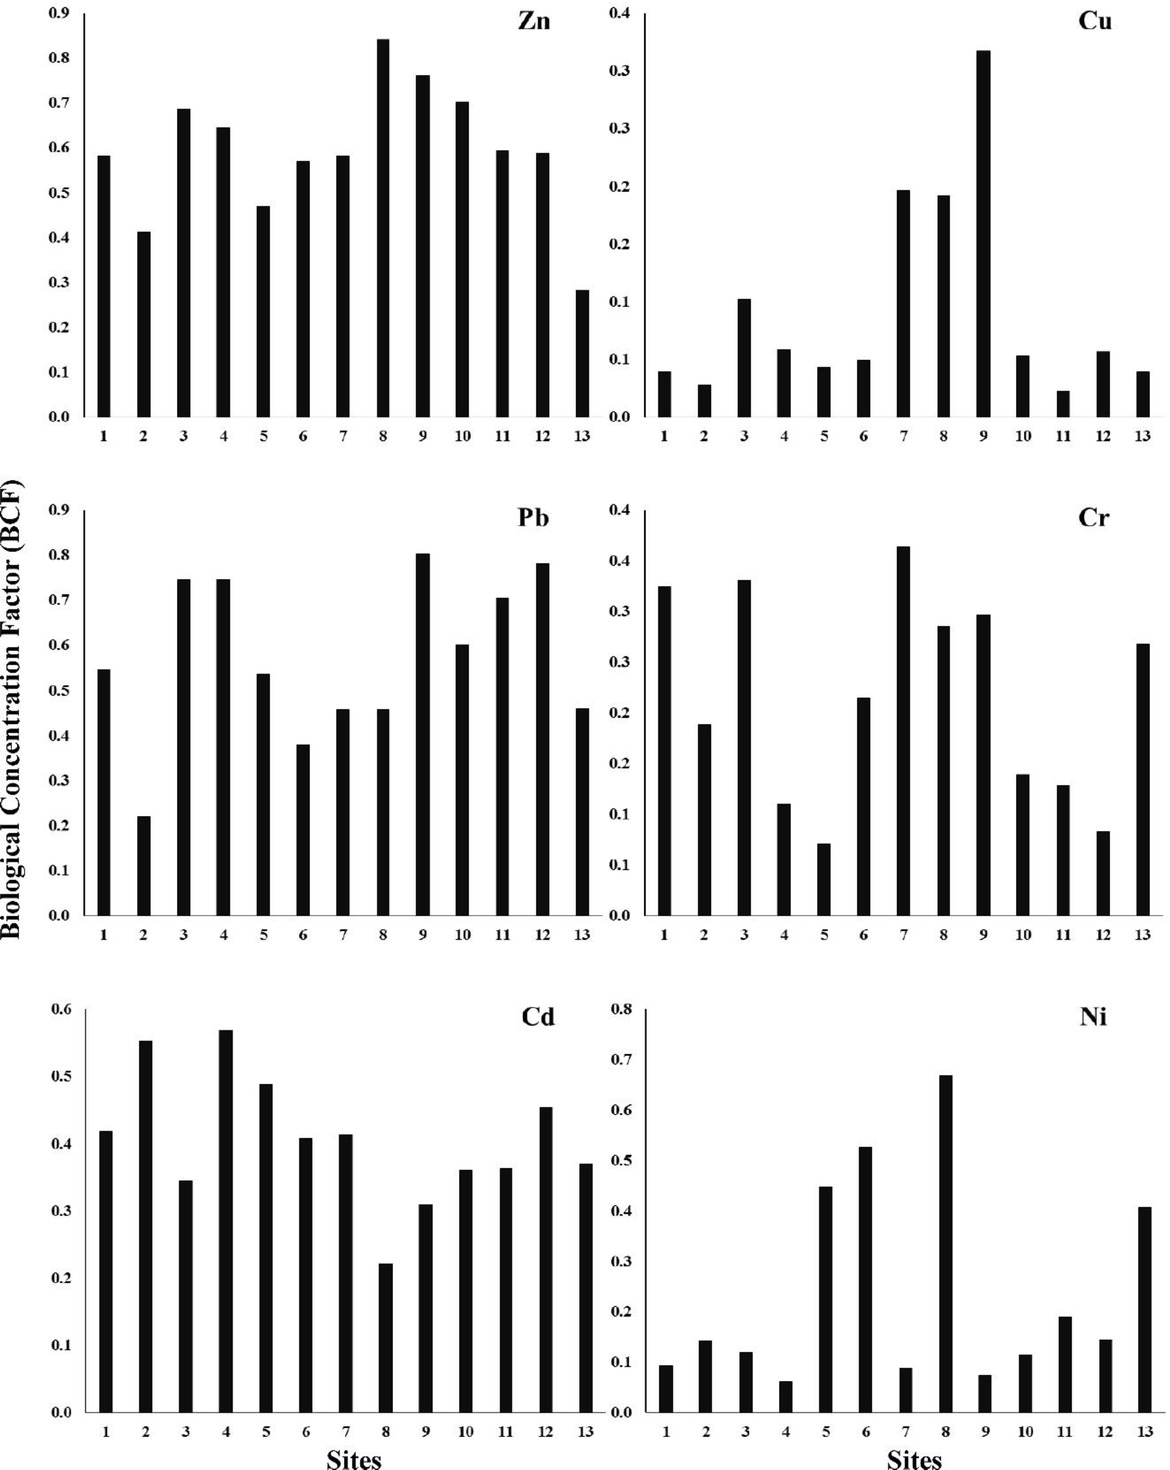
Biological concentration factor of trace elements at different sites along the Arabian Gulf coastal area.
The concentrations of Zn, Cu, Cr, Pb and Ni were higher in the respective sediments, but the BCF values did not clearly indicate the bioavailability of these trace elements in sediments or in the subsequent metal uptake by mangroves. This might be due to the restriction of trace elements through complexation or the fixation process with organic particles that are subjected to reduction pathway [61,62]. Therefore, speciation experiments of trace elements in sediments should be increased progressively in order to describe the toxicity and bioavailability of such elements [17,63].
3.5 Contamination status based on the geo-accumulation Index (Igeo)
The average of the Igeo value for Zn, Cu, Cr and Ni at all investigated sites can be classified as uncontaminated (Igeo≤0) (Table 5). While, only four sites 2, 6, 8 and 13 showed levels that can be considered as uncontaminated to moderately contaminated sediments by Pb (0<Igeo<1).
Averages of geo-accumulation (Igeo) of the studied trace elements at studied sites.
| Site no. | Sampling sites | Averages of Igeo of the detected trace elements | Igeo class | ||||||||||
|---|---|---|---|---|---|---|---|---|---|---|---|---|---|
| Zn | Cu | Pb | Cr | Cd | Ni | Zn | Cu | Pb | Cr | Cd | Ni | ||
| 1 | DAMMAM | -1.54UC | -0.15UC | -0.14UC | -1.27/ UC | 2.67MHC | -1.68UC | 0 | 0 | 0 | 0 | 3 | 0 |
| SAIHAT | |||||||||||||
| 2 | Saihat I | -1.48UC | -0.53UC | 0.13UMC | -1.35/ UC | 2.49MHC | -1.90UC | 0 | 0 | 1 | 0 | 3 | 0 |
| 3 | Saihat II | -1.43UC | -0.20UC | -0.52UC | -2.63UC | 2.13MHC | -2.69UC | 0 | 0 | 0 | 0 | 3 | 0 |
| TARUT ISLAND | |||||||||||||
| 4 | Tarut I | -1.68UC | -0.44UC | -0.36UC | -0.99UC | 2.35MHC | -1.67UC | 0 | 0 | 0 | 0 | 3 | 0 |
| 5 | Tarut II | -1.49UC | -0.01UC | -0.21UC | -0.81UC | 3.22HC | -2.25UC | 0 | 0 | 0 | 0 | 4 | 0 |
| 6 | Tarut III | -1.83UC | -0.81UC | 0.43UMC | -1.69UC | 4.02HEC | -1.82UC | 0 | 0 | 1 | 0 | 5 | 0 |
| SAFWA | |||||||||||||
| 7 | Safwa I | -1.36UC | -1.50UC | -0.49UC | -2.50UC | 1.28MC | -2.51UC | 0 | 0 | 0 | 0 | 2 | 0 |
| 8 | Safwa II | -2.03UC | -2.43UC | 0.18UMC | -1.99UC | 3.32HC | -2.67UC | 0 | 0 | 1 | 0 | 4 | 0 |
| 9 | Safwa III | -1.83UC | -2.22UC | -0.49UC | -2.21UC | 2.08MHC | -2.09UC | 0 | 0 | 0 | 0 | 3 | 0 |
| RAS TANURA | |||||||||||||
| 10 | Ras Tanura I | -1.72UC | -0.99UC | -0.33UC | -1.62UC | 2.62MHC | -2.03UC | 0 | 0 | 0 | 0 | 3 | 0 |
| 11 | Ras Tanura II | -1.56UC | -0.24UC | -0.47UC | -0.96/ UC | 2.68MHC | -2.88UC | 0 | 0 | 0 | 0 | 3 | 0 |
| 12 | Ras Tanura III | -1.34UC | -0.50UC | -0.51UC | -1.08/ UC | 2.12MHC | -1.92UC | 0 | 0 | 0 | 0 | 3 | 0 |
| 13 | ABU ALI ISLAND | -1.15UC | -0.49UC | 0.07UMC | -1.23/ UC | 3.58HC | -2.63UC | 0 | 0 | 1 | 0 | 4 | 0 |
Regarding Cd, only site 7 (7.69% of sediment samples) was categorized as moderately contaminated (MC), with a value of 1.28 with respect to Igeo index (1<Igeo<2), while 61.54% of the sediment samples exhibited moderately to heavily contaminated (MHC) with a range between 2.08 at site 9 and 2.68 at site 11 compared to Igeo index (2<Igeo<3). Furthermore, 23.08% (sites 5, 8 and 13) of studied samples were classified as the heavily contaminated (HC) according to Igeo index (3<Igeo<4). Finally, only one site (6) was defined as heavily to extremely contaminated (HEC) when compared with the Igeo index (4<Igeo<5). The higher contamination of Cd may be a resultant of wastewater drainage from the Qateef Oasis, which is supposed to bring agricultural wastes from Tarut Island [55]. The steady spatial distribution of selected trace elements in all study regions (except site 6) indicates the occurrence of non-point sources such as aquaculture and agricultural run-off.
3.6 Contamination factor (Cf)
Results showed that the Cf values for Zn, Cr, and Ni (Cf<1); which is considered to be a low contamination level at all study sites (Table 6). Except site 3, almost all the remaining sites were categorized as moderate contamination of sediments for Pb (1≤Cf<3). While, Cu ranged from low to moderate contamination with values of 38.46% to 61.54%, respectively. On the other hand, the contamination by Cd in most of the sites varied from considerably high (7.69% of total sites) to very high contamination (92.31% of total sites). The high Cf for Cd in all studied sites could result from the urban effluents that collect wastewater discharges from treatment plants. The degree of contamination (Cd) values for the current study indicates that 7.69% of total sites were in the lower level of contamination (<7) and 61.54% of total sites were in a moderate degree of contamination (7 ≤Cd<14). Furthermore, sites 5, 6, 8 and 13 (representing 30.77% of the total sites) fall under the category of considerably contaminated (14≤Cd<28) (Table 6).
Contamination factor of trace elements and Mean ERM in surface sediments in the study area.
| Site no. | Sampling Sites | Contamination factor (Cf) | CdDegree | Mean | ΣTUs | ||||||
|---|---|---|---|---|---|---|---|---|---|---|---|
| Zn | Cu | Pb | Cr | Cd | Ni | ERM-Q | PEL-Q | ||||
| 1 | DAMMAM | 0.51 | 1.36 | 1.37 | 0.62 | 9.57 | 0.47 | 13.89 | 0.32 | 0.51 | 3.09 |
| SAIHAT | |||||||||||
| 2 | Saihat I | 0.54 | 1.04 | 1.64 | 0.59 | 8.43 | 0.40 | 12.64 | 0.30 | 0.47 | 2.82 |
| 3 | Saihat II | 0.56 | 1.31 | 1.05 | 0.24 | 6.57 | 0.23 | 9.95 | 0.20 | 0.32 | 1.93 |
| TARUT ISLAND | |||||||||||
| 4 | Tarut I | 0.47 | 1.11 | 1.17 | 0.75 | 7.67 | 0.47 | 11.63 | 0.31 | 0.49 | 2.94 |
| 5 | Tarut II | 0.53 | 1.49 | 1.30 | 0.86 | 14.00 | 0.32 | 18.50 | 0.34 | 0.57 | 3.43 |
| 6 | Tarut III | 0.42 | 0.85 | 2.03 | 0.47 | 24.33 | 0.43 | 28.53 | 0.38 | 0.68 | 4.10 |
| SAFWA | |||||||||||
| 7 | Safwa I | 0.58 | 0.53 | 1.07 | 0.27 | 3.63 | 0.26 | 6.35 | 0.18 | 0.27 | 1.60 |
| 8 | Safwa II | 0.37 | 0.28 | 1.71 | 0.38 | 15.00 | 0.24 | 17.96 | 0.25 | 0.44 | 2.65 |
| 9 | Safwa III | 0.42 | 0.32 | 1.07 | 0.33 | 6.33 | 0.35 | 8.82 | 0.21 | 0.33 | 1.96 |
| RAS TANURA | |||||||||||
| 10 | Ras Tanura I | 0.45 | 0.76 | 1.20 | 0.49 | 9.24 | 0.37 | 12.50 | 0.26 | 0.42 | 2.53 |
| 11 | Ras Tanura II | 0.51 | 1.27 | 1.09 | 0.77 | 9.63 | 0.20 | 13.47 | 0.27 | 0.44 | 2.65 |
| 12 | Ras Tanura III | 0.59 | 1.06 | 1.06 | 0.71 | 6.53 | 0.40 | 10.34 | 0.29 | 0.44 | 2.66 |
| 13 | ABU ALI ISLAND | 0.68 | 1.07 | 1.58 | 0.64 | 18.00 | 0.24 | 22.20 | 0.33 | 0.57 | 3.42 |
| Descriptive statistics | |||||||||||
| Minimum | 0.37 | 0.28 | 1.05 | 0.24 | 3.63 | 0.20 | 6.35 | ||||
| Maximum | 0.68 | 1.49 | 2.03 | 0.86 | 24.33 | 0.47 | 28.53 | ||||
| Average | 0.51 | 0.96 | 1.33 | 0.55 | 10.69 | 0.33 | 14.37 | ||||
| Standard deviation | 0.08 | 0.39 | 0.31 | 0.20 | 5.05 | 0.09 | 6.04 | ||||
3.7 Mean ERM or PEL quotients
Generally, all the study sites had the potential toxic level of 21% based on the m-ERM-Q; 0.11-0.51 [36]. The lowest values of ERM-Q or PEL-Q were registered at site 7, demonstrating the minimum hazard levels of those regions. Based on the calculation of m-PEL-Q, all sites are defined as moderately impacted (m-PEL-Q; 0.1-1.0). This result coincided with those obtained from Bohai Bay and the coastal regions of Shandong Peninsula, Yellow Sea [64]. In terms of placing such features in ΣTUs category, the selected sites for the current study revealed that the toxicity was in following order: site 6> site 5> site 13> site 1> site 4> site 2> site 12> site 8> site 11> site 10> site 9> site 3> site 7 (Table 6).
3.8 Potential Ecological Risk Indices (Eir) and Potential Toxicity Response Index (RI)
From the results in (Table 7), it can be concluded that there is a parallel relation between the ecological risk assessment index (Eri) and Igeo index. In all sediments, Zn, Cr, Cu, Ni and Pb revealed a low ecological risk (Eri <40). On the other hand, Cd exhibited considerable risk (80≤ Eir<160) at site 7, whereas it revealed a high risk (160≤ Eir<320) at sites of sites 1-4, and 9-12. Furthermore, a very high ecological risk (VHR) (Eri >320) was observed at sites 5, 6, 8 and 13, respectively. These results could be an outcome of the huge anthropogenic wastes resultant of refining and untreated sewage effluents [55]. The highest RI value of 747.89 was recorded at site 6, while the lowest (119.43) was observed at site 7 with an average of 335.34. Considering the RI ranges, 7.69% of total studied sites categorized in low ecological risk (RI≤150); 46.15% categorized s moderate risk (150 ≤RI<300) and 38.64% to a category of considerable risk (300≤RI<600). On the other hand, one site classified as very high risk (RI>600).
Potential ecological risk indices (Eri ) and potential toxicity response index (RI) of trace elements.
| Site no. | Sampling Sites | Ecological risk categories of single trace metal (Eri) | Potential Toxicity Response Index (RI) | |||||
|---|---|---|---|---|---|---|---|---|
| Zn | Cu | Pb | Cr | Cd | Ni | |||
| 1 | DAMMAM | 0.51LR | 6.78LR | 6.83LR | 1.25LR | 287.00/HR | 2.35/LR | 304.71/CR |
| SAIHAT | ||||||||
| 2 | Saihat I | 0.54LR | 5.21LR | 8.20LR | 1.18LR | 253.00/HR | 2.01/LR | 270.13/MR |
| 3 | Saihat II | 0.56LR | 6.53LR | 5.23LR | 0.48LR | 197.00/HR | 1.16/LR | 210.95/MR |
| TARUT ISLAND | ||||||||
| 4 | Tarut I | 0.47LR | 5.53LR | 5.83LR | 1.51LR | 230.00/HR | 2.35/LR | 245.68/MR |
| 5 | Tarut II | 0.53LR | 7.45LR | 6.50LR | 1.72LR | 420.00/VHR | 1.58/LR | 437.78/CR |
| 6 | Tarut III | 0.42LR | 4.27LR | 10.14LR | 0.93LR | 730.00/VHR | 2.13/LR | 747.89/VHR |
| SAFWA | ||||||||
| 7 | Safwa I | 0.58LR | 2.65LR | 5.34LR | 0.53LR | 109.00/CR | 1.32/LR | 119.43/LR |
| 8 | Safwa II | 0.37LR | 1.39LR | 8.53LR | 0.76LR | 450.00/VHR | 1.18/LR | 462.22/CR |
| 9 | Safwa III | 0.42LR | 1.61LR | 5.35LR | 0.65LR | 190.00/HR | 1.76/LR | 199.80/LR |
| RAS TANURA | ||||||||
| 10 | Ras Tanura I | 0.45LR | 3.78LR | 5.98LR | 0.97LR | 277.20/HR | 1.83/LR | 290.11/MR |
| 11 | Ras Tanura II | 0.51LR | 6.33LR | 5.43LR | 1.54LR | 289.00/HR | 1.02/LR | 303.62/CR |
| 12 | Ras Tanura III | 0.59LR | 5.32LR | 5.28LR | 1.42LR | 195.75/HR | 1.98/LR | 210.33/MR |
| 13 | ABU ALI ISLAND | 0.68LR | 5.33LR | 7.90LR | 1.28LR | 540.00/VHR | 1.21/LR | 556.40/CR |
| Descriptive statistics | ||||||||
| Minimum | 0.37/LR | 1.39/LR | 5.23/LR | 0.48/LR | 109.00/CR | 1.02/LR | 119.43/LR | |
| Maximum | 0.68/LR | 7.45/LR | 10.14/LR | 1.72/LR | 730.00/VHR | 2.35/LR | 747.89/CR | |
| Average | 0.51/LR | 4.78/LR | 6.66/LR | 1.09/LR | 320.61/HR | 1.68/LR | 335.34/CR | |
| Standard deviation | 0.08 | 1.94 | 1.57 | 0.41 | 107.27 | 0.47 | 107.24 | |
3.9 Pearson’s correlation analysis
Pearson’s correlation was calculated in order to study the inter-relationship between the contaminants and physico-chemical properties of the mangrove-sediments (Table 8). Significant negative correlation was observed between sand fraction and trace elements in the sediments: Cr (r = -0.67, p<0.05) and Cd (r = -0.62, p<0.05), as well as in the leaves: Zn (r = -0.58, p<0.05), Cu (r = -0.83, p<0.05) and Cd (r = -0.57, p<0.05). These values indicate the lowest level of trace element absorption in the coarse-grained sediment due to many factors such as weathering, hydrodynamic transport, and deposition mechanism of fine-grained sediment. On the other hand, significant positive correlations were recorded between the mud fraction and trace elements in the sediments: Cr (r = 0.70, p<0.05), Cd (r = 0.85, p<0.05) and Cu in mangrove leaves (r = 0.86, p<0.05). It is identified that Cr and Cd exhibited homeostasis to accumulate within the fine-grained sediments, which may in turn act as a major transporter of these trace elements. This may be a resultant of high surface area, cation exchangeable capacity and deposition of inorganic or organic complexation [46]. Moreover, there is a positive correlation between the salinity and OM (r= 0.70, p<0.05). This could be attributed to the higher salinity levels with low osmotic potential that might reduce the microbial activity and then decomposition of organic matter [65]. In the current study, no significant correlations were detected between OM and measured trace elements in sediments and mangrove leaf tissues, except for Zn in mangrove leaves (r = 0.53, p<0.05) (Table 8). Therefore, OM content in the current study cannot provide a clear picture about the source of trace elements. However, a high relation has been observed between organic matter and trace elements through adsorption and complexation action in an aquatic environment, which in turn influences the geochemical behavior of trace elements in the marine environment [66].
Pearson’s correlation coefficients among soil properties and trace elements concentration in the study area.
| Sand | Mud | pH | EC | OM | CaCO3 | Concentrations in sediments | Concentrations in leaves | ||||||||||
|---|---|---|---|---|---|---|---|---|---|---|---|---|---|---|---|---|---|
| Zn | Cu | Pb | Cr | Cd | Ni | Zn | Cu | Pb | Cr | Cd | |||||||
| Mud | 0.97[**] | ||||||||||||||||
| pH | 0.28 | -0.15 | |||||||||||||||
| EC | 0.72[**] | 0.73[**] | -0.36 | ||||||||||||||
| OM | -0.55 | 0.45 | -0.66[*] | 0.70[**] | |||||||||||||
| CaCO3 | -0.34 | 0.20 | -0.58[*] | 0.04 | 0.19 | ||||||||||||
| Concentrations in sediments | |||||||||||||||||
| Zn | 0.11 | 0.05 | 0.52 | -0.08 | -0.55 | -0.53 | |||||||||||
| Cu | 0.29 | -0.29 | 0.24 | 0.03 | -0.19 | -0.45 | 0.50 | ||||||||||
| Pb | 0.46 | -0.44 | -0.07 | -0.36 | -0.08 | -0.02 | -0.26 | -0.14 | 0.03 | ||||||||
| Cr | -0.67[*] | 0.70[**] | 0.46 | -0.62[*] | -0.48 | -0.35 | 0.23 | 0.65[*] | 0.03 | ||||||||
| Cd | -0.62[*] | 0.57[*] | -0.08 | -0.37 | -0.17 | -0.11 | -0.18 | 0.04 | 0.85[**] | 0.18 | |||||||
| Ni | 0.03 | -0.12 | -0.11 | -0.11 | 0.42 | 0.03 | -0.23 | 0.14 | 0.17 | 0.28 | 0.01 | ||||||
| Concentrations in mangrove leaves | |||||||||||||||||
| Zn | -0.58[*] | 0.48 | -0.49 | 0.56[*] | 0.53[*] | 0.43 | -0.15 | -0.18 | -0.71[**] | -0.45 | -0.68[*] | -0.14 | |||||
| Cu | -0.83[**] | 0.86[**] | -0.24 | 0.82[**] | 0.53 | 0.09 | 0.08 | -0.16 | -0.53 | -.63[*] | -0.49 | -0.23 | 0.66[*] | ||||
| Pb | 0.17 | -0.18 | -0.31 | 0.17 | 0.32 | 0.13 | -0.33 | 0.00 | -0.20 | 0.12 | 0.15 | 0.07 | 0.32 | 0.17 | |||
| Cr | 0.21 | -0.09 | 0.48 | -0.05 | -0.31 | -0.10 | 0.21 | 0.10 | 0.35 | 0.01 | 0.24 | 0.09 | -0.41 | -0.24 | -0.11 | ||
| Cd | -0.57[*] | -0.54 | 0.01 | -0.40 | -0.15 | -0.24 | -0.02 | 0.32 | 0.77[**] | 0.42 | 0.89[**] | 0.29 | -0.78[**] | -0.35 | 0.01 | 0.18 | |
| Ni | 0.48 | -0.49 | -0.18 | -0.36 | -0.06 | 0.05 | -0.31 | -0.08 | 0.83[**] | 0.10 | 0.91[**] | 0.01 | -0.46 | -0.37 | 0.08 | 0.01 | 0.80[**] |
For sediments, a significant positive correlation was observed between pairs of detected trace elements such as Cu-Cr (r = 0.65, p<0.05) and Pb-Cd (r = 0.85, p<0.05). Meanwhile, a negative correlation was observed between Zn in mangrove leaves and both Pb (r = -0.71, p<0.05) and Cd (r = -0.68, p<0.05) in sediments. On the other hand, a positive correlation was registered between Pb in sediment and Cd (r = 0.77, p<0.05) and Ni (r = 0.83, p<0.05) in mangrove leaves, respectively. Furthermore, a strong positive correlation was observed between Cd in the sediment and concentration of Cd (r = 0.89, p<0.05) and Ni (r = 0.91, p<0.05) in mangrove leaves. With respect to mangrove leaves, there are positive correlations between pairs of trace elements such as Zn-Cu (r = 0.66, p<0.05) and Cd –Ni (r = 0.80, p<0.05). While, a negative correlation was registered for Zn-Cd (r = -0.78, p<0.05). According to Suresh et al. [67], if the correlation coefficient between the metals is high, metals have common sources, mutual dependence and identical behavior during the transport. The absence of correlation among the other metals suggests that the concentrations of these metals are not controlled by a single factor. In the present study, Cu, Zn, Ni, Cd and Cr had a common source, whereas others metals may have diverse sources. While, higher elemental pair correlation is representing the influence of primary anthropogenic source such as urbanization and human progress [68].
3.10 Principal component analysis (PCA)
The principal component analysis with varimax for various trace elements and the loadings recording more than 0.60 in the current study (Table 9). The first principal component (PC1), accounting for 38.65% of the total variance with an eigenvalue of 4.64, displayed significant weight components of Cr= 0.78 and sand= 0.76, explaining the role of weathering and anthropogenic sources [69]. On the other hand, the PC2 was accounted for 22.63% of the total variance of with an eigenvalue of 2.72 that dominated with Cu (0.78) and Zn (0.76). Moreover, the PC3 has loadings for the following trace elements Cd: 0.94 and Pb: 0.90 with total variance of 12.87% (eigenvalue= 1.54) which are commonly originated from anthropogenic inputs such as sewage treatment plant at Tarut Island (sites 4-6), the Aramco refinery at Abu Ali Island (site 13), commercial harbors and Industrial waste disposal at Dammam city (site 1) [51,55,70]. Eventually, PC4 amounted to 9.62% of the total variance with an eigenvalue of 1.15, which overloaded with Ni (0.85) OM (0.60). Obviously, these results may be a subsequent of the human activities as a result of the continuous inputs from various sewage discharge and Aramco refinery [55].
Principal component analysis (PCA) with varimax for various sediment categories.
| Parameters | PC1 | PC2 | PC3 | PC4 |
|---|---|---|---|---|
| EC (dSm-1) | -0.92 | -0.19 | 0.10 | |
| Mud % (Silt + Clay) | -0.79 | -0.12 | -0.47 | -0.18 |
| Cr (μg g-1) | 0.78 | 0.45 | 0.33 | |
| Sand % | 0.76 | 0.24 | 0.52 | |
| OM (%) | -0.72 | -0.26 | 0.60 | |
| CaCO3(%) | -0.86 | -0.17 | ||
| Cu (μg g-1) | 0.17 | 0.78 | 0.35 | |
| Zn (μg g-1) | 0.10 | 0.74 | -0.24 | -0.39 |
| pH | 0.42 | 0.56 | -0.17 | -0.38 |
| Cd (μg g-1) | 0.21 | 0.94 | ||
| Pb (μg g-1) | 0.14 | -0.13 | 0.90 | |
| Ni (μg g-1) | 0.10 | 0.85 | ||
| Eigen value | 4.64 | 2.72 | 1.54 | 1.15 |
| Variance % | 38.65 | 22.63 | 12.87 | 9.62 |
| Cumulative % | 38.65 | 61.28 | 74.15 | 83.76 |
A marked bold is referred to the loadings having a greater than 0.60 and bold loadings are statistically significant
4 Conclusion
The detected trace elements (μg g-1) in surface sediments of the investigated sites from Saudi Arabia’s Gulf coastline are in the following descending order according to their mean values; Cr>Zn>Cu>Pb>Ni>Cd. The elevated concentrations of the measured trace elements were recorded at sites that are subjected to different anthropogenic activities and pollutants. The Igeo and Eri results indicated that site 6 classified as heavily to extremely contaminated with Cd. Furthermore, contamination factor revealed the most sites varied from considerable to very highly contaminated with Cd but low contamination from Zn, Cr, Pb, and Ni. The interrelationships between physico-chemical characters of the sediments and trace elements suggests grained particles of mud represent a noteworthy character in the distribution of trace elements compared to organic materials. Moreover, the results revealed that Zn was clearly bioaccumulated in leaves of A. marina. Owing to environmental management, these results could be used as contribution to the information and rational management of the Arabian Gulf.
Acknowledgments
This project was funded by the Deanship of Scientific Research (DSR) at King Abdulaziz University, Jeddah, Saudi Arabia, under the grant no G-558-130-38. The authors, therefore, acknowledge with thanks DSR for technical and financial support.
Conflicts of Interest: The authors declare that there are no conflicts of interest regarding the publication of this work.
References
[1] FAO (Food and Agriculture Organization). The world’s mangroves 1980–2005, Rome: FAO. FAO For Pap. 2007;153:77p.Suche in Google Scholar
[2] Smee DL, Sanchez JA, Diskin M, Trettin C. Mangrove expansion into salt marshes alters associated faunal communities. Estuar Coast Shelf Sci. 2017;187:306–13.10.1016/j.ecss.2017.02.005Suche in Google Scholar
[3] Donato DC, Kauffman JB, Murdiyarso D, Kurnianto S, Stidham M, Kanninen M. Mangroves among the most carbon-rich forests in the tropics. Nat Geosci. 2011;4(5):293–7.10.1038/ngeo1123Suche in Google Scholar
[4] Kauffman JB, Arifanti VB, Trejo HH, del Carmen Jesús García M, Norfolk J, Cifuentes M, et al. The jumbo carbon footprint of a shrimp: carbon losses from mangrove deforestation. Front Ecol Environ. 2017;15(4):183–8.10.1002/fee.1482Suche in Google Scholar
[5] Spalding M, Kainuma M, Collins L. World Atlas of Mangroves. A collaborative project of ITTO, ISME, FAO, UNEP-WCMC, UNESCO-MAB, UNU-INWEH and TNC. London (UK): Earthscan, London, 2010, 319 pp. Data layer from the World Atlas of Mangroves. In Supplement to: Spalding et al. Cambridge (UK): UNEP World Conservation Monitoring Centre. 2010a.Suche in Google Scholar
[6] Farley J, Batker D, de la Torre I, Hudspeth T. Conserving mangrove ecosystems in the Philippines: transcending disciplinary and institutional borders. Environ Manage. 2010 Jan;45(1):39–51.10.1007/s00267-009-9379-4Suche in Google Scholar
[7] Tam NF, Wong YS. Spatial variation of heavy metals in surface sediments of Hong Kong mangrove swamps. Environ Pollut. 2000 Nov;110(2):195–205.10.1016/S0269-7491(99)00310-3Suche in Google Scholar
[8] Nobi EP, Dilipan E, Thangaradjou T, Sivakumar K, Kannan L. Geochemical and geo-statistical assessment of heavy metal concentration in the sediments of different coastal ecosystems of Andaman Islands, India. Estuar Coast Shelf Sci. 2010;87(2):253–64.10.1016/j.ecss.2009.12.019Suche in Google Scholar
[9] Gao X, Chen CTA. Heavy metal pollution status in surface sediments of the coastal Bohai Bay, Water Research. 2012;15;46(6):1901-11. https://doi.org/10.1016/j.watres.2012.01.00710.1016/j.watres.2012.01.007Suche in Google Scholar PubMed
[10] Li G, Cao Z, Lan D, Xu J, Wang S, Yin W. Spatial variations in grain size distribution and selected metal contents in the Xiamen Bay, China. Environmental Geology. 2007;52(8):1559–67.10.1007/s00254-006-0600-ySuche in Google Scholar
[11] Liu S, Shi X, Liu Y, Zhu Z, Yang G, Zhu A, et al. Concentration distribution and assessment of heavy metals in sediments of mud area from inner continental shelf of the East China Sea. Environ Earth Sci. 2011;64(2):567–79.10.1007/s12665-011-0941-zSuche in Google Scholar
[12] US EPA (United States Environmental Protection Agency), Contaminated sediment remediation guidance for hazardous waste sites. Office of Solid Waste and Emergency Response. EPA-540-R-05-012. OSWER, 9355:1-85.Suche in Google Scholar
[13] Bakan G, Özkoc HB. An ecological risk assessment of the impact of heavy metals in surface sediments on biota from the mid-Black Sea coast of Turkey. Int J Environ Stud. 2007;64(1):45–57.10.1080/00207230601125069Suche in Google Scholar
[14] Abou Seedo K, Abido MS, Salih AA, Abahussain A. Assessing heavy metals accumulation in the leaves and sediments of urban mangroves (Avicennia marina (Forsk.) Vierh.) in Bahrain, International Journal of Ecology. 2017;Article ID 3978216:8 p. https://doi.org/10.1155/2017/397821610.1155/2017/3978216Suche in Google Scholar
[15] Al-Kahtany K, El-Sorogy A, Al-Kahtany F, Youssef M. Heavy metals in mangrove sediments of the central Arabian Gulf shoreline, Saudi Arabia. Arab J Geosci. 2018;11(7):155.10.1007/s12517-018-3463-0Suche in Google Scholar
[16] Chai M, Li R, Tam NF, Zan Q. Effects of mangrove plant species on accumulation of heavy metals in sediment in a heavily polluted mangrove swamp in Pearl River Estuary, China. Environ Geochem Health. 2019 Feb;41(1):175–89.10.1007/s10653-018-0107-ySuche in Google Scholar PubMed
[17] Nazil MF, Hashim NR. Heavy metal concentrations in an important mangrove species, Sonneratia caseolaris, in Peninsular Malaysia. Environ Asia. 2010;3:50–5.Suche in Google Scholar
[18] MacFarlane GR, Koller CE, Blomberg SP. Accumulation and partitioning of heavy metals in mangroves: a synthesis of field-based studies. Chemosphere. 2007 Nov;69(9):1454–64.10.1016/j.chemosphere.2007.04.059Suche in Google Scholar PubMed
[19] Wang Y, Qiu Q, Xin G, Yang Z, Zheng J, Ye Z, et al. Heavy metal contamination in a vulnerable mangrove swamp in South China. Environ Monit Assess. 2013 Jul;185(7):5775–87.10.1007/s10661-012-2983-4Suche in Google Scholar PubMed
[20] Almahasheer H. Spatial coverage of mangrove communities in the Arabian Gulf, Environmental monitoring and assessment, 2018, 18, 190(2), 85.https://doi.org/10.1007/s10661-018-6472-210.1007/s10661-018-6472-2Suche in Google Scholar PubMed
[21] El-Sorogy AS, Tawfik M, Almadani SA, Attiah A. Assessment of toxic metals in coastal sediments of the Rosetta area, Mediterranean Sea, Egypt. Environ Earth Sci. 2016;75(5):398.10.1007/s12665-015-4985-3Suche in Google Scholar
[22] Youssef M, El-Sorogy A, Al Kahtany K, Al Otiaby N. Environmental assessment of coastal surface sediments at Tarut Island, Arabian Gulf (Saudi Arabia). Mar Pollut Bull. 2015 Jul;96(1-2):424–33.10.1016/j.marpolbul.2015.05.010Suche in Google Scholar PubMed
[23] Almasoud FI, Usman AI, Al-Farraj AS. Heavy metals in the soils of the Arabian Gulf coast affected by industrial activities: analysis and assessment using enrichment factor and multivariate analysis. Arab J Geosci. 2015;8(3):1691–703.10.1007/s12517-014-1298-xSuche in Google Scholar
[24] El-Sorogy A, Al-Kahtany K, Youssef M, Al-Kahtany F, Al-Malky M. Distribution and metal contamination in the coastal sediments of Dammam Al-Jubail area, Arabian Gulf, Saudi Arabia. Mar Pollut Bull. 2018 Mar;128:8–16.10.1016/j.marpolbul.2017.12.066Suche in Google Scholar PubMed
[25] Almahasheer H. High levels of heavy metals in Western Arabian Gulf mangrove soils. Mol Biol Rep. 2019 Apr;46(2):1585–92.10.1007/s11033-019-04603-2Suche in Google Scholar
[26] Ahmed MA. Recent benthic foraminifers from Tarut Bay, Arabian Gulf coast of Saudi Arabia. J Micropalaeontol. 1991;10(1):33–8.10.1144/jm.10.1.33Suche in Google Scholar
[27] Price AR, Sheppard CR, Roberts CM. The gulf: its biological setting. Mar Pollut Bull. 1993;27:9–15.10.1016/0025-326X(93)90004-4Suche in Google Scholar
[28] Dewis J, Fertias F. Physical and Chemical Methods of Soil and Water Analysis. FAO. Rome, Italy: Soils Bulletin; 1970. p. 10.Suche in Google Scholar
[29] Hesse PR. A Textbook of Soil Chemical Analysis. London, UK: John Murray; 1971.Suche in Google Scholar
[30] Walkley A, Black IA. An examination of the Degtareff method for determining soil organic matter, and a proposed modification of the chromic acid titration method. Soil Sci. 1934;37(1):29– 38.10.1097/00010694-193401000-00003Suche in Google Scholar
[31] Kingston H, Walter P. Microwave assisted acid digestion of siliceous and organically based matrices. EPA Draft Method. 1995;3052:2015–12.Suche in Google Scholar
[32] Spalla S, Baffi C, Barbante C, Turetta C, Cozzi G, Beone GM, et al. Determination of rare earth elements in tomato plants by inductively coupled plasma mass spectrometry techniques. Rapid Commun Mass Spectrom. 2009 Oct;23(20):3285–92.10.1002/rcm.4244Suche in Google Scholar
[33] Müller G. Index of geoaccumulation in sediments of the Rhine River. GeoJournal. 1969;2(3):108–18.Suche in Google Scholar
[34] Turekian KK, Wedepohl KH. Distribution of the elements in some major units of the earth’s crust. Geol Soc Am Bull. 1961;72(2):175–92.10.1130/0016-7606(1961)72[175:DOTEIS]2.0.CO;2Suche in Google Scholar
[35] Håkanson L. Ecological risk index for aquatic pollution control, A sedimentological approach. Water Res. 1980;14(8):975–1001.10.1016/0043-1354(80)90143-8Suche in Google Scholar
[36] Long ER, Macdonald DO, Sherri SL, Calder FD. Incidence of adverse biological effects within ranges of chemical concentrations in marine and estuarine sediments. Environ Manage. 1995;19(1):81–97.10.1007/BF02472006Suche in Google Scholar
[37] Canadian Council of Ministers of the Environment (CCME). 2002. Canadian sediment quality guidelines for the protection of aquat-ic life: summary tables. In: Canadian Environmental Quality Guidelines, Canadian Council of Ministers of Environment, Winnipeg. 1999;1-5.Suche in Google Scholar
[38] Pederson F, Bjorestad E, Andersen HV, Kjolholt J, Poll C. Characterization of sediments from copenhagen harbor by use of biotests, Water Science and Technology. 1998;37(6-7):233-40.10.2166/wst.1998.0757Suche in Google Scholar
[39] Ali YA, Beltagy AI, Lotfy IH. Grain size analysis and environmental of deposition of tidal and bottom sediment from Ghardaqa region, Red Sea area, Bulletin of Institute of Oceanography and Fisheries, Egypt. 1987;13(2):147-67.Suche in Google Scholar
[40] Spencer KL, Cundy AB, Croudace IW. Heavy metal distribution and early diagenesis in salt marsh sediments from the Medway Estuary, Kent, UK. Estuar Coast Shelf Sci. 2003;57(1-2):43–54.10.1016/S0272-7714(02)00324-4Suche in Google Scholar
[41] Sanders CJ, Santos IR, Barcellos R, Silva Filho EV. Elevated concentrations of dissolved Ba, Fe and Mn in a mangrove subterranean estuary: consequence of sea level rise? Cont Shelf Res. 2012;43:86–94.10.1016/j.csr.2012.04.015Suche in Google Scholar
[42] Fernandes E, Vitorino N, Ribeiro MJ, Teixeira C, Bordalo AA. Spatial and seasonal dynamics of elemental composition and mineralogy of intertidal and subtidal sediments in the Lima estuary (NW Portugal). Arab J Geosci. 2019;12(13):412.10.1007/s12517-019-4569-8Suche in Google Scholar
[43] Kristensen E, Bouillon S, Dittmar T, Marchand C. Organic carbon dynamics in mangrove ecosystems: A review. Aquat Bot. 2008;89(2):201–19.10.1016/j.aquabot.2007.12.005Suche in Google Scholar
[44] Valdés J, Vargas G, Sifeddine A, Ortlieb L, Guiñez M. Distribution and enrichment evaluation of heavy metals in Mejillones Bay (23 ° S), Northern Chile: geochemical and statistical approach. Mar Pollut Bull. 2005 Dec;50(12):1558–68.10.1016/j.marpolbul.2005.06.024Suche in Google Scholar PubMed
[45] Rogers KG, Goodbred SL Jr, Mondal DR. Monsoon sedimentation on the ‘abandoned’ tide-influenced Ganges-Brahmaputra delta plain. Estuar Coast Shelf Sci. 2013;131:297–309.10.1016/j.ecss.2013.07.014Suche in Google Scholar
[46] Kumar A, Ramanathan A, Prasad MB, Datta D, Kumar M, Sappal SM. Distribution, enrichment, and potential toxicity of trace metals in the surface sediments of Sundarban mangrove ecosystem, Bangladesh: a baseline study before Sundarban oil spill of December, 2014. Environ Sci Pollut Res Int. 2016 May;23(9):8985–99.10.1007/s11356-016-6086-6Suche in Google Scholar PubMed
[47] Mosa A, El-Ghamry A, Trüby P, Omar M, Gao B, Elnaggar A, et al. Chemo-mechanical modification of cottonwood for Pb(2+) removal from aqueous solutions: sorption mechanisms and potential application as biofilter in drip-irrigation. Chemosphere. 2016 Oct;161:1–9.10.1016/j.chemosphere.2016.06.101Suche in Google Scholar PubMed
[48] Taylor SR, McLennan SM. The Geochemical Evolution of the Continental Crust. Rev Geophys. 1995;33(2):241–65.10.1029/95RG00262Suche in Google Scholar
[49] Shriadah MM. Heavy metals in mangrove sediments of the United Arab Emirates shoreline (Arabian Gulf). Water Air Soil Pollut. 1999;116(3/4):523–34.10.1023/A:1005139020681Suche in Google Scholar
[50] ZareZadeh R, Rezaee P, Lak R, Masoodi M, Ghorbani M; ZareZadeh R. Rezaee P., Lak R., Masoodi M., Ghorbani M., Distribution and accumulation of heavy metals in sediments of the northern part of mangrove in Hara Biosphere Reserve, Qeshm Island (Persian Gulf). Soil Water Res. 2017;12(2):86–95.10.17221/16/2016-SWRSuche in Google Scholar
[51] Usman AR, Alkredaa RS, Al-Wabel MI. Heavy metal contamination in sediments and mangroves from the coast of Red Sea: avicennia marina as potential metal bioaccumulator. Ecotoxicol Environ Saf. 2013 Nov;97:263–70.10.1016/j.ecoenv.2013.08.009Suche in Google Scholar
[52] Zulkifli SZ, Mohamat-Yusuff F, Arai T, Ismail A, Miyazaki N. An assessment of selected trace elements in intertidal surface sediments collected from the Peninsular Malaysia. Environ Monit Assess. 2010 Oct;169(1-4):457–72.10.1007/s10661-009-1189-xSuche in Google Scholar
[53] Ernst WH, Verkleij JA, Schat H. Metal tolerance in plants. Acta Bot Neerl. 1992;41(3):229–48.10.1111/j.1438-8677.1992.tb01332.xSuche in Google Scholar
[54] Kabata-Pendias A, Pendias H. Trace Elements in Soils and Plants. 2nd ed. Boca Raton, Florida, USA: CRC Press Incorporation; 2001.10.1201/9781420039900Suche in Google Scholar
[55] Sadiq M, Zaidi TH. Sediment composition and metal concentrations in mangrove leaves from the Saudi coast of the Arabian Gulf, Science of the Total Environment. 1994;155(1):1-8. https://doi.org/10.1016/0048-9697(94)90356-510.1016/0048-9697(94)90356-5Suche in Google Scholar
[56] Lacerda LD, Martinelli LA, Rezende CE, Mozeto AA, Ovalle AR, Victoria RL, et al. The fate of trace metals in suspended matter in a mangrove creek during a tidal cycle. Sci Total Environ. 1988;75(2-3):169–80.10.1016/0048-9697(88)90030-7Suche in Google Scholar
[57] Silva DM, Riet-Correa F, Medeiros RM, Oliveira OF. Toxic plants for livestock in the western and eastern Seridó, state of Rio Grande do Norte, in the Brazilian semiarid. Pesqui Vet Bras. 2006;26(4):223–36.10.1590/S0100-736X2006000400007Suche in Google Scholar
[58] Wen-Jiao Z, Xia-Yong C, Peng L. Accumulation and biological cycling of heavy metal elements in Rhizophora stylosa mangroves in Yingluo Bay, China. Mar Ecol Prog Ser. 1997;159:293–301.10.3354/meps159293Suche in Google Scholar
[59] Al Hosani M, Al Anouti F. A Preliminary exploration of heavy metal contamination within Aviccenia marina in the United Arab Emirates. J Environ Anal Toxicol. 2014;4(5):1.10.4172/2161-0525.1000232Suche in Google Scholar
[60] Dar MA, Khalafallah AA, Tawfik KM, Samman MR. The interactions of bioactive heavy metals between Avicennia marina (Forsk.) Vierh. and the underlying sediments in the mangrove swamps, Red Sea, Egypt. Chemistry Research Journal. 2017;2(6):25–43.Suche in Google Scholar
[61] Nath B, Birch G, Chaudhuri P. Assessment of sediment quality in Avicennia marina-dominated embayments of Sydney Estuary: the potential use of pneumatophores (aerial roots) as a bio-indicator of trace metal contamination, Science of the Total Environment. 2014;472:1010-22. 10.1016/j.scitotenv.2013.11.09610.1016/j.scitotenv.2013.11.096Suche in Google Scholar PubMed
[62] Li R, Chai M, Qiu GY. Distribution, fraction, and ecological assessment of heavy metals in sediment-plant system in Mangrove Forest, South China Sea. PLoS One. 2016 Jan;11(1):e0147308.10.1371/journal.pone.0147308Suche in Google Scholar
[63] Luo X, Yu L, Wang C, Yin X, Mosa A, Lv J, et al. Sorption of vanadium (V) onto natural soil colloids under various solution pH and ionic strength conditions. Chemosphere. 2017 Feb;169:609–17.10.1016/j.chemosphere.2016.11.105Suche in Google Scholar
[64] Chai MW, Shi FC, Li RL, Shen XX. Heavy metal contamination and ecological risk in Spartina alterniflora marsh in intertidal sediments of Bohai Bay, China, Marine Pollution Bulletin. 2014;84:115-24. https://doi.org/10.1016/j.marpolbul.2014.05.028 PMID: 24930737.10.1016/j.marpolbul.2014.05.028Suche in Google Scholar
[65] Van de Broek M, Temmerman S, Merckx R, Govers G. The importance of an estuarine salinity gradient on soil organic carbon stocks of tidal marshes. Biogeosciences. 2016;13:6611-24. https://doi.org/10.5194/bg-13-6611-201610.5194/bg-2016-285Suche in Google Scholar
[66] Marchand C, Allenbach M, Lallier-Verges E. Relationships between heavy metals distribution and organic matter cycling in mangrove sediments (Conception Bay, New Caledonia). Geoderma. 2011;160(3-4):444–56.10.1016/j.geoderma.2010.10.015Suche in Google Scholar
[67] Suresh G, Ramasamy V, Meenakshisundaram V, Venkatachalapathy R, Ponnusamy V. Influence of mineralogical and heavy metal composition on natural radionuclide concentrations in the river sediments. Appl Radiat Isot. 2011 Oct;69(10):1466–74.10.1016/j.apradiso.2011.05.020Suche in Google Scholar
[68] Manta DS, Angelone M, Bellanca A, Neri R, Sprovieri M. Heavy metals in urban soils: a case study from the city of Palermo (Sicily), Italy. Sci Total Environ. 2002 Dec;300(1-3):229–43.10.1016/S0048-9697(02)00273-5Suche in Google Scholar
[69] Moller A, Muller HW, Abdullah A, Abdelgawad G, Utermann J. Urban soil pollution in Damascus, Syria: concentrations and patterns of heavy metals in the soils of the Damascus Ghouta. Geoderma. 2005;124(1-2):63–71.10.1016/j.geoderma.2004.04.003Suche in Google Scholar
[70] Alzahrani DA, Selim EM, El-Sherbiny MM. Ecological assessment of heavy metals in the grey mangrove (Avicennia marina) and associated sediments along the Red Sea coast of Saudi Arabia. Oceanologia. 2018;60(4):513–26.10.1016/j.oceano.2018.04.002Suche in Google Scholar
[71] Arumugam G, Rajendran R, Ganesan A, Sethu R. Bioaccumulation and translocation of heavy metals in mangrove rhizosphere sediments to tissues of Avicenia marina. A field study from tropical mangrove forest. Environ Nanotechnol Monit Manag. 2018;10:272–9.10.1016/j.enmm.2018.07.005Suche in Google Scholar
[72] Guzmán HM, Jiménez CE. Contamination of coral reefs by heavy metals along the Caribbean coast of Central America (Costa Rica and Panama). Mar Pollut Bull. 1992;24(11):554–61.10.1016/0025-326X(92)90708-ESuche in Google Scholar
[73] Defew LH, Mair JM, Guzman HM. An assessment of metal contamination in mangrove sediments and leaves from Punta Mala Bay, Pacific Panama, Marine Pollution Bulletin. 2005;1;50(5):547-52. https://doi.org/https://doi.org/10.1016/j.marpolbul.2004.11.04710.1016/j.marpolbul.2004.11.047Suche in Google Scholar
[74] Sany SB, Salleh A, Sulaiman AH, Sasekumar A, Rezayi M, Tehrani GM. Heavy metal contamination in water and sediment of the Port Klang coastal area, Selangor, Malaysia. Environmental Earth Eciences. 2013;69(6):2013–25.10.1007/s12665-012-2038-8Suche in Google Scholar
[75] Kehrig HA, Pinto FN, Moreira I, Malm O. Heavy metals and methylmercury in a tropical coastal estuary and a mangrove in Brazil. Org Geochem. 2003;34(5):661–9.10.1016/S0146-6380(03)00021-4Suche in Google Scholar
[76] Qiu YW, Yu KF, Zhang G, Wang WX. Accumulation and partitioning of seven trace metals in mangroves and sediment cores from three estuarine wetlands of Hainan Island, China. J Hazard Mater. 2011 Jun;190(1-3):631–8.10.1016/j.jhazmat.2011.03.091Suche in Google Scholar
[77] Che R.O., Concentration of 7 heavy metals in sediments and mangrove root samples from Mai Po, Hong Kong, Marine Pollution Bulletin, 1999, 39(1-12), 269-279. https://doi.org/https://doi.org/10.1016/S0025-326X(99)00056-910.1016/S0025-326X(99)00056-9Suche in Google Scholar
© 2020 Hameed Alsamadany et al., published by De Gruyter
This work is licensed under the Creative Commons Attribution 4.0 International License.
Artikel in diesem Heft
- Regular Articles
- Electrochemical antioxidant screening and evaluation based on guanine and chitosan immobilized MoS2 nanosheet modified glassy carbon electrode (guanine/CS/MoS2/GCE)
- Kinetic models of the extraction of vanillic acid from pumpkin seeds
- On the maximum ABC index of bipartite graphs without pendent vertices
- Estimation of the total antioxidant potential in the meat samples using thin-layer chromatography
- Molecular dynamics simulation of sI methane hydrate under compression and tension
- Spatial distribution and potential ecological risk assessment of some trace elements in sediments and grey mangrove (Avicennia marina) along the Arabian Gulf coast, Saudi Arabia
- Amino-functionalized graphene oxide for Cr(VI), Cu(II), Pb(II) and Cd(II) removal from industrial wastewater
- Chemical composition and in vitro activity of Origanum vulgare L., Satureja hortensis L., Thymus serpyllum L. and Thymus vulgaris L. essential oils towards oral isolates of Candida albicans and Candida glabrata
- Effect of excess Fluoride consumption on Urine-Serum Fluorides, Dental state and Thyroid Hormones among children in “Talab Sarai” Punjab Pakistan
- Design, Synthesis and Characterization of Novel Isoxazole Tagged Indole Hybrid Compounds
- Comparison of kinetic and enzymatic properties of intracellular phosphoserine aminotransferases from alkaliphilic and neutralophilic bacteria
- Green Organic Solvent-Free Oxidation of Alkylarenes with tert-Butyl Hydroperoxide Catalyzed by Water-Soluble Copper Complex
- Ducrosia ismaelis Asch. essential oil: chemical composition profile and anticancer, antimicrobial and antioxidant potential assessment
- DFT calculations as an efficient tool for prediction of Raman and infra-red spectra and activities of newly synthesized cathinones
- Influence of Chemical Osmosis on Solute Transport and Fluid Velocity in Clay Soils
- A New fatty acid and some triterpenoids from propolis of Nkambe (North-West Region, Cameroon) and evaluation of the antiradical scavenging activity of their extracts
- Antiplasmodial Activity of Stigmastane Steroids from Dryobalanops oblongifolia Stem Bark
- Rapid identification of direct-acting pancreatic protectants from Cyclocarya paliurus leaves tea by the method of serum pharmacochemistry combined with target cell extraction
- Immobilization of Pseudomonas aeruginosa static biomass on eggshell powder for on-line preconcentration and determination of Cr (VI)
- Assessment of methyl 2-({[(4,6-dimethoxypyrimidin-2-yl)carbamoyl] sulfamoyl}methyl)benzoate through biotic and abiotic degradation modes
- Stability of natural polyphenol fisetin in eye drops Stability of fisetin in eye drops
- Production of a bioflocculant by using activated sludge and its application in Pb(II) removal from aqueous solution
- Molecular Properties of Carbon Crystal Cubic Structures
- Synthesis and characterization of calcium carbonate whisker from yellow phosphorus slag
- Study on the interaction between catechin and cholesterol by the density functional theory
- Analysis of some pharmaceuticals in the presence of their synthetic impurities by applying hybrid micelle liquid chromatography
- Two mixed-ligand coordination polymers based on 2,5-thiophenedicarboxylic acid and flexible N-donor ligands: the protective effect on periodontitis via reducing the release of IL-1β and TNF-α
- Incorporation of silver stearate nanoparticles in methacrylate polymeric monoliths for hemeprotein isolation
- Development of ultrasound-assisted dispersive solid-phase microextraction based on mesoporous carbon coated with silica@iron oxide nanocomposite for preconcentration of Te and Tl in natural water systems
- N,N′-Bis[2-hydroxynaphthylidene]/[2-methoxybenzylidene]amino]oxamides and their divalent manganese complexes: Isolation, spectral characterization, morphology, antibacterial and cytotoxicity against leukemia cells
- Determination of the content of selected trace elements in Polish commercial fruit juices and health risk assessment
- Diorganotin(iv) benzyldithiocarbamate complexes: synthesis, characterization, and thermal and cytotoxicity study
- Keratin 17 is induced in prurigo nodularis lesions
- Anticancer, antioxidant, and acute toxicity studies of a Saudi polyherbal formulation, PHF5
- LaCoO3 perovskite-type catalysts in syngas conversion
- Comparative studies of two vegetal extracts from Stokesia laevis and Geranium pratense: polyphenol profile, cytotoxic effect and antiproliferative activity
- Fragmentation pattern of certain isatin–indole antiproliferative conjugates with application to identify their in vitro metabolic profiles in rat liver microsomes by liquid chromatography tandem mass spectrometry
- Investigation of polyphenol profile, antioxidant activity and hepatoprotective potential of Aconogonon alpinum (All.) Schur roots
- Lead discovery of a guanidinyl tryptophan derivative on amyloid cascade inhibition
- Physicochemical evaluation of the fruit pulp of Opuntia spp growing in the Mediterranean area under hard climate conditions
- Electronic structural properties of amino/hydroxyl functionalized imidazolium-based bromide ionic liquids
- New Schiff bases of 2-(quinolin-8-yloxy)acetohydrazide and their Cu(ii), and Zn(ii) metal complexes: their in vitro antimicrobial potentials and in silico physicochemical and pharmacokinetics properties
- Treatment of adhesions after Achilles tendon injury using focused ultrasound with targeted bFGF plasmid-loaded cationic microbubbles
- Synthesis of orotic acid derivatives and their effects on stem cell proliferation
- Chirality of β2-agonists. An overview of pharmacological activity, stereoselective analysis, and synthesis
- Fe3O4@urea/HITh-SO3H as an efficient and reusable catalyst for the solvent-free synthesis of 7-aryl-8H-benzo[h]indeno[1,2-b]quinoline-8-one and indeno[2′,1′:5,6]pyrido[2,3-d]pyrimidine derivatives
- Adsorption kinetic characteristics of molybdenum in yellow-brown soil in response to pH and phosphate
- Enhancement of thermal properties of bio-based microcapsules intended for textile applications
- Exploring the effect of khat (Catha edulis) chewing on the pharmacokinetics of the antiplatelet drug clopidogrel in rats using the newly developed LC-MS/MS technique
- A green strategy for obtaining anthraquinones from Rheum tanguticum by subcritical water
- Cadmium (Cd) chloride affects the nutrient uptake and Cd-resistant bacterium reduces the adsorption of Cd in muskmelon plants
- Removal of H2S by vermicompost biofilter and analysis on bacterial community
- Structural cytotoxicity relationship of 2-phenoxy(thiomethyl)pyridotriazolopyrimidines: Quantum chemical calculations and statistical analysis
- A self-breaking supramolecular plugging system as lost circulation material in oilfield
- Synthesis, characterization, and pharmacological evaluation of thiourea derivatives
- Application of drug–metal ion interaction principle in conductometric determination of imatinib, sorafenib, gefitinib and bosutinib
- Synthesis and characterization of a novel chitosan-grafted-polyorthoethylaniline biocomposite and utilization for dye removal from water
- Optimisation of urine sample preparation for shotgun proteomics
- DFT investigations on arylsulphonyl pyrazole derivatives as potential ligands of selected kinases
- Treatment of Parkinson’s disease using focused ultrasound with GDNF retrovirus-loaded microbubbles to open the blood–brain barrier
- New derivatives of a natural nordentatin
- Fluorescence biomarkers of malignant melanoma detectable in urine
- Study of the remediation effects of passivation materials on Pb-contaminated soil
- Saliva proteomic analysis reveals possible biomarkers of renal cell carcinoma
- Withania frutescens: Chemical characterization, analgesic, anti-inflammatory, and healing activities
- Design, synthesis and pharmacological profile of (−)-verbenone hydrazones
- Synthesis of magnesium carbonate hydrate from natural talc
- Stability-indicating HPLC-DAD assay for simultaneous quantification of hydrocortisone 21 acetate, dexamethasone, and fluocinolone acetonide in cosmetics
- A novel lactose biosensor based on electrochemically synthesized 3,4-ethylenedioxythiophene/thiophene (EDOT/Th) copolymer
- Citrullus colocynthis (L.) Schrad: Chemical characterization, scavenging and cytotoxic activities
- Development and validation of a high performance liquid chromatography/diode array detection method for estrogen determination: Application to residual analysis in meat products
- PCSK9 concentrations in different stages of subclinical atherosclerosis and their relationship with inflammation
- Development of trace analysis for alkyl methanesulfonates in the delgocitinib drug substance using GC-FID and liquid–liquid extraction with ionic liquid
- Electrochemical evaluation of the antioxidant capacity of natural compounds on glassy carbon electrode modified with guanine-, polythionine-, and nitrogen-doped graphene
- A Dy(iii)–organic framework as a fluorescent probe for highly selective detection of picric acid and treatment activity on human lung cancer cells
- A Zn(ii)–organic cage with semirigid ligand for solvent-free cyanosilylation and inhibitory effect on ovarian cancer cell migration and invasion ability via regulating mi-RNA16 expression
- Polyphenol content and antioxidant activities of Prunus padus L. and Prunus serotina L. leaves: Electrochemical and spectrophotometric approach and their antimicrobial properties
- The combined use of GC, PDSC and FT-IR techniques to characterize fat extracted from commercial complete dry pet food for adult cats
- MALDI-TOF MS profiling in the discovery and identification of salivary proteomic patterns of temporomandibular joint disorders
- Concentrations of dioxins, furans and dioxin-like PCBs in natural animal feed additives
- Structure and some physicochemical and functional properties of water treated under ammonia with low-temperature low-pressure glow plasma of low frequency
- Mesoscale nanoparticles encapsulated with emodin for targeting antifibrosis in animal models
- Amine-functionalized magnetic activated carbon as an adsorbent for preconcentration and determination of acidic drugs in environmental water samples using HPLC-DAD
- Antioxidant activity as a response to cadmium pollution in three durum wheat genotypes differing in salt-tolerance
- A promising naphthoquinone [8-hydroxy-2-(2-thienylcarbonyl)naphtho[2,3-b]thiophene-4,9-dione] exerts anti-colorectal cancer activity through ferroptosis and inhibition of MAPK signaling pathway based on RNA sequencing
- Synthesis and efficacy of herbicidal ionic liquids with chlorsulfuron as the anion
- Effect of isovalent substitution on the crystal structure and properties of two-slab indates BaLa2−xSmxIn2O7
- Synthesis, spectral and thermo-kinetics explorations of Schiff-base derived metal complexes
- An improved reduction method for phase stability testing in the single-phase region
- Comparative analysis of chemical composition of some commercially important fishes with an emphasis on various Malaysian diets
- Development of a solventless stir bar sorptive extraction/thermal desorption large volume injection capillary gas chromatographic-mass spectrometric method for ultra-trace determination of pyrethroids pesticides in river and tap water samples
- A turbidity sensor development based on NL-PI observers: Experimental application to the control of a Sinaloa’s River Spirulina maxima cultivation
- Deep desulfurization of sintering flue gas in iron and steel works based on low-temperature oxidation
- Investigations of metallic elements and phenolics in Chinese medicinal plants
- Influence of site-classification approach on geochemical background values
- Effects of ageing on the surface characteristics and Cu(ii) adsorption behaviour of rice husk biochar in soil
- Adsorption and sugarcane-bagasse-derived activated carbon-based mitigation of 1-[2-(2-chloroethoxy)phenyl]sulfonyl-3-(4-methoxy-6-methyl-1,3,5-triazin-2-yl) urea-contaminated soils
- Antimicrobial and antifungal activities of bifunctional cooper(ii) complexes with non-steroidal anti-inflammatory drugs, flufenamic, mefenamic and tolfenamic acids and 1,10-phenanthroline
- Application of selenium and silicon to alleviate short-term drought stress in French marigold (Tagetes patula L.) as a model plant species
- Screening and analysis of xanthine oxidase inhibitors in jute leaves and their protective effects against hydrogen peroxide-induced oxidative stress in cells
- Synthesis and physicochemical studies of a series of mixed-ligand transition metal complexes and their molecular docking investigations against Coronavirus main protease
- A study of in vitro metabolism and cytotoxicity of mephedrone and methoxetamine in human and pig liver models using GC/MS and LC/MS analyses
- A new phenyl alkyl ester and a new combretin triterpene derivative from Combretum fragrans F. Hoffm (Combretaceae) and antiproliferative activity
- Erratum
- Erratum to: A one-step incubation ELISA kit for rapid determination of dibutyl phthalate in water, beverage and liquor
- Review Articles
- Sinoporphyrin sodium, a novel sensitizer for photodynamic and sonodynamic therapy
- Natural products isolated from Casimiroa
- Plant description, phytochemical constituents and bioactivities of Syzygium genus: A review
- Evaluation of elastomeric heat shielding materials as insulators for solid propellant rocket motors: A short review
- Special Issue on Applied Biochemistry and Biotechnology 2019
- An overview of Monascus fermentation processes for monacolin K production
- Study on online soft sensor method of total sugar content in chlorotetracycline fermentation tank
- Studies on the Anti-Gouty Arthritis and Anti-hyperuricemia Properties of Astilbin in Animal Models
- Effects of organic fertilizer on water use, photosynthetic characteristics, and fruit quality of pear jujube in northern Shaanxi
- Characteristics of the root exudate release system of typical plants in plateau lakeside wetland under phosphorus stress conditions
- Characterization of soil water by the means of hydrogen and oxygen isotope ratio at dry-wet season under different soil layers in the dry-hot valley of Jinsha River
- Composition and diurnal variation of floral scent emission in Rosa rugosa Thunb. and Tulipa gesneriana L.
- Preparation of a novel ginkgolide B niosomal composite drug
- The degradation, biodegradability and toxicity evaluation of sulfamethazine antibiotics by gamma radiation
- Special issue on Monitoring, Risk Assessment and Sustainable Management for the Exposure to Environmental Toxins
- Insight into the cadmium and zinc binding potential of humic acids derived from composts by EEM spectra combined with PARAFAC analysis
- Source apportionment of soil contamination based on multivariate receptor and robust geostatistics in a typical rural–urban area, Wuhan city, middle China
- Special Issue on 13th JCC 2018
- The Role of H2C2O4 and Na2CO3 as Precipitating Agents on The Physichochemical Properties and Photocatalytic Activity of Bismuth Oxide
- Preparation of magnetite-silica–cetyltrimethylammonium for phenol removal based on adsolubilization
- Topical Issue on Agriculture
- Size-dependent growth kinetics of struvite crystals in wastewater with calcium ions
- The effect of silica-calcite sedimentary rock contained in the chicken broiler diet on the overall quality of chicken muscles
- Physicochemical properties of selected herbicidal products containing nicosulfuron as an active ingredient
- Lycopene in tomatoes and tomato products
- Fluorescence in the assessment of the share of a key component in the mixing of feed
- Sulfur application alleviates chromium stress in maize and wheat
- Effectiveness of removal of sulphur compounds from the air after 3 years of biofiltration with a mixture of compost soil, peat, coconut fibre and oak bark
- Special Issue on the 4th Green Chemistry 2018
- Study and fire test of banana fibre reinforced composites with flame retardance properties
- Special Issue on the International conference CosCI 2018
- Disintegration, In vitro Dissolution, and Drug Release Kinetics Profiles of k-Carrageenan-based Nutraceutical Hard-shell Capsules Containing Salicylamide
- Synthesis of amorphous aluminosilicate from impure Indonesian kaolin
- Special Issue on the International Conf on Science, Applied Science, Teaching and Education 2019
- Functionalization of Congo red dye as a light harvester on solar cell
- The effect of nitrite food preservatives added to se’i meat on the expression of wild-type p53 protein
- Biocompatibility and osteoconductivity of scaffold porous composite collagen–hydroxyapatite based coral for bone regeneration
- Special Issue on the Joint Science Congress of Materials and Polymers (ISCMP 2019)
- Effect of natural boron mineral use on the essential oil ratio and components of Musk Sage (Salvia sclarea L.)
- A theoretical and experimental study of the adsorptive removal of hexavalent chromium ions using graphene oxide as an adsorbent
- A study on the bacterial adhesion of Streptococcus mutans in various dental ceramics: In vitro study
- Corrosion study of copper in aqueous sulfuric acid solution in the presence of (2E,5E)-2,5-dibenzylidenecyclopentanone and (2E,5E)-bis[(4-dimethylamino)benzylidene]cyclopentanone: Experimental and theoretical study
- Special Issue on Chemistry Today for Tomorrow 2019
- Diabetes mellitus type 2: Exploratory data analysis based on clinical reading
- Multivariate analysis for the classification of copper–lead and copper–zinc glasses
- Special Issue on Advances in Chemistry and Polymers
- The spatial and temporal distribution of cationic and anionic radicals in early embryo implantation
- Special Issue on 3rd IC3PE 2020
- Magnetic iron oxide/clay nanocomposites for adsorption and catalytic oxidation in water treatment applications
- Special Issue on IC3PE 2018/2019 Conference
- Exergy analysis of conventional and hydrothermal liquefaction–esterification processes of microalgae for biodiesel production
- Advancing biodiesel production from microalgae Spirulina sp. by a simultaneous extraction–transesterification process using palm oil as a co-solvent of methanol
- Topical Issue on Applications of Mathematics in Chemistry
- Omega and the related counting polynomials of some chemical structures
- M-polynomial and topological indices of zigzag edge coronoid fused by starphene