An experimental investigation and machine learning-based prediction for seismic performance of steel tubular column filled with recycled aggregate concrete
-
Yunchao Tang
 ,
Junbo Sun
und
Xiangyu Wang
,
Junbo Sun
und
Xiangyu Wang

Abstract
This work presents the design and application of a low-cycle reciprocating loading test on 23 recycled aggregate concrete-filled steel tube columns and 3 ordinary concrete-filled steel tube columns. Additionally, a systematic study on the influence of various parameters (e.g., slenderness ratio, axial compression ratio, etc.) was conducted on the seismic performance of the specimens. The results show that all the specimens have good hysteresis performance and a similar development trend of skeleton curve. The influence of slenderness ratio on the seismic index of the specimens is more significant than that of the axial compression ratio and the steel pipe wall thickness. Furthermore, artificial intelligence was applied to estimate the influence of parameter variation on the seismic performance of concrete columns. Specifically, Random Forest with hyperparameters tuned by Firefly Algorithm was chosen. The high correlation coefficients (R) and low root mean square error values from the prediction results showed acceptable accuracy. In addition, sensitivity analysis was applied to rank the influence of the aforementioned input variables on the seismic performance of the specimens. The research results can provide experimental reference for the application of steel tube recycled concrete in earthquake areas.
1 Introduction
According to preliminary forecasts, the amount of construction waste to be treated in China will reach 3.2 billion tons by 2022 and is expected to exceed 4 billion tons by 2026 [1]. Such a huge amount of construction waste not only requires huge treatment costs, but also causes a series of environmental problems such as soil pollution, air pollution, water pollution, and so on [2,3,4]. Faced with this situation, recycled aggregate concrete came into being [5,6,7]. To expand the application scope of recycled concrete, scholars are considering combining concrete-filled steel tubes with recycled concrete to form a new type of recycled concrete-filled steel tube composite structure [8,9,10]. This new structure makes use of the hooping effect of the steel pipe on the recycled concrete core, effectively improving the defects of recycled concrete, and pioneering the broader use of recycled concrete [11,12,13,14].
Although there have been some research results on the mechanical and seismic performance of recycled aggregate concrete-filled steel tube column (RACSTC) [15,16,17], the method is not perfect; more experiments, simulations, and theoretical research are still needed [18,19,20]. Xu et al. [21] established a fiber-based RACSTC finite element model based on the measured hysteresis curve and conducted a complete parameter analysis. The author used the verified numerical model to study the influence of the key parameters controlling the mechanical properties of the recycled concrete aggregate and steel pipe on the hysteresis characteristics of circular RACSTC. Tang et al. [22] tested nine recycled concrete-filled steel tubular columns (RCSTC) and one ordinary concrete-filled steel tubular long column, carrying out low-cycle repeated loading tests, to explore the effects of axial compression ratio and steel tube wall thickness on seismic indexes including hysteresis performance, ductility, energy dissipation capacity, and stiffness degradation of members.
In recent years, the properties of concrete materials have been studied extensively using artificial intelligence techniques [23,24,25]. Machine learning (ML) models show excellent generalization ability and ideal prediction accuracy when dealing with non-linear tasks [25,26,27]. However, few researchers attempted to use ML methods for RACSTC analysis, likely owing to the limitation of the data. To fill in the gap, this study enlarged the dataset by integrating the results from the current laboratory tests and the previous work, proposing the ML methods with the hyperparameters tuned by the metaheuristic algorithm.
The artificial neural network (ANN), support vector regression (SVR), and random forest (RF) are three widely used ML models which are suitable for use with various construction materials [17,28]. ANN and SVR are independent ML models, that have been used to forecast concrete strength and conductivity [29]. The latter (RF) is an integrated model that shows a low probability of over-fitting problems. RF also has better tolerance than independent ML models when there are outliers or noise in the dataset. In addition, due to the existence of dimension and central limit theorem, the success of the whole model is better than that of the single model to some extent. Therefore, the RF model is expected to perform better than individual models when solving high dimensionality problems.
The accuracy of the RF model mainly depends on two hyperparameters: the total number of trees (numTree) and the minimum sample number of a leaf node (minNumLeaf). The numTree has a significant influence on the model’s ability and the minNumLeaf controls splitting conditions and determines the relationship among various decision trees. However, the traditional process of determining hyperparameters is a method that takes a long time but, if time is not a problem, it can be adopted. At present, metaheuristic algorithms are more popular because they can automatically find optimal hyperparameters through generation selection. Commonly used metaheuristic algorithms include particle swarm optimization, genetic algorithm, and the beetle antennae search, all of which require a large amount of computation [30,31]. The Firefly algorithm (FA) uses the luminescence characteristics of glowworms for random optimization to search the optimal hyperparameters so that it converges rapidly and significantly reduces calculation time.
In this work, the test is designed with steel pipe thickness, effective steel pipe length, concrete design strength, solid waste content, and axial pressure ratio as the changing parameters. A total of 23 specimens are loaded repeatedly under low-cycle, and the influence of the changing parameters on the seismic performance of the specimens is studied. The established ML models can be applied effectively in the simulation of RACSTC before doing laboratory tests to increase efficiency.
2 Materials and methods
2.1 Specimen preparation
The research object of this test is RCSTC. Taking the axial compression ratio, steel pipe wall thickness, and slenderness ratio as the variable parameters, a total of 23 RCSTC and 3 concrete-filled steel tubular comparison columns were designed and fabricated. Table 1 shows the detailed design parameters of the various test pieces. The naming convention for the test pieces is as follows: L stands for steel pipe with total length of 2,700 mm and effective length of 1,980 mm, M stands for steel pipe with length of 2,200 mm and effective length of 1,480 mm, and S stands for steel pipe with length of 1,700 mm and effective length of 980 mm; E stands for steel pipe wall thickness of 8 mm, T stands for steel pipe wall thickness of 10 mm, and W stands for steel pipe wall thickness of 12 mm; C stands for concrete-filled steel tubular comparison column. The structural drawing of the test piece is shown in Figure 1.
Design parameters of test pieces
| Specimen number | d (diameter) × t (wall thickness) × L (effective height) (mm) | Steel pipe strength (MPa) | Recycled concrete strength (MPa) | Replacement rate of recycled aggregate (%) | Axial compression ratio | Slenderness ratio |
|---|---|---|---|---|---|---|
| SE1 | 203 × 8 × 980 | Q235 | C50 | 100 | 0.2 | 38.62 |
| SE2 | 203 × 8 × 980 | Q235 | C50 | 100 | 0.4 | 38.62 |
| SE3 | 203 × 8 × 980 | Q235 | C50 | 100 | 0.6 | 38.62 |
| ST1 | 203 × 10 × 980 | Q235 | C50 | 100 | 0.2 | 38.62 |
| ST2 | 203 × 10 × 980 | Q235 | C50 | 100 | 0.4 | 38.62 |
| ST3 | 203 × 10 × 980 | Q235 | C50 | 100 | 0.6 | 38.62 |
| SW1 | 203 × 12 × 980 | Q235 | C50 | 100 | 0.2 | 38.62 |
| SW2 | 203 × 12 × 980 | Q235 | C50 | 100 | 0.4 | 38.62 |
| SW3 | 203 × 12 × 980 | Q235 | C50 | 100 | 0.6 | 38.62 |
| SE1-C | 203 × 8 × 980 | Q235 | C50 | 0 | 0.2 | 38.62 |
| LE1 | 203 × 8 × 1,980 | Q235 | C50 | 100 | 0.2 | 78.03 |
| LE2 | 203 × 8 × 1,980 | Q235 | C50 | 100 | 0.4 | 78.03 |
| LE3 | 203 × 8 × 1,980 | Q235 | C50 | 100 | 0.6 | 78.03 |
| LT1 | 203 × 10 × 1,980 | Q235 | C50 | 100 | 0.2 | 78.03 |
| LT2 | 203 × 10 × 1,980 | Q235 | C50 | 100 | 0.4 | 78.03 |
| LT3 | 203 × 10 × 1,980 | Q235 | C50 | 100 | 0.6 | 78.03 |
| LW1 | 203 × 12 × 1,980 | Q235 | C50 | 100 | 0.2 | 78.03 |
| LW2 | 203 × 12 × 1,980 | Q235 | C50 | 100 | 0.4 | 78.03 |
| LW3 | 203 × 12 × 1,980 | Q235 | C50 | 100 | 0.6 | 78.03 |
| LW3-C | 203 × 12 × 1,980 | Q235 | C50 | 0 | 0.6 | 78.03 |
| ME3 | 203 × 8 × 1,480 | Q235 | C50 | 100 | 0.6 | 58.33 |
| MT1 | 203 × 10 × 1,480 | Q235 | C50 | 100 | 0.2 | 58.33 |
| MT2 | 203 × 10 × 1,480 | Q235 | C50 | 100 | 0.4 | 58.33 |
| MT3 | 203 × 10 × 1,480 | Q235 | C50 | 100 | 0.6 | 58.33 |
| MW3 | 203 × 12 × 1,480 | Q235 | C50 | 100 | 0.6 | 58.33 |
| MT2-C | 203 × 10 × 1,480 | Q235 | C50 | 0 | 0.4 | 58.33 |
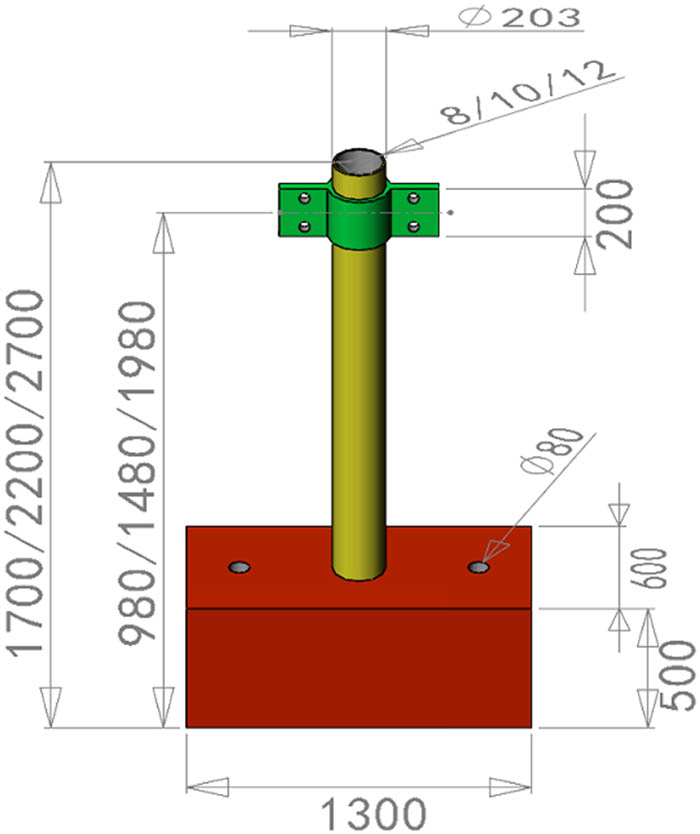
Schematic diagram.
This test abandons the traditional concrete base and adopts a 1,300 mm × 600 mm × 500 mm steel base to reduce the amount of concrete. A hollow pipe with a diameter of 205 mm is reserved in the center of the steel base to facilitate the installation and disassembly of the steel pipe column and to save a lot of test preparation time. This steel base is the invention being patented by our research group. After numerous tests, the deformation of the hollow pipe in the center of the base is very small and can be ignored. A photograph of the test site and setup is shown in Figure 2.
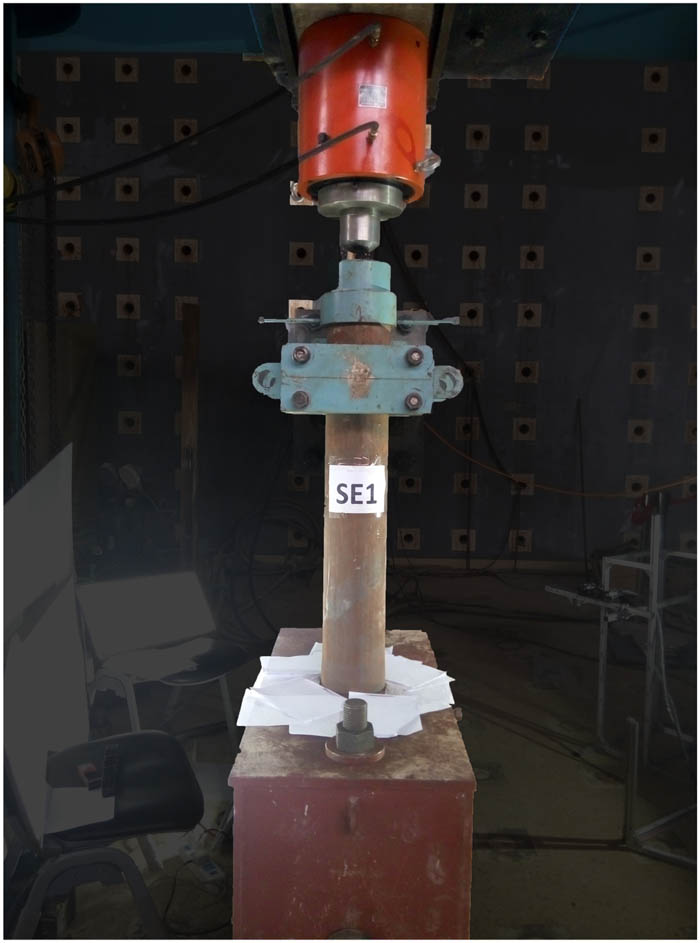
Loading diagram of test site of specimen assembly (unit: mm).
2.2 Raw materials and mix proportions
2.2.1 Concrete
2.2.1.1 Cement
This test is 42.5R ordinary Portland cement, and its physical and chemical properties are shown in Tables 2 and 3.
Physical properties of cement
| Term order | Fineness (%) | Specific surface area (m2·kg−1) | Setting time (min) | Compressive strength (MPa) | Flexural strength (MPa) | |||
|---|---|---|---|---|---|---|---|---|
| Initial setting | Final coagulation | 3 days | 28 days | 3 days | 28 days | |||
| Standard | — | ≥300 | ≥45 | ≤600 | ≥22.0 | ≥42.5 | ≥4.0 | ≥6.5 |
| Inspection result | 0.9 | 376 | 150 | 203 | 30.9 | 52.7 | 6.2 | 8.7 |
Chemical composition of cement
| Chemical composition | Magnesium oxide (%) | Sulfur trioxide (%) | Chloride ion (%) | Loss on ignition (%) |
|---|---|---|---|---|
| Standard requirements | ≤5.0 | ≤3.5 | ≤0.06 | ≤5.0 |
| Inspection results | 3.51 | 2.23 | 0.013 | 3.15 |
2.2.1.2 Aggregate
Sand: river sand, continuous polar matching, maximum particle size 5 mm. Natural coarse aggregate: continuously mixed, with particle size of 5–20 mm. Recycled coarse aggregate: 5–20 mm recycled aggregate produced by Shenzhen lvfa Pengcheng Environmental Protection Technology Co., Ltd shall be used for continuous grading. The basic properties of coarse aggregate are shown in Table 4.
The basic performance of coarse aggregate
| Aggregate type | Particle size (mm) | Bulk density (kg·m−3) | Apparent density (kg·m−3) | Water absorption (%) |
|---|---|---|---|---|
| Natural coarse aggregate | 5–20 | 1,456 | 2,861 | 0.83 |
| Recycled coarse aggregate | 5–20 | 1,294 | 2,624 | 4.57 |
2.2.1.3 Concrete mix design
The mix proportion of recycled concrete and ordinary concrete is calculated according to ⟪Specification for design of proportion of ordinary concrete⟫ (JGJ55-2011) [32] and ⟪Technical specification for application of recycled concrete⟫ (DG/tj08-2018-2007) [33]. The content of each raw material is shown in Table 5.
The design of the core concrete’s mix proportion
| Test piece | Strength grade | Dosage per cubic meter (kg) | Water cement ratio | ||||
|---|---|---|---|---|---|---|---|
| Water | Cement | Sand | Recycled aggregate | Natural aggregate | |||
| Recycled concrete-filled steel tube specimen series | C50 | 185.03 | 349.05 | 640.09 | 1226.17 | 0 | 0.53 |
| Ordinary concrete-filled steel tube specimen series | C50 | 209.92 | 395.80 | 663.63 | 0 | 1179.36 | 0.53 |
2.2.1.4 Concrete strength
Referring to the determination method of compressive strength in ⟪Standard for test methods of mechanical properties of ordinary concrete⟫ (GBT50081-2019) [34]: measuring the compressive strength of 6 150 mm × 150 mm × 150 mm cube specimens, the arithmetic mean value shall be taken as the strength value of this group of specimens. A total of 12 groups of cube specimens were made in this test. After standard curing, the test results meet the above provisions, and the results are valid. Table 6 shows the details of the compressive strength of each series.
Compressive strength of concrete (f cu)
| Test piece | SE series | ST series | SW series | SE1-C |
|---|---|---|---|---|
| Average value of measured cube strength (MPa) | 52.2 | 50.7 | 54.3 | 53.5 |
| Test piece | LE series | LT series | LW series | LW3-C |
| Average value of measured cube strength (MPa) | 50.7 | 51.4 | 53.8 | 51.6 |
| Test piece | ME3 | MT series | MW3 | MT2-C |
| Average value of measured cube strength (MPa) | 52.2 | 53.5 | 50.3 | 52.2 |
2.2.2 Steel pipe
The steel pipes purchased for this experiment are Q235 seamless steel pipes from Foshan Maohong Trading Co., Ltd. A series of tests was carried out on the steel pipes in this study, and the detection unit is microspectrum technology. Table 7 shows the results of steel inspection report.
Steel inspection report
| Sample name | Test items | Unit | Detection result | Reference standard |
|---|---|---|---|---|
| Q235 seamless steel tube | Tensile strength | MPa | 477 | GB/T228.1-2010 |
| Yield strength | MPa | 283 | ||
| Elongation | % | 27.5 | ||
| Bend test | — | No crack | GB/T 232-2010 |
Note 1: Laboratory environment: temperature (23 ± 2)°C; Humidity (50 ± 5)% RH.
Note 2: The bending test type is external surface bending, with the indenter diameter of 20 mm and the bending angle of 180°.
2.3 Basic parameters of test pieces
According to the calculation method in ref. [35], the design value N u of the axial compression bearing capacity of concrete-filled steel tubular column can be obtained. The calculation results are shown in Table 8; f a is the yield strength of steel pipe, f cu is the cube compressive strength of concrete, f c is the design value of concrete compressive strength, θ is the hoop index of the concrete-filled steel tube, N u is the design value of axial compression bearing capacity, n is the axial compression ratio, and N is the actual applied axial force during the test.
Calculation results of axial compression bearing capacity of the test pieces
| Test piece | f a (MPa) | f cu (MPa) | f c (MPa) | θ | N u (kN) | n | N (kN) |
|---|---|---|---|---|---|---|---|
| SE1 | 283 | 52.2 | 34.9 | 1.45 | 2290.2 | 0.2 | 458.0 |
| SE2 | 283 | 52.2 | 34.9 | 1.45 | 2290.2 | 0.4 | 916.1 |
| SE3 | 283 | 52.2 | 34.9 | 1.45 | 2290.2 | 0.6 | 1374.1 |
| ST1 | 283 | 50.7 | 33.9 | 1.92 | 2510.3 | 0.2 | 502.1 |
| ST2 | 283 | 50.7 | 33.9 | 1.92 | 2510.3 | 0.4 | 1004.1 |
| ST3 | 283 | 50.7 | 33.9 | 1.92 | 2510.3 | 0.6 | 1506.2 |
| SW1 | 283 | 54.3 | 36.3 | 2.23 | 2821.2 | 0.2 | 564.2 |
| SW2 | 283 | 54.3 | 36.3 | 2.23 | 2821.2 | 0.4 | 1128.5 |
| SW3 | 283 | 54.3 | 36.3 | 2.23 | 2821.2 | 0.6 | 1692.7 |
| SE1-C | 283 | 53.5 | 35.8 | 1.41 | 2312.8 | 0.2 | 462.6 |
| LE1 | 283 | 50.7 | 33.9 | 1.488 | 2006.4 | 0.2 | 401.3 |
| LE2 | 283 | 50.7 | 33.9 | 1.488 | 2006.4 | 0.4 | 802.6 |
| LE3 | 283 | 50.7 | 33.9 | 1.488 | 2006.4 | 0.6 | 1203.8 |
| LT1 | 283 | 54.3 | 36.3 | 1.796 | 2294.3 | 0.2 | 458.9 |
| LT2 | 283 | 54.3 | 36.3 | 1.796 | 2294.3 | 0.4 | 917.7 |
| LT3 | 283 | 54.3 | 36.3 | 1.796 | 2294.3 | 0.6 | 1376.6 |
| LW1 | 283 | 50.3 | 33.6 | 2.229 | 2619.7 | 0.2 | 523.9 |
| LW2 | 283 | 50.3 | 33.6 | 2.229 | 2619.7 | 0.4 | 1047.9 |
| LW3 | 283 | 50.3 | 33.6 | 2.229 | 2619.7 | 0.6 | 1571.8 |
| LW3-C | 283 | 51.6 | 34.5 | 2.229 | 2619.7 | 0.6 | 1572.0 |
| ME3 | 283 | 52.2 | 34.9 | 1.45 | 1960.8 | 0.6 | 1176.5 |
| MT1 | 283 | 53.5 | 35.8 | 1.82 | 2201.2 | 0.2 | 440.2 |
| MT2 | 283 | 53.5 | 35.8 | 1.82 | 2201.2 | 0.4 | 880.4 |
| MT3 | 283 | 53.5 | 35.8 | 1.82 | 2201.2 | 0.6 | 1320.7 |
| MW3 | 283 | 50.3 | 35.8 | 2.41 | 2351.5 | 0.6 | 1410.9 |
| MT2-C | 283 | 52.2 | 34.9 | 1.87 | 2144.5 | 0.4 | 857.8 |
2.4 Test device and loading system
2.4.1 Test device
This test is to simulate the seismic conditions, and the loading mode of low-cycle reciprocating load is adopted, i.e., constant axial pressure applied vertically downward and the horizontal force of round-trip cycle are applied to the specimen. The horizontal force of the round-trip cycle is applied by the loading actuator installed on the reaction wall (the rated loading capacity is 500 kN). The constant axial pressure is provided by an LTA hydraulic control system (purchased from Liuzhou Litian prestressed equipment factory), which is composed of a hydraulic jack and console with a range of 4,000 kN, as shown in Figures 3 and 4.
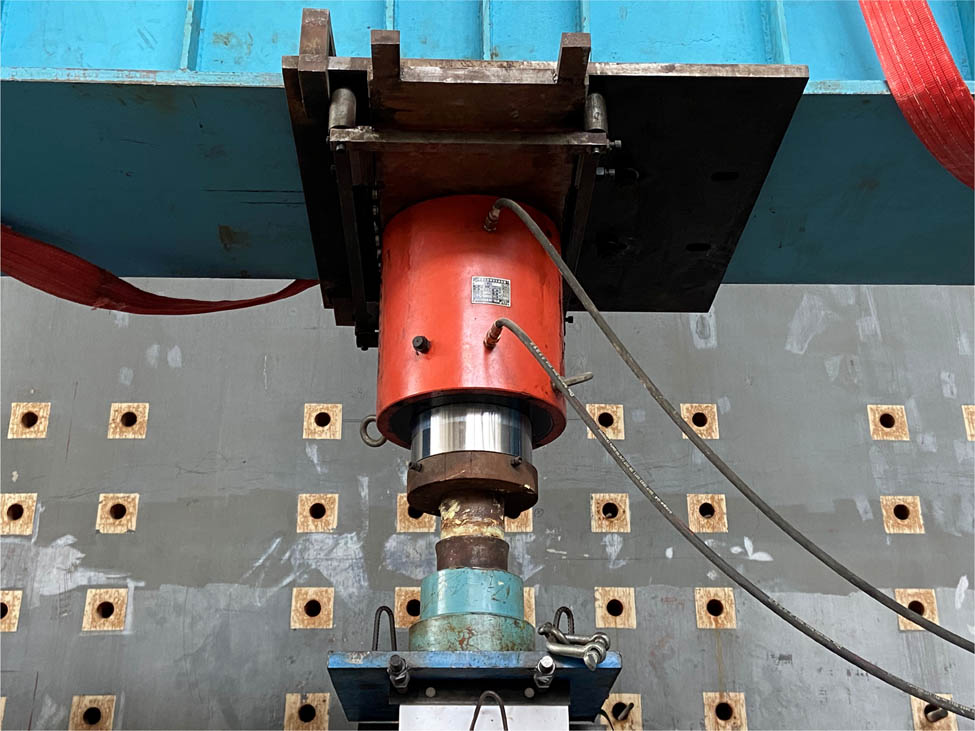
Hydraulic jack.
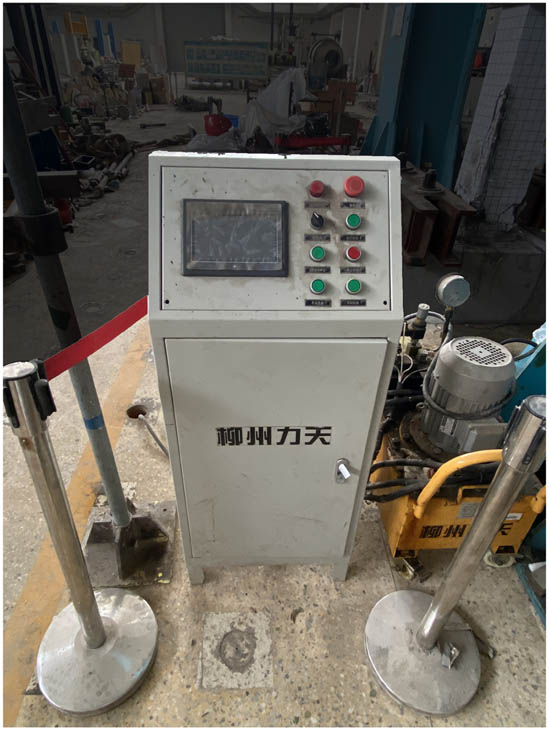
Hydraulic control system.
2.4.2 Loading system
The loading method used in this test is full displacement loading, which was loaded according to the relevant provisions in ⟪Seismic test code for buildings⟫ (JGJ/t101-2015) [36].
Preloading was carried out before the formal test, so that the structure could quickly enter the normal working state, and the reliability of loading equipment and devices could be checked. Then, it was loaded to full load, and LTA hydraulic control system was used to keep the shaft pressure at the set value during the experiment. In addition, preloading was carried out before the horizontal load was applied to test whether the loading equipment and devices work normally.
The horizontal repeated load was loaded in the way of displacement control. To determine the yield load of the steel pipe, it was loaded level by level with 1 mm (1, 2, 3 mm, etc.). When there is an obvious inflection point in the resultant load displacement curve, it is regarded as the yield of the steel pipe, and the corresponding displacement value when the steel pipe yield is the yield displacement of the steel pipe. After the yield point is reached, the displacement control method varies, the value of the displacement increment is an integral multiple of the yield displacement. Each level of loading is repeated three times. When the specimen has obvious damage or the horizontal load drops to 85% of the maximum, the loading process should be stopped, as shown in Figure 5.
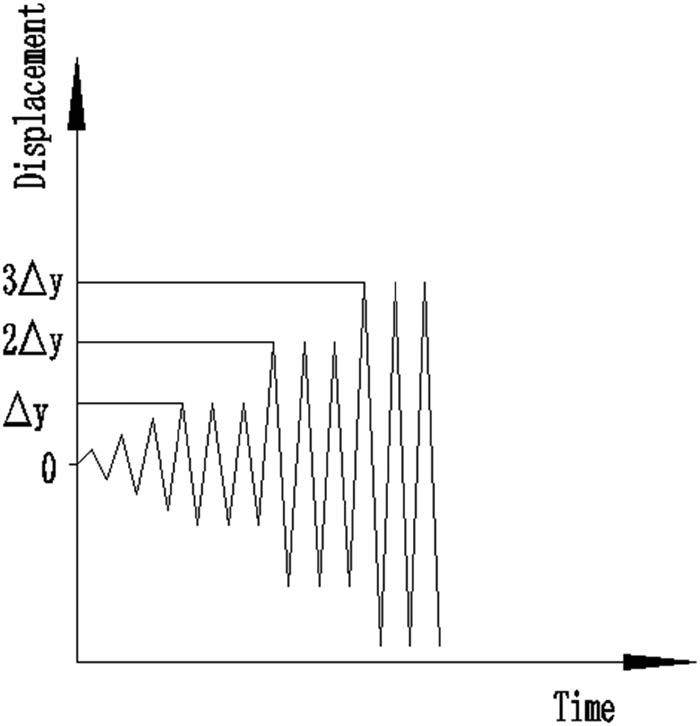
Loading system diagram.
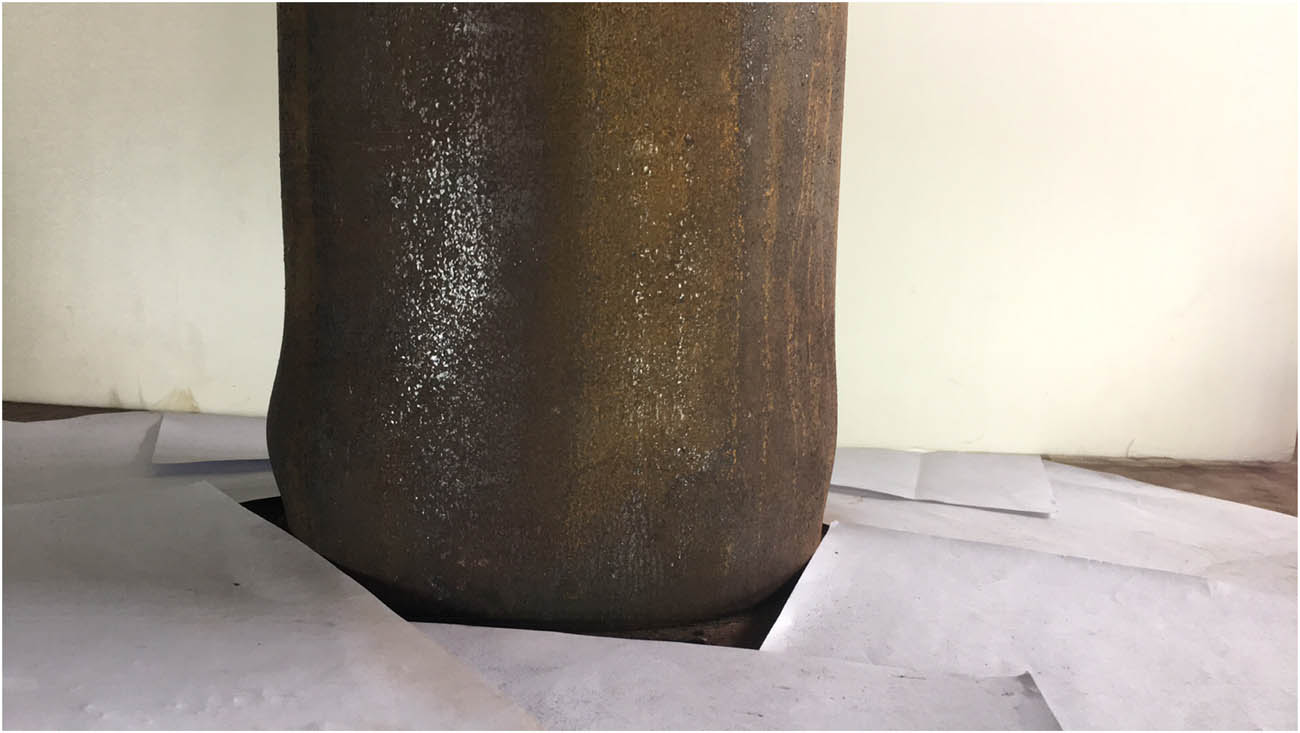
Typical failure mode of test piece.
2.5 Experimental phenomenon
The test phenomena and failure forms of the 23 specimens are similar. Before the steel pipe yields, the lateral displacement of the specimen is small, and there is no obvious phenomenon on the steel pipe surface. After the steel pipe yields, the lateral displacement of the specimen gradually increases, and a small drum begins to appear at the bottom of the steel pipe column. The reason for the bulging deformation is that when the load is about 3–5 times that of the yield displacement, the micro buckling starts to appear. With the forward and reverse loading and unloading of the horizontal load, the micro buckling on one side of the steel pipe gradually recedes, and the buckling on the other side starts to occur. During this repeated loading and unloading process, the degree and range of buckling of the steel pipe gradually increase [37,38]. After the horizontal thrust reaches the peak value, the bulging at the bottom of the steel pipe column gradually becomes more obvious. When the load is about five times the yield displacement, the buckling failure develops rapidly, and the buckling degree and range in the steel pipe increase rapidly. In the final stage, the buckling surface of each specimen forms an “elephant leg” shape of drum failure. Under the axial compression ratio of 0.6, the outer diameter of the drum is at its largest. The failure mode of the test piece is shown in Figure 6.
The drum height of each specimen is within 10–80 mm from the column bottom, and there is a small difference in the drum degree on the front and rear sides of the specimen. This is mainly caused by the loading system error. During the loading process, because the test piece has only front and rear constraints and no lateral constraints, when the horizontal displacement reaches a certain degree, the test piece tends to offset to the side, and the vertical axial force applied by the jack fluctuates slightly, resulting in inconsistent stress on the cross section of the steel pipe in all directions. In addition, when pouring the core concrete into the steel pipe, it is impossible to achieve complete uniformity of the concrete aggregate, which is also the reason for the asymmetry of the degree and range of steel pipe bulging.
3 ML models
3.1 RF
RF is a decision tree (DT) model based on bagging algorithm. RF adopts a sampling with replacement method to randomly collect samples from the original dataset to form multiple sample sets of the same size, and each sample set is used in the training process of different DTs. The random nature includes random sample extraction and random feature extraction. The final result is obtained by voting in the classification problem, and the mean value of the above model is used as the final result in the regression problem. The bagging method proposed by Breiman [39] not only effectively reduces the prediction variance but also improves the prediction performance and stability. The RF algorithm is described in Figure 7. The training set can be expressed as R
n
in equation (1), where X is the input vector with m features (
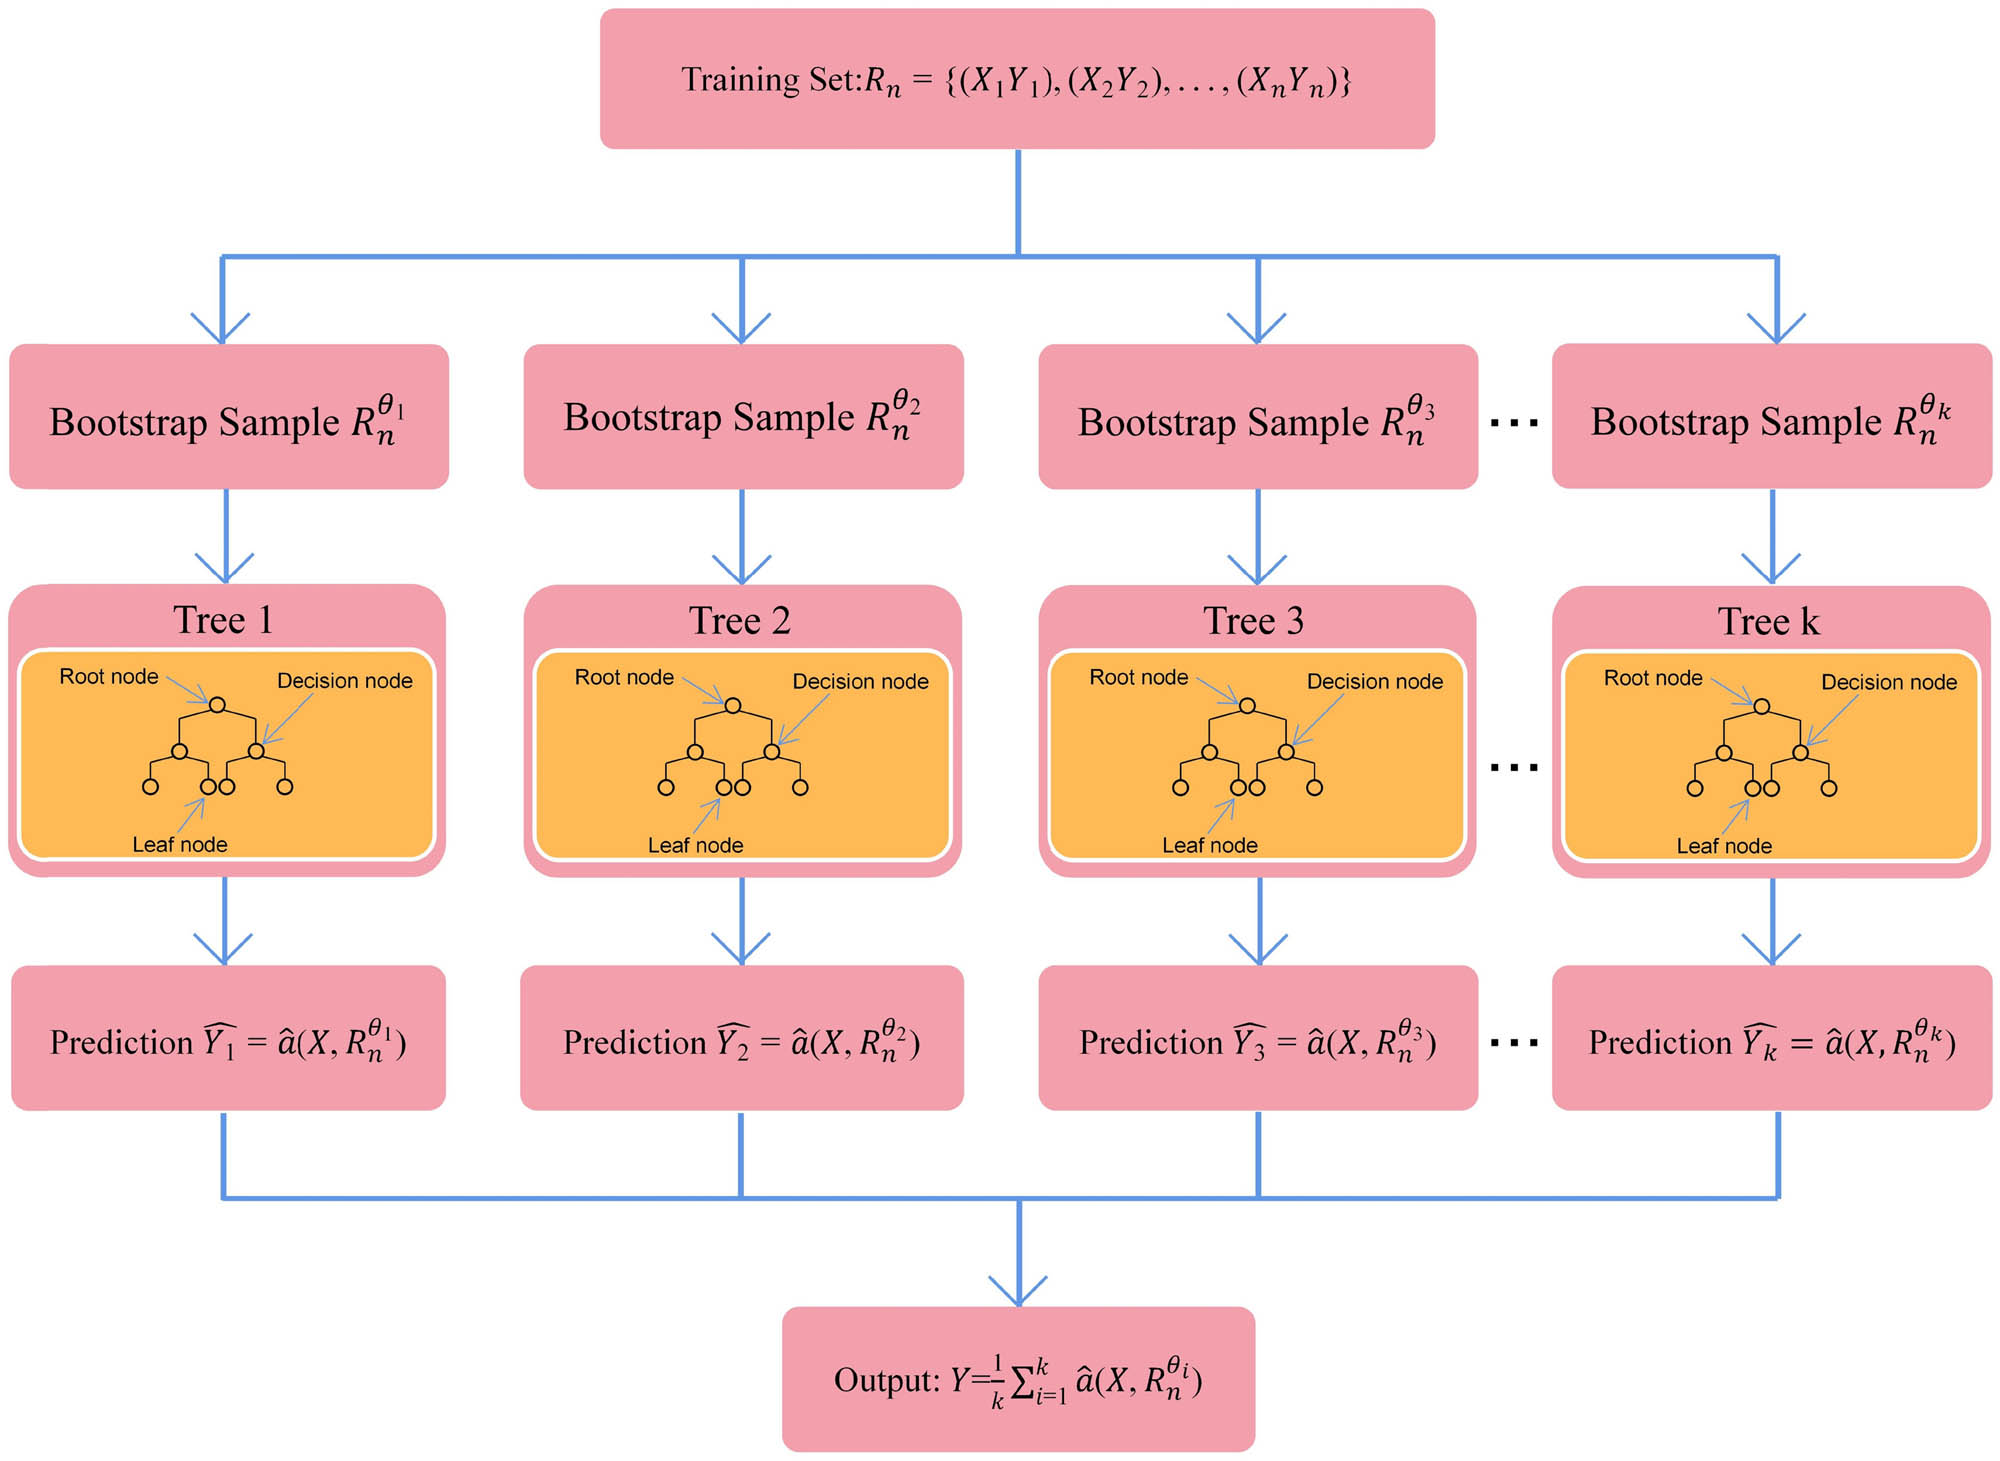
Construction of an RF model.
In the training process, samples are randomly selected from the training set by repeated sampling, and the probability of each sample being selected in each selection is 1/n. The abovementioned sample collection process is called “bootstrap,” and the resulting dataset can be expressed as
3.2 Baseline models
Constructing a baseline model as a comparison object helps to evaluate the target model from multiple perspectives. When dealing with regression problems in the construction field, multiple linear regression (MLR) and logical regression (LR) are relatively popular models [40]. As mentioned above, this study proposes these two baseline models (LR and MLR) as the comparison objects of the RF and back propagation neural network models, and evaluates their prediction differences from the perspective of performance evaluation. The LR and MLR models suitable for multivariate prediction are shown in equations (4) and (5).
where x
k
is an independent variable and p is a dependent variable; b
0 and b
k
are the constant coefficients, Y is the output, x
n
is the multiple predictive variables,
3.3 FA
Naturally inspired algorithm is one of the powerful optimization algorithms. FA comes from the unique social behavior of fireflies [41,42]. Fireflies can not only emit short and regular flashes but also be attracted by other flashes. This is because fireflies rely on flashes to find mating partners. It is worth noting that the flash of fireflies decreases with the increase in the distance between two fireflies, and the attraction of the flash also decreases. FA idealized the flash characteristics of the firefly: low brightness firefly will spontaneously move toward the brighter firefly; the fireflies with the highest brightness will move randomly; although attractiveness is proportional to brightness, both are inversely proportional to distance; the brightness of fireflies depends on the objective function of the problem. Equation (6) represents the position change of a low-brightness firefly i as it moves toward a high-brightness firefly j. The pseudocode of FA is shown in Figure 8.
where the positions of fireflies i and j at the t-th iteration are
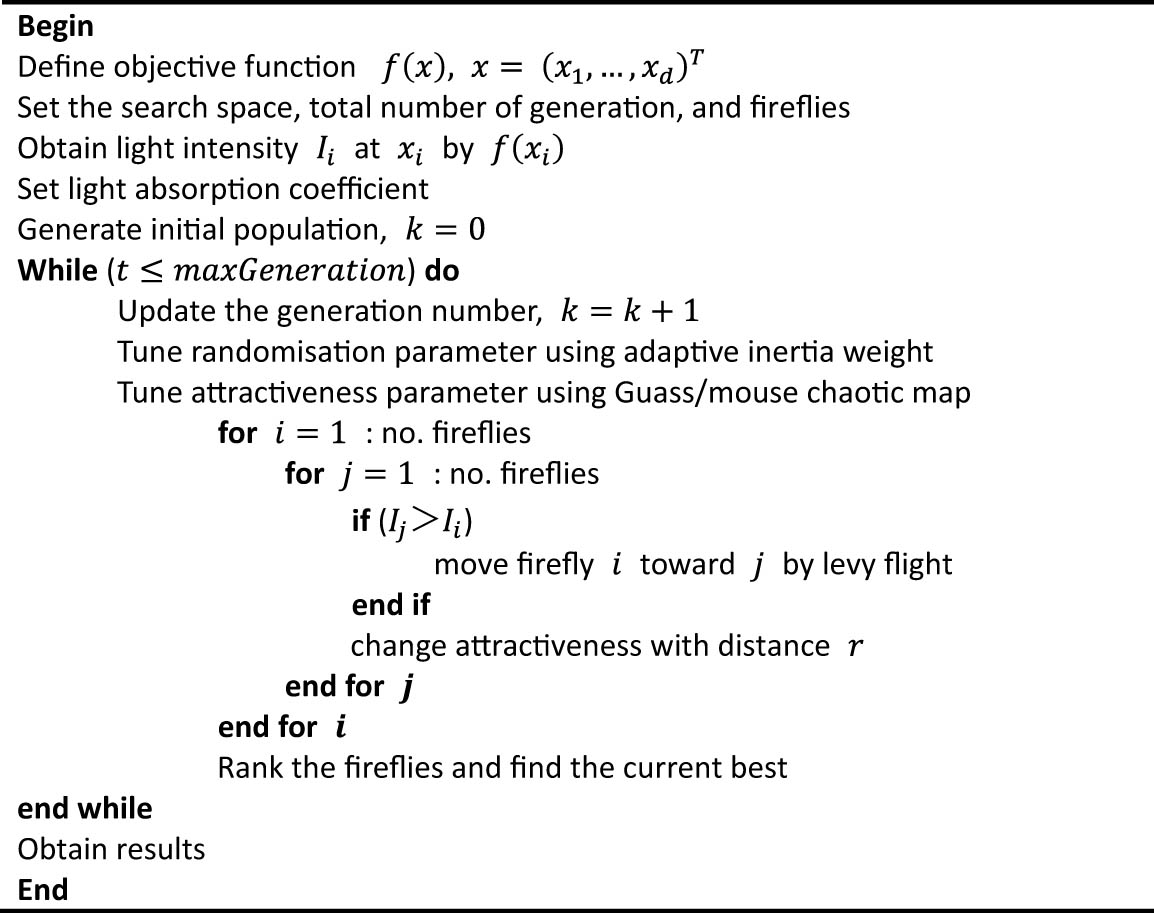
The pseudocode of FA.
The limitation is that the FA is a metaheuristic optimizer, thus it possesses inherent stochastic properties. Thereby, this procedure fails to provide a highest prediction accuracy if the program is only carried out one time. Several run times are conducted and the statistical outcomes are compared to verify the feasibility of the proposed procedure. In this article, the results of only one run time are presented.
3.4 Cross validation (CV)
For the RF model, two hyperparameters (numTree and minNumLeaf) have a significant impact on the final model performance. The numTree parameter represents the number of regression trees in the model, which affects the computational efficiency and generalization ability of the model. The minNumLeaf parameter represents the minimum sample number of leaf nodes, which is an important parameter for constructing regression trees. The empirical ranges of numTree and minNumLeaf are from 1 to 50 and from 1 to 5, respectively. The initial values of both are 40.
The dataset is first randomly divided into two parts, one of which accounts for 30% for the test model and the other 70% for the training and verification model. 70% of the datasets were divided into 5 blocks, 4 of which were used to train the model, while the other one was used to verify the model. According to the above division method, repeated division for 5 times, you can get 5 groups of validation sets that do not overlap between the training set of partially overlapping datasets. Then, the model completes 50 iterations in the 5 groups of divided datasets, and the FA will dynamically select the optimal hyperparameters in the iteration process. Finally, the one with the optimal root mean square error (RMSE) is selected from the five models completed by iteration as the final model, and the test set is used to evaluate its final effect. Figure 9 shows the iterative process of the RF model.
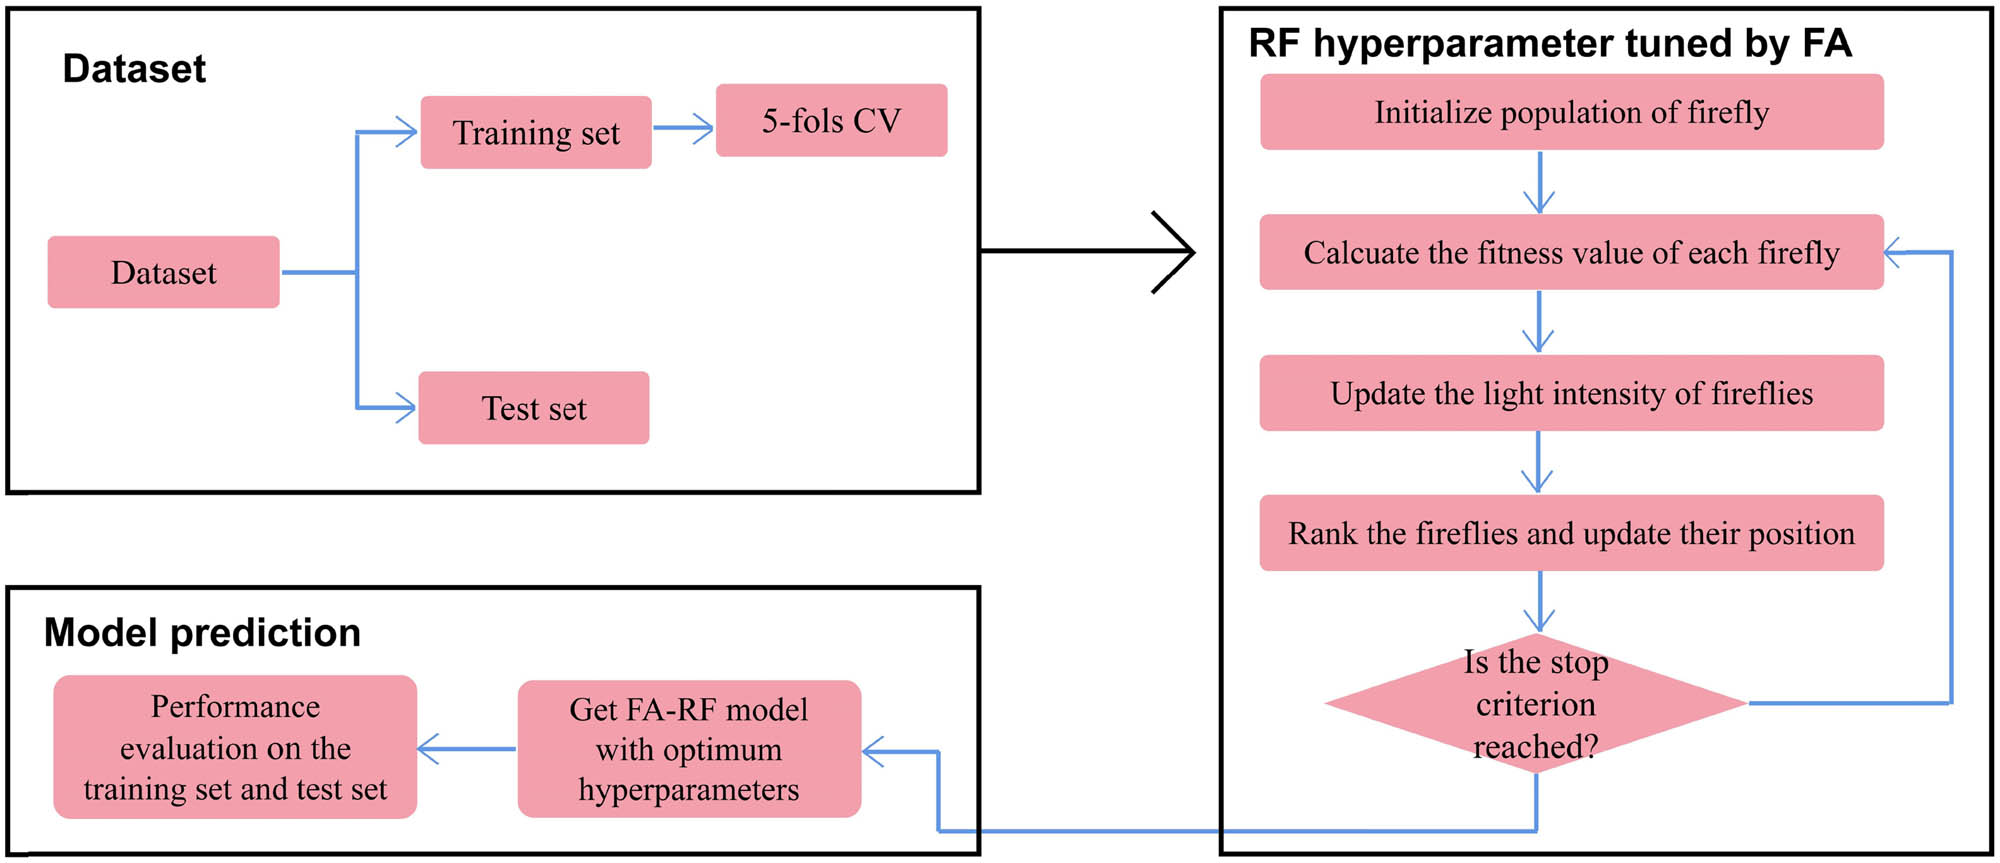
RF model training by 5-fold CV and FA.
3.5 Performance evaluation
Model evaluation is an important part of building solutions using ML. In this study, we selected the common and effective evaluation indexes in ML, namely, RMSE and correlation coefficient (R). Their definitions are as follows:
where n represents the number of samples involved in the evaluation;
3.6 Variable significance determination
Sensitivity analysis is an analytical method to study the relationship between input variables and output results. This method can evaluate the impact of inputs on outputs by changing the value of input variables in a feasible range [43]. Sensitivity analysis includes global sensitivity analysis (GSA) and local sensitivity analysis (LSA). Because LSA lacks the ability to search for uncertainty, this study uses the GSA method as it can evaluate all input variables. Finally, the impact of input variables on the output results is quantified as a percentage and visualized in the form of bar charts. Equation (10) shows a gradient metric used to estimate the resulting change and relative importance of the output [44].
where ε is the analyzed input variable;
4 Experimental results
4.1 Hysteresis behavior
Due to the large number of specimens and limited space, only representative specimens are listed in the hysteresis curve.
As shown in Figure 10, the hysteresis curves of each specimen are relatively full, without bow, shuttle, and anti-s shape and pinch shrinkage, which shows that the RACSTC has good hysteresis and energy dissipation performance. Before yielding, the specimen is in the elastic stage. In the process of horizontal force loading and unloading, the lateral displacement of the specimen is small. The hysteresis loop surrounded by forward and reverse loading and unloading is shuttle shaped, with a small area, less energy consumption, and small residual deformation. After yielding, the specimen enters the elastic–plastic stage. With the improvement in the displacement loading level, the lateral displacement and residual deformation of the specimen gradually increase, the stiffness degradation accelerates, the area of the hysteresis loop surrounded by forward and reverse loading and unloading increases, and the energy consumption increases.
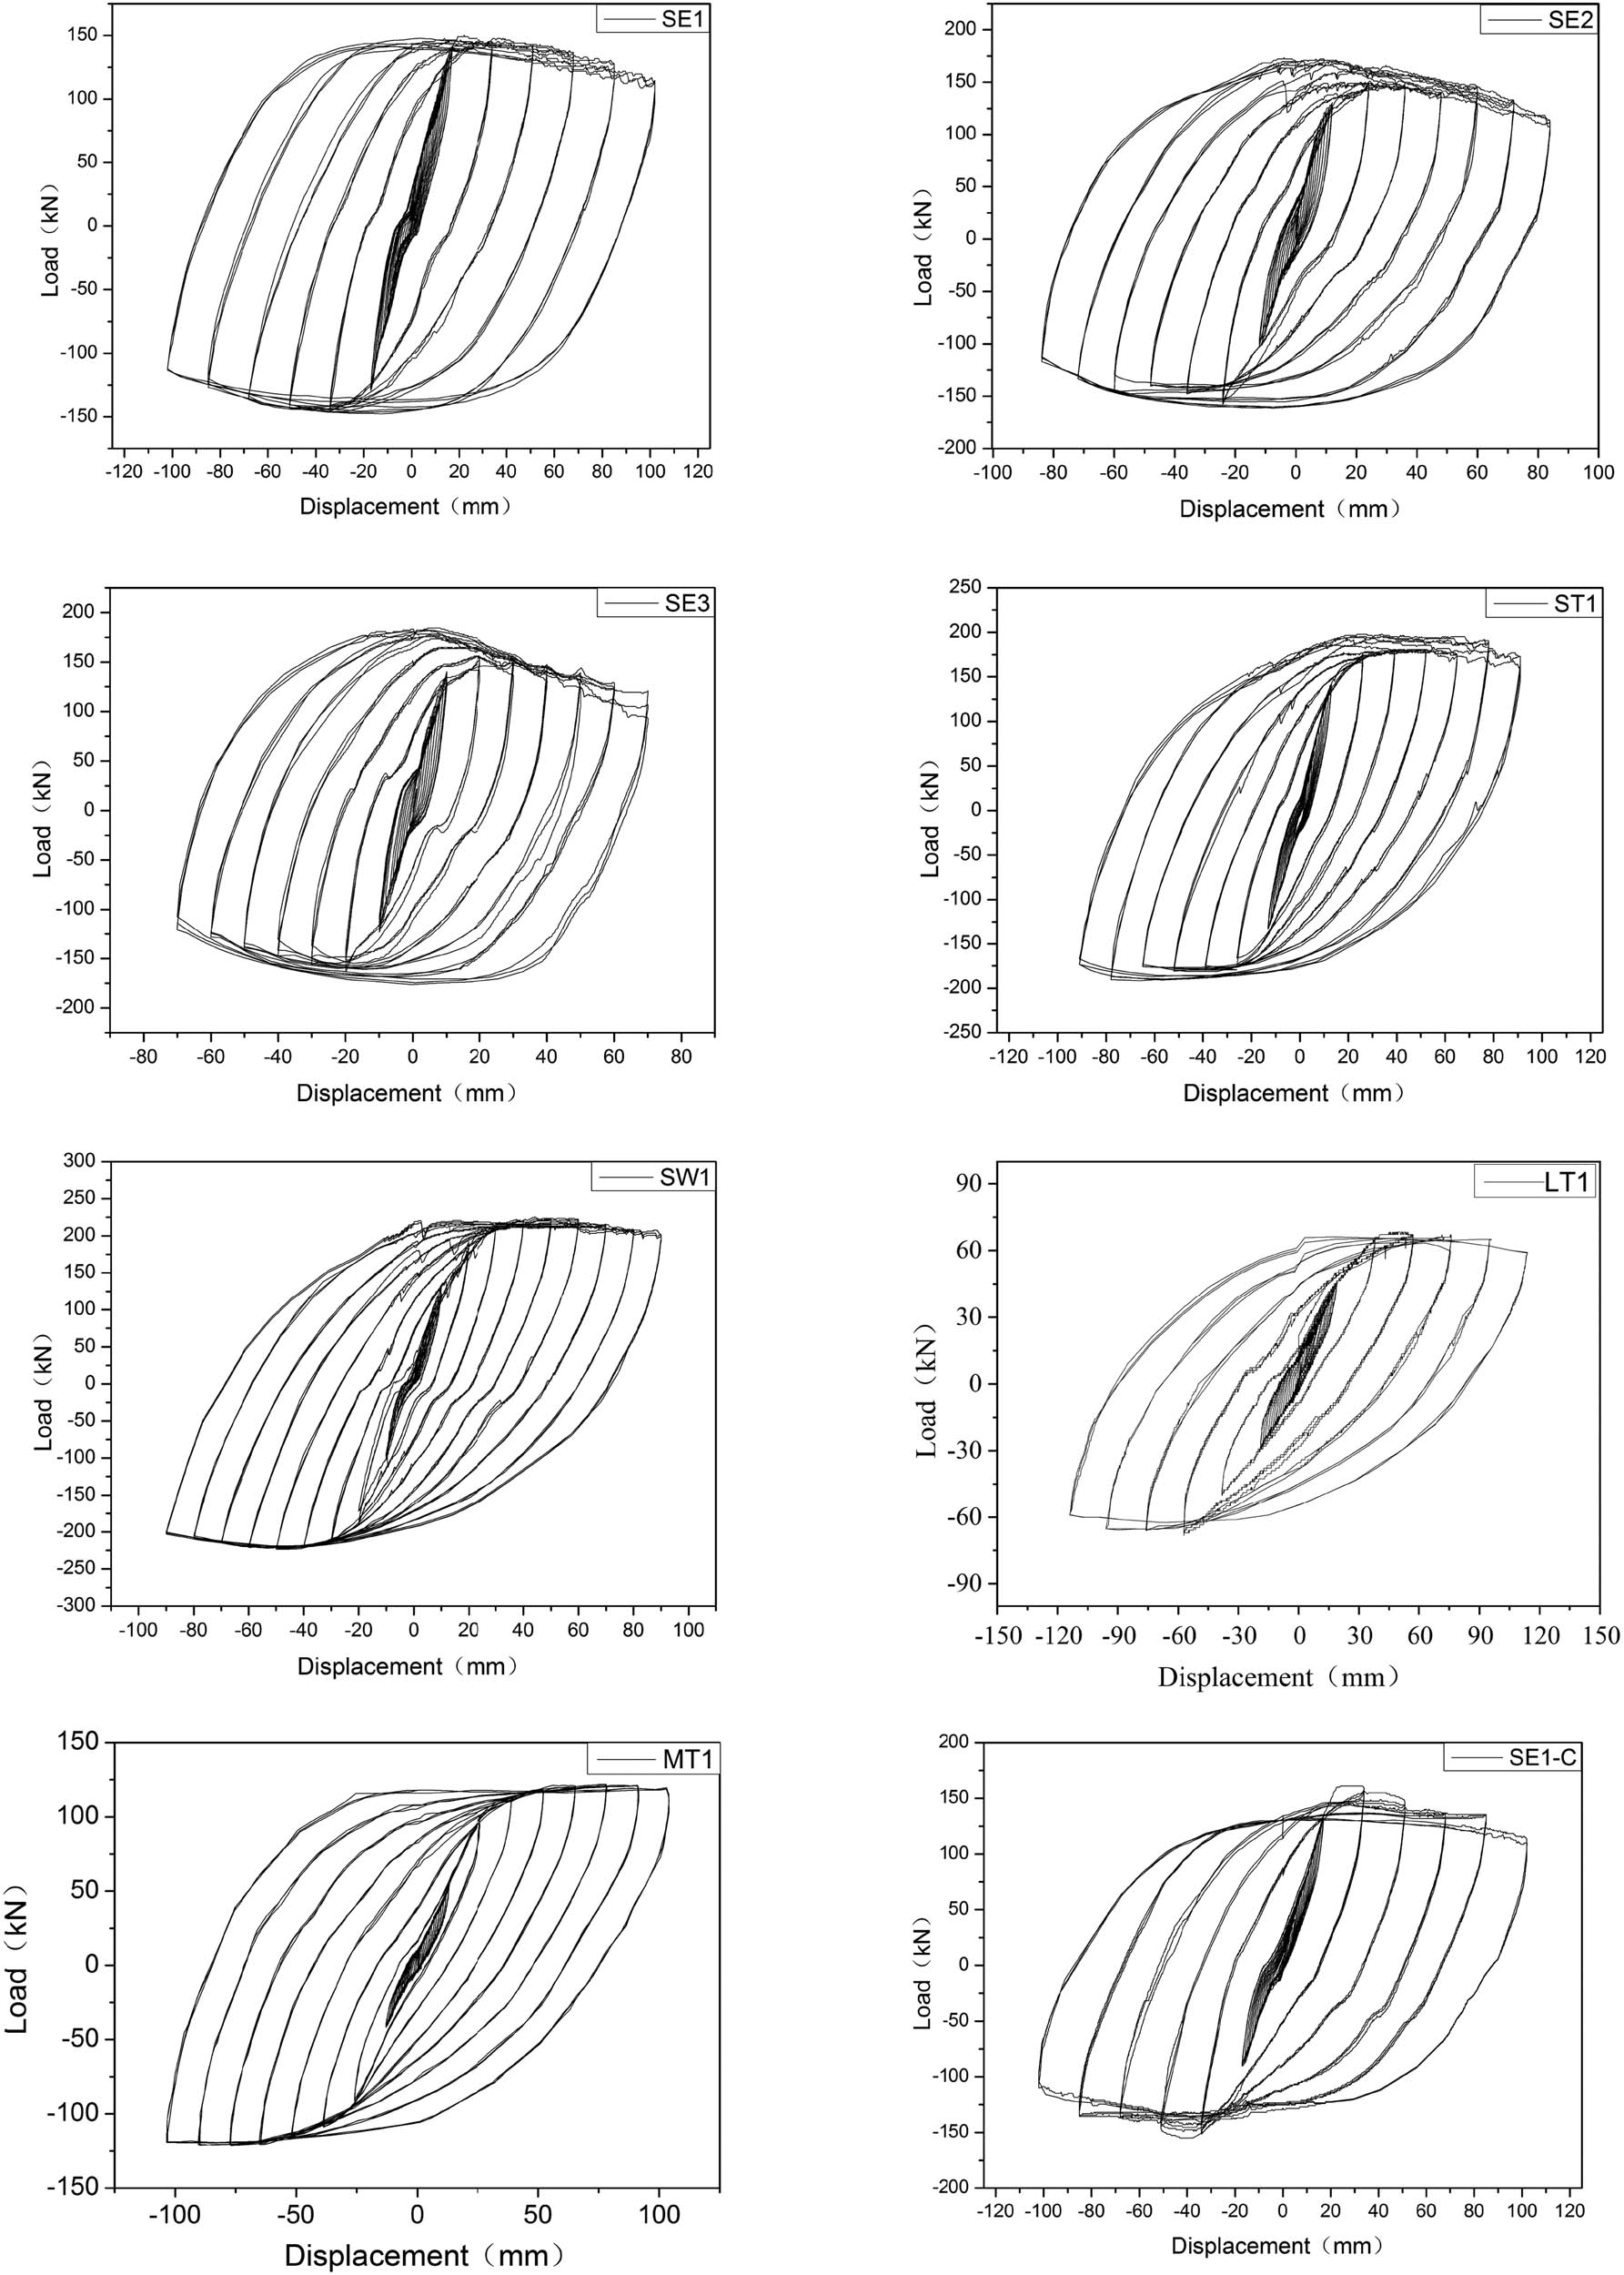
Hysteresis curve of typical specimens.
Comparing the hysteresis curves of each specimen in Figure 10, the peak horizontal load shows an increasing trend with the increase in axial compression ratio. Under the same axial compression ratio, with the increase in wall thickness, the area proportion of steel increases, and the peak horizontal load of the specimen noticeably increases. Under the same axial compression ratio and wall thickness, the peak horizontal load of the specimen decreases significantly with the increase in slenderness ratio.
4.2 Skeleton curve
Due to the large number of specimens and limited space, and for the convenience of comparison, only representative specimens are listed in the skeleton curve.
As shown in Figure 11, the skeleton curve trend of each specimen is similar, with obvious elastic, strengthening, and strength degradation sections. Before the steel pipe yields, the specimen is in the elastic stage, and the load displacement curve is approximately an oblique line. After the steel pipe yields, plastic deformation occurs, and the gradient of the load displacement curve decreases, but it still shows an upward trend until it reaches the peak load. Then, the curve, and the specimen, enters the downward strength degradation section, resulting in residual deformation.
For the specimens SE1, SE2, and SE3 with a single parameter change in axial compression ratio, the elastic stiffness of the specimen increases slightly with the increase in axial compression ratio. The decline speed of the falling section of the skeleton curve is faster, indicating that the specimen with a large axial compression ratio has small failure displacement and poor deformation capacity, but the peak water level bearing capacity of the specimen tends to increase.
For the specimens SE1, ST1, and SW1 with a single parameter change in wall thickness, the elastic stiffness increases slightly with the increase in wall thickness. The horizontal bearing capacity of the specimen increases and the displacement at failure decreases, which shows that increasing wall thickness is conducive to improving the bearing capacity of RACSTC.
For the specimens with a single parameter change in slenderness ratio (ST1, LT1, and MT1), which has a great impact on the mechanical properties of the specimens, the elastic stiffness and horizontal bearing capacity decrease significantly with the increase in the slenderness ratio, but the displacement at failure increases slightly.
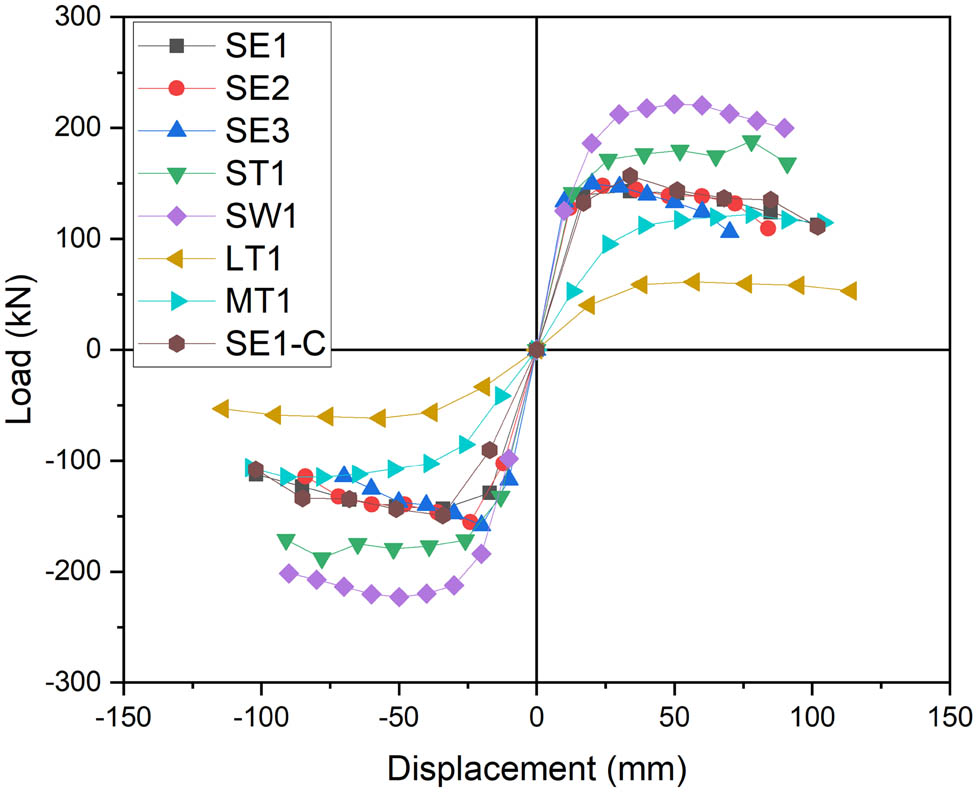
Skeleton curve of typical specimens.
4.3 Ductility analysis
The RACSTC do not display an ideal elastic–plastic relationship. The yield displacement value observed according to the load displacement curve will be affected by systematic error. At present, the commonly used methods to determine the yield displacement of components are the energy equivalence method and geometric drawing method. In this work, the geometric drawing method is used to determine the yield displacement of RACSTC, Δ y . The corresponding displacement value when the peak load decreases to 85% is taken as the limit displacement, Δ u . Then, the ductility coefficient, μ = Δ u ∕Δ y , is calculated. Yield displacement angle, Θ y = Δ y /L, and ultimate displacement angle, Θ u = Δ u ∕L, are also calculated. The calculation results are shown in Table 9.
Characteristic values of the skeleton curve of each specimen
| Number | P y | Δ y | P m | Δ m | P u | Δ u | μ | θ y | θ u |
|---|---|---|---|---|---|---|---|---|---|
| SE1 | 140.03 | 17.28 | 142.82 | 33.95 | 121.40 | 88.47 | 5.12 | 0.018 | 0.091 |
| SE1-C | 127.47 | 16.04 | 156.66 | 33.96 | 133.16 | 86.33 | 5.38 | 0.016 | 0.088 |
| SE2 | 127.11 | 11.64 | 147.70 | 23.97 | 125.55 | 75.34 | 6.47 | 0.012 | 0.077 |
| SE3 | 135.77 | 11.25 | 149.74 | 20.05 | 127.28 | 56.81 | 5.05 | 0.011 | 0.058 |
| ST1 | 147.32 | 15.47 | 187.99 | 77.96 | 159.79 | 90.96 | 5.88 | 0.016 | 0.093 |
| ST2 | 130.24 | 11.21 | 159.91 | 23.99 | 135.92 | 66.89 | 5.97 | 0.011 | 0.068 |
| ST3 | 142.30 | 14.36 | 179.04 | 33.01 | 152.18 | 52.11 | 3.63 | 0.014 | 0.053 |
| SW1 | 148.34 | 13.75 | 221.36 | 49.96 | 188.16 | 89.96 | 6.54 | 0.014 | 0.092 |
| SW2 | 186.51 | 15.87 | 228.27 | 44.99 | 194.03 | 82.30 | 5.19 | 0.016 | 0.084 |
| SW3 | 232.47 | 16.75 | 243.33 | 32.00 | 206.83 | 57.33 | 3.42 | 0.017 | 0.059 |
| LE1 | 36.62 | 17.00 | 54.93 | 51.00 | 118.76 | 136.00 | 8.02 | 0.009 | 0.068 |
| LE2 | 36.00 | 16.00 | 58.1 | 48.00 | 42.5 | 96.00 | 6.03 | 0.008 | 0.048 |
| LE3 | 39.75 | 14.00 | 60.46 | 42.00 | 47.2 | 84.00 | 5.94 | 0.007 | 0.042 |
| LT1 | 39.99 | 19.00 | 61.20 | 57.00 | 52.83 | 114.00 | 6.04 | 0.010 | 0.057 |
| LT2 | 50.01 | 18.00 | 60.00 | 36.00 | 49.7 | 90.00 | 5.02 | 0.010 | 0.049 |
| LT3 | 53.30 | 17.00 | 70.70 | 34.00 | 49.69 | 85.00 | 4.98 | 0.009 | 0.043 |
| LW1 | 50.40 | 24.00 | 83.70 | 96.00 | 73.53 | 144.00 | 6.04 | 0.012 | 0.072 |
| LW2 | 62.91 | 22.00 | 82.00 | 44.00 | 61.00 | 110.00 | 5.03 | 0.011 | 0.055 |
| LW3 | 65.67 | 18.00 | 79.30 | 54.00 | 62.00 | 90.00 | 4.99 | 0.050 | 0.045 |
| LW3-C | 68.02 | 20.01 | 84.33 | 40.00 | 48.80 | 100.00 | 4.99 | 0.011 | 0.050 |
| MT1 | 63.49 | 15.86 | 121.78 | 78.09 | 103.52 | 103.64 | 6.53 | 0.011 | 0.069 |
| MT2 | 65.92 | 14.99 | 84.23 | 32.01 | 71.60 | 86.87 | 5.79 | 0.010 | 0.058 |
| MT2-C | 65.92 | 14.93 | 92.28 | 32.38 | 78.44 | 76.86 | 5.15 | 0.010 | 0.051 |
| MT3 | 63.48 | 14.92 | 84.19 | 34.07 | 71.56 | 56.75 | 3.80 | 0.010 | 0.038 |
Note 1: P y and Δ y are yield load and yield displacement, P m and Δ m is peak load and peak displacement, P u and Δ u is failure load and failure displacement, respectively.
Note 2: Refer Section 2.1 for the description of each test piece number in the table.
Analysis of Table 9:
The ductility coefficient of each specimen is greater than 3, indicating that the RACSTC has good ductility.
For multi-storey and high-rise steel structures, the limit value of the elastic interlayer displacement angle subject to frequent earthquakes is 1/250, and the limit value of the elastic–plastic interlayer displacement angle of the weak layer subject to rare earthquakes is 1/50 [45]. In this work, the elastic interlaminar displacement angle of each specimen is 0.007–0.012, and the elastic–plastic interlaminar displacement angle is 0.042–0.072, which are greater than the limit value specified in the code. This indicates that the deformation capacity of the specimen in the elastic stage and the anti-collapse capacity in the elastic–plastic stage meet the design requirements.
For the specimen with a single parameter change in axial compression ratio, the influence law of axial compression ratio is different between the specimen groups with different slenderness ratios. Among the low slenderness ratio specimens, the middle axial compression ratio specimens have the best ductility; the low axial compression ratio is the second and the high axial compression ratio is the worst. In the group of medium and high slenderness ratio specimens, the specimens with low axial compression ratio have the best ductility, the medium axial compression ratio is the second, and the high axial compression ratio is the worst. The ductility coefficients of the specimens with medium and high axial compression ratios under the condition of high slenderness ratio are not different. The above rules can show that, in general, the specimens with low axial compression ratio have the best ductility, and the specimens with high axial compression ratio have the worst ductility. However, when the slenderness ratio is large, the influence of axial compression ratio on ductility is significantly reduced.
For the specimen with a single parameter change in wall thickness, the ductility coefficient of the specimen with steel pipe wall thickness of 8 mm is larger and better. With the increase in the wall thickness, the ductility of the specimen decreases. However, under the condition of high slenderness ratio, the ductility coefficient of the specimens with wall thicknesses of 10 and 12 mm is almost the same. It also shows that when the slenderness ratio is large, the influence of steel pipe wall thickness on ductility decreases significantly.
For the specimen with a single parameter change in slenderness ratio, the high slenderness ratio specimen has the worst ductility under the condition of medium and low axial compression ratio, while it has the best ductility under the condition of high axial compression ratio.
4.4 Energy dissipation performance
The area of the hysteresis loop obtained in this test directly reflects the energy dissipation capacity of the specimen, and the equivalent viscous damping coefficient, ζ eq. The ζ eq calculation results of each typical specimen are shown in Figure 12.
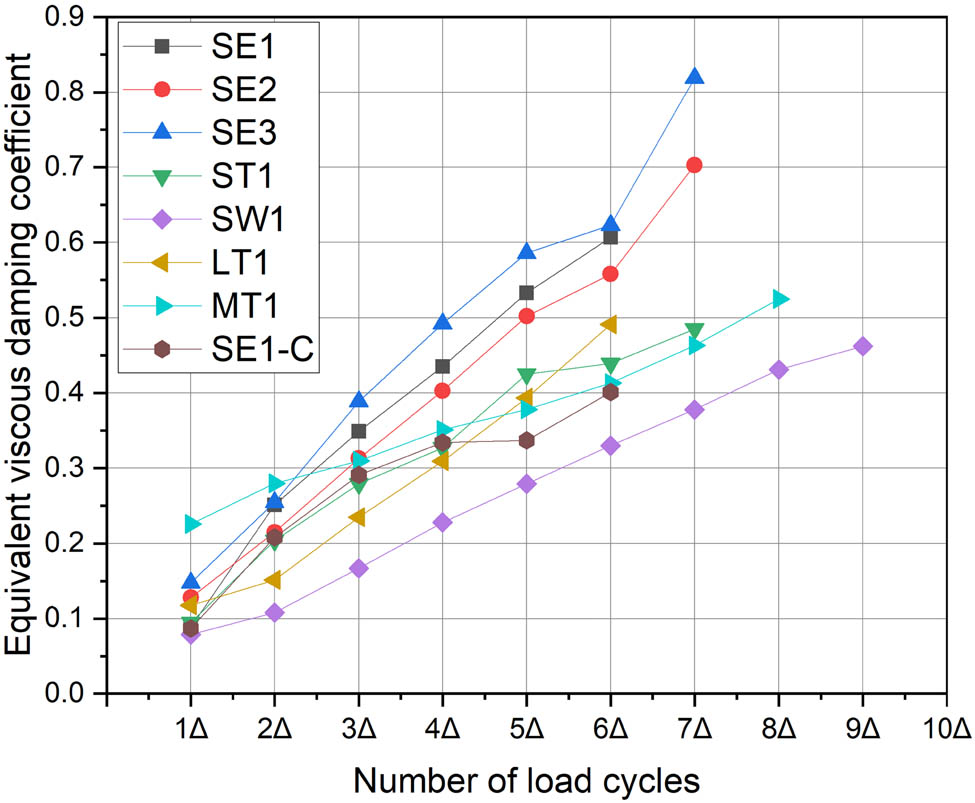
Curves of ζ eq vs Δ of typical specimens.
According to the analysis in Figure 12:
The equivalent viscous damping coefficients of the specimens are above 0.4, while the equivalent viscous damping coefficients of ordinary reinforced concrete columns are only 0.1–0.2, indicating that the RACSTC have good energy dissipation performance.
For the specimen with a single parameter change in axial compression ratio, the ζ eq−Δ curve of the specimens with a high axial compression ratio is always located above the ζ eq−Δ curve of the specimens with a low axial compression ratio. This shows that the energy consumption of RACSTC increases with the increase in axial compression ratio.
For the specimen with a single parameter change in wall thickness, the ζ eq−Δ curve of the specimen with a wall thickness of 8 mm is always located above the ζ eq−Δ curve of the specimens with wall thicknesses of 10 and 12 mm. This shows that the equivalent viscous damping coefficient of the specimen decreases significantly with the increase in wall thickness.
For the specimen with a single parameter change in slenderness ratio, in the initial stage of loading, the ζ eq−Δ curve of the specimen with a low slenderness ratio is located above the ζ eq−Δ curve of the specimen with a high slenderness ratio. Also, when the displacement cyclic loading grade is about 4–5 times the yield load, the ζ eq−Δ curve of the specimens with medium and low slenderness ratios is located below the ζ eq−Δ curve of the specimen with a high slenderness ratio. This shows that the specimen with a high slenderness ratio has higher energy dissipation performance in the later stage of loading.
4.5 Stiffness degradation
In this work, the secant stiffness is used to represent the stiffness of the specimen according to the provisions in the paper [44], and the secant stiffness
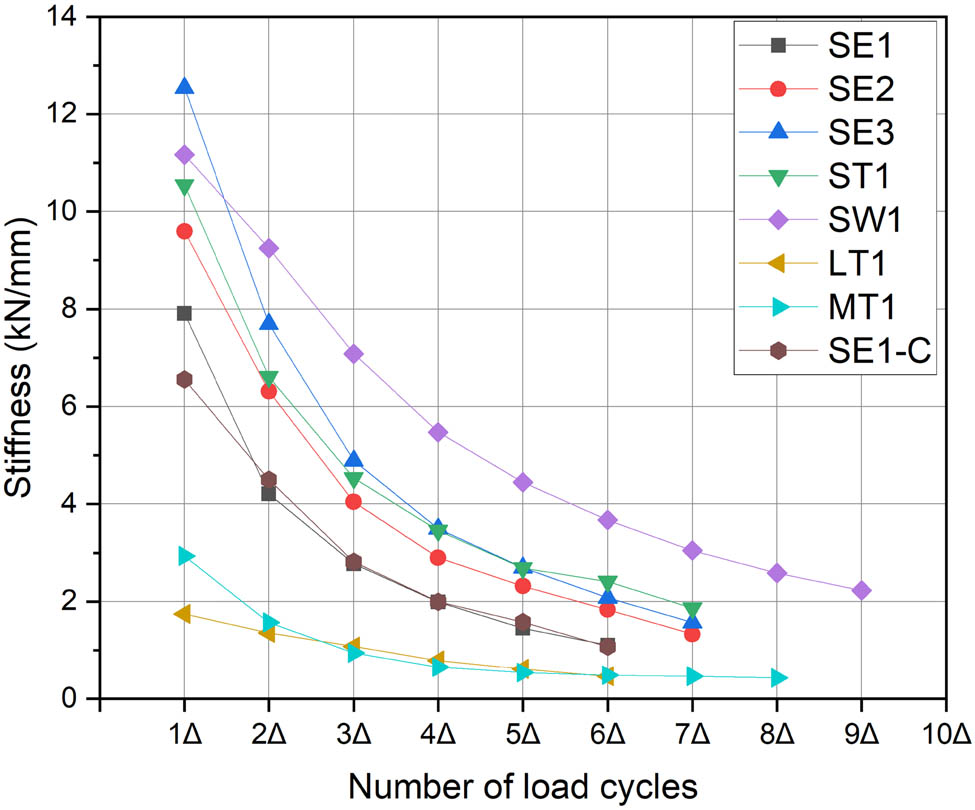
Stiffness degradation curve of typical specimens.
According to the analysis in Figure 13:
For the specimen with a single parameter change in axial compression ratio, the stiffness degradation curve of the specimen with a high axial compression ratio is always above the stiffness degradation curve of the specimens with medium and low axial compression ratios. This indicates that the initial stiffness of the specimen with a high axial compression ratio is larger and the stiffness degradation rate is faster. When the displacement loading level is four times the yield displacement, the stiffness decline amplitude and rate slow down, and reach the later stage of loading. There is little difference in the residual stiffness of each specimen.
For the specimen with a single parameter change in wall thickness, the stiffness degradation curve of thick-walled specimens is always above the stiffness degradation curve of thin-walled specimens. This indicates that the specimens with a thicker steel wall have greater initial stiffness and faster stiffness degradation rate, which gradually slows down in the later stage of loading, and there is little difference in residual stiffness during failure.
For the specimen with a single parameter change in slenderness ratio, the stiffness degradation curve of the specimen with a low slenderness ratio is always above the stiffness degradation curve of the specimens with medium and high slenderness ratios. This shows that specimens with smaller slenderness ratios have larger initial stiffness, faster stiffness degradation rate, and the overall stiffness of the specimen in the whole loading process is larger, while the stiffness of the specimens with medium and high slenderness ratios show little difference.
5 ML prediction results
The detailed parameters, ductility coefficient, and equivalent viscous damping coefficient of each specimen are shown in Appendix A. 23 groups of test data are obtained in this experiments, and the others are obtained from our previous work.
5.1 Hyperparameter tuning
The model FA–RF in this study ran 50 iterations in the 5-fold CV method and generated 5 corresponding RMSE values, which were determined according to the balance between the training time and RMSE reducing efficiency [46,47].
Figure 14a shows the results of the CV iteration of the model for predicting the displacement ductility coefficient, which shows that the RMSE of the 1st fold is the smallest. Figure 14b represents the iterative process of the 1st fold. Similarly, Figure 15a shows the results of the 5-fold CV iteration for the model used to predict equivalent damping coefficient. It can be observed that the RMSE obtained at the 5th fold is optimal. Figure 15b represents the detailed iterative process of the 5th fold. The RMSE value’s reduction can be clearly observed within the first 10–20 iterations and basically maintains the minimum value after 20 iterations (or occasionally changes), illustrating that the RMSE reaches the local minimum.
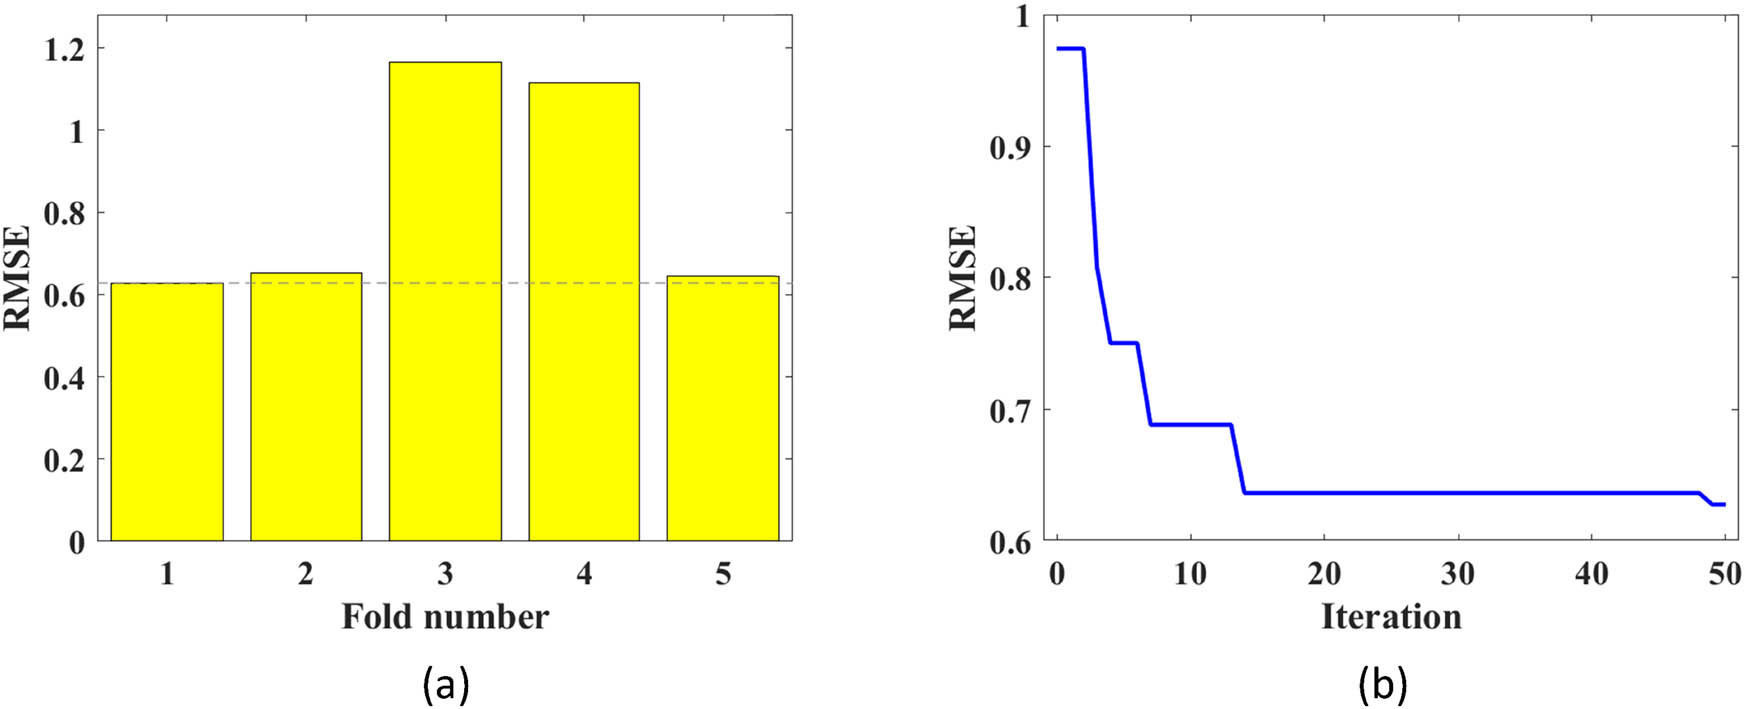
The CV results of displacement ductility coefficient prediction and the optimal fold iterative process. (a) 5-fold CV results. (b) The iterative process of optimal fold.
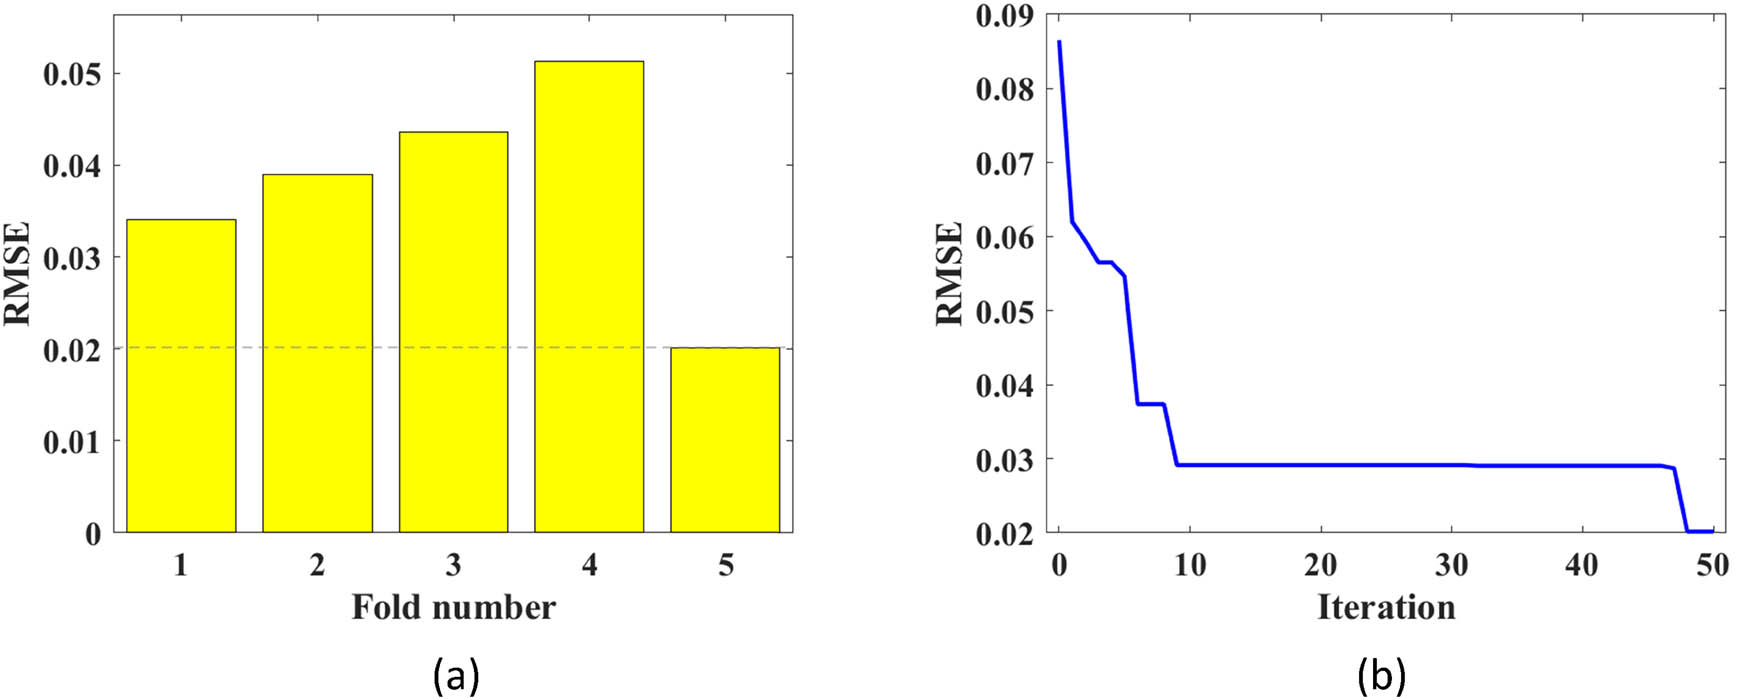
The CV results of equivalent damping coefficient prediction and the optimal fold iterative process. (a) 5-fold CV results. (b) The iterative process of optimal fold.
According to the above experiments, the optimal hyperparameters (numTree and minNumleaf) of the two models are finally obtained. For the displacement ductility coefficient prediction model, the optimal hyperparameters are numTree = 15 and minNumleaf = 1. For the equivalent damping coefficient prediction model, the optimal hyperparameters are numTree = 16 and minNumleaf = 1.
5.2 Performance of FA–RF modeling
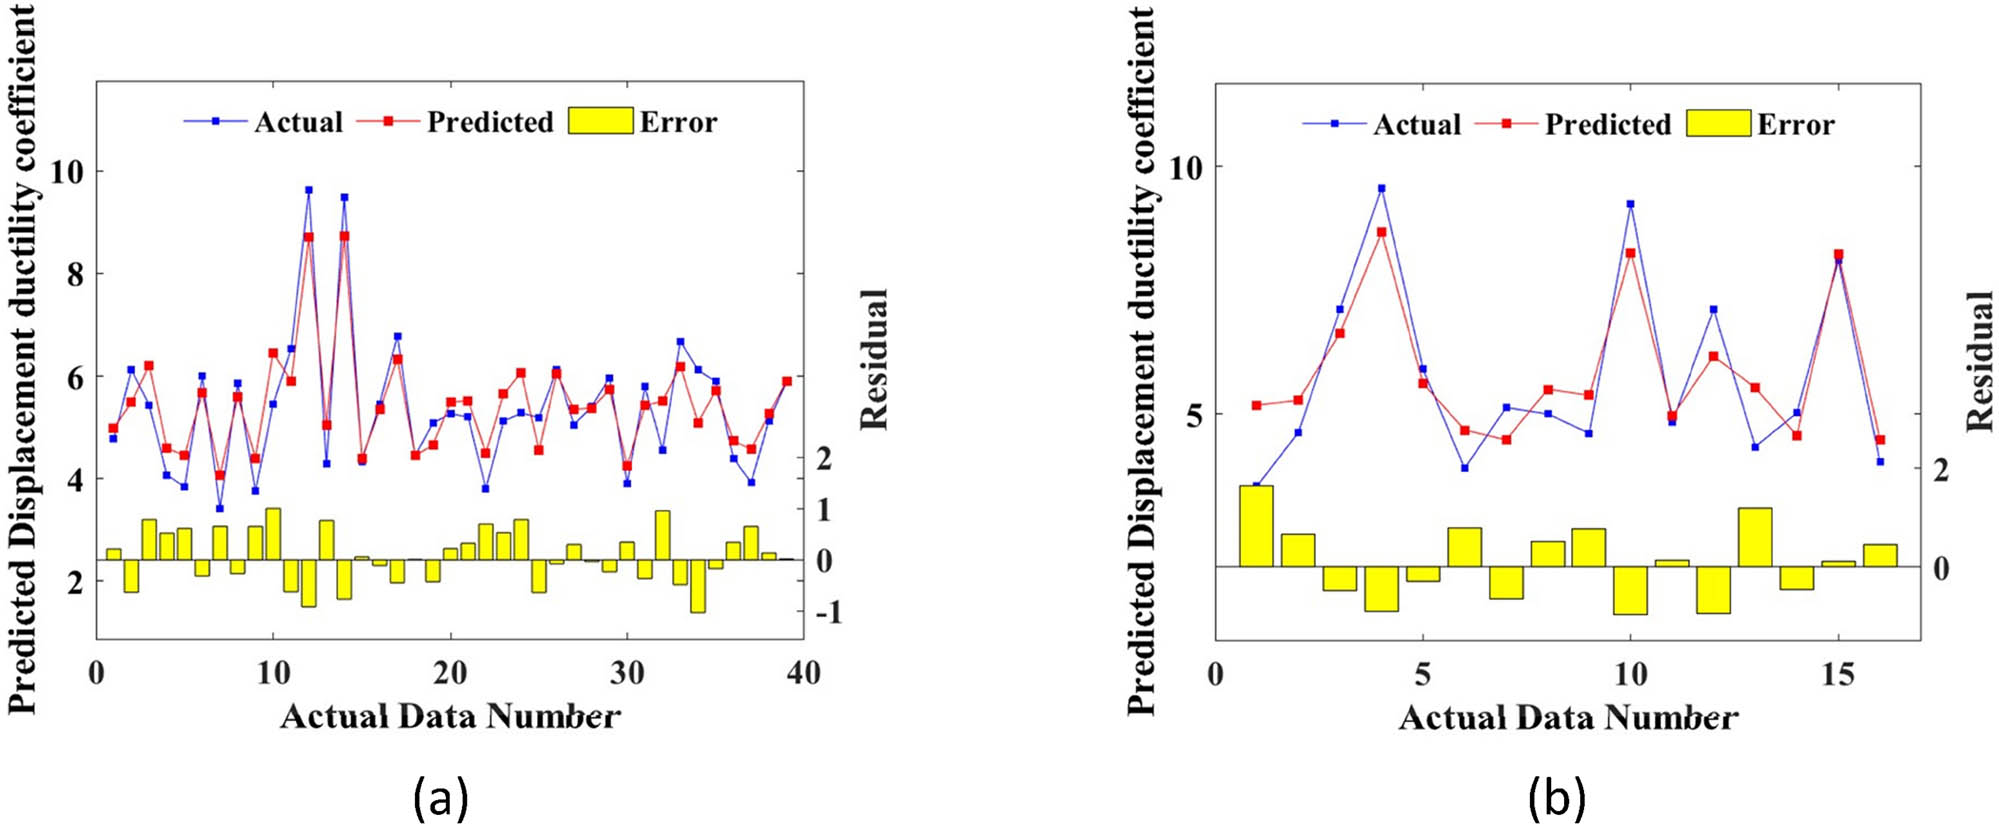
Figures 16–18 are the prediction errors of the FA–RF model, including the errors on the training set and the errors on the test set. The model uses the optimal hyperparameters obtained by FA adjustment.
Scatter plot of simulated and actual displacement ductility coefficient for training and test sets. (a) Training dataset. (b) Testing dataset.
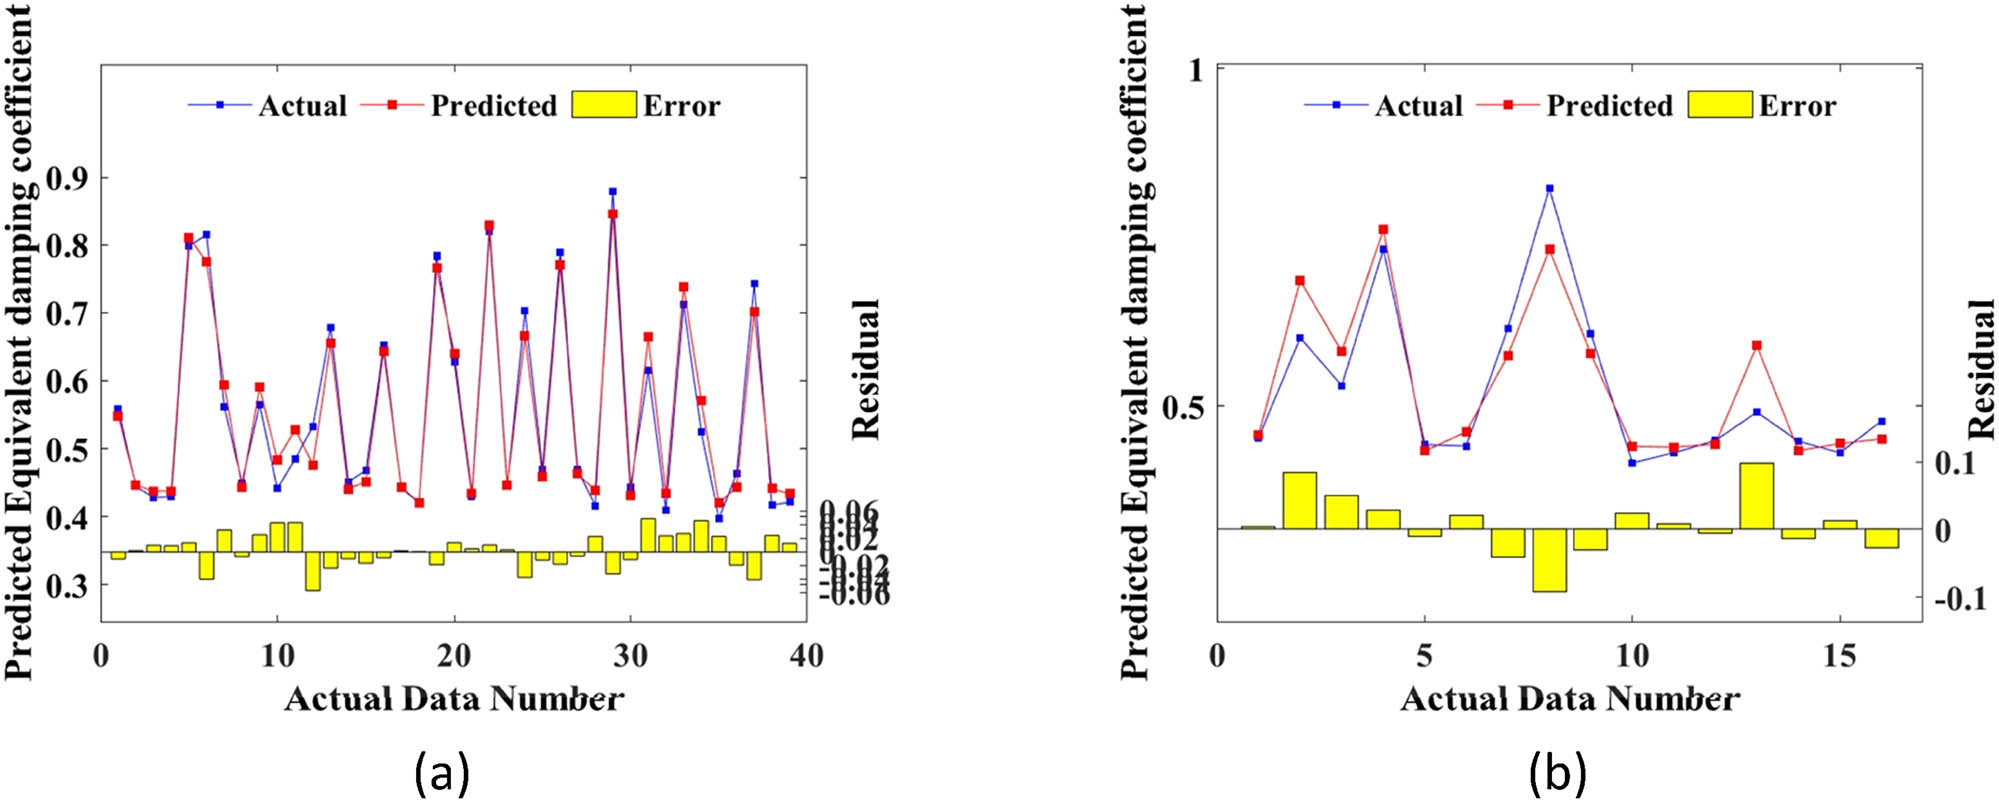
Scatter plot of simulated and actual equivalent damping coefficient for training and test sets. (a) Training dataset. (b) Testing dataset.
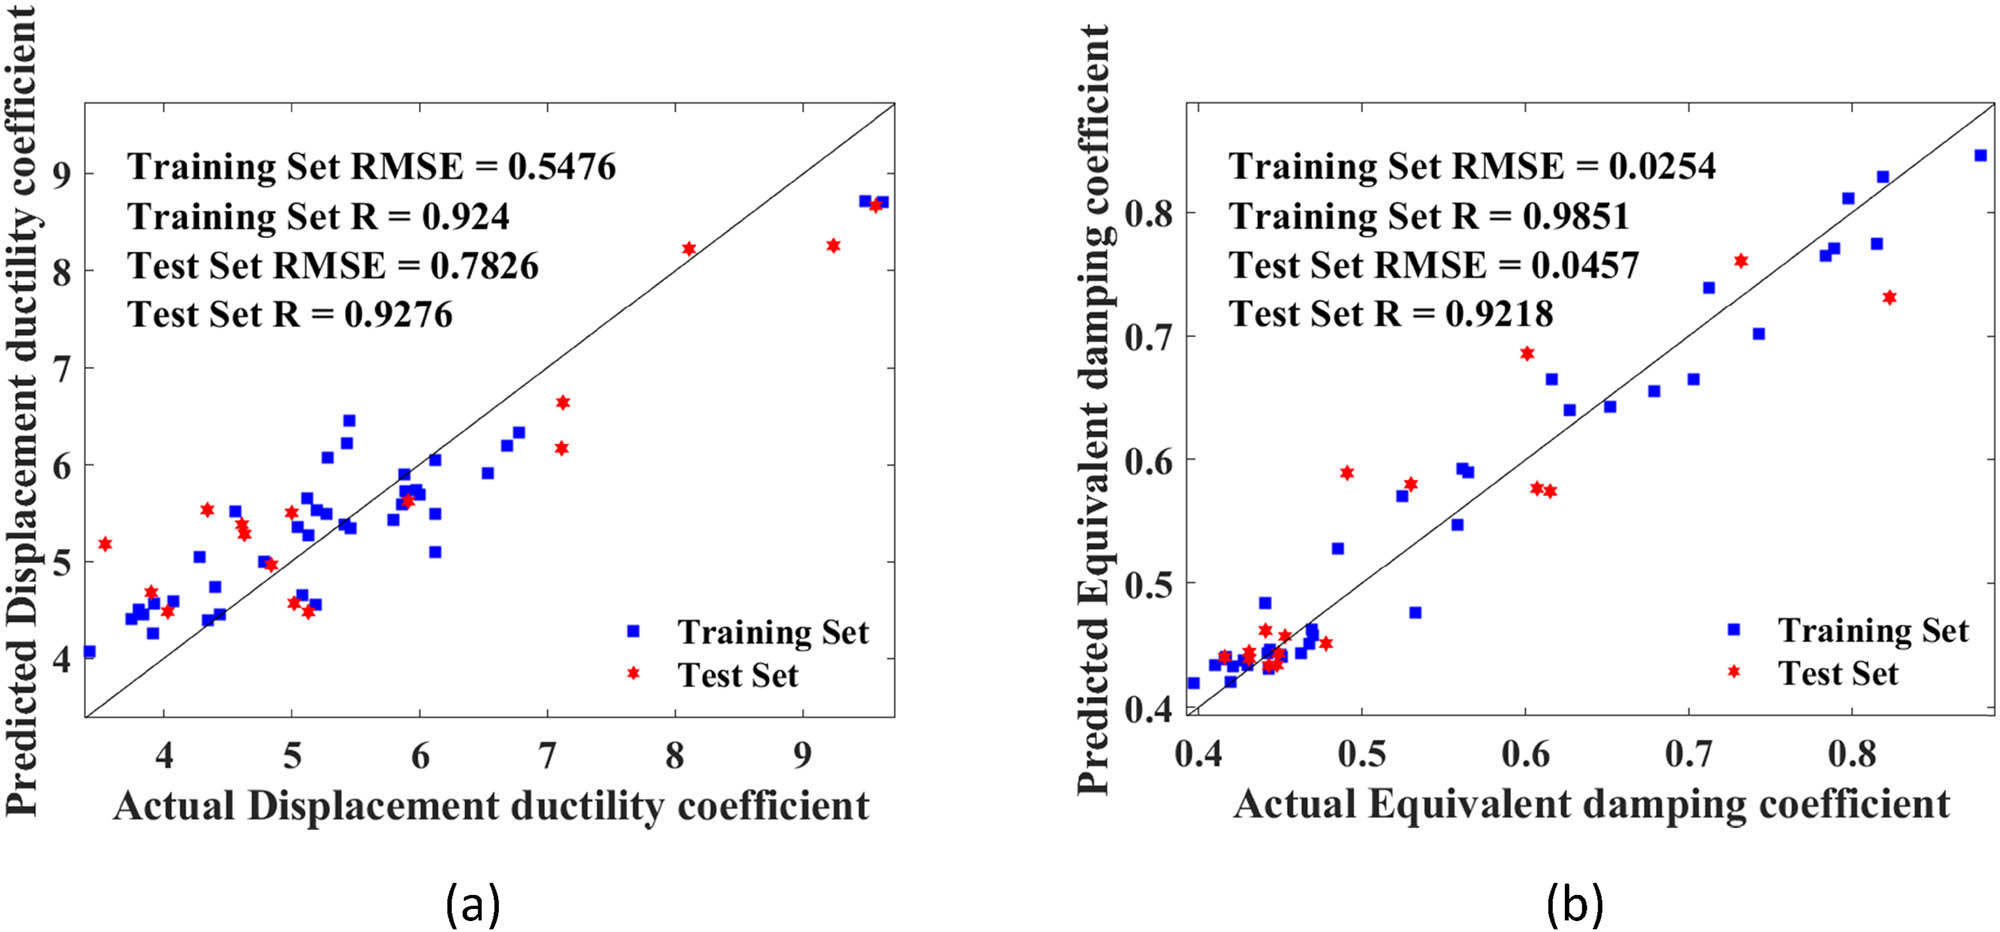
Scatter plot of simulated and actual values for training and test sets: (a) displacement ductility coefficient prediction and (b) equivalent damping coefficient prediction.
Figures 16 and 17 are the error diagrams of the prediction of displacement ductility coefficient and equivalent damping coefficient, respectively, and their differences are expressed by the difference between the actual value and the predicted value. The prediction is relatively accurate since no outlier or large error is observed. Thus, the mapping relationships from input variables (i.e., concrete strength, pipe length, etc.) to output results (i.e., equivalent damping and displacement ductility coefficients) are properly acquired by the ML model.
Figure 18 is a linear regression graph, which shows the difference between the coefficients by the correlation between the actual value and the predicted value. Figure 18a shows the experimental results of the model for predicting the displacement ductility coefficient, and Figure 18b shows the experimental results of the model for predicting the equivalent damping coefficient. The coordinates in the figures are composed of predicted values and actual values. Blue points and red points are data on the training set and test set, respectively. The black diagonal line represents the highest correlation, meaning that the predicted value equals the actual value. The distance between the points and the black diagonal is inversely proportional to the model prediction ability. The RMSE and R of the displacement ductility coefficient prediction model on the training set are 0.5476 and 0.924, respectively, and the RMSE and R on the test set are 0.7826 and 0.9276, respectively. The RMSE and R of the equivalent damping coefficient prediction model on the training set are 0.0254 and 0.0457, respectively, and the RMSE and R of the test set are 0.0457 and 0.9218, respectively. It can be observed that the points in the image are mostly distributed near the black diagonal, indicating that the predicted results are close to the actual results, and there is no underfitting. The distribution of blue dots and red dots is basically the same, indicating that the model does not have overfitting.
5.3 Comparison of RF, LR, and MLR
To further evaluate the necessity of the selected model in prediction, this study selects the baseline model MLR and LR as the comparison objects.
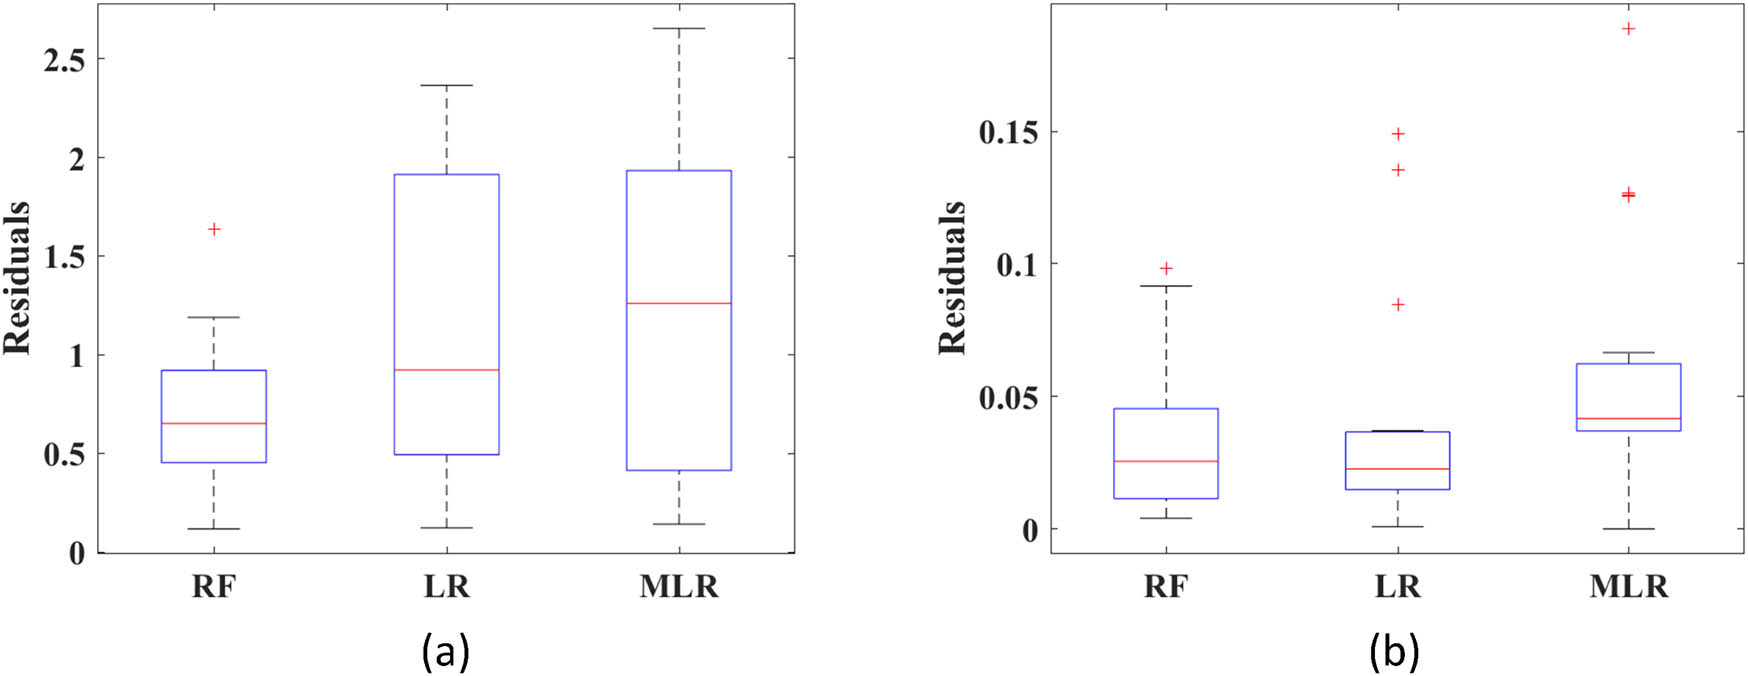
Figure 19 presents a performance evaluation of the RF, MLR, and LR models as a boxplot diagram. The red cross represents the abnormal point, and the upper and lower black horizontal lines represent the upper and lower limits, respectively. The upper and lower boundaries of the rectangular box represent the upper quartile and the lower quartile, respectively, and the red line inside indicates the median. In the prediction of the displacement ductility coefficient, the FA–RF model has fewer outliers, a narrower quartile range, and lower median. In the prediction of equivalent damping coefficient, the FA–RF model performs slightly worse, but it still has fewer outliers and the difference is not large.
Performance evaluation of three models by (a) displacement ductility coefficient prediction boxplot and (b) equivalent damping coefficient prediction boxplot.
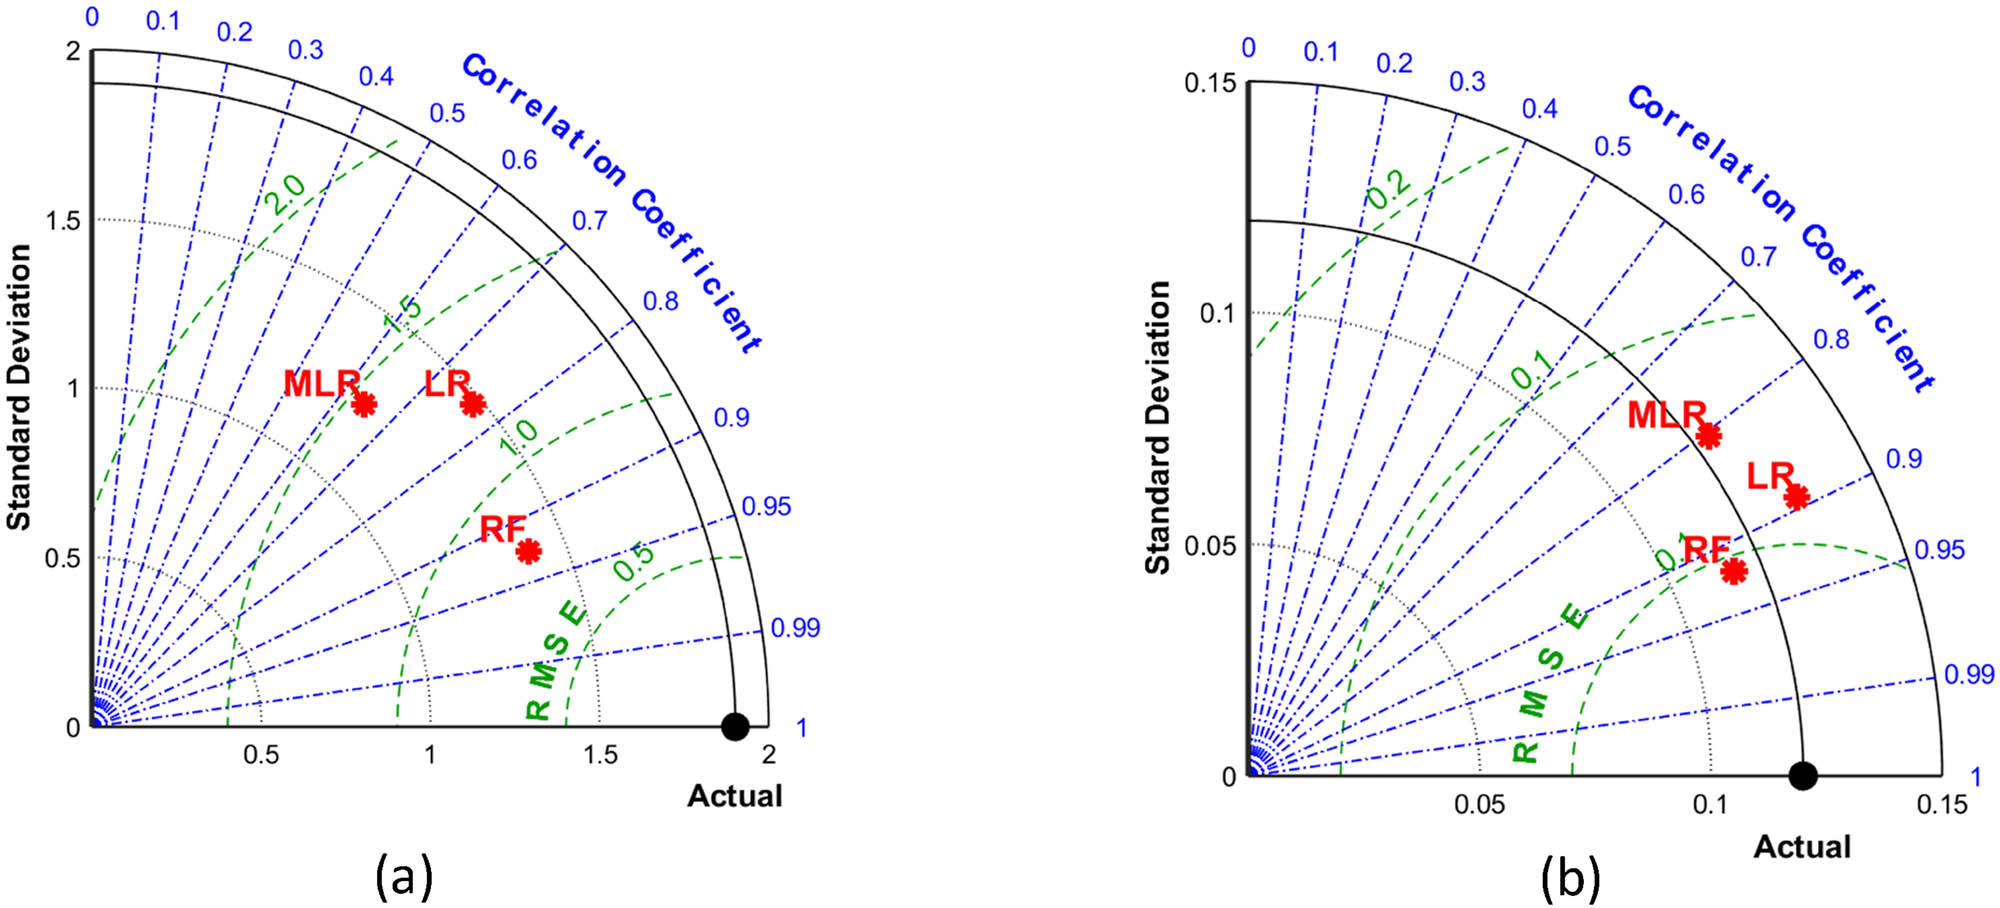
Figure 20 is the Taylor diagram, which evaluates the model from three aspects: standard deviation, correlation coefficient, and RMSE. The predicted results are closer to the real data (i.e. higher accuracy) if the distance between the ML points and the black point “Actual” is closer. For both displacement ductility coefficient prediction and equivalent damping coefficient prediction, the model FA–RF showed better results in standard deviation, correlation coefficient, and RMSE than the MLR and LR models.
Performance evaluation of three models by (a) displacement ductility coefficient prediction Taylor and (b) equivalent damping coefficient prediction Taylor.
Table 10 shows the evaluation results of the model on the test set for the prediction of displacement ductility coefficient and equivalent damping coefficient. It can be observed that the FA–RF model has better in RMSE and R than other models.
Evaluation of displacement ductility coefficient and equivalent damping coefficient test groups by the three models
| Model | Displacement ductility coefficient | Equivalent damping coefficient | ||
|---|---|---|---|---|
| RMSE | R | RMSE | R | |
| FA–RF | 0.783 | 0.928 | 0.046 | 0.922 |
| LR | 1.352 | 0.764 | 0.058 | 0.892 |
| MLR | 1.513 | 0.645 | 0.075 | 0.805 |
Combined with the box plot and Taylor plot analysis, the FA–RF model is more effective than LR and MLR in displacement ductility coefficient prediction and equivalent damping coefficient prediction. Table 10 also supports this conclusion. The results show that the FA–RF model performs the best in displacement ductility coefficient prediction and equivalent damping coefficient prediction.
5.4 Variable significance analysis
In sensitivity studies, input variables are analyzed to obtain the impact of each input variable on prediction results (usually shown in percentage). Figures 21 and 22 are the analysis results of the variable importance of the FA–RF model for the prediction of displacement ductility coefficient and equivalent damping coefficient, respectively. It can be observed in Figure 21 that the axial pressure ratio, solid waste content, and concrete design strength are of high importance for displacement ductility coefficient prediction; 41.72, 36.53, and 17.35%, respectively. Steel pipe thickness and effective steel pipe length are less important; 3.36 and 1.04%, respectively. Figure 22 shows that steel pipe thickness is the most important variable for equivalent damping coefficient prediction, accounting for 41.26%. Less important variables were effective steel pipe length, concrete design strength, solid waste content, and axial pressure ratio; 18.56, 15.38, 14.95, and 9.85%, respectively.
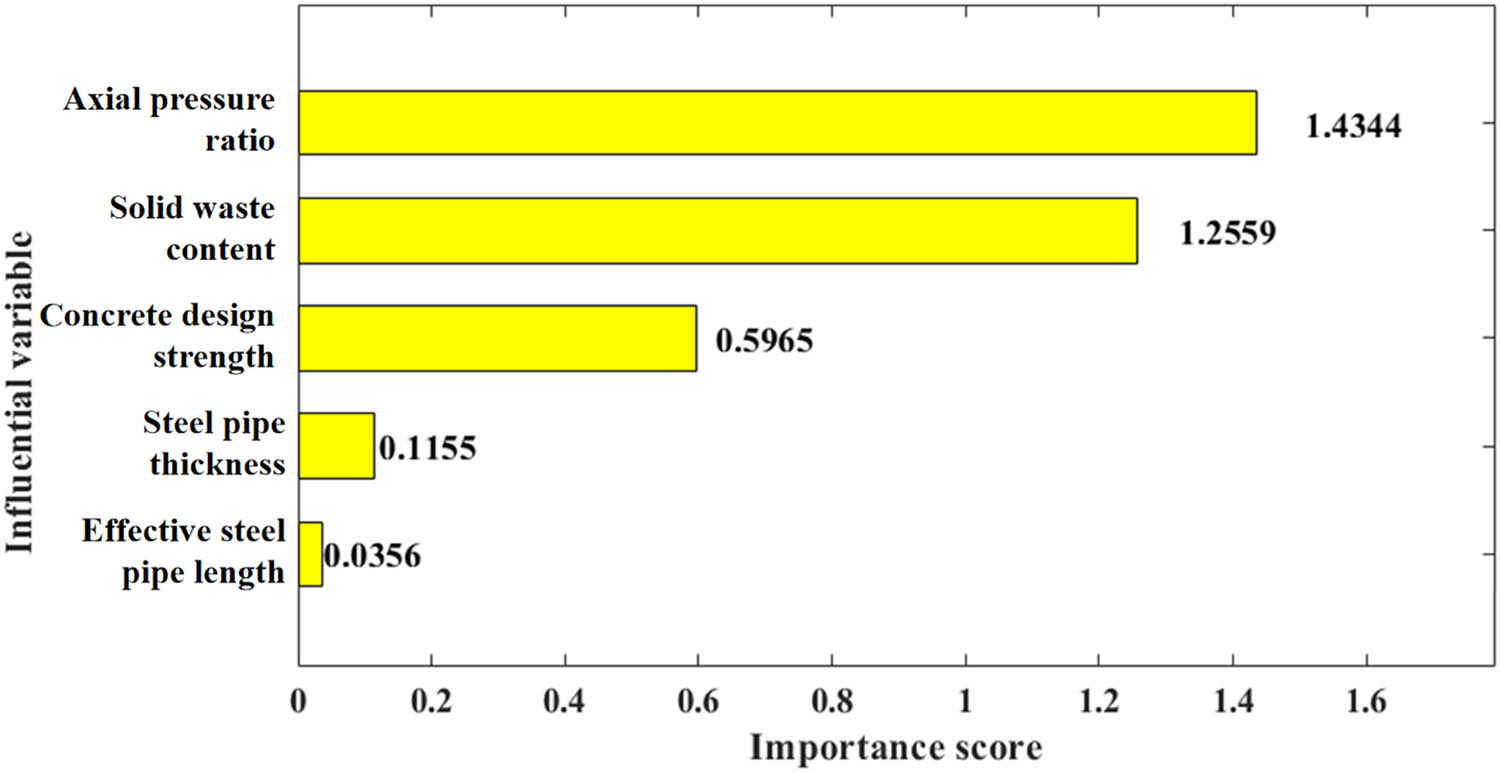
Variable importance analysis of FA–RF model for displacement ductility coefficient prediction.
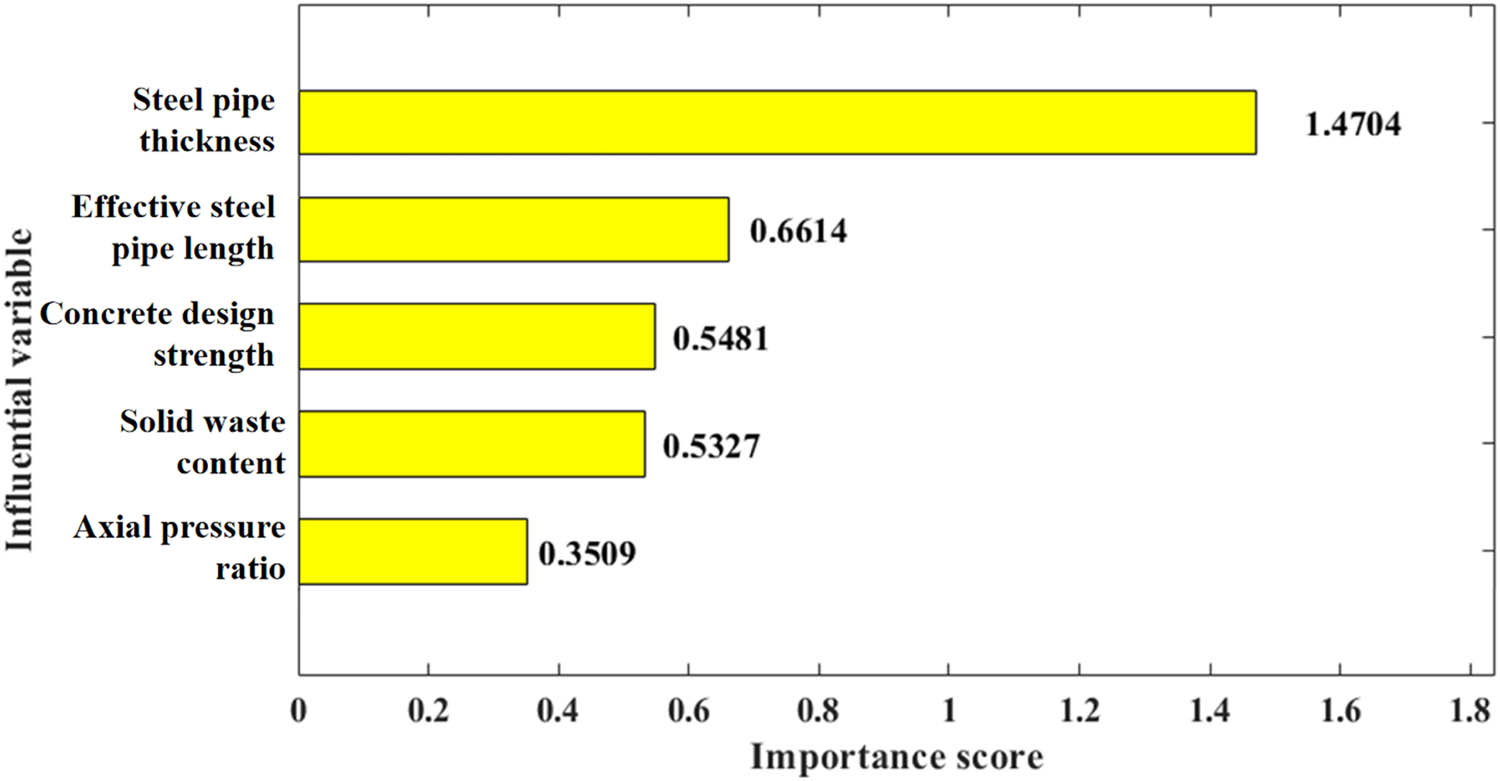
Variable importance analysis of FA–RF model for equivalent damping coefficient prediction.
6 Conclusion
This article presents a systematic study on the influence of parameters comprising slenderness ratio, axial compression ratio, and steel tube wall thickness on the seismic performance of 26 specimens. The main conclusions can be drawn as follows:
Recycled concrete-filled steel tube members have good hysteretic behavior, ductility, and energy dissipation capacity. According to the parameter sensitivity analysis, the slenderness ratio has the largest impact on the ductility of the members, while reducing the axial compression ratio and using thin-walled steel tubes can improve the ductility to a certain extent.
The skeleton curves and the stiffness degradation curves of all specimens have a similar development trend. Increasing the slenderness ratio, reducing the axial compression ratio, and reducing the wall thickness will weaken the peak horizontal bearing capacity of the members, but can effectively reduce their stiffness degradation rate.
In this article, an ML method for predicting the performance of recycled aggregate modified concrete-filled steel tubes is proposed. The predicted performance includes displacement ductility coefficient and equivalent damping coefficient. This method is based on the RF algorithm, and has higher prediction ability and reliability than other ML models.
Since it is time-consuming and expensive to obtain data, this study is limited by small datasets. In future work, more variables and more complex and larger datasets may be considered. The more types and quantities of data processed by the model, the better prediction and generalization ability.
-
Funding information: This study was funded by the Natural Science Foundation of Guangxi Province (2021GXNSFAA220045 and 2021GXNSFBA075014), China Postdoctoral Science Foundation (2021M690765), Systematic Project of Guangxi Key Laboratory of Disaster Prevention and Engineering Safety (2021ZDK007), National Natural Science Foundation of China (52108199), Guangxi Science and Technology Department (AD21238007), and the Science and Technology Planning Project of Guangzhou (202102080269).
-
Author contributions: Yunchao Tang: conceptualization and methodology. Zhonghe Liu and Junbo Sun: methodology and formal analysis. Yufei Wang and Dongxiao Wu: writing and formal analysis. Ming Zhu and Hexin Zhang: conceptualization, methodology, and revising. Ming Zhu and Zheng Chen: reviewing and editing. Xiangyu Wang: conceptualization and supervision.
-
Conflict of interest: Authors state no conflict of interest.
Appendix A
Table of ductility coefficient and equivalent viscous damping coefficient of each specimen
| Solid waste content | Concrete design strength fc (MPa) | Steel pipe thickness (mm) | Effective steel pipe length (mm) | Steel strength (MPa) | Axial pressure ratio | Displacement ductility coefficient μ | Equivalent viscous damping coefficient Z eq | Data sources |
|---|---|---|---|---|---|---|---|---|
| 0.50 | 29.9 | 6 | 1,120 | 235 | 0.2 | 9.5717 | 0.417 | The research group's previous experimental data |
| 0.50 | 29.9 | 6 | 1,120 | 235 | 0.4 | 9.4925 | 0.533 | |
| 0.50 | 35.7 | 8 | 1,000 | 235 | 0.2 | 5.13 | 0.441 | The research group's previous experimental data |
| 0.50 | 35.7 | 8 | 1,000 | 235 | 0.4 | 4.34 | 0.558 | |
| 0.50 | 35.7 | 8 | 1,000 | 235 | 0.6 | 4.28 | 0.53 | |
| 0.50 | 27.2 | 6 | 1,000 | 235 | 0.2 | 9.63 | 0.429 | The research group's previous finite element simulation data |
| 0.50 | 27.2 | 6 | 1,000 | 235 | 0.4 | 9.24 | 0.41 | |
| 0.50 | 27.2 | 6 | 1,000 | 235 | 0.6 | 8.11 | 0.42 | |
| 0.50 | 27.2 | 6 | 1,200 | 235 | 0.2 | 7.12 | 0.47 | |
| 0.50 | 27.2 | 6 | 1,200 | 235 | 0.4 | 6.78 | 0.469 | |
| 0.50 | 27.2 | 6 | 1,200 | 235 | 0.6 | 6.68 | 0.478 | |
| 0.50 | 27.2 | 6 | 1,400 | 235 | 0.2 | 5.45 | 0.453 | |
| 0.50 | 27.2 | 6 | 1,400 | 235 | 0.4 | 5.43 | 0.441 | |
| 0.50 | 27.2 | 6 | 1,400 | 235 | 0.6 | 5.28 | 0.468 | |
| 0.50 | 27.2 | 8 | 1,000 | 235 | 0.2 | 5.27 | 0.45 | |
| 0.50 | 27.2 | 8 | 1,000 | 235 | 0.4 | 5.46 | 0.463 | |
| 0.50 | 27.2 | 8 | 1,000 | 235 | 0.6 | 6.12 | 0.397 | |
| 0.50 | 27.2 | 8 | 1,200 | 235 | 0.2 | 5.08 | 0.431 | |
| 0.50 | 27.2 | 8 | 1,200 | 235 | 0.4 | 5.13 | 0.444 | |
| 0.50 | 27.2 | 8 | 1,200 | 235 | 0.6 | 5.02 | 0.43 | |
| 0.50 | 27.2 | 8 | 1,400 | 235 | 0.2 | 4.07 | 0.449 | |
| 0.50 | 27.2 | 8 | 1,400 | 235 | 0.4 | 4.03 | 0.444 | |
| 0.50 | 27.2 | 8 | 1,400 | 235 | 0.6 | 3.92 | 0.448 | |
| 0.50 | 27.2 | 10 | 1,000 | 235 | 0.2 | 4.56 | 0.442 | |
| 0.50 | 27.2 | 10 | 1,000 | 235 | 0.4 | 4.61 | 0.451 | |
| 0.50 | 27.2 | 10 | 1,000 | 235 | 0.6 | 4.63 | 0.443 | |
| 0.50 | 27.2 | 10 | 1,200 | 235 | 0.2 | 4.4 | 0.431 | |
| 0.50 | 27.2 | 10 | 1,200 | 235 | 0.4 | 4.44 | 0.416 | |
| 0.50 | 27.2 | 10 | 1,200 | 235 | 0.6 | 4.34 | 0.443 | |
| 0.50 | 27.2 | 10 | 1,400 | 235 | 0.2 | 3.9 | 0.428 | |
| 0.50 | 27.2 | 10 | 1,400 | 235 | 0.4 | 3.84 | 0.416 | |
| 0.50 | 27.2 | 10 | 1,400 | 235 | 0.6 | 3.75 | 0.421 | |
| 1.00 | 33.9 | 8 | 1,980 | 235 | 0.2 | 7.11 | 0.615 | Test data in this article |
| 1.00 | 33.9 | 8 | 1,980 | 235 | 0.4 | 6.12 | 0.601 | |
| 1.00 | 33.9 | 8 | 1,980 | 235 | 0.6 | 5.86 | 0.798 | |
| 1.00 | 36.3 | 10 | 1,980 | 235 | 0.2 | 6 | 0.491 | |
| 1.00 | 36.3 | 10 | 1,980 | 235 | 0.4 | 5.2 | 0.616 | |
| 1.00 | 36.3 | 10 | 1,980 | 235 | 0.6 | 4.78 | 0.784 | |
| 1.00 | 33.6 | 12 | 1,980 | 235 | 0.2 | 5.91 | 0.565 | |
| 1.00 | 33.6 | 12 | 1,980 | 235 | 0.4 | 5 | 0.743 | |
| 1.00 | 33.6 | 12 | 1,980 | 235 | 0.6 | 4.84 | 0.789 | |
| 1.00 | 34.9 | 8 | 1,480 | 235 | 0.6 | 3.54 | 0.879 | |
| 1.00 | 35.8 | 10 | 1,480 | 235 | 0.2 | 6.53 | 0.525 | |
| 1.00 | 35.8 | 10 | 1,480 | 235 | 0.4 | 5.79 | 0.679 | |
| 1.00 | 35.8 | 10 | 1,480 | 235 | 0.6 | 3.8 | 0.815 | |
| 1.00 | 35.8 | 12 | 1,480 | 235 | 0.6 | 3.91 | 0.712 | |
| 1.00 | 34.9 | 8 | 980 | 235 | 0.2 | 5.12 | 0.607 | |
| 1.00 | 34.9 | 8 | 980 | 235 | 0.4 | 5.89 | 0.703 | |
| 1.00 | 34.9 | 8 | 980 | 235 | 0.6 | 5.05 | 0.819 | |
| 1.00 | 33.9 | 10 | 980 | 235 | 0.2 | 5.88 | 0.485 | |
| 1.00 | 33.9 | 10 | 980 | 235 | 0.4 | 5.97 | 0.652 | |
| 1.00 | 33.9 | 10 | 980 | 235 | 0.6 | 5.41 | 0.732 | |
| 1.00 | 36.3 | 12 | 980 | 235 | 0.2 | 6.12 | 0.561 | |
| 1.00 | 36.3 | 12 | 980 | 235 | 0.4 | 5.19 | 0.627 | |
| 1.00 | 36.3 | 12 | 980 | 235 | 0.6 | 3.42 | 0.823 |
References
[1] Sun, J., Y. Wang, S. Liu, A. Dehghani, X. Xiang, J. Wei, et al. Mechanical, chemical and hydrothermal activation for waste glass reinforced cement. Construction and Building Materials, Vol. 301, 2021, id. 124361.10.1016/j.conbuildmat.2021.124361Suche in Google Scholar
[2] Xu, J., Z. Wu, H. Chen, L. Shao, X. Zhou, and S. Wang. Triaxial shear behavior of basalt fiber-reinforced loess based on digital image technology. KSCE Journal of Civil Engineering, Vol. 25, No. 10, 2021, pp. 3714–3726.10.1007/s12205-021-2034-1Suche in Google Scholar
[3] Bai, Y., D. C. Nardi, X. Zhou, R. A. Picon, and J. Florez-Lopez. A new comprehensive model of damage for flexural subassemblies prone to fatigue. Computers & Structures, Vol. 256, 2021, id. 106639.10.1016/j.compstruc.2021.106639Suche in Google Scholar
[4] Guo, Y., Y. Yang, Z. Kong, and J. He. Development of similar materials for liquid-solid coupling and its application in water outburst and mud outburst model test of deep tunnel. Geofluids, Vol. 2022, 2022. id. 8784398.10.1155/2022/8784398Suche in Google Scholar
[5] Li, W., Z. Luo, C. Wu, V. W. Tam, W. H. Duan, and S. P. Shah. Experimental and numerical studies on impact behaviors of recycled aggregate concrete-filled steel tube after exposure to elevated temperature. Materials & Design, Vol. 136, 2017, pp. 103–118.10.1016/j.matdes.2017.09.057Suche in Google Scholar
[6] Hasan, H. G. and T. Ekmekyapar. Bond-slip behaviour of concrete filled double skin steel tubular (CFDST) columns. Marine Structures, Vol. 79, 2021, id. 103061.10.1016/j.marstruc.2021.103061Suche in Google Scholar
[7] Yang, Y., W. Feng, J. Qiu, S. Guan, and Y. Tang. Study of shrinkage compensation and feasibility of engineering applications of geopolymer concrete. Journal of Materials in Civil Engineering, Vol. 34, No. 5, 2022, id. 04022042.10.1061/(ASCE)MT.1943-5533.0004177Suche in Google Scholar
[8] Wang, X., F. Fan, and J. Lai. Strength behavior of circular concrete-filled steel tube stub columns under axial compression: A review. Construction and Building Materials, Vol. 322, 2022, id. 126144.10.1016/j.conbuildmat.2021.126144Suche in Google Scholar
[9] Wei, J., Z. Xie, W. Zhang, X. Luo, Y. Yang, and B. Chen. Experimental study on circular steel tube-confined reinforced UHPC columns under axial loading. Engineering Structures, Vol. 230, 2021, id. 111599.10.1016/j.engstruct.2020.111599Suche in Google Scholar
[10] Shi, T., Y. Liu, Y. Zhang, Y. Lan, Q. Zhao, Y. Zhao, et al. Calcined attapulgite clay as supplementary cementing material: thermal treatment, hydration activity and mechanical properties. International Journal of Concrete Structures and Materials, Vol. 16, No. 1, 2022, id. 10.10.1186/s40069-022-00499-8Suche in Google Scholar
[11] Huang, H., M. Huang, W. Zhang, S. Pospisil, and T. Wu. Experimental investigation on rehabilitation of corroded RC columns with BSP and HPFL under combined loadings. Journal of Structural Engineering, Vol. 146, No. 8, 2020, id. 04020157.10.1061/(ASCE)ST.1943-541X.0002725Suche in Google Scholar
[12] Huang, H., M. Huang, W. Zhang, and S. Yang. Experimental study of predamaged columns strengthened by HPFL and BSP under combined load cases. Structure and Infrastructure Engineering, Vol. 17, No. 9, 2021, pp. 1210–1227.10.1080/15732479.2020.1801768Suche in Google Scholar
[13] Yin, F., S. D. Xue, W. L. Cao, H. Y. Dong, and H. P. Wu. Experimental and analytical study of seismic behavior of special-shaped multicell composite concrete-filled steel tube columns. Journal of Structural Engineering, Vol. 146, No. 1, 2020, id. 04019170.10.1061/(ASCE)ST.1943-541X.0002442Suche in Google Scholar
[14] Wang, Y. H., Y. Y. Wang, C. Hou, R. Deng, Y. S. Lan, W. Luo, et al. Torsional capacity of concrete-filled steel tube columns circumferentially confined by CFRP. Journal of Constructional Steel Research, Vol. 175, 2020, id. 106320.10.1016/j.jcsr.2020.106320Suche in Google Scholar
[15] Li, B., S. Dai, Y. Zhan, J. Xu, X. Guo, Y. Yang, et al. Strength criterion of recycled aggregate concrete under triaxial compression: Model calibration. Construction and Building Materials, Vol. 320, 2022, id. 126201.10.1016/j.conbuildmat.2021.126201Suche in Google Scholar
[16] Xu, J. J., W. G. Chen, C. Demartino, T. Y. Xie, Y. Yu, C. F. Fang, et al. A Bayesian model updating approach applied to mechanical properties of recycled aggregate concrete under compressive uniaxial or triaxial loading. Construction and Building Materials, Vol. 301, 2021, id. 124274.10.1016/j.conbuildmat.2021.124274Suche in Google Scholar
[17] Feng, W., B. Chen, Y. Tang, W. Wei, W. He, and Y. Yang. Structural efects and real strain‑rate efects on compressive strength of sustainable concrete with crumb rubber in split Hopkinson pressure bar tests. Archives of Civil and Mechanical Engineering, Vol. 22, 2022, id. 136.10.1007/s43452-022-00457-xSuche in Google Scholar
[18] Hu, H.S., L. Xu, Z. X. Guo, and B. M. Shahrooz. Behavior of eccentrically loaded square spiral-confined high-strength concrete-filled steel tube columns. Engineering Structures, Vol. 216, 2020, id. 110743.10.1016/j.engstruct.2020.110743Suche in Google Scholar
[19] Tang, Y., W. Feng, Z. Chen, Y. Nong, S. Guan, and J. Sun. Fracture behavior of a sustainable material: Recycled concrete with waste crumb rubber subjected to elevated temperatures. Journal of Cleaner Production, Vol. 318, 2021, id. 128553.10.1016/j.jclepro.2021.128553Suche in Google Scholar
[20] Yunchao, T., C. Zheng, F. Wanhui, N. Yumei, L. Cong, and C. Jieming. Combined effects of nano-silica and silica fume on the mechanical behavior of recycled aggregate concrete. Nanotechnology Reviews, Vol. 10, No. 1, 2021, pp. 819–838.10.1515/ntrev-2021-0058Suche in Google Scholar
[21] Xu, J. J., Z. P. Chen, X. Y. Zhao, C. Demartino, T. Ozbakkaloglu, and J. Y. Xue. Seismic performance of circular recycled aggregate concrete-filled steel tubular columns: FEM modelling and sensitivity analysis. Thin-Walled Structures, Vol. 141, 2019, pp. 509–525.10.1016/j.tws.2019.04.016Suche in Google Scholar
[22] Tang, Y., M. Zhu, Z. Chen, C. Wu, B. Chen, C. Li, et al. Seismic performance evaluation of recycled aggregate concrete-filled steel tubular columns with field strain detected via a novel mark-free vision method. Structures, Vol. 37, 2022, pp. 426–441.10.1016/j.istruc.2021.12.055Suche in Google Scholar
[23] Nguyen, M. S. T., D. K. Thai, and S. E. Kim. Predicting the axial compressive capacity of circular concrete filled steel tube columns using an artificial neural network. Steel and Composite Structures, An International Journal, Vol. 35, No. 3, 2020, pp. 415–437.Suche in Google Scholar
[24] Teves-Costa, P., C. S. Oliveira, and M. L. Senos. Effects of activated carbon on liquefaction resistance of calcareous sand treated with microbially induced calcium carbonate precipitation. Soil Dynamics and Earthquake Engineering, Vol. 161, 2022, id. 107419.10.1016/j.soildyn.2022.107419Suche in Google Scholar
[25] Sun, J., L. Yue, K. Xu, R. He, X. Yao, M. Chen, et al. Multi-objective optimisation for mortar containing activated waste glass powder. Journal of Materials Research and Technology, Vol. 18, 2022, pp. 1391–1411.10.1016/j.jmrt.2022.02.123Suche in Google Scholar
[26] Zhang, R., C. Wu, A. T. Goh, T. Böhlke, and W. Zhang. Estimation of diaphragm wall deflections for deep braced excavation in anisotropic clays using ensemble learning. Geoscience Frontiers, Vol. 12, No. 1, 2021, pp. 365–373.10.1016/j.gsf.2020.03.003Suche in Google Scholar
[27] Hu, Z., T. Shi, M. Cen, J. Wang, X. Zhao, C. Zeng, et al. Research progress on lunar and Martian concrete. Construction and Building Materials, Vol. 343, 2022, id. 128117.10.1016/j.conbuildmat.2022.128117Suche in Google Scholar
[28] Tang, Y., W. Feng, W. Feng, J. Chen, D. Bao, and L. Li. Prediction of thermo-mechanical properties of rubber-modified recycled aggregate concrete. Construction and Building Materials, Vol. 318, 2022, id. 125970.10.1016/j.conbuildmat.2021.125970Suche in Google Scholar
[29] Sun, Y., J. Zhang, G. Li, Y. Wang, J. Sun, and C. Jiang. Optimized neural network using beetle antennae search for predicting the unconfined compressive strength of jet grouting coalcretes. International Journal for Numerical and Analytical Methods in Geomechanics, Vol. 43, No. 4, 2019, pp. 801–813.10.1002/nag.2891Suche in Google Scholar
[30] Zhang, G., C. Chen, J. Sun, K. Li, F. Xiao, Y. Wang, et al. Mixture optimisation for cement-soil mixtures with embedded GFRP tendons. Journal of Materials Research and Technology, Vol. 18, 2022, pp. 611–628.10.1016/j.jmrt.2022.02.076Suche in Google Scholar
[31] Cheng, H., L. Sun, Y. Wang, and X. Chen. Effects of actual loading waveforms on the fatigue behaviours of asphalt mixtures. International Journal of Fatigue, Vol. 151, 2021, id. 106386.10.1016/j.ijfatigue.2021.106386Suche in Google Scholar
[32] Chen, Z., L. Mo, C. Song, and Y. Zhang. Specification for design of proportion of ordinary concrete. China Architecture & Building Press, Beijing, 2011.Suche in Google Scholar
[33] Technical specification for application of recycled concrete, Tongji university, Shanghai, 2007.Suche in Google Scholar
[34] Standard for test methods of mechanical properties of ordinary concrete, China Architecture & Building Press, Beijing, 2011.Suche in Google Scholar
[35] Tang, Y. C., L. J. Li, W. X. Feng, F. Liu, and M. Zhu. Study of seismic behavior of recycled aggregate concrete-filled steel tubular columns. Journal of Constructional Steel Research, Vol. 148, 2018, pp. 1–15.10.1016/j.jcsr.2018.04.031Suche in Google Scholar
[36] Açikgenç, M., M. Ulaş, and K. E. Alyamaç. Using an artificial neural network to predict mix compositions of steel fiber-reinforced concrete. Arabian Journal for Science and Engineering, Vol. 40, No. 2, 2015, pp. 407–419.10.1007/s13369-014-1549-xSuche in Google Scholar
[37] Shen, Z. Y., M. Lei, Y. Q. Li, Z. Y. Lin, and J. H. Luo. Experimental study on seismic behavior of concrete-filled L-shaped steel tube columns. Advances in Structural Engineering, Vol. 16, No. 7, 2013, pp. 1235–1247.10.1260/1369-4332.16.7.1235Suche in Google Scholar
[38] Chen, Z., J. Xu, Y. Chen, and E. M. Lui. Recycling and reuse of construction and demolition waste in concrete-filled steel tubes: A review. Construction and Building Materials, Vol. 126, 2016, pp. 641–660.10.1016/j.conbuildmat.2016.09.063Suche in Google Scholar
[39] Breiman, L. Bagging predictors. Machine Learning, Vol. 24, No. 2, 1996, pp. 123–140.10.1007/BF00058655Suche in Google Scholar
[40] Wu, C., X. Wang, M. Chen, and M. J. Kim. Differential received signal strength based RFID positioning for construction equipment tracking. Advanced Engineering Informatics, Vol. 42, 2019, id. 100960.10.1016/j.aei.2019.100960Suche in Google Scholar
[41] Yang, X.-S. Firefly algorithms for multimodal optimization. International symposium on stochastic algorithms, Springer, 2009.10.1007/978-3-642-04944-6_14Suche in Google Scholar
[42] Sun, J., Y. Tang, J. Wang, X. Wang, J. Wang, Z. Yu, et al. A multi-objective optimisation approach for activity excitation of waste glass mortar. Journal of Materials Research and Technology, Vol. 17, 2022, pp. 2280–2304.10.1016/j.jmrt.2022.01.066Suche in Google Scholar
[43] Cortez, P. and M. J. Embrechts. Opening black box data mining models using sensitivity analysis. 2011 IEEE Symposium on Computational Intelligence and Data Mining (CIDM), IEEE, 2011.10.1109/CIDM.2011.5949423Suche in Google Scholar
[44] Cortez, P. and M. J. Embrechts. Using sensitivity analysis and visualization techniques to open black box data mining models. Information Sciences, Vol. 225, 2013, pp. 1–17.10.1016/j.ins.2012.10.039Suche in Google Scholar
[45] Code for seismic design of buildings, China Architecture & Building Press, Beijing, 2010.Suche in Google Scholar
[46] Tang, Y. C., L. J. Li, W. X. Feng, F. Liu, and B. Liao. Seismic performance of recycled aggregate concrete-filled steel tube columns. Journal of Constructional Steel Research, Vol. 133, 2017, pp. 112–124.10.1016/j.jcsr.2017.02.006Suche in Google Scholar
[47] Zhang, J., Y. Huang, G. Ma, and B. Nener. Mixture optimization for environmental, economical and mechanical objectives in silica fume concrete: A novel frame-work based on machine learning and a new meta-heuristic algorithm. Resources, Conservation and Recycling, Vol. 167, 2021, id. 105395.10.1016/j.resconrec.2021.105395Suche in Google Scholar
© 2022 Yunchao Tang et al., published by De Gruyter
This work is licensed under the Creative Commons Attribution 4.0 International License.
Artikel in diesem Heft
- Review Articles
- State of the art, challenges, and emerging trends: Geopolymer composite reinforced by dispersed steel fibers
- A review on the properties of concrete reinforced with recycled steel fiber from waste tires
- Copper ternary oxides as photocathodes for solar-driven CO2 reduction
- Properties of fresh and hardened self-compacting concrete incorporating rice husk ash: A review
- Basic mechanical and fatigue properties of rubber materials and components for railway vehicles: A literature survey
- Research progress on durability of marine concrete under the combined action of Cl− erosion, carbonation, and dry–wet cycles
- Delivery systems in nanocosmeceuticals
- Study on the preparation process and sintering performance of doped nano-silver paste
- Analysis of the interactions between nonoxide reinforcements and Al–Si–Cu–Mg matrices
- Research Articles
- Study on the influence of structural form and parameters on vibration characteristics of typical ship structures
- Deterioration characteristics of recycled aggregate concrete subjected to coupling effect with salt and frost
- Novel approach to improve shale stability using super-amphiphobic nanoscale materials in water-based drilling fluids and its field application
- Research on the low-frequency multiline spectrum vibration control of offshore platforms
- Multiple wide band gaps in a convex-like holey phononic crystal strip
- Response analysis and optimization of the air spring with epistemic uncertainties
- Molecular dynamics of C–S–H production in graphene oxide environment
- Residual stress relief mechanisms of 2219 Al–Cu alloy by thermal stress relief method
- Characteristics and microstructures of the GFRP waste powder/GGBS-based geopolymer paste and concrete
- Development and performance evaluation of a novel environmentally friendly adsorbent for waste water-based drilling fluids
- Determination of shear stresses in the measurement area of a modified wood sample
- Influence of ettringite on the crack self-repairing of cement-based materials in a hydraulic environment
- Multiple load recognition and fatigue assessment on longitudinal stop of railway freight car
- Synthesis and characterization of nano-SiO2@octadecylbisimidazoline quaternary ammonium salt used as acidizing corrosion inhibitor
- Perforated steel for realizing extraordinary ductility under compression: Testing and finite element modeling
- The influence of oiled fiber, freeze-thawing cycle, and sulfate attack on strain hardening cement-based composites
- Perforated steel block of realizing large ductility under compression: Parametric study and stress–strain modeling
- Study on dynamic viscoelastic constitutive model of nonwater reacted polyurethane grouting materials based on DMA
- Mechanical behavior and mechanism investigation on the optimized and novel bio-inspired nonpneumatic composite tires
- Effect of cooling rate on the microstructure and thermal expansion properties of Al–Mn–Fe alloy
- Research on process optimization and rapid prediction method of thermal vibration stress relief for 2219 aluminum alloy rings
- Failure prevention of seafloor composite pipelines using enhanced strain-based design
- Deterioration of concrete under the coupling action of freeze–thaw cycles and salt solution erosion
- Creep rupture behavior of 2.25Cr1Mo0.25V steel and weld for hydrogenation reactors under different stress levels
- Statistical damage constitutive model for the two-component foaming polymer grouting material
- Nano-structural and nano-constraint behavior of mortar containing silica aggregates
- Influence of recycled clay brick aggregate on the mechanical properties of concrete
- Effect of LDH on the dissolution and adsorption behaviors of sulfate in Portland cement early hydration process
- Comparison of properties of colorless and transparent polyimide films using various diamine monomers
- Study in the parameter influence on underwater acoustic radiation characteristics of cylindrical shells
- Experimental study on basic mechanical properties of recycled steel fiber reinforced concrete
- Dynamic characteristic analysis of acoustic black hole in typical raft structure
- A semi-analytical method for dynamic analysis of a rectangular plate with general boundary conditions based on FSDT
- Research on modification of mechanical properties of recycled aggregate concrete by replacing sand with graphite tailings
- Dynamic response of Voronoi structures with gradient perpendicular to the impact direction
- Deposition mechanisms and characteristics of nano-modified multimodal Cr3C2–NiCr coatings sprayed by HVOF
- Effect of excitation type on vibration characteristics of typical ship grillage structure
- Study on the nanoscale mechanical properties of graphene oxide–enhanced shear resisting cement
- Experimental investigation on static compressive toughness of steel fiber rubber concrete
- Study on the stress field concentration at the tip of elliptical cracks
- Corrosion resistance of 6061-T6 aluminium alloy and its feasibility of near-surface reinforcements in concrete structure
- Effect of the synthesis method on the MnCo2O4 towards the photocatalytic production of H2
- Experimental study of the shear strength criterion of rock structural plane based on three-dimensional surface description
- Evaluation of wear and corrosion properties of FSWed aluminum alloy plates of AA2020-T4 with heat treatment under different aging periods
- Thermal–mechanical coupling deformation difference analysis for the flexspline of a harmonic drive
- Frost resistance of fiber-reinforced self-compacting recycled concrete
- High-temperature treated TiO2 modified with 3-aminopropyltriethoxysilane as photoactive nanomaterials
- Effect of nano Al2O3 particles on the mechanical and wear properties of Al/Al2O3 composites manufactured via ARB
- Co3O4 nanoparticles embedded in electrospun carbon nanofibers as free-standing nanocomposite electrodes as highly sensitive enzyme-free glucose biosensors
- Effect of freeze–thaw cycles on deformation properties of deep foundation pit supported by pile-anchor in Harbin
- Temperature-porosity-dependent elastic modulus model for metallic materials
- Effect of diffusion on interfacial properties of polyurethane-modified asphalt–aggregate using molecular dynamic simulation
- Experimental study on comprehensive improvement of shear strength and erosion resistance of yellow mud in Qiang Village
- A novel method for low-cost and rapid preparation of nanoporous phenolic aerogels and its performance regulation mechanism
- In situ bow reduction during sublimation growth of cubic silicon carbide
- Adhesion behaviour of 3D printed polyamide–carbon fibre composite filament
- An experimental investigation and machine learning-based prediction for seismic performance of steel tubular column filled with recycled aggregate concrete
- Effects of rare earth metals on microstructure, mechanical properties, and pitting corrosion of 27% Cr hyper duplex stainless steel
- Application research of acoustic black hole in floating raft vibration isolation system
- Multi-objective parametric optimization on the EDM machining of hybrid SiCp/Grp/aluminum nanocomposites using Non-dominating Sorting Genetic Algorithm (NSGA-II): Fabrication and microstructural characterizations
- Estimating of cutting force and surface roughness in turning of GFRP composites with different orientation angles using artificial neural network
- Displacement recovery and energy dissipation of crimped NiTi SMA fibers during cyclic pullout tests