Failure prevention of seafloor composite pipelines using enhanced strain-based design
-
Vul Thang
 ,
David Hui
,
David Hui

Abstract
Steel pipes are widely used in offshore structures and buried seafloor pipelines. Buried single-wall pipelines or piles of fixed offshore platforms crossing the earthquake fault can experience very large displacement, which could cause considerable damages or failures to the pipes. The elevated strains induced in pipelines from welding connection between the pipes also can drastically reduce the pipe’s performance. Therefore, to prevent these types of damages and failures, this research used an enhanced strain-based design method along with finite element analysis, developed bonded and unbonded double-wall composite pipes, which were in replacement of the single-wall ones, and studied the effects of welding on the double-wall composite pipeline in terms of wrinkles, ovalization, stresses, and strain. Here, the double-wall annulus of the pipelines was grouted with polymer. Extensive experiments were performed with displacement loads being applied to the pipelines in clay and in air and the results were analyzed. It was found that using an enhanced strain-based design method, failures in the pipelines could be significantly reduced or possibly even eliminated. This work would also potentially lead to a new area of research in the oil and gas industries since the elevated strains induced in pipelines due to weld could lead to several modes of failure. In addition, this research found some significant impacts in terms of safety due to the bond between steel and polymer and weld imperfection in the pipelines.
1 Introduction
Offshore oil and gas accidents can be costly. There were several accidents and failures in the past. In 2021, there was an offshore pipeline burst in the Gulf of Mexico that caused flame boiling in the water [1]. The same or similar accident can happen anywhere in the world. Although the fire was put out successfully after a few hours, the oil leak from the pipeline to the sea was still a big work to clean out and this process can be expensive. One of the biggest issues with pipeline failure is due to the pipe being a single-wall pipeline. Figure 1 illustrates schematically a seafloor pipeline crossing an earthquake fault plane. The figure also shows the failure mode of a single-wall pipeline. This research mitigates or possibly eliminates failure like this by using double-wall steel–polymer–steel (SPS) composite pipeline. The bond between the polymer and steel, and the weld connecting the pipelines can cause a significant effect on the pipe structural integrity.

Schematic diagram of a single-wall seafloor pipeline failure at earthquake fault plane.
Using double-wall composite pipe with the annulus of the pipe grouted than single-wall pipe may have several advantages in seafloor pipeline. Cement-filled grout in concentric tubular has been used in oilwell construction for a century or so ago. However, in high-strain applications, debonding between cement and the steel wall has been an issue, and cement grout could not be counted in the overall integrity of the structure to improve the local buckling effect. Thang et al. [2] led the research in finding improvement in the bond between steel and cement grout, by introducing studies on the interface between steel and cement.
Marshall [3] introduced polymer grout double-wall composite pipe as shown in Figure 2. The polymer that is strong adhesive material claims a perfect bond between steel and the polymer grout. Thang et al. [4] studied the effect of polymer grout composite pipe in buried seafloor pipeline crossing a fault, using the finite element (FE) analysis method. They studied single-wall and double-wall pipes crossing a fault plane. They compared FE analysis results of single-wall pipes against the available literature data and found matching results.
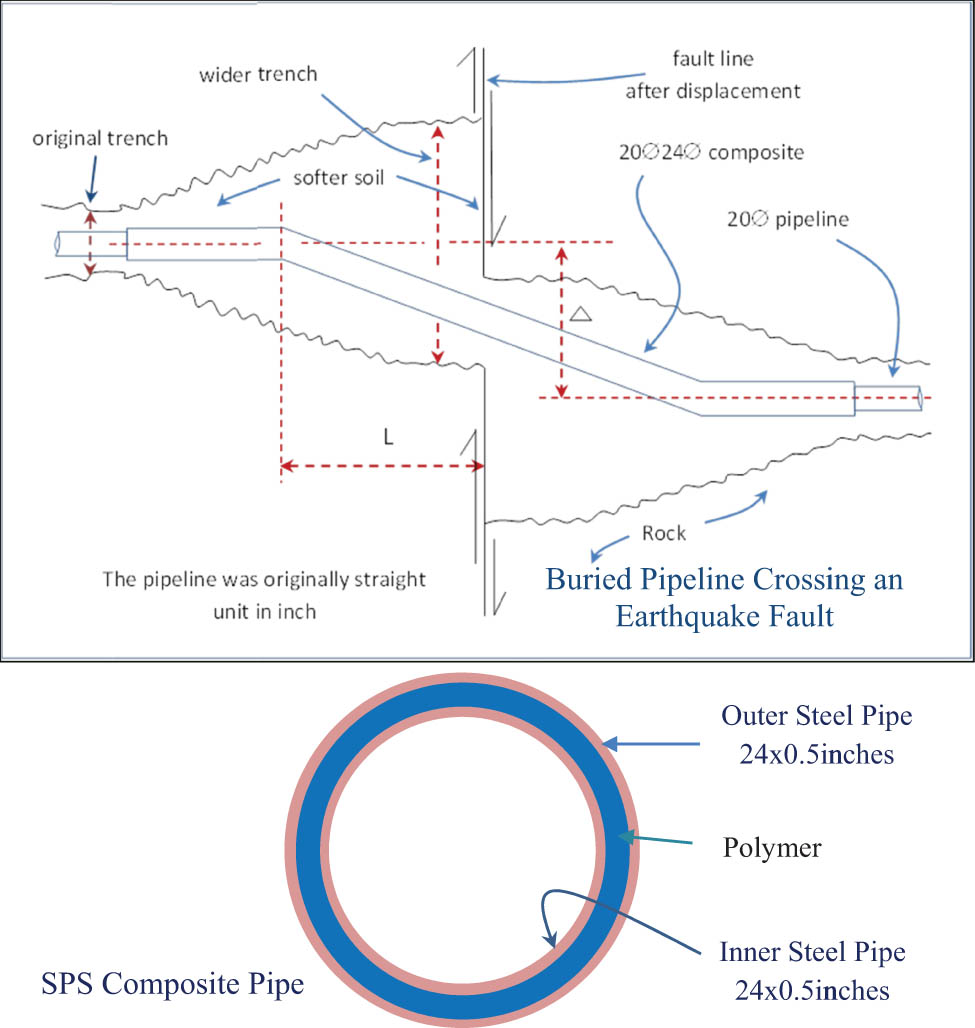
Buried pipeline crossing earthquake fault plane and the section view of the pipeline.
The present research further investigates unbonded and bonded polymer and steel, different stiffness of polymer, weld geometric imperfections, etc. In this research, the bond between steel and polymer interfaces is assumed perfectly bonded for the “bonded” interface. For the unbonded SPS double-wall composite pipe, there is no bond between the steel and polymer. The imperfection due to the weld can cause a significant effect on the capacity of the composite pipeline and hence this needs special attention. The imperfection of the pipe in this research means when two pipes are connected by welding the pipes may not be connected perfectly as some of the pipes may experience slight ovality due to transportation or storage or other forms. Hence, the perfect connection between the two pipes in the field may not be always possible. In addition, there may be human’s workmanship or other factors that may cause the poor connection between the two pipes. Hence, it is almost impossible to assume that two pipes can be connected perfectly. Therefore, the imperfection of the pipe due to weld needs to be considered. This imperfection in the pipe can cause elevated strain, uneven strain, and stress distribution in the pipe, and hence, the imperfection effect on the pipeline cannot be ignored.
The FE analysis of four points bending in the air will enable future verification with physical experiments. FE analysis study in soft clay includes verification against the laterally loaded single-wall pile in clay. The FE analysis results using the Cap Plasticity model and Marshall [3] rigid-plastic model methods were then compared against tests performed by Matlock [5] for benchmark studies. The FE analyses were performed on the single- and double-wall pipes in air and in clay. The results of stresses and strains in the pipe, ovality, diameter reduction, displacements, etc., were observed, and they were designed as per the industry acceptances.
2 Literature review
2.1 Welding misalignment
Imperfection in pipe connection has been studied by several researchers. Weld misalignment is a major concern in pipe connection as it can significantly affect the steel pipe’s overall structural integrity. Particularly, in fatigue analysis, it can significantly amplify the stress concentration factor, and hence, it can severely impact the fatigue lives. Marshall and Thang [6] studied the welding effect and hot spot stress on the tubular welded connection. Zhao et al. [7] studied weld misalignments, such as weld misalignment with equal thicknesses and unequal diameter, and weld misalignment with unequal thicknesses and aligned inside surface. They used a centerline offset (e) of 0.15 times the thickness of the pipe. The equal thickness and unequal diameter connection with T/8 in Figure 3 is used to connect the pipes in this research. T/8 centerline offset weld is also recommended by API 579-1/ASME FFS-1 [8].

Tubular weld misalignment with weld offset.
2.2 Wrinkling in the tubular pipe
Wrinkles are issues commonly found in single-wall pipeline. They can reduce the pipe’s opening diameter and, hence, this can prevent pipe services, such as pigging. In addition, the wrinkles can cause larger strain in the pipe. Papadaki et al. [9] studied and performed experimental work on the imperfect single-wall pipe and they found wrinkles and bucking failures on the tubular beam test. Arjomandi and Taheri [10] also studied a sandwich with polymer grouted for deep water on the effect of polymer stiffness to steel’s stiffness ratio of the composite pipe using FE analysis and found that very soft polymer does not help solve the wrinkling effect in the steel. Figure 4 shows the predicted single wall pipeline failure mode - buckling and wrinkling after the pipe experience large deflection at an earthquake fault zone. Uckan et al. [11] also studied a single-wall pipeline crossing an earthquake fault. They performed an FE analysis and observed the strains at different fault movements in the pipe and simulated analysis for the like of the 1999 Kocaeli earthquake in Turkey. This failure in the single-wall pipeline is expected anywhere where there are earthquakes and also perhaps landslides. Failure like this is highly undesirable as it can cause further failures such as fracture and leakage of the pipeline and it can be disastrous especially if the pipe transports oil or gas. Hence, this research article was conducted to possibly prevent such failure. For example, this research article introduces SPS composite pipe to improve or prevent issues like this.
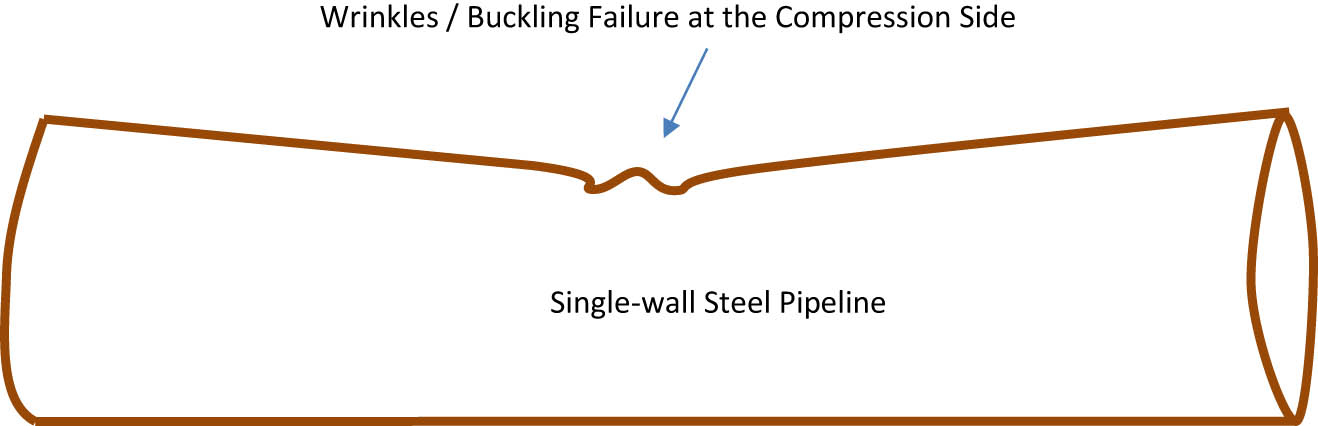
Predicted buckling and wrinkling of a single-wall pipeline at an earthquake fault crossing.
2.3 Pipe ovalization
There are various industry standards for pipe ovalization limits so that services, such as pigging, are possible. In addition, ovalization can cause large strain in plastic, which can eventually cause a fracture. Large out-of-roundness can also cause issues with girth welding. API RP 1111 [12] gives ovality, δ, as:
where D max is the maximum diameter at any given cross-section and D min is the minimum diameter at any given cross-section.
API Specification 5L [13] specified that out-of-roundness for pipe except the end is 2% and pipe end is 1.5% for pipe diameter 50.8 cm (20 in.). The ovality issue occurs within the pipe, not the end. Thus, the larger ovality limit of 2% is applicable in this research. The ovality limit stated in DNV-OS-F101 is 3% [14]. Liu et al. [15] gathered ovality limits and acceptance ranges by different industry codes listed in Table 1.
Single-wall pipe ovality limit [15]
| Criteria | Ovalization limit (%) |
|---|---|
| CSA-Z662-07 APP.C | 3.0 (6.0)a |
| DNV-OS-F101 (2000) | 3.0 |
| API 1111-1999 | 5.5–6.2 |
| Murray et al. (Murray and Bilston 1992) | 4.3–6.5b |
aNumber in brackets indicated the upper bound of behavior if it can be demonstrated that the behavior does not affect pipeline operation or maintenance or promote failure.
bOvality that produces the yield level hoop stresses in the pipe, assuming a yield strength of 480 MPa and a wall thickness of 10 mm.
These information and limits will be applied in the study.
2.4 Strain limit
Normal strain, ε, under axial loading by Beer et al. [16] is given by:
where Δl is the deformation and L is the length. Marshall [3] stated that in tubes that are not subjected to elastic local buckling (D/t < 60), the critical strain ε cr may be estimated as
where t is the thickness and D is the diameter of the tube.
For the pipe-in-pipe deep water flowlines, greater thickness, higher strength steel (up to 490 MPa), and lower diameter/thickness ratio conspire to make tensile fracture governed. Here, biaxial stress and softened heat-affected zones exacerbate the problem of strain-based design [17]. The strain limit of 2% is suggested [12,14,18]. Liu et al. [15] suggested a strain limit of 2% for the inner flow line and up to 4% for the outer pipe. These strain limits will be used in this pipeline study.
Wang et al. [19] performed experimental and numerical approach strain measurement on curvature-based pipes using the fiber Bragg grating sensor method and developed a pipe strain measurement equation:
where h c is the diameter of the pipe and ϕ(x) is the curvature. Their three different pipes’ experimental deflection results were overall reasonably agreeable with the theoretical results.
2.5 Soft clay foundation
Reese and Impe [20] stated that soft clay is less than 47.9 kPa (1,000 psf) with a strain value of 0.02, and a medium clay is between 47.9 kPa (1,000 psf) and 95.8 kPa (2,000 psf) with a strain value of 0.01. Reese et al. [21] stated that soft clay is between 12.0 kPa (250 psf) and 23.9 kPa (500 psf) with a strain value of 0.02 and medium clay is between 23.9 kPa (500 psf) and 47.9 kPa (1,000 psf) with a strain value of 0.01. Meyer and Reese [22] recommended strain values for different types of clay, which are shown in Table 2.
Recommended values for ε 50
| Consistency of clay (psf) | Undrained shear strength (kPa) | ε 50 (%) |
|---|---|---|
| 250–500 | >12 | 2 |
| 500–1,000 | 12–24 | 1 |
| 1,000–2,000 | 24–48 | 0.7 |
| 2,000–4,000 | 48–96 | 0.5 |
| 4,000–8,000 | 96–192 | 0.4 |
| <92 |
Matlock [5] stated that for most clays E c/c fall between 50 and 200 and ε c may be assumed between 0.005 and 0.02. E c is the secant modulus of elasticity of the clay, and c is the cohesion of the clay. Matlock also stated that smaller ε c are applicable to brittle or sensitive clays and the larger to disturbed or remolded soil or unconsolidated sediments, and an intermediate value of 0.01 is probably satisfactory for most purposes. In this research, soft clay was used for the laterally loaded pile analysis and verification with experimental results. Medium clay was used for the actual SPS double-wall pipe design and analysis.
2.6 FE analysis
Abaqus 6.14 [23] was used to perform FE analysis. Helwany [24] provided several examples to perform FE analysis, especially for laterally loaded pipe or pile in clay. The laterally loaded pipe in the clay experiment performed by Matlock [5] was used for FE analysis verification. After performing the benchmark studies, further FE analyses were performed to conduct the research.
3 Results and analysis
FE analyses were performed in this section. First, the verification exercises were performed for a single-wall pipe in soft clay. The analysis results were compared with field test results. Upon the analysis verification, the SPS double-wall composite pipe analysis in clay was performed and the results were analyzed. Then, a four-point beam bending FE analysis on an imperfect single-wall pipe in the air was performed. The failure modes such as stress, strain, and ovality were observed. Simply supported four-point bending of SPS double-wall composite pipe with weld was performed. The ovality was limited at about 3% and 6% and the analysis results were observed. Finally, the unbonded SPS double-wall composite pipe with weld bending analysis in the air was performed and the failure of the beam was observed. Critical results were documented.
3.1 FE analysis verification
Cap Plasticity [23] and Marshall’s method of plastic clay model [3] were used in verifying the experimental test result. Figure 5 shows a model of pipe embedded in a block of clay and laterally loaded displacement was applied at the top end of the pipe. The mesh and boundary conditions are also shown in the figure. C3D8R 8-node linear brick elements were used. There are 16 elements around the pile circumference and also a mesh size of 8 cm along the pile’s axis. The mesh size around the pile or at the center of the clay’s block was 25 cm and further regions are coarser. Meshes are finer in areas where the pile is and the path where it will be displaced because they are the regions of interest. Having finer meshes just around the pile region is sufficient to accurately capture the analysis results and having coarser meshes in other regions saves the computation cost. The base of the clay block was pinned, and the sides were laterally restrained. The top surface was restrained against the Y direction so that the clay cannot cross and hence the fault plane was slick. This represents the earthquake fault plane.

Pipe embedded in clay model and the boundary conditions.
3.1.1 Material properties
For Matlock’s clay properties, the strain value for very soft clay used was 0.02. The strain values of the clay for Marshall’s plastic model were taken as 0.005 for ε 50 and 0.015 for 3ε 50. The compressive strength of the clay was the same for both Marshall and Matlock and it was 28.8 kPa. Figure 6 shows the plastic stress–strain curve used for both the steel pipes and the clay model.

Stress–strain curves used for the plastic clay model and the steel.
The input data for Cap Plasticity in the Abaqus clay model are shown in Table 3, and Table 4 shows the Cap Hardening values.
Clay parameter input for cap plasticity model
| Cap plasticity of the model input data | Input used | Note |
|---|---|---|
| Elastic modulus (kPa) | 2,150 | E c /c = 50–200 |
| Poisson’s ratio | 0.4 | This value can be 0.3–0.45 |
| Angle of friction (degrees) | 20 | Typical angle of friction for clay |
| Cap eccentricity | 0.1 | Cap eccentricity parameter, R. Its value must be greater than zero (typically 0.0001 ≤ R ≤ 1000.0) |
| Initial yield surface | 0 | Default |
| Transition surface radius | 0 | Default |
| Flow stress ratio | 1 | Default |
Stress and strain of the clay for Cap Hardening
| Yield stress (kPa) | Strain |
|---|---|
| 7.2 | 0 |
| 14.4 | 0.02 |
| 28.73 | 0.06 |
| 28.74 | 0.18 |
3.1.2 Analysis results of the laterally loaded single-wall pipe
Figure 7 shows the laterally loaded single-wall pipe in clay model analysis results. The analysis results were compared against that of Matlock [5] and Marshall [3].

FE analysis and test results’ comparison.
In Figure 7, the analysis result with the Abaqus built-in Cap plasticity method is relatively close to that of the test result. Marshall plastic model is slightly off as the displacement gets larger. This could be because the strain values used in this analysis are much larger. Marshall [3] appeared to use the clay plastic strain value as very small, close to zero.
3.2 SPS composite pipe in clay
The stress–strain curves used for steel and clay for this analysis are shown in Figure 8.

Steel and clay stress–strain used.
The boundary conditions used are the same as that of single-wall pipe analysis in clay in Figure 5. The results of SPS double-wall composite pipe analysis performed in medium clay are shown in Figure 9. In the figure, two half-pipes were connected, and this formed a pipeline. The steel and polymer interfaces are tied using the primary and secondary methods such that as the steel primary surface moves, the secondary polymer surface follows. The steel–polymer interfaces are bonded perfectly. In this analysis, the steel modulus of elasticity was taken as 200,000,000 kN·m−2 (29,000 ksi) and Poisson’s ratio was 0.3. The steel pipe yield strength was 350 MPa (50 ksi). Figure 8 shows the plastic stress–strain curve used for the steel pipes and the clay. The clay elastic modulus was 7,000 kN·m−2 and Poisson’s ratio was 0.4. It was a medium clay model used by Marshall [3]. The polymer grout is taken as elastic with a modulus of elasticity of 20,000,000 kN·m−2 (2,900 ksi). The mesh element types and model assembly are the same as the laterally loaded single-wall pipe in clay in Section 3.1. There are 20 mesh elements around the pipe and a mesh size of 8 cm along the pipe.
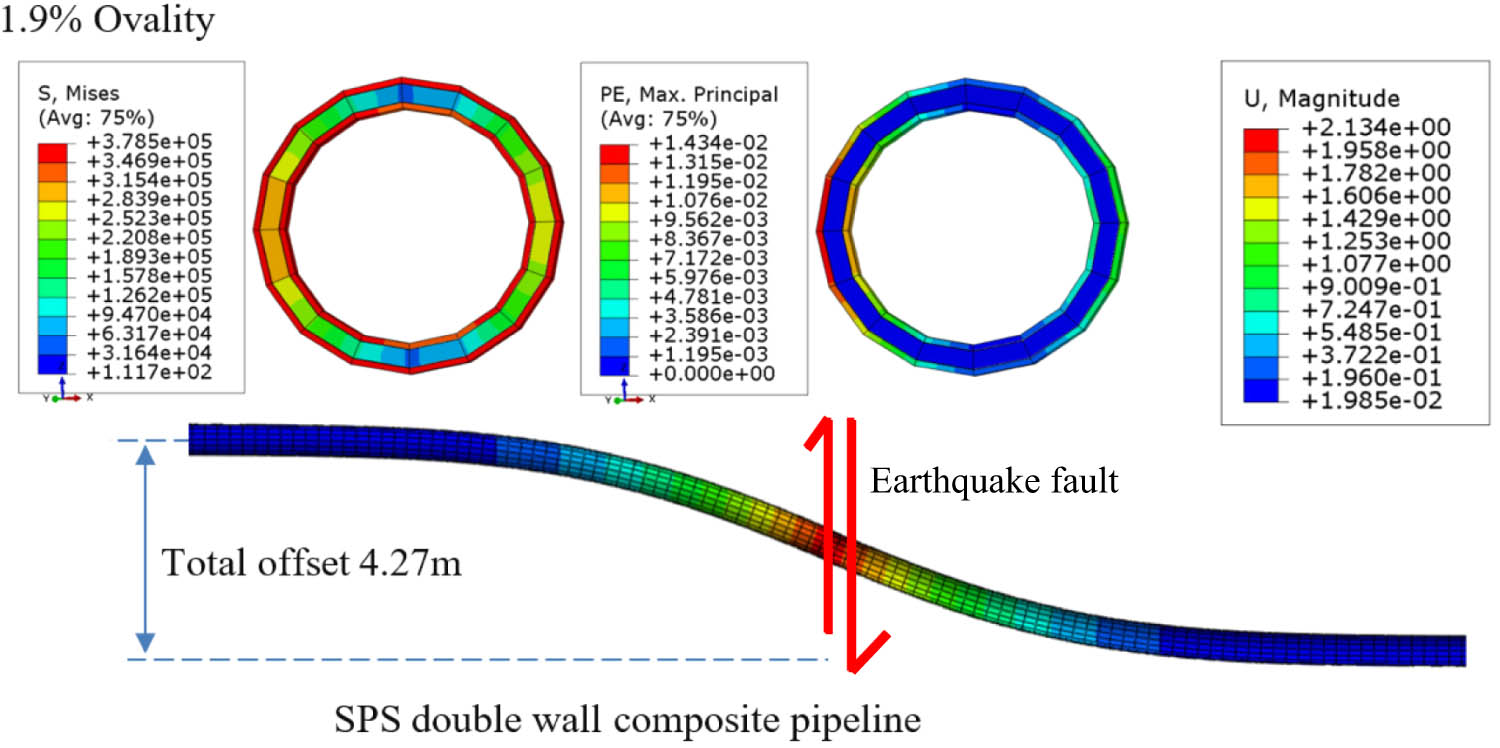
Buried seafloor SPS sandwich pipeline crossing earthquake fault.
The analysis results shown in Figure 9 are promising. Uckan et al. [11] showed single-wall pipeline failure due to 2.2 m displacement at earthquake fault. SPS double-wall composite pipe in this research shows that it can displace 4.27 m without having any failure. Inside pipe ovality is 1.9% and it is much less than the industry acceptance of 4%. The strain in steel is 1.43% and it is within the industry limit of 2%. The stress in steel is in an early plastic stage with 378.5 MPa, still much less than the ultimate capacity of 441 MPa. So in the case of 2.2 m pipeline displacement, this SPS composite pipe will likely survive without any damage.
3.3 Single-wall pipe analysis in air
Four-point beam bending analysis was performed to observe the behavior of a single-wall pipe. A weld was provided connecting the two pipes to simulate the actual pipeline connection.
3.3.1 Four-point load test on imperfect welded tubular section 50.8 cm × 1.27 cm
Two sections of single-wall pipes were connected by weld. A cone was modeled between the pipes that represent weld. The cone length was 1.27 cm, the same thickness as the pipe. The diameter of the first section was 50.8 cm and the diameter of the second section was 0.5% smaller. This was to create imperfections such as welding/construction of an offshore pipeline. In the Abaqus model, the connections between pipes were tied, which are the same as perfectly bonded interfaces. Reference points were created at the center of the pipes at each end. The reference point was tied to the pipe section using the rigid body. The left end was pinned using fixity 111000, and the other end was roller with fixity 110000 allowing the pipe to move along the axis. Lateral movement in the X-direction is restrained along the pipes. The vertical displacement loads in Y-direction were applied at two equidistance locations, a third and two-thirds of the beam length. The total beam length was 10.1727 m, and the boundary condition and the beam setups are shown in Figure 10.
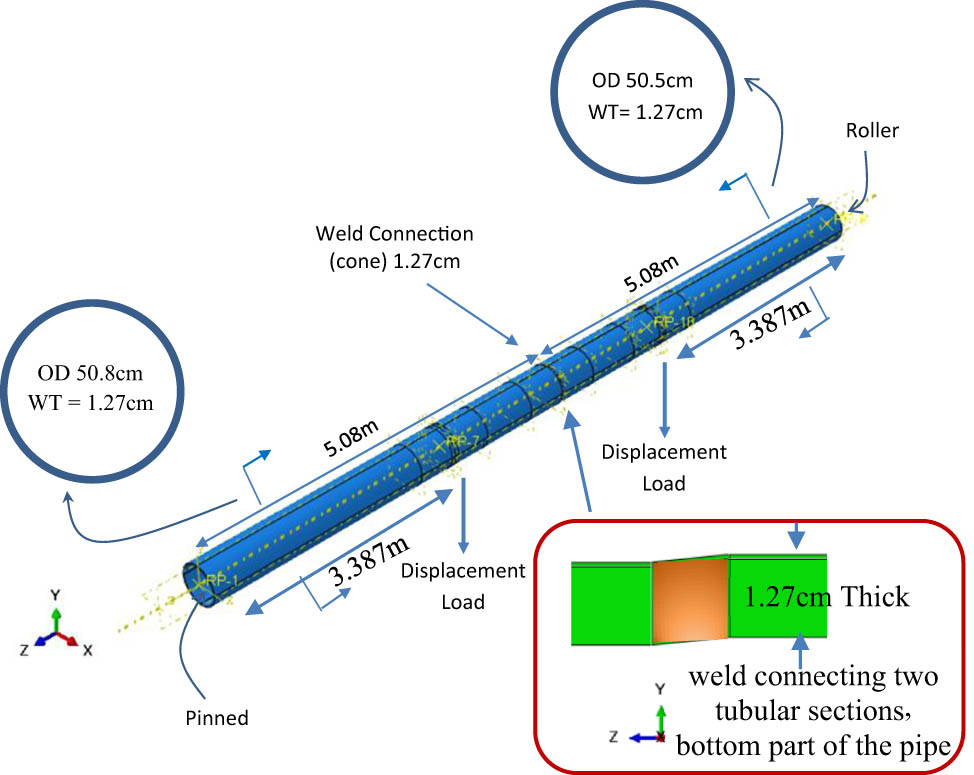
Simply supported single-wall pipe in air assembly.
3.3.2 Analysis results
The mesh size of 3 cm was found to be sufficient for the accuracy of analysis results and expected failures were found in the pipe. Thus, 3 cm mesh sizes were used at critical locations. Displacement at two equidistant locations was applied until the pipe buckled and failed. The analysis results are provided in Figure 11. A large wave of wrinkles was found on the compression side of the pipe in the mid-region of the beam. This failure is consistent with the predicted pipeline failure mode in Figure 4.

Single-wall pipe failure.
The analysis result here shows the maximum Von Mises stress with the ultimate capacity of the pipe, 441 MPa. The pipe buckled at the midpoint of the tubular beam and closer to the weld. Plots of vertical displacement at the large wave at mid-point against vertical displacement at two loading points are plotted in Figure 12 for diameter reduction calculation.

Vertical displacement at load point vs vertical displacement along the beam.
Nonlinear behavior started to appear at a downward displacement of 0.04 m at the loading point in Figure 12. This was where the local buckling started as the vertical displacement loading increased. The location of this analysis result was at 5.0927 m (5.08 m beam + 0.0127 m weld) away from the left end, which was between the weld and the smaller pipe section. The stress and strain results for 3% and 6% diameter reduction are shown in Figure 13. These values are selected to accommodate pipeline services, such as pigging, and Table 1 shows that these diameter reductions can still be acceptable.

Stress and strain results in diameter reduction of 3% and 6%.
At 6% diameter reduction or 9 cm displacement at load point, the maximum inside diameter was 49.03 cm and the minimum diameter was 46.61 cm. Hence, the ovality was 2.53%. The stress was 394.7 MPa and still within the plastic limit of 441 MPa. However, the strain value at this point was 2.977% and it was no longer acceptable as it exceeds the strain limit of 2%. At 3% diameter reduction or 6 cm displacement at load point, the ovality was almost negligible with 0.17%. However, the pipe has gone into the early plastic stage with 362 MPa with a very small strain of 0.08%, much lower than the acceptable limit of 2%. Hence, for a single-wall pipe, it was found that at a 6% diameter reduction, the pipeline capacity is governed by the strain.
3.4 SPS double-wall composite beam analysis in air
Simply supported imperfect double-wall composite pipe four-point bending assembly is shown in Figure 14. The inner and outer pipes were welded using a T/8 offset. The diameter of the outer pipe was 60.96 cm and has a thickness of 1.27 cm. With an offset of 1.27 cm/8, the other connecting pipe was 60.6 cm. The diameter of the inner pipe was 50.8 cm and has a thickness of 1.27 cm. The offset for the inner pipe weld was done the same as the outer pipe. The entire beam length was 3.6127 m and a 1.27 cm weld was used to connect the pipes as shown in Figure 14. One end of the beam is pinned, and the other end is a roller. The beam is restrained against lateral displacement and is only allowed to move vertically. The welded pipe represents imperfection in the pipe and the unwelded pipe is taken as an intact composite pipe. Four-point bending analysis was performed on both simply supported imperfect and intact beam sections in the air.

SPS four-point bending beam boundary conditions and weld section view.
For this beam bending analysis, the ovality is governed by the largest deformation at the beam mid-section at the weld location and the inner pipe was used to measure the ovality to accommodate the pipe services, such as pigging. The two pipes are connected by weld. Based on the boundary conditions and the way loadings applied, the mid region of the tubular beam experience the largest deformation. So, the critical failure behavior of the pipes can be observed. Figure 15 shows the composite pipe ovality with 3% for the imperfect and intact composite pipes. It can be seen from the results that even at 3% ovality, the strain is already high. The intact composite pipe has a strain value of 5.42% and the imperfect composite pipe has a strain value of 6.14%. The stresses are also close to the ultimate capacity of 441 MPa.
Results of 3% ovality.
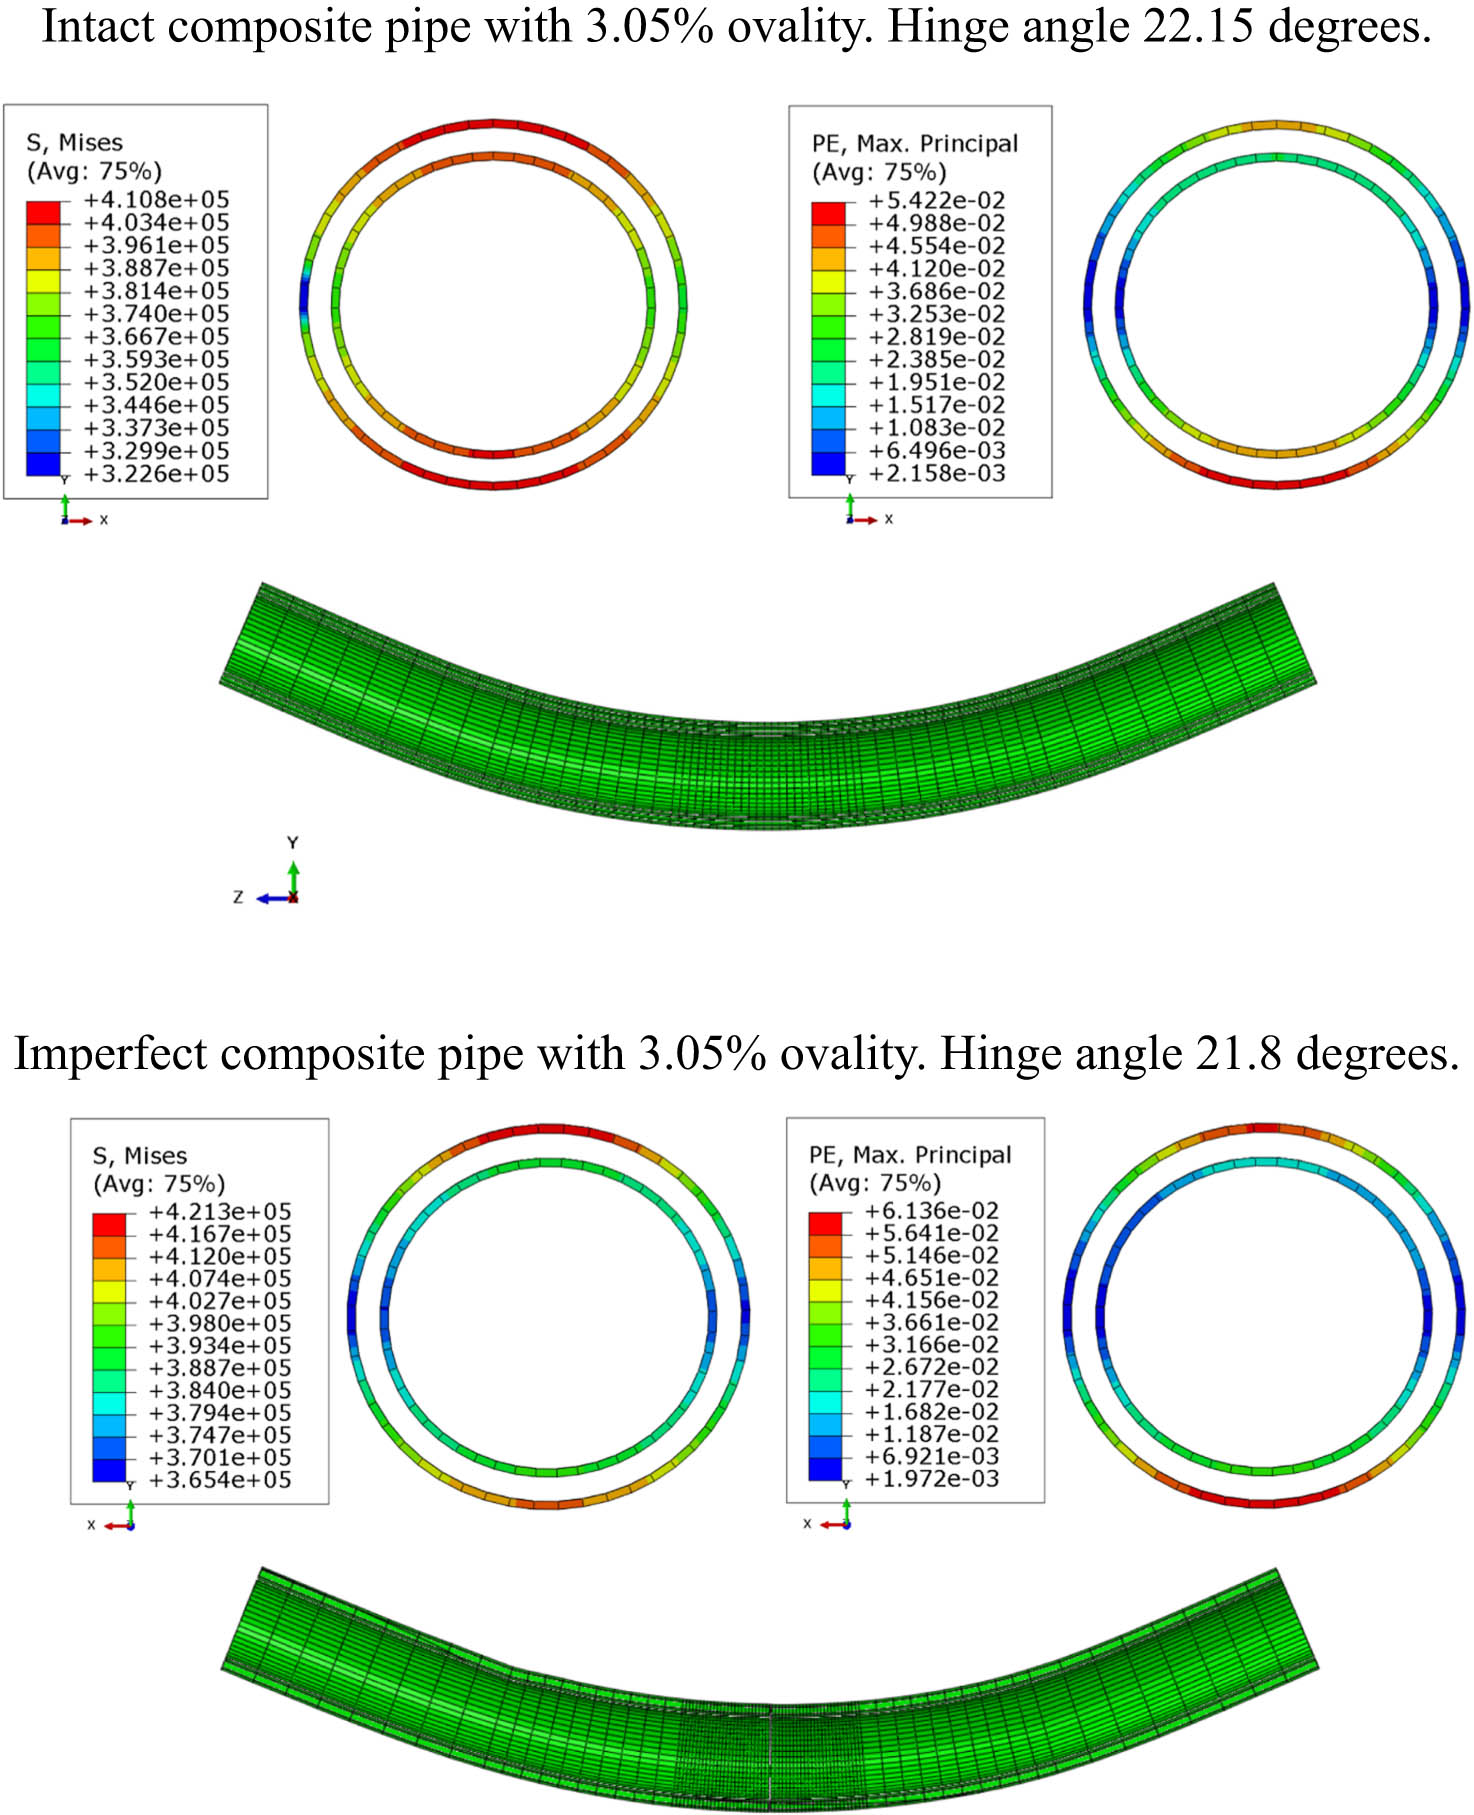
The analysis results for 6% ovality are shown in Figure 16. The strain and stresses are still high. However, they are not far above the 3% ovality.

Results of 6% ovality.
The strain of imperfect composite pipe for 3.05% ovality was 6.136%, and the strain of composite pipe ovality of 6.2% was 7.923%. So, the strain of SPS imperfect composite pipe increase was 29.1% from the change of ovality 3.05%–6.2%. The stress of composite for 3.05% ovality was 421.3 MPa and the stress of composite pipe for 6.2% ovality was 438.6 MPa. So, the increase in strain for SPS double-wall imperfect composite pipe was 4.1%.
Figure 17 shows the strain and stress results of welded and intact composite pipes. The displacement loads were applied until either the inner pipe reached the strain value of 2 or 4% for the outer pipe whichever comes first. From the analysis result shown in Figure 17, it was clear that the outer pipe experiences a much larger strain than the inner pipe at the same angle of rotation. The inner pipe was limited to a strain value of 2%. At this point, the outer pipe with weld experiences a strain value of 3.30%. As expected, the intact composite outer pipe has a strain value of just 2.437%, slightly higher than the inner pipe. So, it can be observed that the inner pipe’s strain is governing. Obviously, if the outer pipe’s strain reaches 4%, the inner pipe’s strain would easily exceed 2% in both imperfect and intact pipes. In the analysis results, both the imperfect and intact outer pipe strains were much lower than the 4% strain limit while the inner pipe strain was limited to 2%.

Strain limit of 4% for the outer pipe and 2% for the inner pipe.
Ovality for the imperfect pipe was 0.74% and ovality of the intact pipe was just 0.48%, well within the most stringent DNV-OS-F101 ovality limit of 3%. This shows that strain is the governing in SPS composite pipe, not the ovality. The maximum stress in an imperfect SPS pipe was 394.2 MPa and that in an intact composite pipe was 386.1 MPa. Although both pipes exceeded the elastic stress of 350 MPa and have gone into plastic, the stresses are still well within the plastic limit of 441 MPa. The imperfect SPS composite pipe exhibits more ductility than the intact composite pipe. It was because when the inner pipe strain value was limited to 2%, the imperfect SPS pipe has the ability to accommodate a rotation hinge angle of 11.85° whereas the intact composite pipe only takes a rotation hinge angle of 9.82°. The imperfect composite pipe strain for the outer and inner pipes shows a much larger difference than the intact composite pipe. The stresses are also larger than the intact composite pipe.
From stress and strain analysis results, keeping the inner pipe strain at 2% for both intact and imperfect composite pipes, the welded outer pipe strain is 37.0% higher than the intact composite outer pipe. The stress is 2% higher in the welded pipe than in the intact pipe.
Taking the worst scenario from different pipe ovality, it can be concluded that the strain can be 37.0% higher in the welded pipe and stresses can be 3.30% higher in the welded pipe.
3.5 Unbonded composite pipe
The bond between steel and polymer was removed and a four-point beam bending analysis was performed. This becomes an unbonded SPS composite pipe. It was found that the performance of the composite pipe has changed. In Figure 18, deformation occurred at 3% diameter reduction. Wrinkles were observed at the compression side of the pipe. The maximum stress occurred at the inner pipe weld connection, and it was 386.4 MPa, experiencing plasticity. The deformed shape factor shown is two times the actual deformation. The largest wave formed at the mid-section of the composite beam. It may be because the mid regions of the composite pipe experience the largest bending moment and largest stresses and hence the region was impacted the most. The wave gets smaller toward the supports, and it dissipates before reaching the support. The strain was 2.036% at the outer pipe loading point. However, the strain at the inner pipe was 1.421% near the mid-section. The industry limit for the strain is 2%.

Stress, strain, and deformation of the composite pipe at 3% diameter reduction.
3.6 Findings
The SPS double-wall composite pipeline offsets at 4.27 m show that ovality is not a concern with the pipe. In addition, the stress has also gone into an early plastic state with an acceptable strain of 1.434%. The pipeline displacement at the earthquake fault found in the research was 2.2 m; this is just about 52% of the SPS double-wall composite pipeline offset capacity.
Benchmark studies performed for the laterally loaded single-wall pipe in soft clay show that the FE analysis results match the test results. Simply supported single-wall pipe bending analysis in air result shows buckling and wrinkling failures in the pipe, ovality, high stress, and strain. It was observed that the strains are significantly increased from 3% to 6% ovality. In addition, visually the pipe roundness has been significantly affected at 6% ovality, although 3% ovality of the pipe appears to be almost perfectly rounded. The strain was very small at 3% ovality, however, the stress has gone into an early plastic state.
SPS double-wall composite pipe four-point bending in air analysis results show that the imperfect weld in the pipe has higher stress and strain, and larger ovality compared to the intact composite pipe. The analysis results’ summary is recorded in Table 5.
Results’ summary of SPS double-wall composite pipe analysis in air
| Observation | Tubular | Ovality (%) | Stress (MPa) | Inner pipe strain (%) | Outer pipe strain (%) | Hinge angle (Degree) |
|---|---|---|---|---|---|---|
| 1 | Intact | 3.1 | 410.8 | 4.1 | 5.42 | 22.1 |
| Weld | 3.1 | 421.3 | 3.7 | 6.13 | 21.8 | |
| Difference | 0 | 2.56 | 9.76 | 13.10 | 1.36 | |
| 2 | Intact | 6.2 | 424.6 | 5.2 | 6.7 | 27.0 |
| Weld | 6.2 | 438.6 | 4.8 | 7.9 | 23.2 | |
| Difference | 0 | 3.30 | 7.69 | 18.99 | 14.05 | |
| 3 | Intact | 0.48 | 386.1 | 2.0 | 2.44 | 9.82 |
| Weld | 0.74 | 394.2 | 2.0 | 3.34 | 11.85 | |
| Difference | 54.17 | 2.10 | 0.00 | 36.89 | 20.67 |
When the ovality was set to 3.1 or 6.2%, the intact composite pipe has a larger rotation angle to achieve the ovality limits and hence the inner pipe strains were larger compared to the welded pipe. The strain difference between inner and outer pipes for the intact composite pipe was smaller than welded pipe. However, when the strain limit was set to 2% for the inner pipe, the welded composite pipe rotation was larger than the intact composite to achieve 2% strain and also the outer welded pipe strain was significantly larger. Based upon the observation from three different types in Table 5 for a single-wall four-point bending analysis in air, the critical values for ovality, stress, and strain were extracted for the welded pipe. So, when the intact composite pipe is used, the amplification factor given by the welded pipe should be applied to account for the imperfection in the pipe. At this point, these factors are limited to this weld, materials, and pipe sizes. Table 6 shows the amplification factor to be applied to the intact composite pipe if the weld is not modeled.
Amplification factor for intact composite pipe
| Type | Ovality | Stress | Strain |
|---|---|---|---|
| Amplification factor for intact composite pipe | 1.540 | 1.033 | 1.370 |
It was also found that wrinkles appear in the compression side of the SPS composite pipe when there is no bond between the SPS. Thus, the steel pipes experience high strain even with a small deformation. The stress and strain in the outer pipe are larger than in the inner pipe, similar to the bonded composite pipe.
4 Conclusions
From this research work, the following conclusions can be drawn.
The FE analysis verification showed that the analysis results matched with the experimental results and hence, the FE analysis results from this work are reliable.
The single-wall pipe bending analysis results in air showed the pipe failed by buckling and wrinkling at the weld connection – the same modes as the actual failures in the earthquake fault zone.
From the four-point bending analysis of the SPS double-wall composite pipe, the welded composite pipes had a larger strain level than the intact pipes. For example, limiting the inner pipe strain at 2% for both the intact and imperfect composite pipes, the outer pipe strain in the welded pipe is 37.0% higher than the intact composite pipe.
When the inner pipe strain was limited to 2%, the welded pipe required a rotation angle of 11.85° whereas a lesser angle of rotation, 9.82°, needed for the unwelded composite pipe. It indicates that the flexibility or ductility of the welded pipe is better than the unwelded pipe, without exceeding the 4% strain limit for the outer pipe. However, the outer pipe of the welded pipe experienced a higher strain of 3.34% as compared with a lesser strain of 2.44% in the unwelded outer pipe. In addition, the ovality of the welded pipe was larger than those of unwelded ones.
From Table 6, it can be seen that the amplification factors for welded pipes as compared with the unwelded ones were 1.54 for the ovality, 1.033 for the stress, and 1.37 for the strain.
Based on Figure 9 showing the analysis results of a buried seafloor pipeline crossing earthquake fault and if strain was 1.43% for the unwelded pipeline, the strain with welded pipeline in Figure 9 would be 1.96% upon applying the amplification factor of 1.37. Similarly, the ovality of 1.9% in Figure 9 would be 2.9% with an amplification factor of 1.54, and the von Mises stress of 378.5 MPa became 393.6 MPa with a factor of 1.033. Hence, the pipeline with weld in Figure 9 is still within the industry acceptable limit.
There is no benefit in using the unbonded SPS composite pipes since there were wrinkles observed in the pipe as the pipe bent. In addition, wrinkles could cause a high level of strain in the steel even at early deformation. Hence, only bonded SPS composite pipes should be used for seafloor pipelines.
In a single-wall pipeline, the high strain is resisted by just a single layer of steel pipe and hence, catastrophic failure can occur should the pipe fails. However, using the SPS double-wall composite pipes has advantages such that loads would be shared by three layers of the pipes, and also the strain level in the inner pipe is always lower than the outer pipe. Hence, in case of failure in the outer pipe, the inner pipe would still have a high chance to survive because the strain in the inner pipe is lower than the outer pipe. Therefore, using the double-wall composite pipe is much safer than using the single-wall pipe.
In addition, in case of external impact to the pipelines or in the event of a large displacement due to an earthquake, the outer layer of the double-wall pipe will provide some protection to the inner pipe, the polymer grout in the double-wall pipe will also serve as a cushion and also added stiffness between the pipe layers. Thus, the inner pipe will have a higher chance to survive, prevent, or significantly reduce pipeline failure. There may also be several other benefits from using SPS double-wall composite pipes in providing protection from corrosion, fire, internal pressure, fatigue, fracture, etc.
-
Funding information: There is no funding involved.
-
Author contributions: Vul Thang: Performed the analysis and prepared the draft. David Hui: Provided advice, direction, and comments to improve the article. Jianren Zhou: Provided advice, comments, and modifications to improve the article. Peter Marshall: Provided advice, direction, and comments on the article.
-
Conflict of interest: The authors declare that there is no conflict of interest.
-
Data availability statement: The data used to support the findings of this study are included in the article.
References
[1] Cohen, L. Burst pipeline causes bubbling, steaming “eye of fire” to emerge in the Gulf of Mexico. CBS News, 2021, July 6. https://www.cbsnews.com/news/gulf-of-mexico-fire-ocean-burst-pipeline/.Search in Google Scholar
[2] Thang, V., P. W. Marshall, N. A. Brake, and F. Adam. Studded bond enhancement for steel-concrete-steel sandwich shells. Ocean Engineering Journal, Vol. 124, 2016, pp. 32–41.10.1016/j.oceaneng.2016.07.009Search in Google Scholar
[3] Marshall, P. W. Enhanced strain-based design of tubular members. Structural Stability Research Council, Proceedings, 2004.Search in Google Scholar
[4] Thang, V., D. Hui, and P. W. Marshall. Buried seafloor pipeline crossing a fault. MTS-IEEE Oceans 2020, Biloxi, 2020, pp. 1–7.10.1109/IEEECONF38699.2020.9389272Search in Google Scholar
[5] Matlock, H. Correlation for design of laterally loaded piles in soft clay. Offshore Technology Conference, 1970.10.4043/1204-MSSearch in Google Scholar
[6] Marshall, P. W. and V. Thang. Radical proposals for hot spot stress. Steel Construction, Vol. 7, 2014, id. 2.10.1002/stco.201410023Search in Google Scholar
[7] Zhao, H.-S., S.-T. Lie, and Y. Zhang. Fatigue assessment of cracked pipes with weld misalignment by using stress intensity factors. International Journal of Fatigue, Vol. 116, 2018, pp. 192–209.10.1016/j.ijfatigue.2018.06.030Search in Google Scholar
[8] API 579-1/ASME FFS-1. Fitness-for-service. The American Society of Mechanical Engineers, 2007.Search in Google Scholar
[9] Papadaki, C. I., S. A. Karamanos, G. Chatzopoulou, and G. C. Sarvanis. Buckling of internally-pressurized spiral-welded steel pipes under bending. Int International Journal of Pressure Vessels and Piping, Vol. 165, 2018, pp. 270–85.10.1016/j.ijpvp.2018.07.006Search in Google Scholar
[10] Arjomandi, K. and F. Taheri. Bending capacity of sandwich pipes. Ocean Engineering, Vol. 48, 2012, pp. 17–31.10.1016/j.oceaneng.2011.09.014Search in Google Scholar
[11] Uckan, E., B. Akbas, J. Shen, W. Rou, F. Paolacci, and M. O’Rourke. A simplified analysis model for determining the seismic response of buried steel pipes at a strike-slip fault crossings. Soil Dynamics and Earthquake Engineering, Vol. 75, 2015, pp. 55–65.10.1016/j.soildyn.2015.03.001Search in Google Scholar
[12] API RP 1111. Design, construction, operation, and maintenance of offshore hydrocarbon pipelines, American Petroleum Institute, 1999.Search in Google Scholar
[13] API-5L. API specification 5L. Specification for line pipe, 2013.Search in Google Scholar
[14] DNV-OS-F101. Submarine pipeline systems, Det Norske Veritas, 2013.Search in Google Scholar
[15] Liu, B., X. J. Liu, and H. Zhang. Strain-based design criteria of pipelines. Journal of Loss Prevention in the Process Industries, Vol. 22, No. 6, 2009, pp. 884–8.10.1016/j.jlp.2009.07.010Search in Google Scholar
[16] Beer, F. P., R. E. Johnston Jr, and J. T. DeWolf. Mechanics of materials, McGraw-Hill, Singapore, 2006.Search in Google Scholar
[17] Mohr, W. Strain-based design of pipeline. Submitted to US Department of Interior, Minerals Management Services (Herndon, VA) and US Department of Transportation, Research and Special Programs Administration (Washington DC), Columbus, OH, 2003.Search in Google Scholar
[18] ASCE. Guideline for the design of buried steel pipe, Americal Society of Civil Engineers, 2005.Search in Google Scholar
[19] Wang, H., X. Gong, X. Wang, S. Feng, T. Yang, and Y. Guo. Discrete curvature-based shape configuration of composite pipes for local buckling detection based on fiber Bragg grating sensors. Measurement, Vol. 188, 2022, id. 110603.10.1016/j.measurement.2021.110603Search in Google Scholar
[20] Reese, L. C. and W. Impe. Single piles and pile groups under lateral loading, 2nd ed., Taylor & Francis Group, LLC, Boca Raton, FL, 2011.10.1201/b17499Search in Google Scholar
[21] Reese, L. C., M. I. Wiliam, and S. T. Wang. Shallow and deep foundations, John Wiley & Sons, Hoboken, 2006.Search in Google Scholar
[22] Meyer, B. J., and L. C. Reese. Analysis of single piles under lateral loading. Center for Transportation Research, The University of Texas at Austin, 1979.Search in Google Scholar
[23] ABAQUS/CAE User’s Guide. Abaqus 6.14.Search in Google Scholar
[24] Helwany, S. Applied soil mechanics with ABAQUS applications, John Wiley, Hoboken, New Jersey, 2007.10.1002/9780470168097Search in Google Scholar
© 2022 Vul Thang et al., published by De Gruyter
This work is licensed under the Creative Commons Attribution 4.0 International License.
Articles in the same Issue
- Review Articles
- State of the art, challenges, and emerging trends: Geopolymer composite reinforced by dispersed steel fibers
- A review on the properties of concrete reinforced with recycled steel fiber from waste tires
- Copper ternary oxides as photocathodes for solar-driven CO2 reduction
- Properties of fresh and hardened self-compacting concrete incorporating rice husk ash: A review
- Basic mechanical and fatigue properties of rubber materials and components for railway vehicles: A literature survey
- Research progress on durability of marine concrete under the combined action of Cl− erosion, carbonation, and dry–wet cycles
- Delivery systems in nanocosmeceuticals
- Study on the preparation process and sintering performance of doped nano-silver paste
- Analysis of the interactions between nonoxide reinforcements and Al–Si–Cu–Mg matrices
- Research Articles
- Study on the influence of structural form and parameters on vibration characteristics of typical ship structures
- Deterioration characteristics of recycled aggregate concrete subjected to coupling effect with salt and frost
- Novel approach to improve shale stability using super-amphiphobic nanoscale materials in water-based drilling fluids and its field application
- Research on the low-frequency multiline spectrum vibration control of offshore platforms
- Multiple wide band gaps in a convex-like holey phononic crystal strip
- Response analysis and optimization of the air spring with epistemic uncertainties
- Molecular dynamics of C–S–H production in graphene oxide environment
- Residual stress relief mechanisms of 2219 Al–Cu alloy by thermal stress relief method
- Characteristics and microstructures of the GFRP waste powder/GGBS-based geopolymer paste and concrete
- Development and performance evaluation of a novel environmentally friendly adsorbent for waste water-based drilling fluids
- Determination of shear stresses in the measurement area of a modified wood sample
- Influence of ettringite on the crack self-repairing of cement-based materials in a hydraulic environment
- Multiple load recognition and fatigue assessment on longitudinal stop of railway freight car
- Synthesis and characterization of nano-SiO2@octadecylbisimidazoline quaternary ammonium salt used as acidizing corrosion inhibitor
- Perforated steel for realizing extraordinary ductility under compression: Testing and finite element modeling
- The influence of oiled fiber, freeze-thawing cycle, and sulfate attack on strain hardening cement-based composites
- Perforated steel block of realizing large ductility under compression: Parametric study and stress–strain modeling
- Study on dynamic viscoelastic constitutive model of nonwater reacted polyurethane grouting materials based on DMA
- Mechanical behavior and mechanism investigation on the optimized and novel bio-inspired nonpneumatic composite tires
- Effect of cooling rate on the microstructure and thermal expansion properties of Al–Mn–Fe alloy
- Research on process optimization and rapid prediction method of thermal vibration stress relief for 2219 aluminum alloy rings
- Failure prevention of seafloor composite pipelines using enhanced strain-based design
- Deterioration of concrete under the coupling action of freeze–thaw cycles and salt solution erosion
- Creep rupture behavior of 2.25Cr1Mo0.25V steel and weld for hydrogenation reactors under different stress levels
- Statistical damage constitutive model for the two-component foaming polymer grouting material
- Nano-structural and nano-constraint behavior of mortar containing silica aggregates
- Influence of recycled clay brick aggregate on the mechanical properties of concrete
- Effect of LDH on the dissolution and adsorption behaviors of sulfate in Portland cement early hydration process
- Comparison of properties of colorless and transparent polyimide films using various diamine monomers
- Study in the parameter influence on underwater acoustic radiation characteristics of cylindrical shells
- Experimental study on basic mechanical properties of recycled steel fiber reinforced concrete
- Dynamic characteristic analysis of acoustic black hole in typical raft structure
- A semi-analytical method for dynamic analysis of a rectangular plate with general boundary conditions based on FSDT
- Research on modification of mechanical properties of recycled aggregate concrete by replacing sand with graphite tailings
- Dynamic response of Voronoi structures with gradient perpendicular to the impact direction
- Deposition mechanisms and characteristics of nano-modified multimodal Cr3C2–NiCr coatings sprayed by HVOF
- Effect of excitation type on vibration characteristics of typical ship grillage structure
- Study on the nanoscale mechanical properties of graphene oxide–enhanced shear resisting cement
- Experimental investigation on static compressive toughness of steel fiber rubber concrete
- Study on the stress field concentration at the tip of elliptical cracks
- Corrosion resistance of 6061-T6 aluminium alloy and its feasibility of near-surface reinforcements in concrete structure
- Effect of the synthesis method on the MnCo2O4 towards the photocatalytic production of H2
- Experimental study of the shear strength criterion of rock structural plane based on three-dimensional surface description
- Evaluation of wear and corrosion properties of FSWed aluminum alloy plates of AA2020-T4 with heat treatment under different aging periods
- Thermal–mechanical coupling deformation difference analysis for the flexspline of a harmonic drive
- Frost resistance of fiber-reinforced self-compacting recycled concrete
- High-temperature treated TiO2 modified with 3-aminopropyltriethoxysilane as photoactive nanomaterials
- Effect of nano Al2O3 particles on the mechanical and wear properties of Al/Al2O3 composites manufactured via ARB
- Co3O4 nanoparticles embedded in electrospun carbon nanofibers as free-standing nanocomposite electrodes as highly sensitive enzyme-free glucose biosensors
- Effect of freeze–thaw cycles on deformation properties of deep foundation pit supported by pile-anchor in Harbin
- Temperature-porosity-dependent elastic modulus model for metallic materials
- Effect of diffusion on interfacial properties of polyurethane-modified asphalt–aggregate using molecular dynamic simulation
- Experimental study on comprehensive improvement of shear strength and erosion resistance of yellow mud in Qiang Village
- A novel method for low-cost and rapid preparation of nanoporous phenolic aerogels and its performance regulation mechanism
- In situ bow reduction during sublimation growth of cubic silicon carbide
- Adhesion behaviour of 3D printed polyamide–carbon fibre composite filament
- An experimental investigation and machine learning-based prediction for seismic performance of steel tubular column filled with recycled aggregate concrete
- Effects of rare earth metals on microstructure, mechanical properties, and pitting corrosion of 27% Cr hyper duplex stainless steel
- Application research of acoustic black hole in floating raft vibration isolation system
- Multi-objective parametric optimization on the EDM machining of hybrid SiCp/Grp/aluminum nanocomposites using Non-dominating Sorting Genetic Algorithm (NSGA-II): Fabrication and microstructural characterizations
- Estimating of cutting force and surface roughness in turning of GFRP composites with different orientation angles using artificial neural network
- Displacement recovery and energy dissipation of crimped NiTi SMA fibers during cyclic pullout tests