Study on the nanoscale mechanical properties of graphene oxide–enhanced shear resisting cement
-
Mingrui Du
 ,
Boyang Zhang
,
Pengbo Li
,
Boyang Zhang
,
Pengbo Li

Abstract
Graphene oxide (GO) has been widely used to enhance the tensile/compressive strength of cement-based materials, whereas its shear reinforcing effect is still unknown. To verify the feasibility of GO as a shear reinforcement material, the shear reinforcing effect of GO on cement was experimentally investigated. The nanoscale Young’s modulus (E) of the GO-enhanced cement was measured with the peak force quantitative nanomechanical mapping method to clarify the enhancing mechanism. Results show that the addition of 0.02 and 0.04 wt% GO in cement could improve the shear strength by about 12 and 40%, respectively, which is mainly due to the enhanced cohesion, and at the nanoscale, the average E of the low-density hydration product increased by 1.6 and 13.2%, whereas that of high-density hydration product remains almost unchanged. There exist fewer nanoholes/cracks and unhydrated cement grains but more the high-density hydration product in GO-enhanced cement, implying a denser microstructure and higher hydration degree. GO can enhance the shear strength of cement because of its enhancing effects on the microstructure, nanoscale Young’s modulus of hydration products, as well as the hydration degree.
1 Introduction
Graphene oxide (GO) [1,2], a derivative of graphene, is a two-dimensional nanosheet material with superior high mechanical properties, high thermal conductivities, low density, and large specific surface area. Young’s modulus of a single layer GO can be about 0.5 TPa [3], and its specific surface area can be about 2,600 m2·g−1 [4]. Additionally, there exist hydroxyl, epoxy, and carboxyl groups on GO sheets [5,6], so it is much easier to separate GO in aqueous solutions than in other carbon-based nanomaterials [7,8,9,10,11]. By the superior and unique material properties, GO has been used to improve the properties of materials such as polymers [12,13], aluminum [14,15], ceramics [16,17], or to fabricate composites with newly developed functions like self-cleaning [18]. Recent developments in the construction industry have employed GO as nano-additives to enhance the crucial engineering properties of cement-based materials [5,11,19,20,21]. The reported laboratory data in literature show the significant improvements in the strength properties of cementitious materials with the inclusion of a relatively low mass ratio of GO [19,22,23]. For example, it has been summarized that the addition of 0.02–0.05 wt% GO in cement could improve the compressive strength by about 14–46% [19], and the introduction of 0.03 wt% GO into cement paste could increase the tensile strength by more than 40% [22]. In a previous study [23], researchers have also reported that introducing 0.05 wt% GO into ordinary Portland cement could increase the compressive strength and flexural strength by 15–33 and 41–59%, respectively.
Currently, most of the publications about GO-enhanced cement-based materials have focused on the GO enhancement on the tensile/compressive strength [19,24,25], whereas the shear reinforcing effect of GO is stilled unknown. The typical representative cement-based materials designed to sustain shear stress are grouting materials used to fill holes or cracks in rock masses [26,27]. Because of the requirements for workability, cement-based grouting materials often have a high water-to-cement ratio (w/c, which can be higher than 0.6) [28], resulting in relatively poor strength performance, which can limit the enhancing effect of cement-based grouting materials on the fractured rock [29]. Additives like polymer fibers or silica fume have been proven to be effective at improving the mechanical properties of cement-based grouting materials, however, at the sacrifice of losing fluidity or injectability [30]. A previous study has reported the possibility of using high flexibility carbon nanotubes to enhance the shear resistance of cement-based materials [31]. In ref. [31], it was found that adding 0.036 wt% carbon nanotubes in cement-based materials caused up to 32% increment in shear strength, and at the nanoscale, carbon nanotubes were bent and gradually pulled out with the fracturing of cement. The bending and pull-out behaviors of carbon nanotubes compressed the cement [32], and the compression zone produced an extra frictional force that consumed more fracture energy [31,32]. This is the shear-enhancing mechanism of carbon nanotubes. This friction effect is also found in the graphene-enhanced calcium silicate hydrate, graphene-enhanced aluminum, and graphene-enhanced polyethylene [33], and it is known as the snubbing effect [34,35]. The snubbing effect in atomic-scale friction of graphene has been fully understood with the non-equilibrium molecular dynamics simulation method [32], and it was found that the snubbing friction is exponential to the deformation of graphene and friction coefficient of a substrate. Similar to graphene, GO is a two-dimensional sheet nanomaterial with excellent mechanical properties [1,2,5]; therefore, GO in matrices also has the snubbing effect. The exceptional material properties and snubbing effect of GO make it one of the possible candidates for improving the shear strength of cement-based materials but needs to be furtherly verified.
In this study, the GO-enhanced cement was prepared, and both the workability and shear strength performance were experimentally measured, followed by the investigation of the nanoscale mechanical properties with the Peak force quantitative nanomechanical mapping (peak force QNM) method [36]. This study aims to clarify the shear reinforcing effect of GO on cement and reveal the enhancing mechanism. This study shows that the addition of GO brings little influence on fluidity but decreases the bleeding rate of cement pastes. GO can improve the shear strength of cement because of its enhancing effects on the microstructure, nanoscale Young’s modulus of hydration products, as well as the hydration degree. The findings provide a basis for designing GO-enhanced cement-based materials for shear resisting applications.
2 Experimental procedure
2.1 Raw materials and sample preparation
The ordinary Portland cement (OPC, Type P.O 42.5) and commercially available 4 mg·mL−1 mass concentration GO suspensions were used to fabricate GO-enhanced cement. Polycarboxylate-based superplasticizer (PC) was used to improve the workability of fresh cement. The irregular polygonal-shaped GO used in this study has a thickness of around 1.5 nm and micron-sized side length, and it has wrinkled surface morphology (as shown in Figure S1). The Fourier transform infrared spectroscopy and Raman spectrums of GO are included in Figure S2. Both the hydroxyl and carboxyl groups can be found on GO sheets. Unlike carbon nanotubes that often naturally agglomerate in solid form in water [8], GO nanosheets are hydrophilic and highly dispersible in water because of these oxygen-containing groups [7,8,9]. The ultraviolet-vis spectrometer testing results show that when the GO suspension had been diluted 100 times, its absorbance was about 1.98 at the wavelength of 230 nm, and the absorbance remained almost unchanged after at least 1 hour. This observation indicated the full and stable dispersion of GO nanosheets in water [37], which is the prerequisite for dispersing GO in cement [19]. Besides, the addition of PC introduced the extra surfactant to enhance the dispersion of GO in the cementitious environment [8,37].
Table 1 presents the mixing design of GO-enhanced cement. Two series of GO-enhanced cements, with G/p of 0.02 wt% (Go-1) and 0.04 wt% (Go-2), were prepared. G/p represents the weight percentage of GO to cement. Plain cement (Re-0) with a G/p of 0 wt% was prepared for comparison. The water-to-cement ratio (w/c) of Re-0, Go-1, and Go-2 materials was 0.55, which is commonly used to fabricate cement sustaining shear [27,28].
Mixing design of GO-enhanced cement
| Samples | Components (g) | Mass ratios | |||||
|---|---|---|---|---|---|---|---|
| Cement | Water | GO suspension | PC | G/p (wt%) | P/p (wt%) | w/c | |
| Re-0 | 400 | 220 | 0 | 1.2 | 0 | 0.30 | 0.55 |
| Go-1 | 400 | 180 | 40 | 1.8 | 0.02 | 0.45 | 0.55 |
| Go-2 | 400 | 140 | 80 | 2.4 | 0.04 | 0.60 | 0.55 |
Note: G/p and P/p represent the weight percentage of GO nanosheets and PC to cement powders, respectively. The GO suspension presented in this table had been diluted to 2 mg·mL−1.
The original GO suspensions were diluted to 2 mg·mL−1 under water-bath ultrasonication for 2 min to separate the possibly agglomerated GO nanosheets [23]. After dilution and ultrasonication, the GO suspensions were mixed with PC aqueous solutions, and then, the mixtures were poured into the dry cement and stirred using a high-shear mixer (a Model 7000 constant speed mixer from Cement Test Equipment). The stirring process follows the procedure specified in ASTM Standard C1738 [38]. The high fluidity GO-enhanced cement was then cast into Φ50 × 50 mm cylindrical steel molds and vibrated to release any residual air bubbles. After curing for 24 h at 25°C and 85% relative humidity, the samples were demolded and cured in the same environment for another 27 days before the shear strength testing.
2.2 Instrumentation and characterization
Mini-slump tests were conducted to characterize the fluidity of the fresh cement [28,39]. The device for mini-slump test is an inverted-funnel shape with upper and lower diameters of 19 and 38 mm, respectively, and a height of 57 mm (more details are included in ref. [39]). The diameter of the free slump flow of fresh cement was measured at five different locations around the outline, and the average diameter was used to estimate the fluidity properties.
To characterize the bleeding rate of GO-enhanced cement, a certain amount of fresh cement was transferred into a sealed storage bottle and cured for 1 hr in the same environment used for curing the hardened samples, collecting the segregated water from the pastes every 10 min until no water was segregated [28]. The bleeding rate was defined as the weight percentage of the segregated water to the total water mixed into the cement pastes. For each kind of cement, three groups of pastes were used for testing the bleeding rate.
Following hardening, the shear strength properties of cement were characterized using a universal servo mechanical testing system (DDL 500 Type) and the variable angle shear test method. The variable angle shear test method has been widely used to estimate the shear strength of quasi-brittle materials like rock [40]- and cement-based composites [31]. As shown in Figure 1(a), on shear plane, σ, the normal stress, and τ, the shear stress, can be calculated using equation (1):
When the angle between the shear plane and horizontal direction (α) is changed, the vertical failure load (σ n ) of the sample changes, and so do σ and τ. The variation laws of τ with σ can be linearly fitted based on Mohr-Coulomb criteria [41], based on which, two parameters can represent the shear strength of materials, cohesion (c) and internal friction angle (ϕ), can be calculated. Five different α were used in this study, 45, 50, 55, 60, and 65°, and three to four samples were tested under each α. σ n was applied by applying a constant axial loading rate to shearing device [42]. The rate was 0.10 mm·min−1 to simulate the static loading [31].

Schematic diagrams of (a) variable angle shear test, (b) peak force QNM measurement process, and (c) contact between the nanoindenter tip and material surface.
A Bruker iCon atomic force microscope (AFM) was used to conduct peak force QNM measurements for characterizing the nanoscale Young’s modulus (E) of different materials in hardened cement. As shown in Figure 1(b), the peak force QNM test includes the indentation and withdrawal processes. To be specific, a hand-crafted natural diamond tip was used as an indenter to compress the material until the force reaches the predetermined value, F; then, the indenter withdraws the indentation point and moves to the next location until all the points within the scanned regions are characterized. The indentation process makes the material surface deform, and the monitored indentation depth is defined as δ (Figure 1c). E of materials at the measured point can be identified using the modified Hertzian Model (equation (2)):
where R is the working radius of the indenter and ν is Poisson’s ratio.
R was derived with the relative method [31]. A highly ordered pyrolytic graphite (HOPG) with E of about 18 GPa was used as a reference sample. Based on equation (2) and the value of E for HOPG, R was determined as 30 nm (Figure 1c). For verification, clear fused quartz was characterized before testing the hardened cement. During testing, F was set to 4.0 μN and ν was set to 0.3, according to the previous study on the nanomechanical properties of cement [31]. About 164–655 points were characterized per square micron. To minimize the influence of the sample surface roughness [43], samples were first impregnated with epoxy, followed by surface polishing continuously down to 0.1 μm grit using diamond paste [31]. Through the impregnation, the original nanocracks and nanoholes can be filled with epoxy. The polishing treatment can reduce the surface roughness to meet the flatness requirements of the peak force QNM test. During polishing, a lubricant made of ethanol and propylene glycol was used.
3 Results and discussion
3.1 The mini-slump diameter and bleeding rate
As shown in Figure 2, compared to plain cement, the mini-slump diameters of GO-enhanced cement are almost unchanged, whereas the bleeding rate is reduced. Whether or not the cement pastes contain GO, their mini-slump flow diameter varied in about 164 ± 2 mm range with a maximum variation of around 1.5%, indicating the little disturbed fluidity [39]. However, with increasing mass content of GO, the bleeding rate gradually reduces from about 1.7–1.1%, with a maximum reduction of about 34%. This is because single-layered GO has a large specific surface area [2]; therefore, GO in cement can absorb more PC and water molecules due to the strong van der Waals interaction, which helps to prevent the water from segregating from the fresh pastes. As a result, the bleeding rate of cement decreases when GO is added. The decreased bleeding rate indicates that the less settlement of cement grains is caused by gravity and the pastes were more stable during hardening [28].

(a) Mini-slump diameter and (b) bleeding rate of fresh cement. Error bars indicate standard deviations.
3.2 The shear strength
Figure 3 presents the shear strength of the hardened cement under different normal stresses (σ). From Figure 3, one can see that τ of the three types of cement increases when σ increases and the increasing trend is linear. The fitted functions have the same form as the Mohr–Coulomb function [41]. According to the fitted functions, the shear strength of the GO-enhanced cement is higher than that of the plain cement under the same normal stress, and the higher the mass ratios of GO, the higher the shear strength. For example, when σ is 10 MPa, the estimated τ of the Re-0 samples is about 12.9 MPa, whereas those of the Go-1 and Go-2 samples are 14.1 and 16.0 MPa, respectively.

The linear relationship between τ and σ of cement with GO mass ratios of (a) 0, (b) 0.02, and (c) 0.04 wt%. Error bars indicate standard deviations.
Figure 4 shows the cohesion (c) and internal friction angle (ϕ) of Re-0, Go-1, and Go-2 samples. c and ϕ were calculated based on the Mohr–Coulomb function and the linear relationship between τ and σ. From Figure 4, one can see that when G/p increases from 0 to 0.04 wt%, the average c of samples increases from about 7.10 to 9.89 MPa, and it increased by about 12.1 and 39.3%, respectively. However, the average ϕ remains almost unchanged when G/p varies, with a maximum variation of about 4%. The average ϕ of Re-0, Go-1, and Go-2 samples are about 30.3, 31.5, and 31.6°, respectively. These observations indicate that the higher shear strength of cement containing GO is primarily caused by the enhanced cohesion.

(a) Cohesion and (b) internal friction angle of the Re-0, Go-1, and Go-2 samples. Error bars indicate standard deviations.
3.3 Nanoscale mechanical properties
The nanoscale E of HOPG and clear fused quartz are presented in Figure 5(a) and (b), from which one can see that the E of HOPG and quartz are about 18–20 GPa and 60–80 GPa, respectively. The E of quartz measured here is consistent with literature values [44]. This indicates that materials with Young’s modulus range of 18–80 GPa can be reliably characterized with the peak force QNM method. Since the main compositions in cement matrices are often softer than quartz but harder than HOPG [31], the E characterizations of the cement materials at nanoscale are reliable.

Distribution maps of the nanoscale Young’s modulus of (a) HOPG; (b) clear fused quartz; and (c)–(e) different materials in cement with G/p of 0, 0.02, and 0.04 wt%. All these scanned regions share the same scale bar presented in (e).
Figure 5(c)–(e) shows the representative distribution maps of E of different materials in the characterized regions, and more distribution maps of E are included in Figure S3. The different E ranges are painted with different colors (as shown in the color bar). One can see that the multiple materials in hardened cement have a wide E range, from about 10 GPa to higher than 70 GPa, and there often exist unhydrated cement grains (U-c), hydration products, and some micro- or nanoholes/cracks [45]. The primary source of U-c is the original cement grains that are too large to be completely dissolved [45], and they were identified based on the already reported elastic modulus of cement clinkers [46]. The micro- or nanoholes/cracks exist because the hydration products often could not completely fill the space previously occupied by cement pore solutions. Because the nanoholes/cracks have been filled with epoxy during the impregnation process, they can be identified based on the E range of epoxy [31]. In Figure 5, the areas highlighted in red represent the nanoholes/cracks. Hydration products were categorized as the low-density hydration product (LD-h) and high-density hydration product (HD-h) based on the previous nanoindentation results [31]. It was also found that materials adjacent to U-c have higher E than HD-h but they are softer than U-c. These materials were defined as the transition products (T-p), and they are mainly made of hydrates and various ions dissolved from cement clinkers [45,47].
Figure 5(c)–(e) and Figure S3 show that U-c particles are randomly and individually embedded in cement matrices and that the original holes/cracks are surrounded by LD-h material. Compared to LD-h, HD-h is closer to U-c, indicating that during hardening, the deposition and crystallization of hydrates mainly occur on or nearby cement clinkers [45]. According to the distribution maps of E presented in Figure 5 and Figure S3, the probability density characteristics of E can be obtained, and they are shown in Figure 6.

The probability density of E of (a) Ref-0, (b) Go-1, and (c) Go-2 samples (with the goodness of fit of 0.987, 0.979, and 0.968, respectively).
The probability densities of E shown in Figure 6 are characterized as multiple peaks. The probability density can be fitted using a multimodal Gaussian function [31] (equation (3), with a goodness of fit of over 0.96). Based on fitting results, the average values of E of LD-h, HD-h, and T-p can be obtained, and they are represented by the abscissas of each peak [31]. Table 2 presents the average E of LD-h, HD-h, and T-p, from which one can see that the average E of T-p is about 48% higher than that of HD-h and that the addition of GO in cement brings little influence on the elastic modulus of HD-h (with E of around 27 GPa) but does enhance LD-h (with the increase in average E of about 1.6 and 11%). Additionally, the probability density curves also show that with the increasing mass content of GO, the peak of the sub curve representing U-c grains declines, whereas that of the sub curve representing HD-h increases and that the widths of these bell-shaped subcurves vary significantly, indicating that the cumulative probability (P d) of E of different materials changes. P d was calculated using the following equation:
where E a to E b , respectively, represent the lowest and greatest value of the E range of different materials in cement (as shown in Figure 6a).
Average values of E of LD-h, HD-h, and T-p in cement matrices (GPa)
| G/p (wt%) | LD-h | HD-h | T-p |
|---|---|---|---|
| 0 | 18.21 ± 1.68 | 26.99 ± 3.88 | 40.27 ± 5.91 |
| 0.02 | 18.51 ± 1.42 | 27.06 ± 2.84 | 40.44 ± 4.84 |
| 0.04 | 20.63 ± 1.96 | 27.14 ± 3.71 | 40.57 ± 4.06 |
Figure 7 shows P d of different materials in cement with different G/p, from which one can see that when G/p increases to 0.04 wt% from 0 wt%, the P d of LD-h decreases from about 55% to about 45%, whereas that of HD-h material increases from about 24.5% to about 36.9% and that of U-c grains declines from about 6.4% to about 3.9%. P d of H&C in Go-1 and Go-2 cement also, respectively, declined by about 4.6 and 12.6% compared to Ref-0 cement. P d can represent the volume ratio of each kind of material, and it can be deduced that the total hydration products occupy over 75% volume of the solid matrices. The less amount of H&C implies that the addition of GO in cement can make the microstructure denser. The increased amount of HD-h material and fewer U-c grains indicate that the hydration degree of cement was enhanced when GO was used [45].
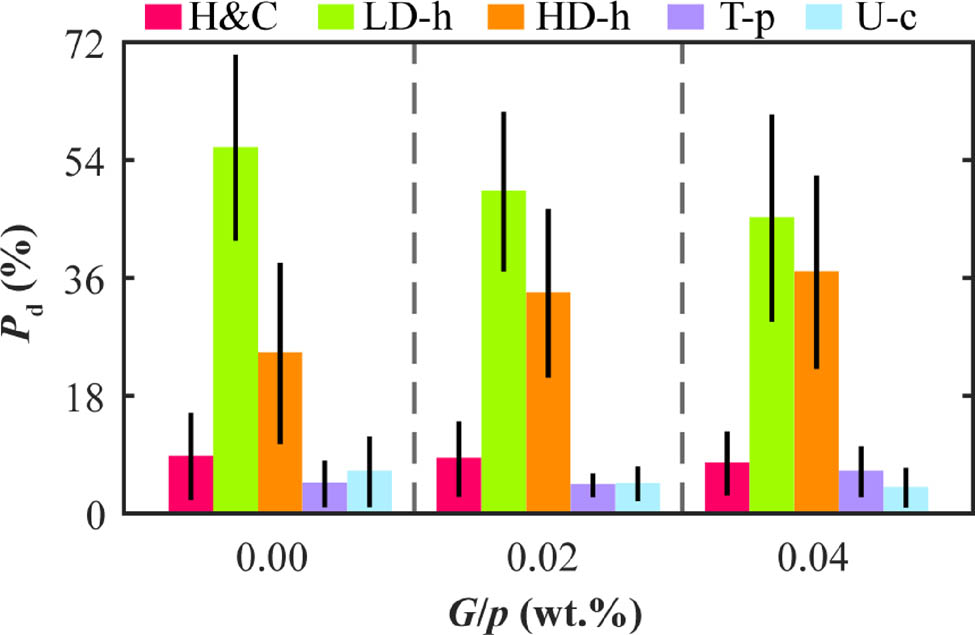
The cumulative probability (P d) of different materials in cement with different G/p. Error bars indicate standard deviations.
As demonstrated in Figure 8(a), average Young’s modulus of hydration products locating on a line in which the distance from the boundary of a certain U-c grain (U j) is l can be calculated by equation (5):
where E(ρ, θ m ) j is Young’s modulus of grain located at the coordinate of (ρ, θ m ), and this grain is with a distance of l from the boundary of U j grain; n is the quantity of all grains of which the distance from the boundary of U j grain is l; k is the total quantity of the U grains.

(a) Schematic diagram shows the identification of E of certain particles of which the distance from the boundary of a U-c grain is l. (b)–(d) Average E of particles with different distances from the boundary of U-c grains, and (e)–(g) schematic diagrams illustrate the evaluation of average E of materials in matrices with G/p of 0, 0.02, and 0.04 wt%.
Figure 8(b)–(d) shows that E̅ of materials near U grain in both Ref-0, Go-1, and Go-2 samples varies at a relatively high level (about 30 GPa). At l of about 4–6 μm, E̅declined by about 30% for the Ref-0 material because of the increased LD-h phase (Figure 5), whereas E̅ remained almost unchanged for the Go-1 and Go-2 materials. The difference in E̅ at l of about 4–6 μm indicates that the volume fractions of the HD-h phase in GO-reinforced cement are higher, consisting well with the distribution maps of E. For the Go-1 and Go-2 materials, E̅ starts to decline at l of about 13 μm and 15 μm.
Cement grains work as reactive core sites for the development of hydration products. Hydration products grown on or near the surface of core sites possess a higher density than those formed in the space that is originally occupied by the pore solution (Figure 5a and b). Therefore, average Young’s modulus of materials declines with the increasing distance. The increased l at which E̅ starts to decline indicates that the HD-h phase in GO-reinforced cement spread further from the core sites. The extending range of the HD-h phase in GO-reinforced cement was about 2–3 times that of the HD-h phase in plain cement. After reduction, E̅ of materials in GO-reinforced cement can be about 5–10% higher than that of hydrates in plain cement. It can also be noticed that after reduction to a plateau, E̅ may start to increase again at l of about 10 μm for the Ref-0 materials, which is due to the decreased distance between U-c grains.
3.4 Discussion
The hydration reaction of cement is a process of dissolving cement clinkers and forming and crystallizing hydration products [45]. During the normal hydration, the already formed hydrates mainly deposit on or near surfaces of cement grains. Researchers have claimed that the deposited hydrate particles are connected gradually to form a “shell structure” surrounding cement grains and that with the continuous precipitation and polymerization of hydrates, the shell structure thickens and becomes less porous [47]. As a result, both the further diffusion of hydrates through the shell structure to pore solutions and the passage of water molecules through the shell structure to contact cement clinkers can be retarded. When the hydrates and water molecules are no longer exchanged through the “shell,” the water molecules beneath the shell structure will be gradually consumed, at which point the hydration of this cement grain will stop. During this process, the newly formed hydrates will accumulate beneath the shell to form high-density matrices [47].
In fresh cement, most GO nanosheets distribute in pore solutions [48], and by virtue of the superior specific surface areas and high aspect ratios, GO nanosheets can work as extra substrates for the precipitation of hydrate particles [49]. Hydration products can thus be found in the pore space between cement grains rather than only on or near them [11]. The hydration products will be more uniformly distributed in the mixtures, and the medium surrounding the clinker grains will be less polymerized at the same hydration time [11]. As a result, the formation of the shell structure is retarded, and the retarding effect of the shell structure on ions/water exchange can be weakened; therefore, the hydration reaction of the GO-reinforced cement materials can be improved and more high-density hydration product is produced and less residual U-c are left (Figure 5).
As mentioned in Section 3.2, the higher shear strength of GO-enhanced cement is due to the higher cohesion. For hardened cement, the strength is predominately contributed by the calcium silicate hydrate (C–S–H) [50,51]. The charged C–S–H particles are bonded together through the ionic attractive interaction between them to form solid matrices that also bond other grains [50,51]. Young’s modulus of hydration products reflects the strength of the electrostatic interaction between C–S–H [52]. To explain this, here, the hydration products are simplified as collections of nanoscale crystals of idealized cubic geometry shape, and C–S–H grains are considered as the rigid nodes located at the vertices of the cubic crystal (as shown in Figure 9) [52].
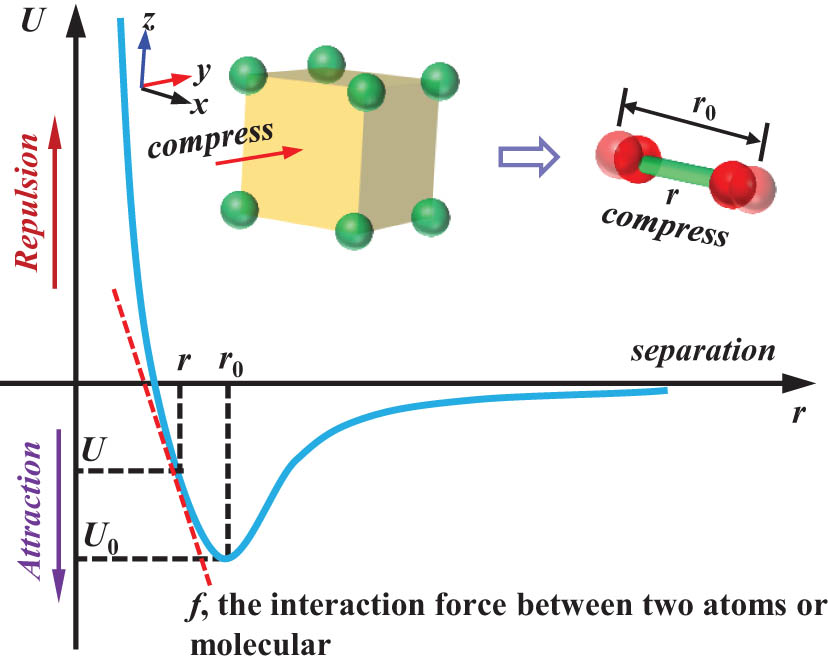
Schematic diagram of the simplified cement hydration products’ crystal structure with cubic geometry shape and the variations of potential energy (U) of a bond with the bond length (r).
As shown in Figure 9, when the crystal is compressed in the y-direction, since this idealized crystal structure can be considered isotropic [53,54], the four bonds parallel to the y-direction will be compressed simultaneously and equally; therefore, the compression of the crystal can be simply considered a process in which two rigid spheres approach each other from their equilibrium positions (Figure 9) [55]. During this process, the bond can provide repulsive force to the nodes, and the whole stiffness can be calculated as follows [52]:
where U represents the potential energy and r 0 and r represent the equilibrium bond length and the compressed bond length, respectively.
Equation (6) intuitively shows that E of this crystal is proportional to
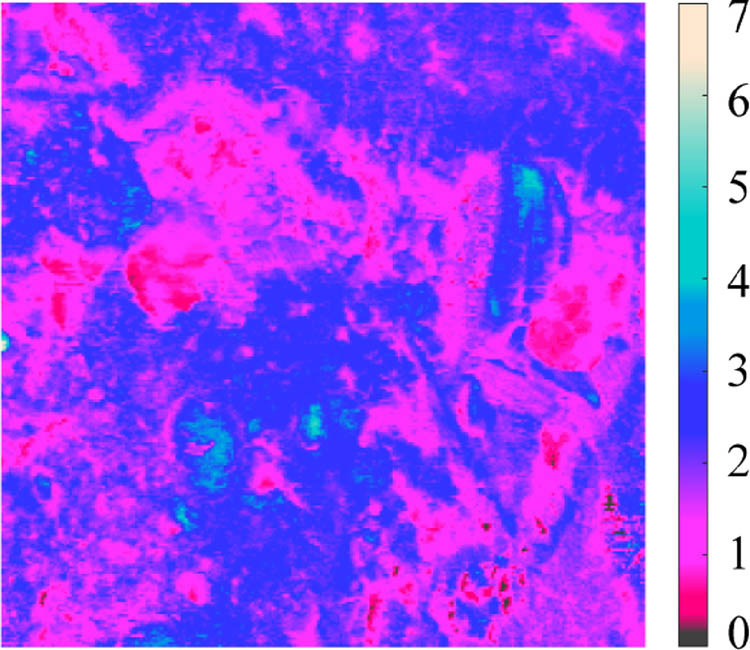
A map of the nanoscale pull-off force between GO-enhanced cement and diamond indenter (×10−7 N). This region is the one presented in Figure 5(e).
At nanoscale, the pull-off force is caused by the attractive interaction between C–S–H matrices and indenter [56,57,58]. Figure 5(e) and Figure 10 comprehensively show that in hardened cement, the regions occupied by hydration products with higher E have a stronger adhesion interaction with the indenter than those occupied by the softer materials. This observation indicates that at the nanoscale, materials with higher stiffness have stronger attractive interaction with the surrounding materials, which is consistent with the inference based on equation (5); that is, stronger force is required to overcome the attractive interaction force between C–S–H grains that compose high-density hydration products [52,55]. In hardened cement, cracks often tend to grow from the original defects and propagate into the solid materials gradually [31]. Due to the higher nanoscale Young’s modulus and the increased volume ratio of the high-density hydration products in GO-enhanced cement (Table 2 and Figure 7), it is more likely happen that the cracks propagate into materials with higher stiffness, and thus, more fracturing energy is required to break the material [31,52]. Due to the enhanced bonding effect between C–S–H particles, the cohesion of cement matrices is enhanced; thus, the shear strength is improved (as shown in Figure 4).
Additionally, it is also believed that the carboxylic acid groups attached to GO can chemically react with C–S–H or Ca(OH)2 during hydration [23]. Such reactions have been mentioned in a previous study on the mechanical properties of functionalized carbon nanotube–enhanced cement [59], and these reactions can introduce strong covalent bonds on the interface between GO and hydrates [60]; therefore, the load transferring efficiency from cement to GO sheets can be increased, leading to the enhanced internal bonding effect, which also contributes to the enhanced cohesion.
4 Conclusions
The influences of GO on the workability, shear strength, and nanoscale mechanical properties of OPC were experimentally investigated. The following conclusions are drawn:
The addition of GO in cement reduced the bleeding rate but brought little influence on the fluidity. The addition of 0.02 and 0.04 wt% GO in cement could increase the cohesion by about 12.1 and 39.3%, respectively, which is the primary cause of the enhanced shear strength.
The hardened cement mainly contains the nanoholes/cracks, LD-h, HD-h, unhydrated cement grains, and transition products. At the nanoscale, the average Young’s modulus of LD-h and HD-h were about 18.21–20.63 GPa and 26.99–27.14 GPa, respectively. The average Young’s modulus of the hydration products increased with the increasing mass content of GO.
When the content of GO in cement increased, the number of nanoholes/cracks, LD-h, and unhydrated cement grains declined, with the maximum decline of about 18, 12.6, and 39%, respectively, and the amount of HD-h increased. GO can enhance the shear strength of cement because of the enhancing effects on the microstructure, nanomechanical properties of hydration products, and the hydration degree.
Acknowledgment
The peak force QNM measurement was performed at the Melbourne Centre for Nanofabrication in the Victorian Node of the Australian National Fabrication Facility. The authors acknowledge Dr. Wei Wang and Dr. Felipe Basquiroto de Souza for their assistance with the peak force QNM test and AFM characterization.
-
Funding information: The authors are grateful for the finical support from the National Natural Science Foundation of China (Grant No. 51908515).
-
Author contributions: Conceptualization and methodology, Mingrui Du; formal analysis, investigation, and resources, Mingrui Du, Boyang Zhang and Pengbo Li; data curation, Peng Zhao and Haijian Su; original writing, Mingrui Du; writing, review, and editing, Mingrui Du and Xueming Du.
-
Conflict of interest: The authors declare that they have no conflict of interest.
-
Ethical statement: The conducted research is not related to either human or animal use.
-
Data availability statement: The data used to support the findings of this study are included within the article.
References
[1] Geim, A. K. and K. S. Novoselov. The rise of graphene. Nature Materials, Vol. 6, No. 3, 2007, pp. 183–191.10.1142/9789814287005_0002Search in Google Scholar
[2] Zhu, Y., S. Murali, W. Cai, X. Li, J. W. Suk, J. R. Potts, et al. Graphene and graphene oxide: synthesis, properties, and applications. Advanced Materials, Vol. 22, 2010, pp. 3906–3924.10.1002/adma.201090156Search in Google Scholar
[3] Kuilla, T., S. Bhadra, D. Yao, N. H. Kim, S. Bose, and J. H. Lee. Recent advances in graphene based polymer composites. Progress in Polymer Ence, Vol. 35, No. 11, 2010, pp. 1350–1375.10.1016/j.progpolymsci.2010.07.005Search in Google Scholar
[4] Lambert, T. N., C. A. Chavez, B. Hernandez-Sanchez, P. Lu, N. S. Bell, A. Ambrosini, et al. Synthesis and characterization of titaniagraphene nanocomposites. Journal of Jiangxi Normal University, Vol. 113, No. 46, 2009, pp. 19812–19823.10.1021/jp905456fSearch in Google Scholar
[5] Gholampour, A., M. Valizadeh Kiamahalleh, D. N. H. Tran, T. Ozbakkaloglu, and D. Losic. From graphene oxide to reduced graphene oxide: Impact on the physiochemical and mechanical properties of graphene-cement composites. Acs Applied Materials Interfaces, Vol. 9, No. 49, 2017, pp. 43275–43286.10.1021/acsami.7b16736Search in Google Scholar PubMed
[6] Marcano, D. C., D. V. Kosynkin, J. M. Berlin, S. Alexander, Z. Z. Sun, S. Alexander, et al. Improved synthesis of graphene oxide. Acs Nano, Vol. 4, No. 8, 2010, pp. 4806–4814.10.1021/nn1006368Search in Google Scholar PubMed
[7] Qiu, L., X. Yang, X. Gou, W. Yang, Z. F. Ma, G. G. Wallace, et al. Dispersing carbon nanotubes with graphene oxide in water and synergistic effects between graphene derivatives. Chemistry, Vol. 16, No. 35, 2010, pp. 10653–10658.10.1002/chem.201001771Search in Google Scholar PubMed
[8] Gao, Y., H. W. Jing, S. J. Chen, M. R. Du, W. Q. Chen, and W. H. Duan. Influence of ultrasonication on the dispersion and enhancing effect of graphene oxide–carbon nanotube hybrid nanoreinforcement in cementitious composite. Composites Part B: Engineering, Vol. 164, 2019, pp. 45–53.10.1016/j.compositesb.2018.11.066Search in Google Scholar
[9] Lu, Z. Y., D. S. Hou, A. Hanif, W. B. Hao, G. X. Sun, and Z. J. Li. Comparative evaluation on the dispersion and stability of graphene oxide in water and cement pore solution by incorporating silica fume. Cement and Concrete Composites, Vol. 94, 2019, pp. 33–42.10.1016/j.cemconcomp.2018.08.011Search in Google Scholar
[10] Li, X. G., W. Wei, H. Qin, and Y. H. Hu. Co-effects of graphene oxide sheets and single wall carbon nanotubes on mechanical properties of cement. Journal of Physics and Chemistry of Solids, Vol. 85, 2015, pp. 39–43.10.1016/j.jpcs.2015.04.018Search in Google Scholar
[11] Ghazizadeh, S., P. Duffour, N. T. Skipper, and Y. Bai. , Understanding the behaviour of graphene oxide in Portland cement paste. Cement and Concrete Research, Vol. 111, 2018, pp. 169–182.10.1016/j.cemconres.2018.05.016Search in Google Scholar
[12] Bortz, D. R., E. G. Heras, and I. Martin-Gullon. Impressive fatigue life and fracture toughness improvements in graphene oxide/epoxy composites. Macromolecules, Vol. 45, No. 1, 2012, pp. 238–245.10.1021/ma201563kSearch in Google Scholar
[13] Yousefi, N., M. M. Gudarzi, Q. Zheng, S. H. Aboutalebi, F. Sharif, and K. Jang-Kyo. Self-alignment and high electrical conductivity of ultralarge graphene oxide–polyurethane nanocomposites. Journal of Materials Chemistry, Vol. 22, No. 25, 2012, pp. 12709–12717.10.1039/c2jm30590aSearch in Google Scholar
[14] Liu, J., U. Khan, J. Coleman, B. Fernandez, P. Rodriguez, S. Naher, et al. Graphene oxide and graphene nanosheet reinforced aluminium matrix composites: Powder synthesis and prepared composite characteristics. Materials Design, Vol. 94, Mar 2016, pp. 87–94.10.1016/j.matdes.2016.01.031Search in Google Scholar
[15] Hidalgo-Manrique, P., S. Yan, F. Lin, Q. Hong, I. A. Kinloch, X. Chen, et al. Microstructure and mechanical behaviour of aluminium matrix composites reinforced with graphene oxide and carbon nanotubes. Journal of Materials Science, Vol. 52, No. 23, 2017, pp. 13466–13477.10.1007/s10853-017-1450-6Search in Google Scholar
[16] Rincón, A., A. S. A. Chinelatto, and R. Moreno. Tape casting of alumina/zirconia suspensions containing graphene oxide. Journal of the European Ceramic Society, Vol. 34, No. 7, 2014, pp. 1819–1827.10.1016/j.jeurceramsoc.2013.12.027Search in Google Scholar
[17] Shen, C., E. Barrios, and L. Zhai. Bulk polymer-derived ceramic composites of graphene oxide. Acs Omega, Vol. 3, No. 4, 2018, pp. 4006–4016.10.1021/acsomega.8b00492Search in Google Scholar PubMed PubMed Central
[18] Gong, T., J. Kim, J. Woo, J. H. Jang, and S. Lee. Fabrics coated with hot-iron-treated graphene oxide for a self-cleaning and mechanically robust water–oil separation material. RSC Advances, Vol. 7, No. 42, 2017, pp. 25796–25802.10.1039/C7RA03127KSearch in Google Scholar
[19] Ezzatollah, S., D. S. F. Basquiroto, X. P. Yao, B. Emad, A. Abozar, and W. H. Duan. Graphene-based nanosheets for stronger and more durable concrete: A review. Construction Building Materials, Vol. 183, 2018, pp. 642–660.10.1016/j.conbuildmat.2018.06.201Search in Google Scholar
[20] Li, W. G., X. Y. Li, S. J. Chen, Y. M. Liu, W. H. Duan, and S. P. Shah. Effects of graphene oxide on early-age hydration and electrical resistivity of Portland cement paste. Construction Building Materials, Vol. 136, 2017, pp. 506–514.10.1016/j.conbuildmat.2017.01.066Search in Google Scholar
[21] Liu, Q., Q. F. Xu, Q. Yu, R. D. Gao, and T. Tong. Experimental investigation on mechanical and piezoresistive properties of cementitious materials containing graphene and graphene oxide nanoplatelets. Construction Building Materials, Vol. 127, 2016, pp. 565–576.10.1016/j.conbuildmat.2016.10.024Search in Google Scholar
[22] Gong, K., Z. Pan, A. H. Korayem, Q. Ling, D. Li, F. Collins, et al. Reinforcing effects of graphene oxide on Portland cement paste. Journal of Materials in Civil Engineering, Vol. 27, No. 2, 2015, id. A4014010.10.1061/(ASCE)MT.1943-5533.0001125Search in Google Scholar
[23] Pan, Z., L. He, L. Qiu, A. H. Korayem, G. Li, J. W. Zhu, et al. Mechanical properties and microstructure of a graphene oxide–cement composite. Cement and Concrete Composites, Vol. 58, 2015, pp. 140–147.10.1016/j.cemconcomp.2015.02.001Search in Google Scholar
[24] Lu, Z., D. Hou, L. Meng, G. Sun, C. Lu, and Z. Li. Mechanism of cement paste reinforced by graphene oxide/carbon nanotubes composites with enhanced mechanical properties. RSC Advances, Vol. 5, No. 122, 2015, pp. 100598–100605.10.1039/C5RA18602ASearch in Google Scholar
[25] Lv, S., Y. Ma, C. Qiu, T. Sun, J. Liu, and Q. Zhou. Effect of graphene oxide nanosheets of microstructure and mechanical properties of cement composites. Construction and Building Materials, Vol. 49, 2013, pp. 121–127.10.1016/j.conbuildmat.2013.08.022Search in Google Scholar
[26] Zolfaghari, A., A. Sohrabi Bidar, M. R. Maleki Javan, M. Haftani, and A. Mehinrad. Evaluation of rock mass improvement due to cement grouting by Q-system at Bakhtiary dam site. International Journal of Rock Mechanics Mining Ences, Vol. 74, 2015, pp. 38–44.10.1016/j.ijrmms.2014.12.004Search in Google Scholar
[27] Tani, M. E. and G. Rock. Fractures with cement grout. Rock Mechanics Rock Engineering, Vol. 45, No. 4, 2012, pp. 547–561.10.1007/s00603-012-0235-0Search in Google Scholar
[28] Du, M., H. Jing, W. Duan, G. Han, and S. Chen. Methylcellulose stabilized multi-walled carbon nanotubes dispersion for sustainable cement composites. Construction and Building Materials, Vol. 146, 2017, pp. 76–85.10.1016/j.conbuildmat.2017.04.029Search in Google Scholar
[29] Rosquoët, A. F., B. A. Alexis, B. A. Khelidj, and B. A. Phelipot. Experimental study of cement grout: rheological behavior and sedimentation. Cement Concrete Research, Vol. 33, No. 5, 2003, pp. 713–722.10.1016/S0008-8846(02)01036-0Search in Google Scholar
[30] Huang, W. H. Properties of cement-fly ash grout admixed with bentonite, silica fume, or organic fiber. Cement Concrete Research, Vol. 27, No. 3, 1997, pp. 395–406.10.1016/S0008-8846(97)00032-XSearch in Google Scholar
[31] Du, M., S. Chen, W. Duan, W. Chen, and H. Jing. Role of multi-walled carbon nanotubes as shear reinforcing nano-pins in quasi-brittle matrices. ACS Applied Nano Materials, Vol. 1, No. 4, 2018, pp. 1731–1740.10.1021/acsanm.8b00162Search in Google Scholar
[32] Chen, S. J., X. P. Yao, Q. Wang, and W. H. Duan. Snubbing effect in atomic scale friction of graphene. Composites Part B Engineering, Vol. 136, 2018, pp. 119–125.10.1016/j.compositesb.2017.07.049Search in Google Scholar
[33] Chen, S. J., C. Y. Li, Q. Wang, and W. H. Duan. Reinforcing mechanism of graphene at atomic level: Friction, crack surface adhesion and 2D geometry. Carbon, Vol. 114, 2017, pp. 557–565.10.1016/j.carbon.2016.12.034Search in Google Scholar
[34] Shao-Yun, F. U. and B. Lauke. The fibre pull-out energy of misaligned short fibre composites. Journal of Materials Science, Vol. 32, No. 8, 1997, pp. 1985–1993.Search in Google Scholar
[35] Fu, S., B. Zhou, and C. Lung. On the pull-out of fibers with fractal-tree structure and the interference of strength and fracture toughness of composites. Composites Science Technology, Vol. 47, No. 3, 1993, pp. 245–250.10.1016/0266-3538(93)90033-DSearch in Google Scholar
[36] Pittenger, B., N. Erina, and C. Su. Mechanical property mapping at the nanoscale using PeakForce QNM scanning probe technique. Solid Mechanics Its Applications, Vol. 203, 2014, pp. 31–51.10.1007/978-94-007-6919-9_2Search in Google Scholar
[37] Chuah, S., W. G. Li, S. J. Chen, J. G. Sanjayan, and W. H. Duan. Investigation on dispersion of graphene oxide in cement composite using different surfactant treatments. Construction Building Materials, Vol. 161, 2018, pp. 519–527.10.1016/j.conbuildmat.2017.11.154Search in Google Scholar
[38] ASTM C1738-11. Standard practice for high-shear mixing of hydraulic cement pastes, ASTM International, Easton, MD, USA, 2011.Search in Google Scholar
[39] Zou, B., S. J. Chen, A. H. Korayem, F. Collins, C. M. Wang, and W. H. Duan. Effect of ultrasonication energy on engineering properties of carbon nanotube reinforced cement pastes. Carbon, Vol. 85, 2015, pp. 212–220.10.1016/j.carbon.2014.12.094Search in Google Scholar
[40] Barton, N. Rock mechanics review, the shear strength of rock and rock joints. International Journal of Rock Mechanics Mining Ence, Vol. 13, 2000, pp. 255–279.10.1016/0148-9062(76)90003-6Search in Google Scholar
[41] Zhao, J. Applicability of Mohr–Coulomb and Hoek–Brown strength criteria to the dynamic strength of brittle rock. International Journal of Rock Mechanics Mining Sciences, Vol. 37, No. 7, 2000, pp. 1115–1121.10.1016/S1365-1609(00)00049-6Search in Google Scholar
[42] GB/T 23561.2-2009. Methods for determining the physical and mechanical properties of coal and rock – Part II: Methods for determining shear strength of coal and rock, Ministry of Construction of the People’s Republic of China, Beijing, China, 2009.Search in Google Scholar
[43] Miller, M., C. Bobko, M. Vandamme, and F. J. Ulm. Surface roughness criteria for cement paste nanoindentation. Cement Concrete Research, Vol. 38, No. 4, 2008, pp. 467–476.10.1016/j.cemconres.2007.11.014Search in Google Scholar
[44] Constantinides, G., E. C. C. M. Silva, G. S. Blackman, and K. J. V. Vliet. Dealing with imperfection: quantifying potential length scale artefacts from nominally spherical indenter probes. Nanotechnology, Vol. 18, No. 30, 2007, pp. 410–415.10.1088/0957-4484/18/30/305503Search in Google Scholar
[45] Taylor, H. F. W. Cement chemistry, 2nd ed, Thomas Telford, London, 1997.10.1680/cc.25929Search in Google Scholar
[46] Velez, K., S. Maximilien, D. Damidot, G. Fantozzi, and F. Sorrentino. Determination by nanoindentation of elastic modulus and hardness of pure constituents of Portland cement clinker. Cement Concrete Research, Vol. 31, 2001, pp. 555–561.10.1016/S0008-8846(00)00505-6Search in Google Scholar
[47] Gallucci, E., P. Mathur, and K. Scrivener. Microstructural development of early age hydration shells around cement grains. Cement Concrete Research, Vol. 40, No. 1, 2010, pp. 4–13.10.1016/j.cemconres.2009.09.015Search in Google Scholar
[48] Chen, S. J., C. Y. Qiu, A. H. Korayem, M. R. Barati, and W. H. Duan. Agglomeration process of surfactant-dispersed carbon nanotubes in unstable dispersion: A two-stage agglomeration model and experimental evidence. Powder Technology, Vol. 301, 2016, pp. 412–420.10.1016/j.powtec.2016.06.033Search in Google Scholar
[49] Lu, Z., X. Li, A. Hanif, B. Chen, P. Parthasarathy, J. Yu, et al. Early-age interaction mechanism between the graphene oxide and cement hydrates. Construction Building Materials, Vol. 152, No. 15, 2017, pp. 232–239.10.1016/j.conbuildmat.2017.06.176Search in Google Scholar
[50] Jönsson, B., A. Nonat, C. Labbez, B. Cabane, and H. Wennerström. Controlling the cohesion of cement paste. Langmuir, Vol. 21, No. 20, 2005, pp. 9211–9221.10.1021/la051048zSearch in Google Scholar PubMed
[51] Pellenq, J. M. and H. V. Damme. Why does concrete set?: The nature of cohesion forces in hardened cement-based materials. Mrs Bulletin, Vol. 29, No. 5, 2004, pp. 319–323.10.1557/mrs2004.97Search in Google Scholar
[52] Atkins, P. and J. De Paula. Elements of Physical Chemistry, 5th ed, W. H. Freeman and Company, NY, 2009.Search in Google Scholar
[53] Ioannidou, K., M. Kanduč, L. Li, D. Frenkel, J. Dobnikar, and E. Del Gado. The crucial effect of early-stage gelation on the mechanical properties of cement hydrates. Nature Communications, Vol. 7, No. 1, 2016, id. 12106.10.1038/ncomms12106Search in Google Scholar PubMed PubMed Central
[54] Jonsson, B., H. Wennerstrom, A. Nonat, and B. Cabane. Onset of cohesion in cement paste. Langmuir : the ACS Journal of Surfaces and Colloids, Vol. 20, No. 16, 2004, pp. 6709–6709.10.1021/la0498760Search in Google Scholar PubMed
[55] Pearlman, D. A. and P. A. Kollman. The overlooked bond-stretching contribution in free energy perturbation calculations. Journal of Chemical Physics, Vol. 94, No. 6, 1991, pp. 4532–4545.10.1063/1.460608Search in Google Scholar
[56] Gu, Z., S. Li, F. Zhang, and S. Wang. Understanding surface adhesion in nature: A peeling model. Advanced Science, Vol. 3, No. 7, 2016, id. 1500327.10.1002/advs.201500327Search in Google Scholar PubMed PubMed Central
[57] Jiang, Y. and K. T. Turner. Measurement of the strength and range of adhesion using atomic force microscopy. Extreme Mechanics Letters, Vol. 9, 2016, pp. 119–126.10.1016/j.eml.2016.05.013Search in Google Scholar
[58] Plassard, C., E. Lesniewska, I. Pochard, and A. Nonat. Nanoscale experimental investigation of particle interactions at the origin of the cohesion of cement. Langmuir the Acs Journal of Surfaces Colloids, Vol. 21, No. 16, 2005, pp. 7263–7270.10.1021/la050440+Search in Google Scholar PubMed
[59] Li, G. Y., P. M. Wang, and X. H. Zhao. Mechanical behavior and microstructure of cement composites incorporating surface-treated multi-walled carbon nanotubes. Carbon, Vol. 43, No. 6, 2005, pp. 1239–1245.10.1016/j.carbon.2004.12.017Search in Google Scholar
[60] Hou, D., T. Yang, J. Tang, and S. Li. Reactive force-field molecular dynamics study on graphene oxide reinforced cement composite: functional group de-protonation, interfacial bonding and strengthening mechanism. Physical Chemistry Chemical Physics Pccp, Vol. 20, No. 13, 2018, pp. 8773–8789.10.1039/C8CP00006ASearch in Google Scholar
© 2022 Mingrui Du et al., published by De Gruyter
This work is licensed under the Creative Commons Attribution 4.0 International License.
Articles in the same Issue
- Review Articles
- State of the art, challenges, and emerging trends: Geopolymer composite reinforced by dispersed steel fibers
- A review on the properties of concrete reinforced with recycled steel fiber from waste tires
- Copper ternary oxides as photocathodes for solar-driven CO2 reduction
- Properties of fresh and hardened self-compacting concrete incorporating rice husk ash: A review
- Basic mechanical and fatigue properties of rubber materials and components for railway vehicles: A literature survey
- Research progress on durability of marine concrete under the combined action of Cl− erosion, carbonation, and dry–wet cycles
- Delivery systems in nanocosmeceuticals
- Study on the preparation process and sintering performance of doped nano-silver paste
- Analysis of the interactions between nonoxide reinforcements and Al–Si–Cu–Mg matrices
- Research Articles
- Study on the influence of structural form and parameters on vibration characteristics of typical ship structures
- Deterioration characteristics of recycled aggregate concrete subjected to coupling effect with salt and frost
- Novel approach to improve shale stability using super-amphiphobic nanoscale materials in water-based drilling fluids and its field application
- Research on the low-frequency multiline spectrum vibration control of offshore platforms
- Multiple wide band gaps in a convex-like holey phononic crystal strip
- Response analysis and optimization of the air spring with epistemic uncertainties
- Molecular dynamics of C–S–H production in graphene oxide environment
- Residual stress relief mechanisms of 2219 Al–Cu alloy by thermal stress relief method
- Characteristics and microstructures of the GFRP waste powder/GGBS-based geopolymer paste and concrete
- Development and performance evaluation of a novel environmentally friendly adsorbent for waste water-based drilling fluids
- Determination of shear stresses in the measurement area of a modified wood sample
- Influence of ettringite on the crack self-repairing of cement-based materials in a hydraulic environment
- Multiple load recognition and fatigue assessment on longitudinal stop of railway freight car
- Synthesis and characterization of nano-SiO2@octadecylbisimidazoline quaternary ammonium salt used as acidizing corrosion inhibitor
- Perforated steel for realizing extraordinary ductility under compression: Testing and finite element modeling
- The influence of oiled fiber, freeze-thawing cycle, and sulfate attack on strain hardening cement-based composites
- Perforated steel block of realizing large ductility under compression: Parametric study and stress–strain modeling
- Study on dynamic viscoelastic constitutive model of nonwater reacted polyurethane grouting materials based on DMA
- Mechanical behavior and mechanism investigation on the optimized and novel bio-inspired nonpneumatic composite tires
- Effect of cooling rate on the microstructure and thermal expansion properties of Al–Mn–Fe alloy
- Research on process optimization and rapid prediction method of thermal vibration stress relief for 2219 aluminum alloy rings
- Failure prevention of seafloor composite pipelines using enhanced strain-based design
- Deterioration of concrete under the coupling action of freeze–thaw cycles and salt solution erosion
- Creep rupture behavior of 2.25Cr1Mo0.25V steel and weld for hydrogenation reactors under different stress levels
- Statistical damage constitutive model for the two-component foaming polymer grouting material
- Nano-structural and nano-constraint behavior of mortar containing silica aggregates
- Influence of recycled clay brick aggregate on the mechanical properties of concrete
- Effect of LDH on the dissolution and adsorption behaviors of sulfate in Portland cement early hydration process
- Comparison of properties of colorless and transparent polyimide films using various diamine monomers
- Study in the parameter influence on underwater acoustic radiation characteristics of cylindrical shells
- Experimental study on basic mechanical properties of recycled steel fiber reinforced concrete
- Dynamic characteristic analysis of acoustic black hole in typical raft structure
- A semi-analytical method for dynamic analysis of a rectangular plate with general boundary conditions based on FSDT
- Research on modification of mechanical properties of recycled aggregate concrete by replacing sand with graphite tailings
- Dynamic response of Voronoi structures with gradient perpendicular to the impact direction
- Deposition mechanisms and characteristics of nano-modified multimodal Cr3C2–NiCr coatings sprayed by HVOF
- Effect of excitation type on vibration characteristics of typical ship grillage structure
- Study on the nanoscale mechanical properties of graphene oxide–enhanced shear resisting cement
- Experimental investigation on static compressive toughness of steel fiber rubber concrete
- Study on the stress field concentration at the tip of elliptical cracks
- Corrosion resistance of 6061-T6 aluminium alloy and its feasibility of near-surface reinforcements in concrete structure
- Effect of the synthesis method on the MnCo2O4 towards the photocatalytic production of H2
- Experimental study of the shear strength criterion of rock structural plane based on three-dimensional surface description
- Evaluation of wear and corrosion properties of FSWed aluminum alloy plates of AA2020-T4 with heat treatment under different aging periods
- Thermal–mechanical coupling deformation difference analysis for the flexspline of a harmonic drive
- Frost resistance of fiber-reinforced self-compacting recycled concrete
- High-temperature treated TiO2 modified with 3-aminopropyltriethoxysilane as photoactive nanomaterials
- Effect of nano Al2O3 particles on the mechanical and wear properties of Al/Al2O3 composites manufactured via ARB
- Co3O4 nanoparticles embedded in electrospun carbon nanofibers as free-standing nanocomposite electrodes as highly sensitive enzyme-free glucose biosensors
- Effect of freeze–thaw cycles on deformation properties of deep foundation pit supported by pile-anchor in Harbin
- Temperature-porosity-dependent elastic modulus model for metallic materials
- Effect of diffusion on interfacial properties of polyurethane-modified asphalt–aggregate using molecular dynamic simulation
- Experimental study on comprehensive improvement of shear strength and erosion resistance of yellow mud in Qiang Village
- A novel method for low-cost and rapid preparation of nanoporous phenolic aerogels and its performance regulation mechanism
- In situ bow reduction during sublimation growth of cubic silicon carbide
- Adhesion behaviour of 3D printed polyamide–carbon fibre composite filament
- An experimental investigation and machine learning-based prediction for seismic performance of steel tubular column filled with recycled aggregate concrete
- Effects of rare earth metals on microstructure, mechanical properties, and pitting corrosion of 27% Cr hyper duplex stainless steel
- Application research of acoustic black hole in floating raft vibration isolation system
- Multi-objective parametric optimization on the EDM machining of hybrid SiCp/Grp/aluminum nanocomposites using Non-dominating Sorting Genetic Algorithm (NSGA-II): Fabrication and microstructural characterizations
- Estimating of cutting force and surface roughness in turning of GFRP composites with different orientation angles using artificial neural network
- Displacement recovery and energy dissipation of crimped NiTi SMA fibers during cyclic pullout tests