Evaluation of wear and corrosion properties of FSWed aluminum alloy plates of AA2020-T4 with heat treatment under different aging periods
-
Mohammed Yunus
 and
Turki Alamro
and
Turki Alamro

Abstract
Aluminum alloy AA2020 has a greater demand for the high strength-to-weight ratio used in applications like aerospace, naval, and automotive applications because heat treatment produces high strength. Friction stir welding (FSW) is widely employed in forming butt joints of AA2020-T4 using a square profile tool. In this work, the wear characteristics and the corrosion behavior with and without age-hardened treatment are studied and compared. In this work, the wear characteristics and the corrosion behavior with and without age-hardened treatment (after a 1-hour solution treatment of AA2020 alloy at 505°C, quenched in water at ambient temperature) are studied and compared. Age-hardened models with a high aging duration (16–20 h) at 177°C showed a reduction in wear resistance for low spindle speed in contrast to the as-FSWed joints. In the corrosion medium, long aging time heat-treated FSWed joints showed high passivity in a 3.5 wt% NaCl solution. Intergranular and pitting types of corroded surfaces in as-FSWed joints were spotted. 20 h of age-hardened FSWed joints achieved the minimal corrosion rate (CR) and is suggested for moderate wear resistance and good CR. The speed appears to have a greater impact on wear rate than the weld speed and applied load. It is also worth noting that the CR increases by 5% with the increasing spindle speed and falls by 4% with the increasing weld speed.
1 Introduction
Aluminum is the most used nonferrous metal possessing a density of 2.7 g·cm−3 exhibiting good machinability, electrical and thermal conductivities, and resistance to atmospheric corrosion (forms oxide layer). Al and its alloys have a high strength-to-weight ratio because of their low density. Hence, these materials are commonly utilized in automotive and aerospace applications where weight savings are desired for enhanced performance and fuel efficiency. Aluminum alloys are quite often welded than any other types of nonferrous alloys because of their noble weldability and widespread applications [1]. The optimization of wear resistance (WR) of FSWed dissimilar Al alloy (AA6351-T6 and AA5086-H111) decreased with the increase in the spindle speed (SS) [2]. On a sliding track with a high constant load, low rotating speed, and sliding speed, the WR) of prismatic pins of AA 6061-T6 surface hybrid composites [(SiC + Gr) & (SiC + Al2O3)] manufactured by friction stir welding (FSW) was found to be high [3].
Heat-treatable Al alloy in particular can benefit from a proper aging procedure. As a result, different investigations addressed the artificial aging process of aluminum alloys. It used classic and electric heating to artificially age AA6082 and AA7075 alloys to make cost effective in obtaining improved properties [4]. As heat-treatable alloys, an electric heating strategy to artificially age AA5083 and AA2024 for dissimilar and comparable 2xxx series has largely used in the aerospace and automotive sectors [5]. AA2xxx series utilize their copper as the alloying element during age hardening (AH). Hardness is widely recognized as the primary criterion for evaluating material wear behavior required for the estimation of the life of construction equipment, and otherwise, it would become obsolete due to wear [6]. AA2xxx group of alloy’s hardness raised by AH, resulting in a well-organized precipitated configuration. As a result, WR was enhanced under the combination of input parameters [7]. In an aqueous media containing chloride ions, intermetallic copper compositions (like Al2Cu and Al2CuMg) enhance the sensitivity of the AA 2xxx to localized crevice corrosion (pitting) and oxidation [8].
Anodic polarization curves of FSWed Al alloys AA2024 and AA2195 revealed that in a corrosive media of the NaCl solution, the corrosive potentials of the base material and the FSW regions appeared to be the same [9]. The galvanic response of Al alloys revealed that exalted particles with electrocatalytic activity, such as Al2Cu, which can tolerate significant cathodic currents, are related to pitting [10]. Pit corrosion at different locations (topmost, middle, and base) of the weldment zone in the FSW joints of AA2219-O in an alkali chloride solution revealed that the topmost one has the largest corrosion potential when compared to the base and base metal [11]. Pitting corrosion characteristic of the FSWed joint of AA2024-T3 was discovered in the areas between the S phase (Al2CuMg) particles and the surrounding Al base [12]. The corrosion susceptibility of FSWed joints of the alloy AA2024-T3 demonstrated that the HAZ area is more reactive to intergranular and pitting corrosion than the rest of the joint [13]. The corrosion behavior of AA6061 joints fabricated using FSWed and gas tungsten arc welding (GTAW) revealed that the FSW grains are more corrosion resistant than the GTAW grains [14]. The T6 treatment has also been found to increase corrosion resistance in both welds [15]. The free corrosion potential is higher anodic for the low hardness sections according to the corrosion behavior of FSWed of AA2024 and AA7075. As a result of the potential difference, galvanic corrosion occurred in the less precious region [16].
The highest allowable formability in customized blank AA6061 plates joined by the FSW using the incremental sheet forming process was determined to be conical geometry (both numerically and experimentally), and the forming limit angles for the base material and the FSWed sheet were estimated to be 60° and 57.5°, respectively. Increased minor strain, strain variation, and thickness distribution in welded sections, especially near the base metal area, are all factors that contribute to failure in FSWed samples [17]. Because of the effect of AA2024-T3 AH on the hardness of the stir zone in the FSWed joints of the AA2024-T3, the hardness of the stir zone has diminished owing to over aging [18]. However, the heat treatment methods used in each study differed, and there is only a limited amount of research on the effect of AH on the corrosion rate (CR) of 2xxx series aluminum alloys. AH’s influence on the characteristics of FSWed AA6061, AA2024, and AA2010 joints was examined using solutionizing temperatures of 520, 540, and 560°C, followed by aging at 175 or 200°C on tensile strength. For higher SS, the heat-treated samples had a higher tensile strength than the as-welded samples. Due to the high heat input during welding and the coarsening of precipitates, the heat treatment approach has a somewhat negative influence on the tensile strength of samples with lower SS. The hardness profile shows that, regardless of the treatment parameters, increasing the soaking time during aging within limits enhanced the hardness values of the samples. The Tafel graphs show that the aged samples had higher passivity than the unaged ones [19].
The influence of AH on the tensile characteristics of AA6061 FSW joints was investigated. The augmented aging treatment is shown to be more effective than the solution treatment in enhancing the tensile strength [20]. The impact of AH on the mechanical behavior of FSWed AA2024-T4 alloy joints was investigated. The T6 aging treatment improved the mechanical qualities of the AA2024-T4 joints, according to researchers [12,21]. The microstructure and mechanical characteristics of AA7039 alloy post-weld heat-treated FSW joints were investigated. It has been discovered that naturally aged joints have the highest mechanical qualities, while AH-treated joints have the lowest mechanical characteristics [21]. The effect of AH treatments on the morphological and mechanical characteristics of AA6082, an FSWed alloy, was investigated. It was discovered that samples welded at slower speeds countered to AH more than models FSWed at faster speeds. It has also been discovered that with the right AH therapy, the strength and hardness may be partially restored [22].
According to the literature review, the corrosion behavior and wear parameters of the FSWed alloy of AA2020 before and after AH and the impact of AH on the aging period have not been explored. The purpose of this study is to observe how different FSW process parameters affect the wear rate and corrosion features of FSWed joints made of AA2020-T6 alloy and to see observe different curing periods and post-AH techniques affect the wear rate and corrosion features of AA2020-T6 FSW joints. The corrosion behavior will also be described using microstructures and Tafel graphs.
2 Materials and methods
The Al alloy AA2020-T6 plates are tested for their configuration before FSWed. The configuration of the alloy in wt% is found to comply with the specifications. The composition in wt% of the various elements present in the alloy having 93.80 (Al), 0.008 (Cr), 3.96 (Cu), 0.56 (Mg), 0.48 (Mn), 0.67 (Si), 0.066 (Ti), 0.16 (Fe), and 0.057 (Zn). The 6 mm thick plates are cut to 100 × 50 mm dimensions and welded using an FSW machine with a tool rotational speed of 750–1,350 rpm (capacity of 3,000 rpm), a weld speed (WS) of 25–45 mm·min−1 (maximum of 200 mm·min−1), and an axial load (AL) of 10–14 kN (maximum of 20 kN). The FSW tool is built of H13 tool steel with a square-shaped pin that measures 5.5 mm in length and 18 mm in diameter and is inclined to 20° during welding. The plates are joined in a direction that is perpendicular to the plate’s rolling direction. Mechanical clamps hold the Al alloy plates against the backing plate [23].
FSWed joints were cut into specimens and prepped for morphology studies, wear behavior, and corrosion trials (see Figure 1). The pin-on-disc apparatus was used to evaluate the dry sliding wear behavior of the FSW joints of the alloy AA2020-T6. An electrochemical approach was used to assess the corrosion properties of the joints. Before the aging process begins, the microstructural features of the joints must be analyzed using scanning electron microscopy, as well as wear rate assessments. For various aging periods, the AH treatment of the FSW joints of the alloy AA2020-T6 was performed by subjecting them to 1-hour solutionizing at 505°C and then kept for aging for 8, 10, 16, and 20 h at 175°C. A dilute mixture (10 g NaOH with 50 mL deionized water) was used to etch polished specimens, which were then examined through a scanning electron microscopy (SEM).
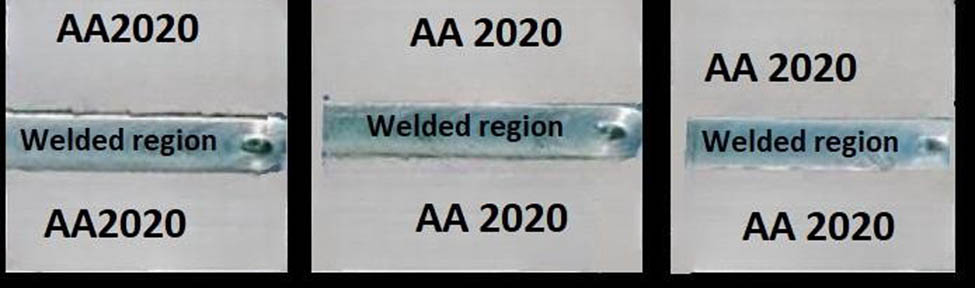
Friction stir welded samples.
2.1 Wear test apparatus and specimen preparation
Wear testing is carried out using a pin-on-disc machine and extracted wear test specimens, as shown in Figure 2. This equipment is used to test the wear and friction properties of materials that are exposed to sliding contacts in either dry or lubricated configurations. The disc is rotated against a fixed pin, while the load, disc speed, and track diameter are varied throughout the wear test. It complies with the ASTM G99 standard. For testing, an FSWed sample with a 3 mm2 and a 30 mm height is employed. As a counterpart, a disc with a thickness of 12 mm and a diameter of 150 mm is employed. With different forces, the pin is forced against the disc. A sliding rate of 1.5 m·s−1, a track diameter of 10 cm, and 1.8 km were used for a test. The weight loss technique is used to calculate the wear rate in mm3·min−1. Figure 3 shows the extracted wear test specimens.
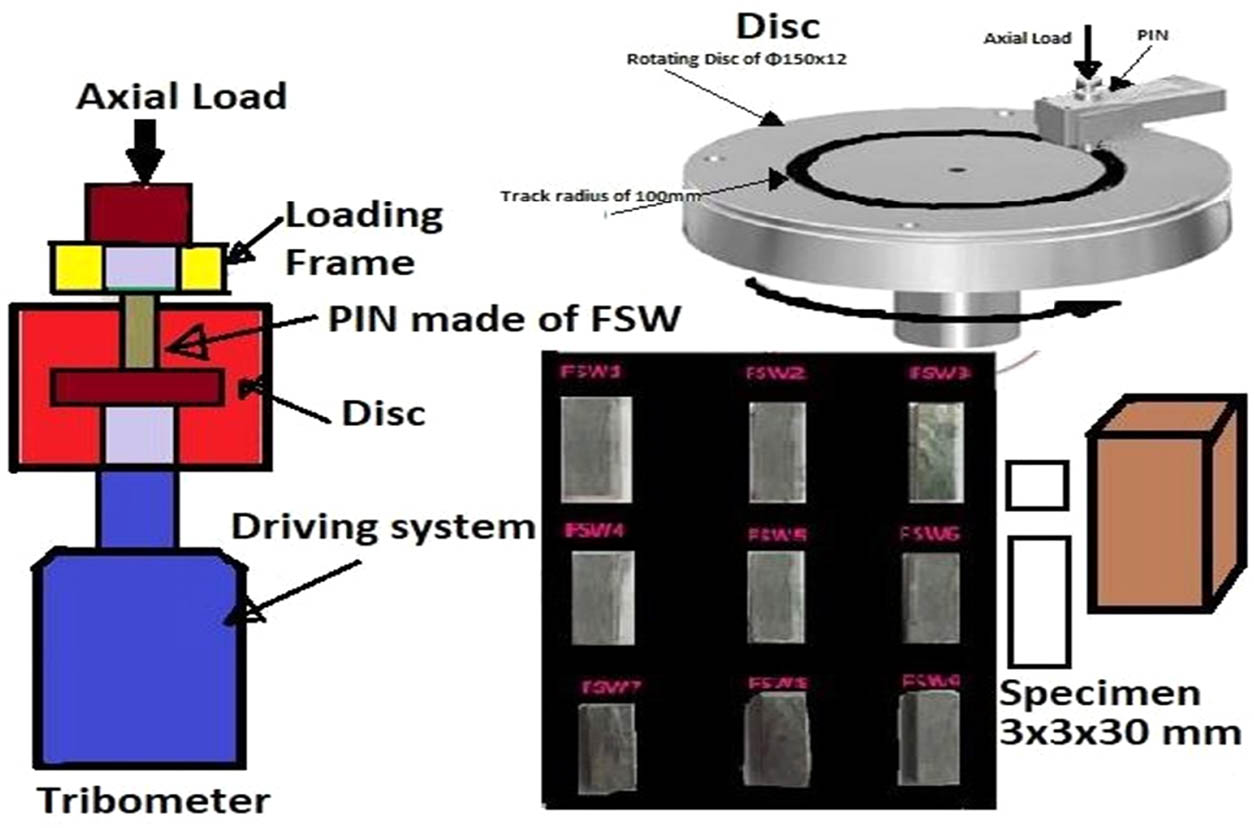
Pin-on-disc wear testing machine with counter disc and extracted wear test specimens.
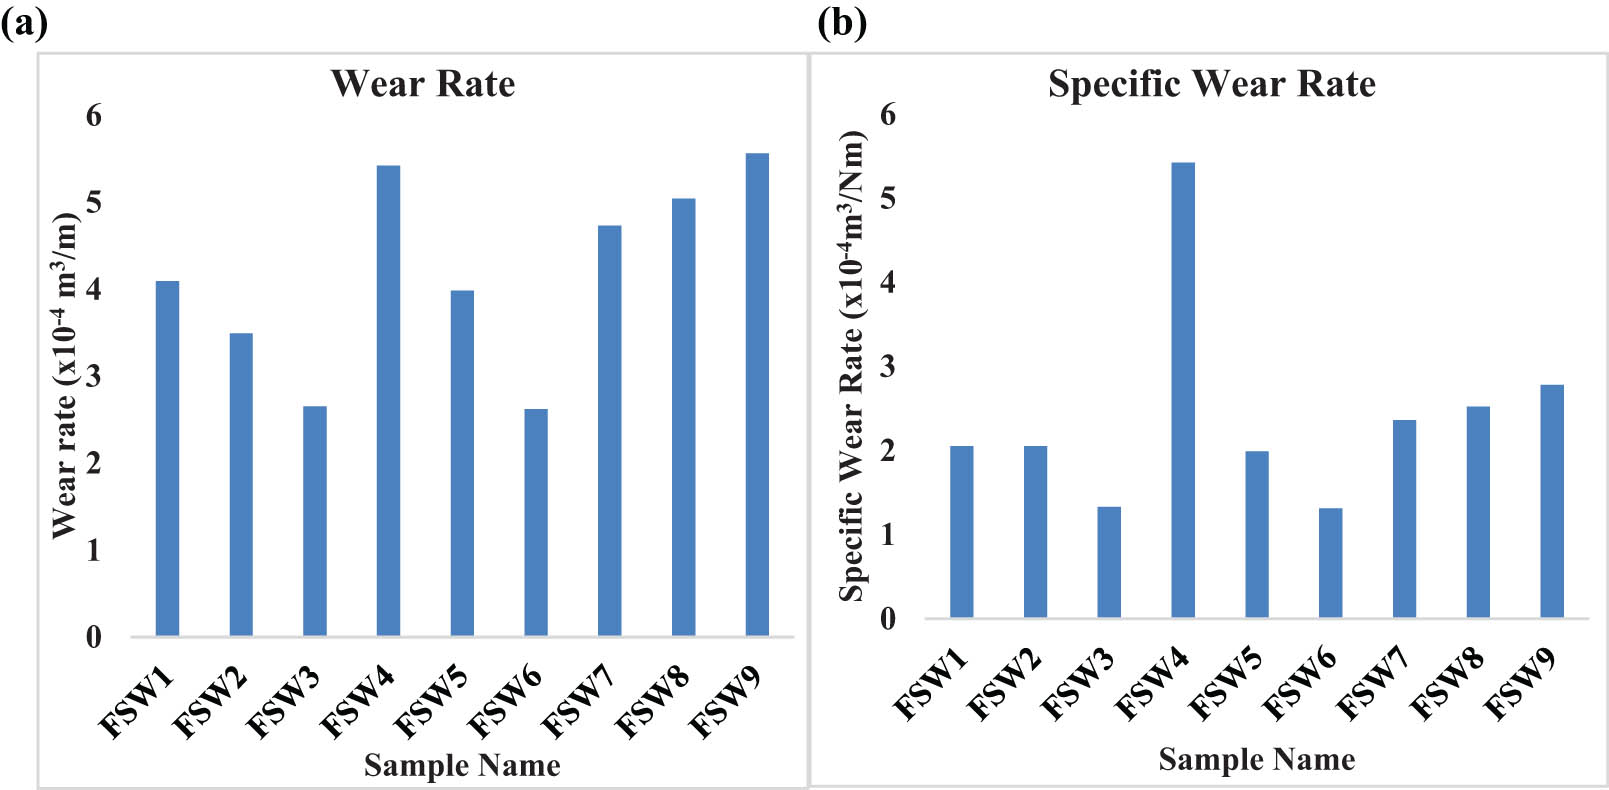
(a) Wear rates and (b) specific rates of the samples.
Before and after each trial, the wear area of the FSWed specimens and the wear track are cleaned with acetone and weighed with a microbalance (with an accuracy of +0.0001 g). By keeping the test settings constant, the operation is repeated for all the samples. The average mass losses are used to compute the wear rates of the samples, which are provided in equation (1), and the specific wear rates, given in equation (2).
where ML = mass loss in g, ρ = density (2.8 g·cm−3), and SD = sliding distance (1,500 m).
2.2 Corrosion test
Polarization resistance is one of the electrochemical measurement methods to assess the CR of FSWed models. The current output is assessed after the models are polarized for a few millivolts on and near the open-circuit potential (OCP). The open-circuit voltage (OCV) is the potential of the working electrode with respect to the reference electrode when no potential or current is provided to the cell [24].
The specimens’ surfaces (as weld and heat treated) polished with SiC papers (graded 100–1,200 μm) and then cleaned in deionized water. The corrosion test is performed in a 3.5% NaCl solution using a “Metrohm DropSens Potentiostat” and the linear polarization resistance technique. In this experiment, the reference electrode is an Ag/AgCl electrode, with which all potential data are compared. A platinum wire loop serves as the counter electrode, while the welded sample serves as the working electrode.
The Al alloy plates are welded in a butt configuration with the following process parameters. Several trial welds have been carried out to arrive at the parameters for the investigation. The welds produced with speeds beyond 45 mm·min−1 are found to have tunnel defects and cracks; hence, the WS is limited to 45 mm·min−1. Similarly, the SS is limited to a maximum value of 1,350 rpm. The samples with respect to values of process parameters are presented in Table 1. The tool is inclined at 200 during the FSW operation with other tool parameters such as the tool shape, pin length, and shoulder diameter is kept constant throughout the experiment. The CR is determined using the I corr value using equation (3).
Corrosion specimen details
| Sample No. | Spindle speed (rpm) | Welding speed (mm·min−1) | Axial load (kN) |
|---|---|---|---|
| FSW1 | 750 | 25 | 10 |
| FSW2 | 750 | 35 | 12 |
| FSW3 | 750 | 45 | 14 |
| FSW4 | 1,000 | 25 | 10 |
| FSW5 | 1,000 | 35 | 12 |
| FSW6 | 1,000 | 45 | 14 |
| FSW7 | 1,400 | 25 | 10 |
| FSW8 | 1,400 | 35 | 12 |
| FSW9 | 1,400 | 45 | 14 |
3 Results and discussion
3.1 Wear test
Table 2 shows the average mass loss, wear rate, and specific wear rate of the specimens in the three sets of the samples to improve the measurements.
Average mass loss, wear rate, and specific wear rate of specimens
| Sample ID | Mass loss (g) | Average mass loss (g) | Wear rate (m3·m−1) | Specific wear rate (m3·Nm−1) | ||
|---|---|---|---|---|---|---|
| First set of specimens | Second set of specimens | Third set of specimens | ||||
| FSW1 | 0.89498 | 1.29466 | 1.0613 | 1.08364 | 4.09 × 10⁻³ | 2.05 × 10⁻⁴ |
| FSW2 | 0.89974 | 1.00795 | 0.8561 | 0.92127 | 3.49 × 10⁻³ | 2.05 × 10⁻⁴ |
| FSW3 | 0.87493 | 0.7693 | 1.2104 | 0.9515 | 2.65 × 10⁻³ | 1.33 × 10⁻⁴ |
| FSW4 | 1.00837 | 1.00470 | 1.41243 | 1.14183 | 5.42 × 10⁻³ | 5.42 × 10⁻⁴ |
| FSW5 | 1.10225 | 1.02372 | 1.24191 | 1.12263 | 3.98 × 10⁻³ | 1.99 × 10⁻⁴ |
| FSW6 | 1.01776 | 1.18393 | 0.94614 | 1.04928 | 2.62 × 10⁻³ | 1.31 × 10⁻⁴ |
| FSW7 | 1.00613 | 0.86769 | 1.18355 | 1.01912 | 4.73 × 10⁻³ | 2.36 × 10⁻⁴ |
| FSW8 | 1.2719 | 1.35129 | 1.14927 | 1.2575 | 5.04 × 10⁻³ | 2.52 × 10⁻⁴ |
| FSW9 | 1.23846 | 0.86585 | 1.35276 | 1.15235 | 5.56 × 10⁻³ | 2.78 × 10⁻⁴ |
Figure 3(a) and (b) illustrate the variance in wear rate and specific wear rate of the as-FSWed samples, respectively. The wear rate changes dramatically with the modification in weld settings, as shown in the figures. The wear rate of low SS (750 rpm) welded specimens ranges from 4.09 × 10⁻³ to 2.65 × 10⁻³ mm3·m−1. For low and medium SS, the wear rate steadily reduces as the WS increases (1,100 rpm). When comparing the wear rates of the FSWed samples with high SS (1,350 rpm) to the other samples with different WS, the wear rates of the FSWed samples with high SS (1,350 rpm) are greater. The sample FSW8 has the maximum wear rate (2.995 × 10⁻³ mm3/m). The sample FSW6 (2.62 × 10⁻³ mm3/m) has the least wear rate. The wear rate of FSWed samples with high SS of 1,350 rpm (i.e., samples FSW7 to FSW9) does not show enough variation in trend, but it does in samples with an SS of 1,350 rpm. As a result, the influence of weld process parameters on wear rate was investigated.
According to the findings, the SS is the most important FSW element in determining the wear rate, followed by the AF and finally the WS.
3.2 Wear morphology
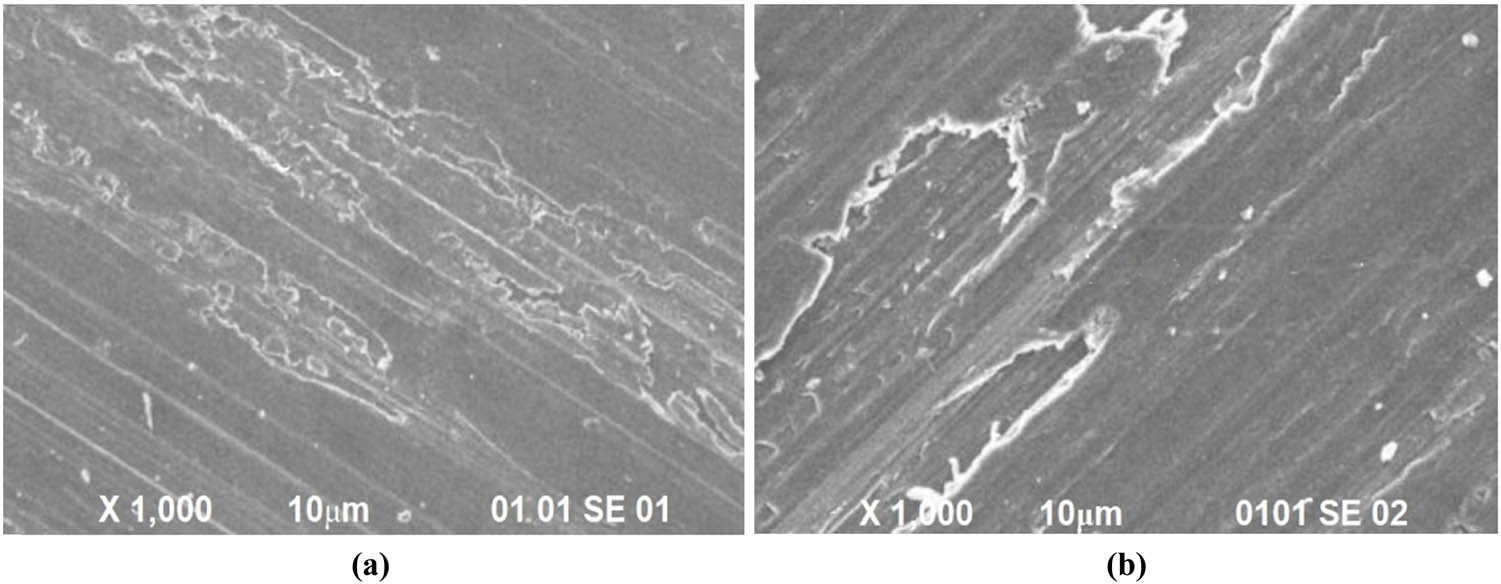
SEM images of the wear samples FSW1 and FSW9 after the dry sliding wear test are shown in Figure 4a and b, respectively. In the SEM pictures of sample FSW1, the presence of microscopic wear debris particles suggests a reduced wear rate. In the SEM pictures of sample FSW9, the presence of large wear waste particles suggests a high wear rate.
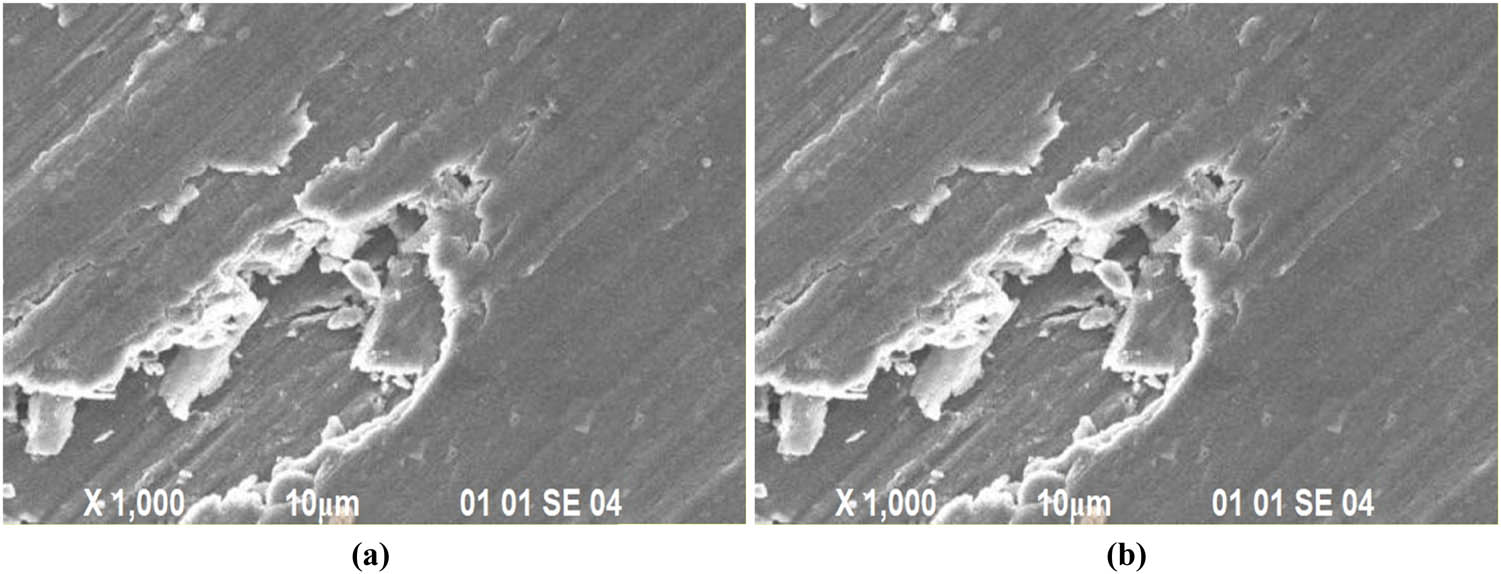
Wear morphology of samples (a) FSW1 and (b) FSW9.
Increased strain hardening capacity of the material by demonstrating maximal hardness on the worn surface resulted in little wear loss in the case of greater aging FSWed samples. After a lengthy period of the heat treatment, the wear rate can be lowered (16–20 h) Due to strain hardening on a surface during cyclic loading of worn surfaces, surface oxidation occurs when a substance’s stored energy increases, thus increasing the WR [25]. As demonstrated in the overaged sample, strain hardened metal with a high point defect density is more activated on the surface chemically, making it more susceptible to oxidation under wear test and decreasing the frictional force. Al2O3 is formed on worn surfaces not only as a result of metallic surface oxidation but also as a result of alumina ball particles that have been removed [26].
On the wear-out surface of 16- and 20-hour-old models, there were continuous scratches. The wear track of specimens aged for 16 and 20 hours shows a clear separation between the aluminum matrix and the worn surface. Conversely, along the wear track boundary of the overaged sample, there are remnants of cold deformed material (see Figure 5a and b).
Wear morphology of samples (a) AH1 and (b) AH12.
3.3 Corrosion characteristics and morphology of as-FSWed samples and base metal
Electrochemical testing provides the results of CRs of FSWed models. The polarization test is used to measure the CRs of as-FSWed samples. The electrochemical analyzer uses the Tafel plots acquired from the polarization test to determine/investigate the influence of process factors on the CR. When the Tafel plot of the base metal with CP is compared to the FSWed samples FSW1, FSW2, and FSW3, the corresponding corrosion current (5.8 × 10⁻³ A) values are −5.2 × 10⁻¹, −6.2 × 10⁻¹, −4 × 10⁻¹, and −5.4 × 10⁻¹ V, respectively (Figure 6). The polarizations, (both cathodic and anodic) are more uniform. For FSWed samples FSW4 to FSW6, the CP from the Tafel plot (see Figure 7) is −5.3 × 10⁻¹, −5.6 × 10⁻¹, and −5.8 × 10⁻¹ V, respectively, with a corresponding current of 3.42 × 10⁻³ A. Similarly, the corrosion potential for FSWed samples FSW7–FSW9 is determined to be −5.5 × 10⁻¹, −5.8 × 10⁻¹, and −6 × 10⁻¹ V, respectively, with a CC of 4.34 × 10⁻³ A, according to the Tafel plot (Figure 8). The joint should have lower CR values. The CR dropped as SS and WS increased, as can be seen from the major impact. The CR shows that as the axial force increases, so does the CR. The WS is the most affecting element in determining the CR, followed by the SS and finally the AL, according to graphs.
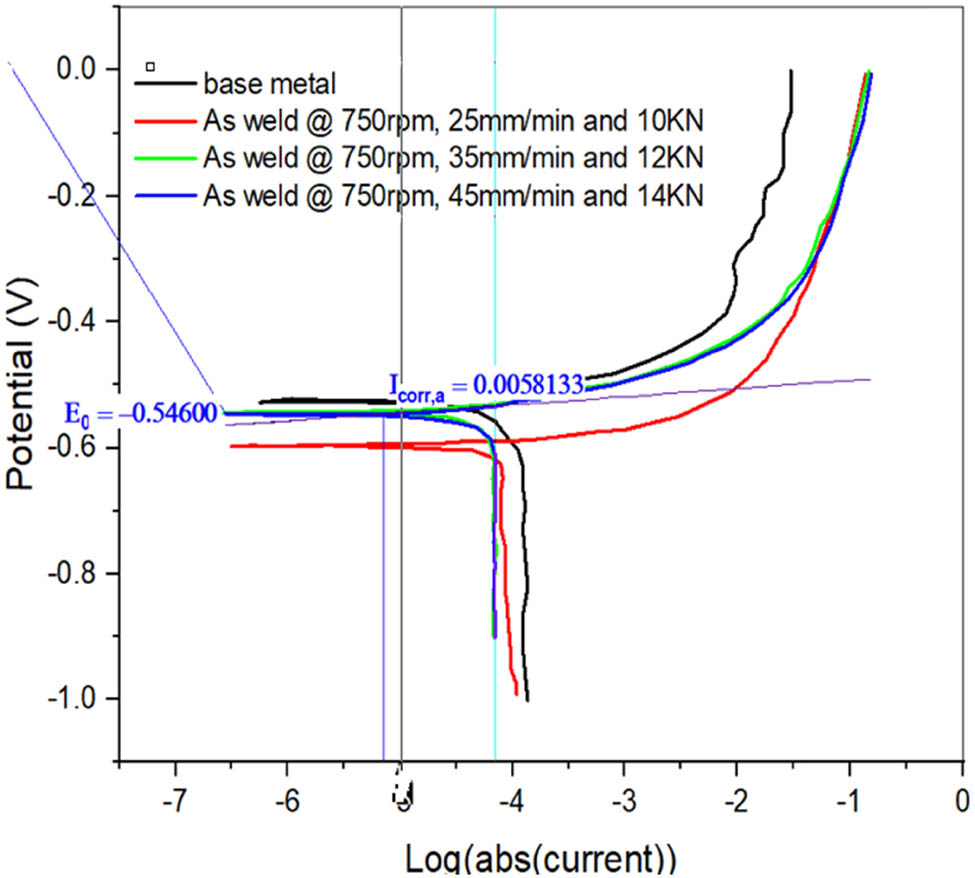
Tafel plots of base metal and FSW1 and FSW2.
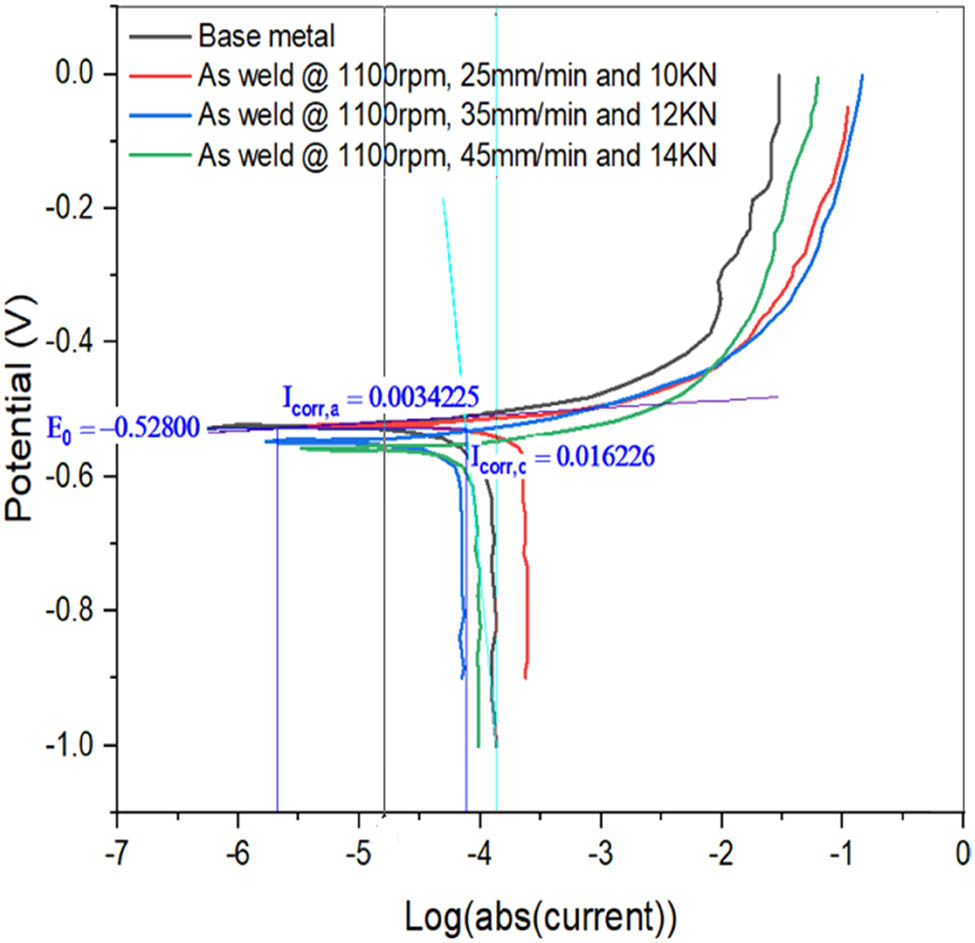
Tafel plots of base metal and FSW4, and FSW3 samples FSW5, and FSW6 samples.
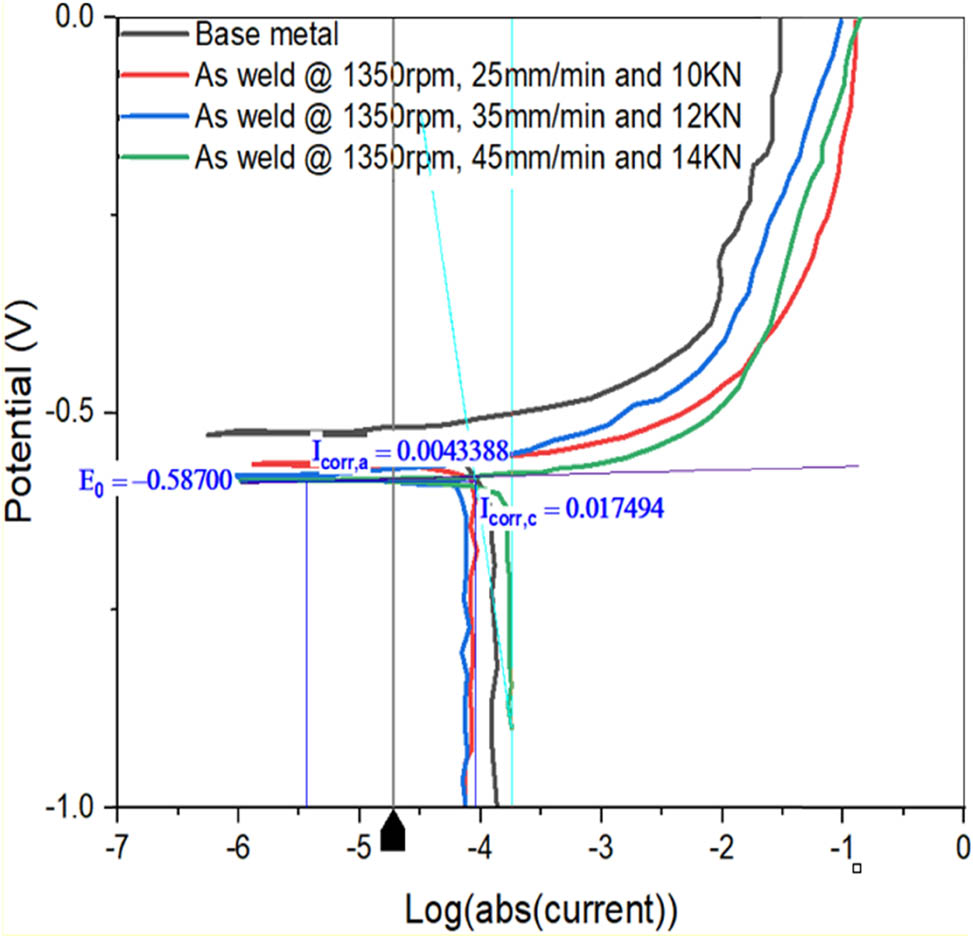
Tafel plots of base metal and FSW7, FSW8, and FSW9 samples.
Figure 13 shows the corrosion features of the corroded specimens as seen through SEM images. Pitting corrosion has occurred in regions surrounding the weld zone or secondary particles generated at the welding boundary of comparable Al alloys, as seen in the image. Cracks were also discovered in the pit region’s particles. It can be linked to the specimen FSW1, which is smaller than the other samples, with a CR of 1,208 mil per year (refer to Table 3). The SEM photos of the specimen FSW9’s corroded layer. Pitting dots can be seen in the picture, and the density of these spots is higher than that seen in the bottom layer of the specimen FSW1. There are oxide surfaces and ploughing of metals seen in the picture, which may have been produced during the welding process and corrosion testing. The sample’s CR is found to be 1,523 mil per year, which is greater. Due to cathode side precipitates, the Al2Cu phase forms, which increases the oxidation of Al and the creation of corrosion crevices, whereas Al2 CuMg tends to precipitate at the grain boundary, resulting in a copper-deficient zone and both have anodic properties promoting intergranular corrosion in the overaged sample due to coarsened Al2CuMg [27].
CR of different samples
| Sample types | CR (mil per year) |
|---|---|
| FSW1 | 1208.4996 |
| FSW2 | 1248.2844 |
| FSW3 | 1294.8936 |
| FSW4 | 1374.0276 |
| FSW5 | 1395.372 |
| FSW6 | 1420.3464 |
| FSW7 | 1509.9348 |
| FSW8 | 1521.696 |
| FSW9 | 1523.0028 |
3.4 Effect of precipitation hardening on corrosion characteristics
The study used aluminum alloy plates welded with three different SS, WSs, and axial stresses. Other factors such as axial force, tool tilt angle, and tool dimensions are maintained constant to examine the influence of the AH with aging, and the number of variable parameters is kept at two levels to study the effect of the AH treatment. Table 4 presents the procedure parameters as well as the corresponding sample identification.
Sample ID for different process parameters
| Spindle-Speed (rpm) | Welding-Speed (mm·min−1) | Axial-Load (kN) | Sample designation for various age hardened periods | |||
|---|---|---|---|---|---|---|
| 8 h | 10 h | 16 h | 20 h | |||
| 750 | 25 | 10 | AH1 | AH2 | ||
| 750 | 35 | 12 | AH3 | |||
| 750 | 45 | 14 | AH4 | |||
| 1,100 | 25 | 10 | AH5 | AH6 | ||
| 1,100 | 35 | 12 | AH7 | |||
| 1,100 | 45 | 14 | AH8 | |||
| 1,350 | 25 | 10 | AH9 | AH10 | ||
| 1,350 | 35 | 12 | AH11 | |||
| 1,350 | 45 | 14 | AH12 | |||
3.4.1 Open circuit potential (polarization curve – TAFEL plot)
In the weld section, Figure 9 displays the OCP curve for models AH5 to AH8 (i.e., at 1,100 rpm, 25–45 mm·min−1, AH treated).
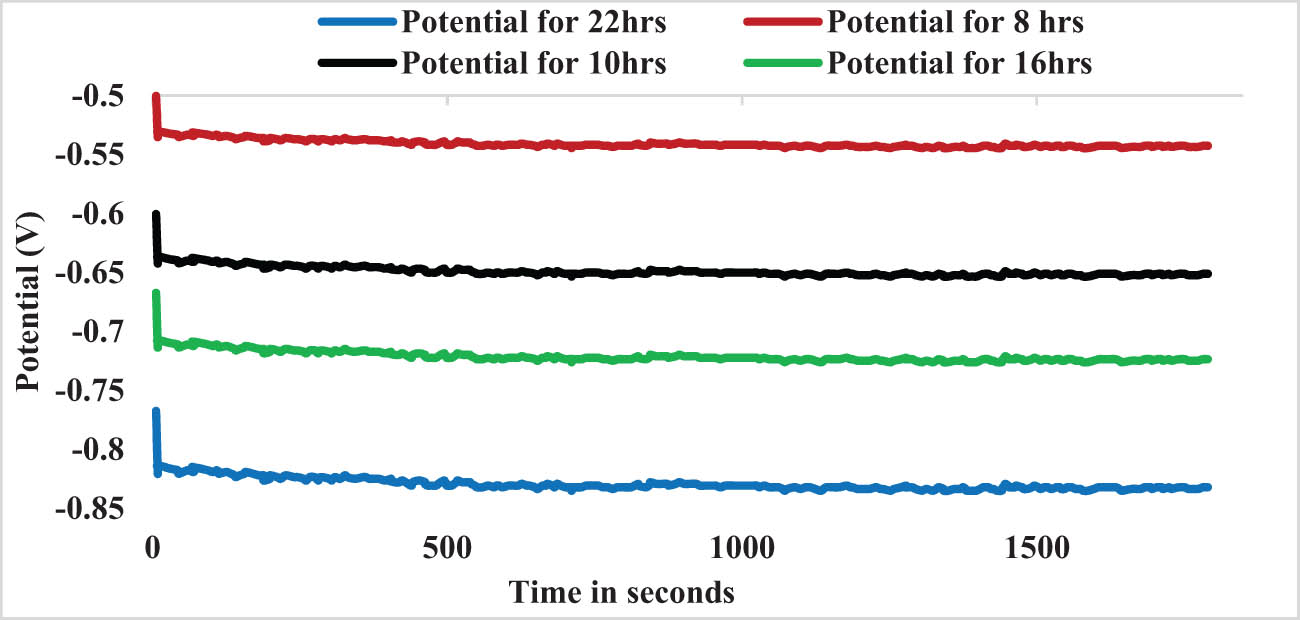
OCV plot for sample AH5 TO AH8.
During the first several minutes following immersion, the OCV varies, but it finally settles down. For AH6, AH7, AH8, and AH9, the OCV of the specimens is −0.5 to −0.55 V, −0.6 to −0.64 V, −0.66 to −0.73 V, and −0.76 to −0.83 V, respectively. OCV graphs, demonstrating the dissolving tendency of 22- and 18-hour-aged specimen with negative affective OCV (approximately −0.83 and −0.73 V). The OCV of 8- and 10-hour aged specimens is about −0.52 and −0.62 V, respectively, indicating that these specimens are less corrode prone (Figure 10).
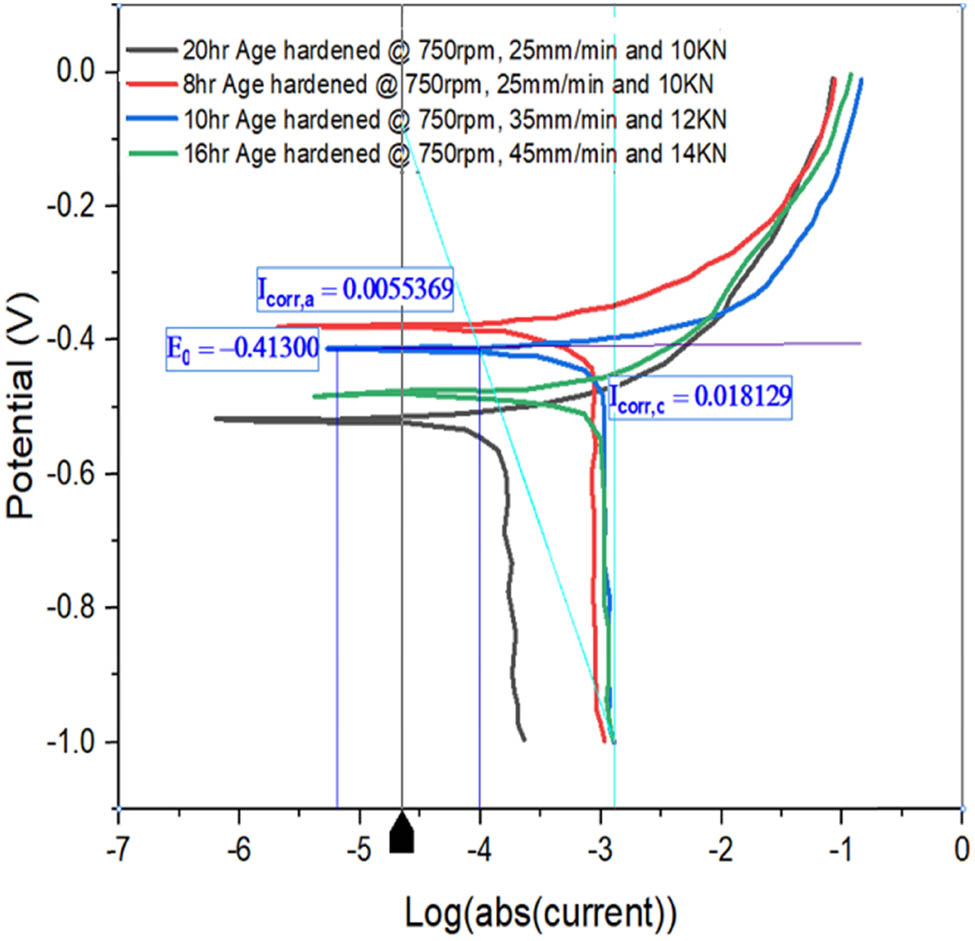
Tafel plot for AH1, AH2, AH3, and AH4.
Figure 10 depicts the Tafel plots of samples AH1, AH2, AH3, and AH4. All of the specimens’ potential dips are between −0.46 and −0.52 V, as shown in the graph. Sample AH1 has a corrosion current of 0.01813 A, which is less than the other samples. Sample AH1 has a CR of 1,886 mils per year, which is lower than samples AH2, AH3, and AH4. CRs grow with age.
Figure 11 shows a Tafel graph of specimens AH5, AH6, AH7, and AH8. All of the specimens’ potential drops are between −0.38 and −0.50 V, as shown in the graph. Sample AH8 has a corrosion current of 0.006898 A, which is smaller than the other specimens. Sample AH5 has a CR of 2,391 mils per year, which is lower than samples AH6, AH7, and AH8.
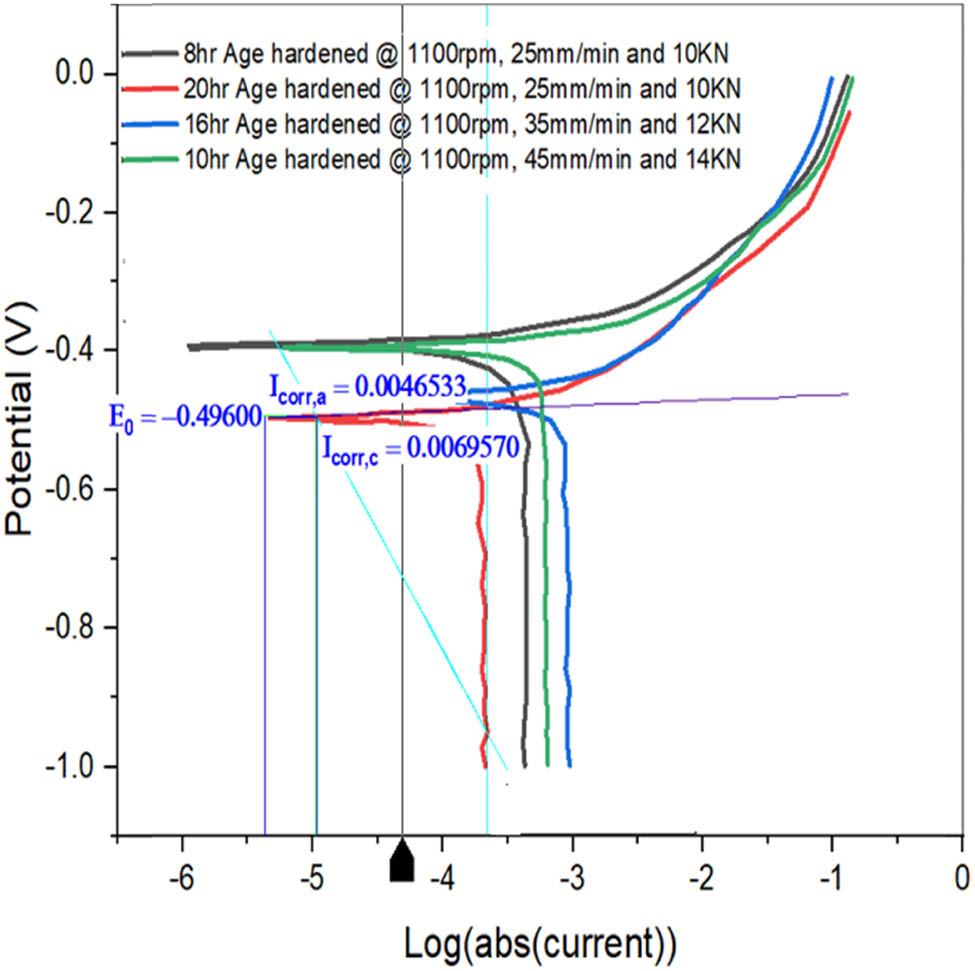
Tafel plot for samples AH5, AH6, AH7, and AH8.
Figure 12 depicts a Tafel diagram of the specimens AH9, AH10, AH11, and AH12. As shown in the graph, all of the samples’ probable dips would be between −0.4 and −0.5 V. Sample AH12 has a corrosion current of 0.7733 A, which is lower than the other samples. Sample AH9 has a CR of 1,627 mils per year, which is lower than samples AH10 to AH12. In all situations, high-aging FSWed models exhibited a greater CR when compared to various SS, WS, and AL.
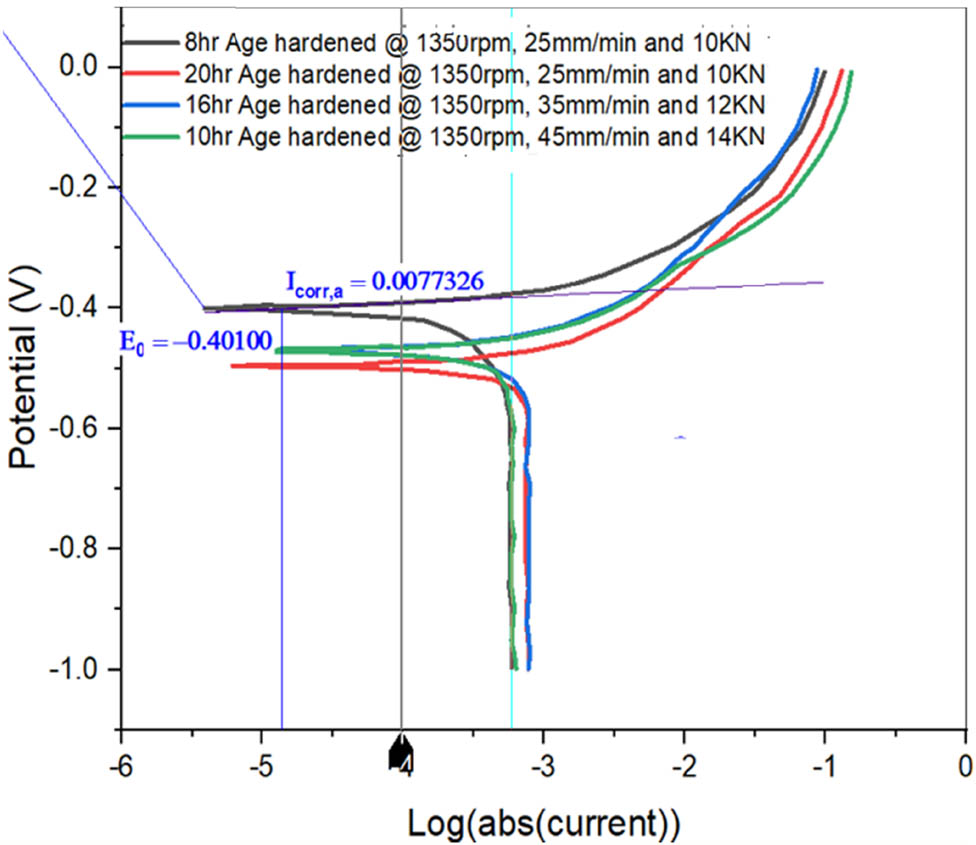
Tafel plot for AH9, AH10, AH11, and AH12 samples.
The CRs of aged FSWed samples are present in Table 5. The CRs are calculated using Tafel plots and the software’s analytical capabilities. The results demonstrate that AH FSWed models are more resistant to the specified corrosive media for practically all machining parameters. Increasing the aging period, on the other hand, increased the corrosion current and, as a result, the CR.
CR of welded samples
| Sample designations | CR (mil per year) |
|---|---|
| AH1 | 1886.12 |
| AH2 | 4627.46 |
| AH3 | 7916.58 |
| AH4 | 10550.56 |
| AH5 | 2391.2 |
| AH6 | 2542.48 |
| AH7 | 5917 |
| AH8 | 6988.16 |
| AH9 | 1627.48 |
| AH10 | 4801.92 |
| AH11 | 5904.8 |
| AH12 | 6564.82 |
3.4.2 Microstructural examination
Because the cumulative impact of intergranular with crevice (pitting) corrosion is the primary corrosion process, the high aging sample (20–18 h) showed the highest CR, while pitting corrosion was the predominant problem in the 16 and 10 h aged FSWed sample (Figure 13). Nonetheless, as observed in SEM pictures, pitting corrosion affected the overaged sample more than the 8- and 10-hour aged sample. In conclusion, the maximum CR of 6564.82 mil per year as predicted by the OCP value is seen in the 20-hour aged sample, whereas the lowest CR of 5904.8 mil per year is observed in the 18-hour aged sample with peak strength (Table 5). Because artificial aging lowers intergranular corrosion susceptibility, attaining peak strength reduces intergranular corrosion susceptibility. Controlled aging close to threshold strength inhibits the formation of the copper-deficient sector by blocking the precipitation of coarse Al2CuMg phase at the grain boundary. As a result, intergranular corrosion may be effectively managed [28].
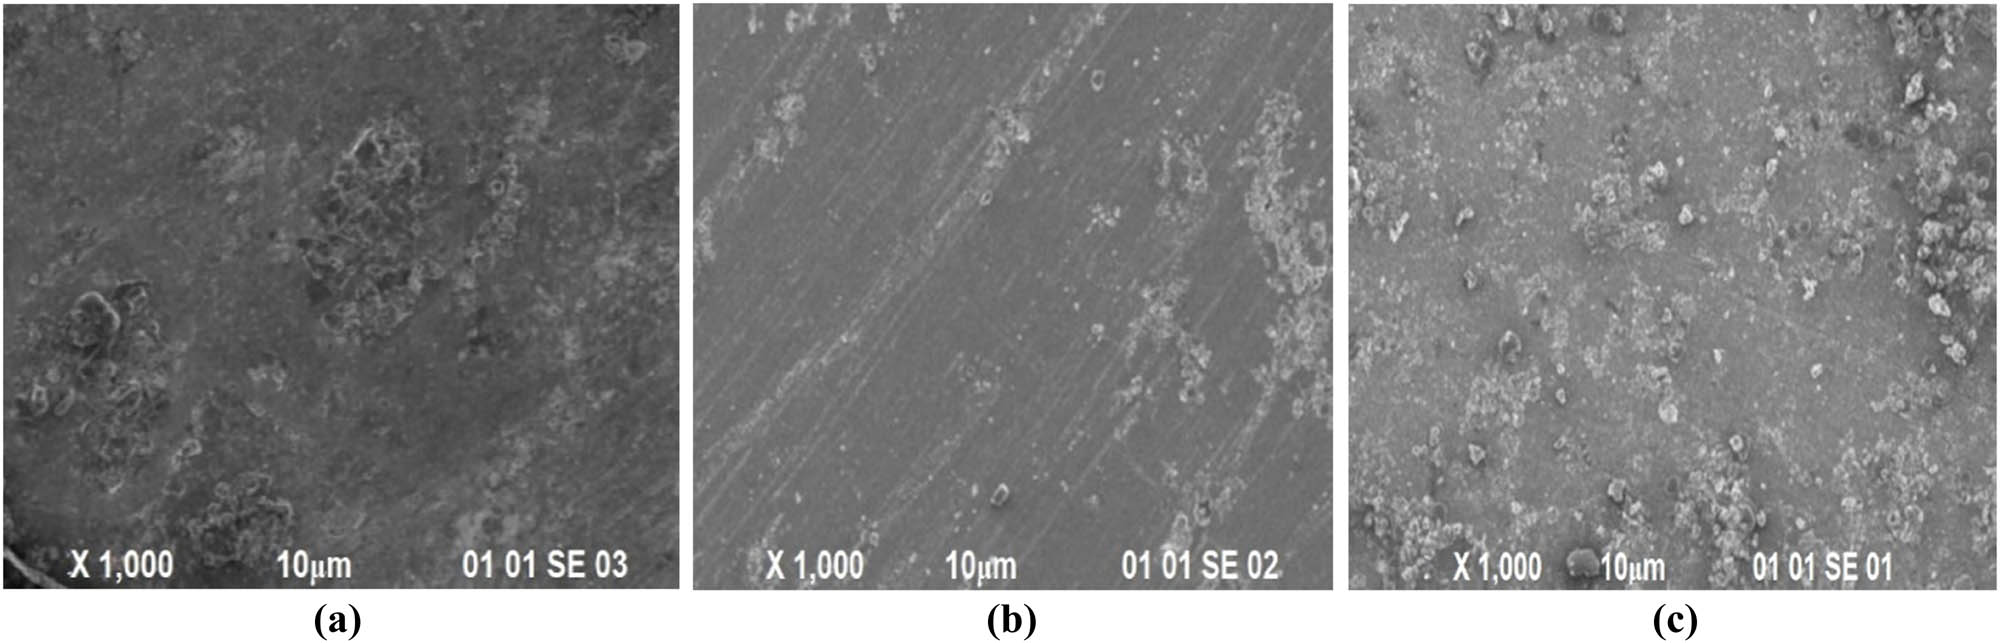
SEM images of welded sample: (a) FSW1, (b) FSW6, and (c) FSW9 after corrosion test.
4 Conclusions
Corrosion experiments in a 3.5% NaCl solution, Tafel polarization tests, and CRs for the welded specimen were done utilizing a three-electrode galvanic cell and a Galvanostat. With the most important factor, welding speed, the specimens were discovered to be more corrosion resistant. In contrast to the progressive decrease in wear rate, the WS was steadily increasing the rate of corrosion at the low SS of 750 rpm. The samples welded with a high SS of 1,350 rpm have higher wear rates than the other samples. The results suggest that the factor SS, rather than the welding speed or the AL, is the most important in regulating the wear rate. As visible in the SEM portrait of the corroded pieces, pitting corrosion has occurred in regions around the second phase (welded region) particles, and splits have arisen in the trench region of the granules.
The wear and corrosion characteristics of the as-FSWed and precipitation hardened (during various aging periods) specimens revealed that as they age, the wear behavior becomes more inactive, and the Tafel plots revealed that the aged samples had a larger inactivity. The statistics reveal that welding speed has a direct influence on the rate of corrosion. If the tool rotational speed, welding speed, and AL are adjusted to higher values in the examined process range, the wear rate can be reduced.
By studying the CR of welded samples at above room temperatures, the research can be extended to evaluate the influence of corrosion medium temperature on the welded samples, as well as the influence of wear factors on the wear rate of welded aluminum plates by adjusting the wear test parameters and the environment.
-
Funding information: The authors would like to thank the Deanship of Scientific Research at Umm Al-Qura University for supporting this work by Grant Code # 22UQU4350469DSR01.
-
Author contributions: MY and TA participated in the conceptualization of the research, prepared the data for experimentation, and performed the analysis and interpretation of the data. MY analyzed the data and presented results and discussions. MY drafted the manuscript, and figures were sketched by TA. MY and TA revised the manuscript for intellectual content and approved the final manuscript.
-
Conflict of interest: The authors have no conflicts of interest.
-
Data availability statement: The data analyzed for this manuscript is the part of our research work and is available for public used.
References
[1] Alfattani, R., M. Yunus, A. F. Mohamed, T. Alamro, and M. K. Hassan. Assessment of the corrosion behavior of friction-stir-welded dissimilar aluminum alloys. Materials, Vol. 15, No. 1, 2022, id. 260.10.3390/ma15010260Search in Google Scholar PubMed PubMed Central
[2] Palanivel, R., P. K. Mathews, N. Murugan, and I. Dinaharan. Prediction and optimization of wear resistance of friction stir welded dissimilar aluminum alloy. Procedia Engineering, Vol. 38, 2012, pp. 578–584.10.1016/j.proeng.2012.06.072Search in Google Scholar
[3] Aruri, D., K. Adepu, K. Adepu, and K. Bazavada. Wear and mechanical properties of 6061-T6 aluminum alloy surface hybrid composites [(SiC + Gr) and (SiC + Al2O3)] fabricated by friction stir processing. Journal of Materials Research and Technology, Vol. 2, No. 4, 2013, pp. 362–369.10.1016/j.jmrt.2013.10.004Search in Google Scholar
[4] Gökozan, H., P. Çavdar, G. Soy, and U. Çavdar. Analysis of artificial aging with induction and energy costs of 6082 Al and 7075 Al materials. Review Metal, Vol. 55, No. 1, 2019, id. e137.10.3989/revmetalm.137Search in Google Scholar
[5] Tarno, H., H. Qi, R. Endoh, M. Kobayashi, H. Goto, and K. Futai. Types of frass produced by the ambrosia beetle Platypus quercivorus during gallery construction, and host suitability of five tree species for the beetle. Journal of Forest Research, Vol. 16, No. 1, 2011, pp. 68–75.10.1007/s10310-010-0211-zSearch in Google Scholar
[6] Meyveci, A., İ. Karacan, U. Çalıgülü, and H. Durmuş. Pin-on-disc characterization of 2xxx and 6xxx aluminium alloys aged by precipitation age hardening. Journal of Alloys and Compounds, Vol. 491, No. 1–2, 2010, pp. 278–283.10.1016/j.jallcom.2009.10.142Search in Google Scholar
[7] Alaneme, K. and M. Bodunrin. Corrosion behavior of alumina reinforced aluminium (6063) metal matrix composites. Journal of Minerals and Materials Characterization and Engineering, Vol. 1012, 2011, pp. 1153–1165.10.4236/jmmce.2011.1012088Search in Google Scholar
[8] Staley, J. Corrosion of aluminium aerospace alloys. Materials Science Forum, Vol. 877, Trans Tech Publ, 2017, pp. 485–491.10.4028/www.scientific.net/MSF.877.485Search in Google Scholar
[9] Corral, J., E. Trillo, Y. Li, and L. Murr. Corrosion of friction-stir welded aluminum alloys 2024 and 2195. Journal of Materials Science Letters, Vol. 19, No. 23, 2000, pp. 2117–2122.10.1023/A:1026710422951Search in Google Scholar
[10] Birbilis, N. and R. G. Buchheit. Electrochemical characteristics of intermetallic phases in aluminum alloys: an experimental survey and discussion. Journal of the Electrochemical Society, Vol. 152, No. 4, 2005, id. B140.10.1149/1.1869984Search in Google Scholar
[11] Xu, W. and J. Liu. Microstructure and pitting corrosion of friction stir welded joints in 2219-O aluminum alloy thick plate. Corrosion science, Vol. 5111, 2009, pp. 2743–2751.10.1016/j.corsci.2009.07.004Search in Google Scholar
[12] Guo, Y., Y. Ma, and F. Wang. Effect of welding parameter on dynamic fracture properties of 2024-T3 aluminum friction stir welded joints. Procedia Structural Integrity, Vol. 13, 2018, pp. 806–812.10.1016/j.prostr.2018.12.155Search in Google Scholar
[13] Sato, Y. S., H. Kokawa, and S. Kurihara. Systematic examination of precipitation phenomena associated with hardness and corrosion properties in friction stir welded aluminium alloy 2024. Welding in the World, Vol. 55, No. 11, 2011, pp. 39–47.10.1007/BF03321541Search in Google Scholar
[14] Fahimpour, V., S. Sadrnezhaad, and F. Karimzadeh. Corrosion behavior of aluminum 6061 alloy joined by friction stir welding and gas tungsten arc welding methods. Materials & Design, Vol. 39, 2012, pp. 329–333.10.1016/j.matdes.2012.02.043Search in Google Scholar
[15] Mosleh, A., F. Mahmoud, T. Mahmoud, and T. Khalifa. Microstructure and static immersion corrosion behavior of AA7020-O Al plates joined by friction stir welding. Proceedings of the Institution of Mechanical Engineers, Part L: Journal of Materials: Design and Applications, Vol. 230, No. 6, 2016, pp. 1030–1040.10.1177/1464420715594484Search in Google Scholar
[16] Oladele, I. O., O. T. Betiku, and M. B. Fakoya. Effect of post weld heat treatment on the mechanical and corrosion behaviour of welded Al-Fe-Si alloy joints. Leonardo Electronic Journal of Practice and Technologies, Vol. 30, 2017, pp. 75–86.Search in Google Scholar
[17] Tayebi, P., A. Fazli, P. Asadi, and M. Soltanpour. Formability study and metallurgical properties analysis of FSWed AA 6061 blank by the SPIF process. SN Applied Sciences, Vol. 3, No. 3, 2021, id. 367.10.1007/s42452-021-04378-xSearch in Google Scholar
[18] Çömez, N. Wear behavior and corrosion properties of Age-hardened AA2010 aluminum alloy. Revista de Metalurgia, Vol. 57, No. 3, 2021, id. e201.10.3989/revmetalm.201Search in Google Scholar
[19] Elangovan, K. and V. Balasubramanian. Influences of post-weld heat treatment on tensile properties of friction stir-welded AA6061 aluminum alloy joints. Materials Characterization, Vol. 59, No. 9, 2008, pp. 1168–1177.10.1016/j.matchar.2007.09.006Search in Google Scholar
[20] Ghorbanzade, T., A. Soltanipour, K. Dehghani, and A. Chabok. Microstructural evolutions and mechanical properties of friction stir welded AA2024-3. Proceedings of the Institution of Mechanical Engineers, Part L: Journal of Materials: Design and Applications, Vol. 230, No. 1, 2016, pp. 75–87.10.1177/1464420714545369Search in Google Scholar
[21] Sharma, C., D. K. Dwivedi, and P. Kumar. Effect of post weld heat treatments on microstructure and mechanical properties of friction stir welded joints of Al–Zn–Mg alloy AA7039. Materials & Design, Vol. 43, 2013, pp. 134–143.10.1016/j.matdes.2012.06.018Search in Google Scholar
[22] El-Danaf, E. A. and M. M. El-Rayes. Microstructure and mechanical properties of friction stir welded 6082 AA in as welded and post weld heat treated conditions. Materials & Design, Vol. 46, 2013, pp. 561–572.10.1016/j.matdes.2012.10.047Search in Google Scholar
[23] Rai, R., A. De, H. Bhadeshia, and T. DebRoy. friction stir welding tools. Science and Technology of Welding and Joining, Vol. 16, No. 4, 2011, pp. 325–342.10.1179/1362171811Y.0000000023Search in Google Scholar
[24] Qin, H. L., H. Zhang, D. T. Sun, and Q. Y. Zhuang. Corrosion behavior of the friction-stir-welded joints of 2A14-T6 aluminum alloy. International Journal of Minerals, Metallurgy, and Materials, Vol. 22, No. 6, 2015, pp. 627–638.10.1007/s12613-015-1116-9Search in Google Scholar
[25] Lindroos, M., K. Valtonen, A. Kemppainen, A. Laukkanen, K. Holmberg, and V. T. Kuokkala. Wear behavior and work hardening of high strength steels in high stress abrasion. Wear, Vol. 322, 2015, pp. 32–40.10.1016/j.wear.2014.10.018Search in Google Scholar
[26] Miyoshi, K., T. Spalvins, and D. H. Buckley. Tribological properties and X-ray photoelectron spectroscopy studies of ion-plated gold on nickel and iron. Thin Solid Films, Vol. 96, No. 1, 1982, pp. 9–16.10.1016/0040-6090(82)90207-3Search in Google Scholar
[27] Burt, V. Corrosion in the Petrochemical Industry, ASM International, Ohio, 2015.10.31399/asm.tb.cpi2.9781627082822Search in Google Scholar
[28] Kannusamy, A. S. and R. Ramasamy. Effect of post weld heat treatment and welding parameters on mechanical and corrosion characteristics of friction stir welded aluminium alloy AA2014-T6. Transactions of the Canadian Society for Mechanical Engineering, Vol. 43, No. 2, 2018, pp. 230–236.10.1139/tcsme-2018-0185Search in Google Scholar
© 2022 Mohammed Yunus and Turki Alamro, published by De Gruyter
This work is licensed under the Creative Commons Attribution 4.0 International License.
Articles in the same Issue
- Review Articles
- State of the art, challenges, and emerging trends: Geopolymer composite reinforced by dispersed steel fibers
- A review on the properties of concrete reinforced with recycled steel fiber from waste tires
- Copper ternary oxides as photocathodes for solar-driven CO2 reduction
- Properties of fresh and hardened self-compacting concrete incorporating rice husk ash: A review
- Basic mechanical and fatigue properties of rubber materials and components for railway vehicles: A literature survey
- Research progress on durability of marine concrete under the combined action of Cl− erosion, carbonation, and dry–wet cycles
- Delivery systems in nanocosmeceuticals
- Study on the preparation process and sintering performance of doped nano-silver paste
- Analysis of the interactions between nonoxide reinforcements and Al–Si–Cu–Mg matrices
- Research Articles
- Study on the influence of structural form and parameters on vibration characteristics of typical ship structures
- Deterioration characteristics of recycled aggregate concrete subjected to coupling effect with salt and frost
- Novel approach to improve shale stability using super-amphiphobic nanoscale materials in water-based drilling fluids and its field application
- Research on the low-frequency multiline spectrum vibration control of offshore platforms
- Multiple wide band gaps in a convex-like holey phononic crystal strip
- Response analysis and optimization of the air spring with epistemic uncertainties
- Molecular dynamics of C–S–H production in graphene oxide environment
- Residual stress relief mechanisms of 2219 Al–Cu alloy by thermal stress relief method
- Characteristics and microstructures of the GFRP waste powder/GGBS-based geopolymer paste and concrete
- Development and performance evaluation of a novel environmentally friendly adsorbent for waste water-based drilling fluids
- Determination of shear stresses in the measurement area of a modified wood sample
- Influence of ettringite on the crack self-repairing of cement-based materials in a hydraulic environment
- Multiple load recognition and fatigue assessment on longitudinal stop of railway freight car
- Synthesis and characterization of nano-SiO2@octadecylbisimidazoline quaternary ammonium salt used as acidizing corrosion inhibitor
- Perforated steel for realizing extraordinary ductility under compression: Testing and finite element modeling
- The influence of oiled fiber, freeze-thawing cycle, and sulfate attack on strain hardening cement-based composites
- Perforated steel block of realizing large ductility under compression: Parametric study and stress–strain modeling
- Study on dynamic viscoelastic constitutive model of nonwater reacted polyurethane grouting materials based on DMA
- Mechanical behavior and mechanism investigation on the optimized and novel bio-inspired nonpneumatic composite tires
- Effect of cooling rate on the microstructure and thermal expansion properties of Al–Mn–Fe alloy
- Research on process optimization and rapid prediction method of thermal vibration stress relief for 2219 aluminum alloy rings
- Failure prevention of seafloor composite pipelines using enhanced strain-based design
- Deterioration of concrete under the coupling action of freeze–thaw cycles and salt solution erosion
- Creep rupture behavior of 2.25Cr1Mo0.25V steel and weld for hydrogenation reactors under different stress levels
- Statistical damage constitutive model for the two-component foaming polymer grouting material
- Nano-structural and nano-constraint behavior of mortar containing silica aggregates
- Influence of recycled clay brick aggregate on the mechanical properties of concrete
- Effect of LDH on the dissolution and adsorption behaviors of sulfate in Portland cement early hydration process
- Comparison of properties of colorless and transparent polyimide films using various diamine monomers
- Study in the parameter influence on underwater acoustic radiation characteristics of cylindrical shells
- Experimental study on basic mechanical properties of recycled steel fiber reinforced concrete
- Dynamic characteristic analysis of acoustic black hole in typical raft structure
- A semi-analytical method for dynamic analysis of a rectangular plate with general boundary conditions based on FSDT
- Research on modification of mechanical properties of recycled aggregate concrete by replacing sand with graphite tailings
- Dynamic response of Voronoi structures with gradient perpendicular to the impact direction
- Deposition mechanisms and characteristics of nano-modified multimodal Cr3C2–NiCr coatings sprayed by HVOF
- Effect of excitation type on vibration characteristics of typical ship grillage structure
- Study on the nanoscale mechanical properties of graphene oxide–enhanced shear resisting cement
- Experimental investigation on static compressive toughness of steel fiber rubber concrete
- Study on the stress field concentration at the tip of elliptical cracks
- Corrosion resistance of 6061-T6 aluminium alloy and its feasibility of near-surface reinforcements in concrete structure
- Effect of the synthesis method on the MnCo2O4 towards the photocatalytic production of H2
- Experimental study of the shear strength criterion of rock structural plane based on three-dimensional surface description
- Evaluation of wear and corrosion properties of FSWed aluminum alloy plates of AA2020-T4 with heat treatment under different aging periods
- Thermal–mechanical coupling deformation difference analysis for the flexspline of a harmonic drive
- Frost resistance of fiber-reinforced self-compacting recycled concrete
- High-temperature treated TiO2 modified with 3-aminopropyltriethoxysilane as photoactive nanomaterials
- Effect of nano Al2O3 particles on the mechanical and wear properties of Al/Al2O3 composites manufactured via ARB
- Co3O4 nanoparticles embedded in electrospun carbon nanofibers as free-standing nanocomposite electrodes as highly sensitive enzyme-free glucose biosensors
- Effect of freeze–thaw cycles on deformation properties of deep foundation pit supported by pile-anchor in Harbin
- Temperature-porosity-dependent elastic modulus model for metallic materials
- Effect of diffusion on interfacial properties of polyurethane-modified asphalt–aggregate using molecular dynamic simulation
- Experimental study on comprehensive improvement of shear strength and erosion resistance of yellow mud in Qiang Village
- A novel method for low-cost and rapid preparation of nanoporous phenolic aerogels and its performance regulation mechanism
- In situ bow reduction during sublimation growth of cubic silicon carbide
- Adhesion behaviour of 3D printed polyamide–carbon fibre composite filament
- An experimental investigation and machine learning-based prediction for seismic performance of steel tubular column filled with recycled aggregate concrete
- Effects of rare earth metals on microstructure, mechanical properties, and pitting corrosion of 27% Cr hyper duplex stainless steel
- Application research of acoustic black hole in floating raft vibration isolation system
- Multi-objective parametric optimization on the EDM machining of hybrid SiCp/Grp/aluminum nanocomposites using Non-dominating Sorting Genetic Algorithm (NSGA-II): Fabrication and microstructural characterizations
- Estimating of cutting force and surface roughness in turning of GFRP composites with different orientation angles using artificial neural network
- Displacement recovery and energy dissipation of crimped NiTi SMA fibers during cyclic pullout tests