Experimental study of the shear strength criterion of rock structural plane based on three-dimensional surface description
-
Feng Ji
 ,
Lei Wang
,
Lei Wang

Abstract
The failure of rock mass is mainly due to the failure of the structural plane, which is an important factor to reduce the mechanical properties and stability of rock mass. The shear strength of rock mass is one of the parameters for the stability calculation of large-scale rock mass engineering. The shear strength of a rock structural plane is strongly influenced by surface morphology. Considerable research has been conducted regarding the correlation between two-dimensional structural plane morphology and shear strength. However, quantitative research on three-dimensional (3D) morphology is relatively limited. In this study, 3D printing technology was used to create molds. Using cement and sand as the main materials, additives such as early strength and water-reducing agents were added, and test samples of irregular surface topography were created. The 3D roughness was quantified by formula calculation. Using a ZScanner® 800 hand-held 3D laser scanner to perform scanning on the structural surface, the parameter curve was analysed by generating 3D coordinate information and a 3D image of the fracture surface, and the quantitative parameter
List of symbols
- C
-
cohesion of the material
- JCS
-
joint compression strength
- JRC
-
joint roughness coefficient
-
-
reciprocal of 3D fluctuation coefficient of the structural plane
-
-
3D fluctuation coefficient of the structural plane.
- S Q
-
area of the structural surface slope
- S T
-
area of the horizontal projection
- Δr
-
scanning resolution
- σ 1
-
axial stress
- σ 3
-
confining pressure
- σ n
-
normal stress
- τ p
-
peak shear strength
- φ
-
internal friction angle of the material
- φ b
-
basic friction angle of the structural plane
1 Introduction
There are a large number of joint planes in the natural rock mass, which significantly affect the mechanical properties of the rock mass [1,2,3]. The physical and mechanical properties of the joint plane in rock mass are a complex system with geometric space characteristics. The instability of rock mass engineering and the occurrence of geological disasters are mostly related to the weakening of the mechanical properties of rock mass [4]. By controlling the shear strength of the jointed rock mass, the roughness of the joint plane has become one of the important factors affecting the mechanical properties of the rock mass structural plane [5]. The influence of joint surface morphology on the rock’s mechanical properties is notable. To eliminate or reduce the rock morphological effects, model tests have been widely used. In the study by Patton, by introducing a structural plane physical model, the effect of serrated structures on the shear strength is studied [6]. By analysis of a total of 136 natural rock joints, the index of joint roughness coefficient (JRC) was proposed by Barton and Choubey [7] to describe the roughness of rock surfaces. Since the 1970s, joint morphology and its effects on mechanics have become a hot topic [7,8,9,10,11,12,13,14].
To evaluate the quantitative characteristics of the structural surface, Li et al. [15] introduced a meshing method of Schmidt projection to calculate the fractal dimension for joint orientation for the first time. By introducing the minimum spacing/trace length value and fractal dimension, the corresponding fractal probability density function was derived. Wei et al. [16] used cumulative relative fluctuation amplitude and weighted average gradient to characterize the morphological characteristics of the joint profile, and the JRC calculation formula was put forward. The quantitative characterization of ten standard JRC curves has been analysed by many scholars [17,18,19,20,21,22,23], and a set of statistical formulas have been developed. Some roughness parameters, such as root mean square of the deviation [17,18,19,20,21,22], structural function [17,18,21], and roughness profile index [18,19,20,21,24], were often mentioned. By using a total station, Feng et al. [25] put forward a new way to describe non-contact fracture roughness. In the study by Morelli [26], a new index for describing the JRC was put forward. In addition, some scholars have found that self-affine fractal and multifractal natures exist in joint morphology [27,28,29]. By analysing ten standard JRC curves, the effect of fractal dimension on joint strength has been studied. It was noted by Grasselli [9] that the initial contact area was correlated with the damaged zone and the peak shear strength. There are many methods to study and determine the roughness of a structural plane, but how to apply it to the deformation and failure of rock mass and quantitatively combine the roughness with the failure strength of rock mass has become an important research direction.
In the study by Barton and Choubey [7], a formula for the peak shear strength that combines the JRC, normal stress, and mechanical properties was put forward. Zheng et al. [30] proposed a generalized three-dimensional (3D) fractal dimension, which can comprehensively characterize the roughness, undulation, and anisotropy of structural surface morphology, and established the mathematical expression of a generalized 3D fractal dimension. Taking the effect of the slippage resistance of convex teeth in the shear direction into account, Grasselli [9] used the morphological quantification of 3D joint surfaces and proposed a peak shear strength prediction model. Furthermore, considerable work in this field has also been done by other researchers [5,31,32,33,34,35]. The research on structural surfaces mentioned in the above literature mainly focuses on 2D morphology, and it is necessary to further develop the research on 3D models. Combining 3D scanning and direct shear technology, it is feasible to explore and establish the criterion of peak strength of a structural plane [36]. The computation of JRC is cumbersome and requires a lot of study. The 3D morphological characteristics or the anisotropy of joint surfaces are not reflected. As a quantitative model to describe the 3D surface morphology, the parameters in the Grasselli model are too complex.
In this study, via material preparation and the 3D printing (3DP) method, structural test samples of different topographies were developed. The ratio of slope area to horizontal projection area was used to reflect the fluctuation in the 3D structure. Then, the change rule of the fluctuation state of the structural surface under different scanning resolutions was analysed using the 3D laser scanning method. A function model of the 3D structural surface and shear strength was established, then the shear test was used for validation (Figure 1).
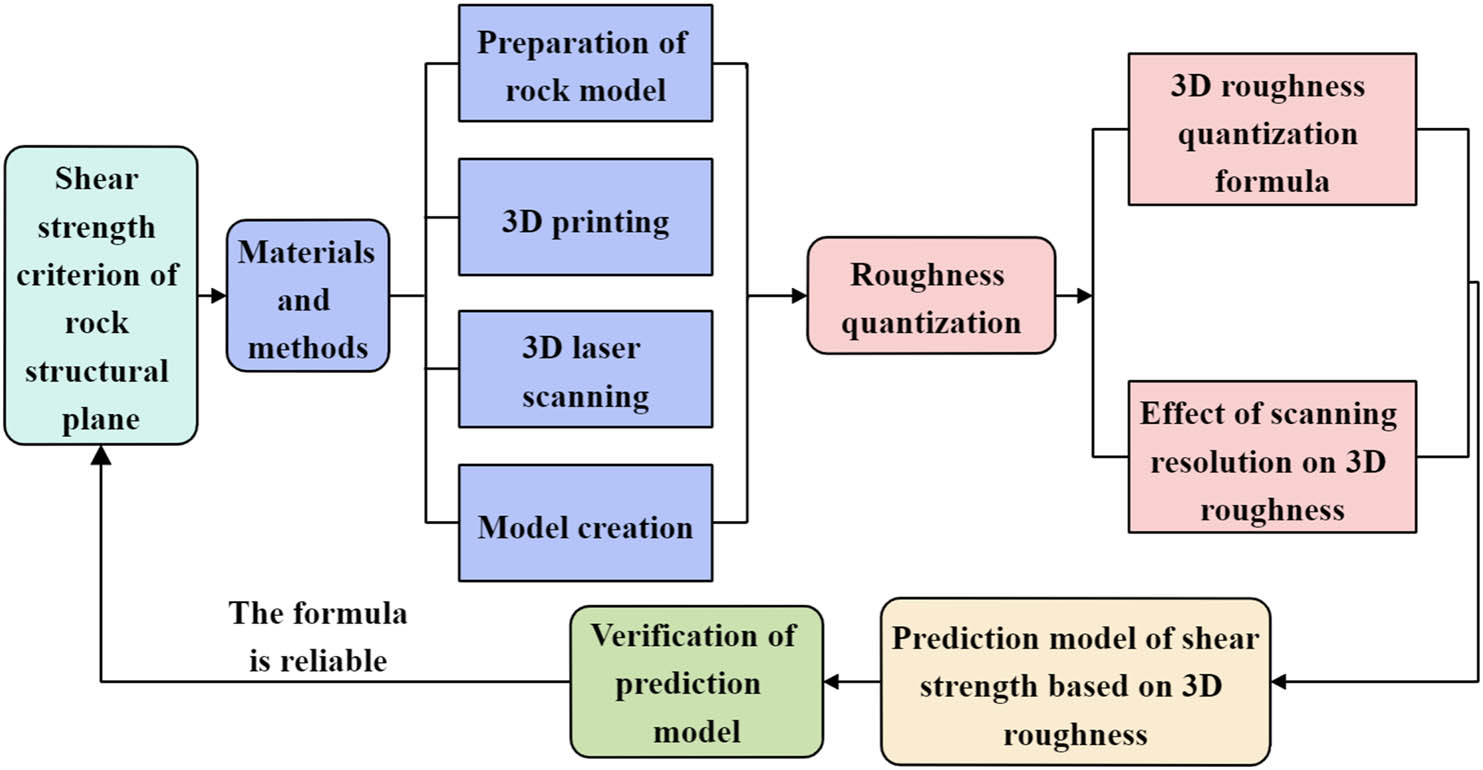
Flow chart of shear strength research of rock structural plane.
2 Materials and methods
2.1 Material preparation
To prepare a rock model, a mix proportion procedure was used. The ratio of cement to sand is 1:1.5, and the ratio of cement to water is 1:0.3. In addition, 10% silica powder, 15% silicon carbide, 1.5% water reducer, and 2% accelerator were used in the whole mixture [37,38,39,40,41,42,43,44,45,46,47]. In the test, 52.5R composite silicate cement and sand were the main ingredients, silica powder and silicon carbide were additives, and a small amount of early strength admixture. To test the compressive strength and shear strength of the material, the dimensions and test standards of the modulus materials are shown in Table 1 (Figure 2).
Testing type, specimen dimensions, and standard use in testing
| Testing item | Sample size | Standard |
|---|---|---|
| Comprehensive strength | ɸ50 mm × 100 mm | American Society for Testing Material International Society for Rock Mechanics |
| Tensile strength | ɸ50 mm × 50 mm | |
| Shear strength | 100 mm × 100 mm × 100 mm |

Components of similar raw materials. ① Green SiC, ② Micro silicon powder, ③ Early-strength admixture, ④ Portland cement, ⑤ Fine sand, ⑥ Coarse sand, ⑦ Aggregate (3–6 mm), ⑧ Carboxylic water-reducer, and ⑨ Warm water (30–45°C).
2.2 3DP
3DP is a computer-controlled manufacturing technique that can fabricate objects with complicated geometry and internal structures repeatedly and accurately. Various printing techniques have been used to fabricate polymer composites. In this study, 3DP equipment and corresponding printing materials have been studied to produce molds of structural surface topography. Among the equipment, 3D printers using powder ink binders (PIB) are widely used. PIB printers are based on powder and liquid binders. Because PIB printers are made from sand powder, the resulting product may be more visually like rock material.
2.3 3D laser scanning
Hand-held 3D laser scanners are used to measure structural surface topography as they have high scanning speed and high precision. In this study, a ZScanner® 800 handheld 3D laser scanner was used, in which the maximum scanning accuracy can reach 0.04 mm. The instrument is shown in Figure 3, and the process of obtaining the surface morphology of the structural plane is shown in Figure 4, which included instrument installation, scanning specimen preparation, pasting the sensitive plate, open scanning of software, adjusting the laser power and other configurations, scanning the specimen, saving the file, data processing, model reconstruction, and the analysis result. After the scan is completed, a coordinate transformation of the data is required. Geomagic Qualifier & Studio can quickly complete the transformation of coordinates. The principle of transformation can be expressed as Formula 1 as follows:
where R(∂, β, γ) represents the rotating vector and [x 0, y 0, z 0]T represents the transformation vector between different coordinate systems.
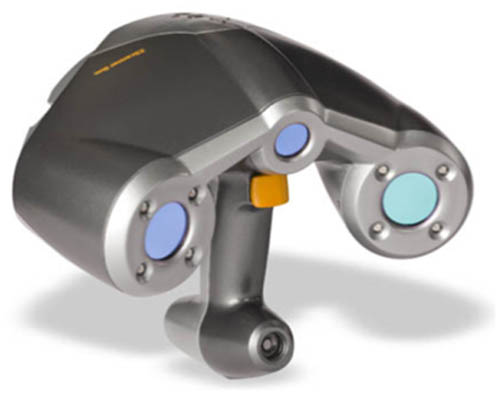
ZScanner® 800 hand-held 3D laser scanner.

3D laser scanning process. (a) Scanning specimen preparation. (b) Paste the sensitive plate. (c) Debug scanner. (d) Prescan. (e) Scan sensitive plate. (f) Scan structural plane. (g) Data processing.
2.4 Model creation
In this study, a 3D zigzag structural plane was processed. The model size was 10 cm × 10 cm × 5 cm. The geometric features of the convex teeth were controlled by the fluctuation angle (i) and the fluctuation height (h). Six serrated models were created, and their dimensions were i = 60°, h = 1 cm; i = 45°, h = 1 cm; i = 30°, h = 1 cm; i = 60°, h = 0.5 cm; i = 45°, h = 0.5 cm; and i = 30°, h = 0.5 cm, as shown in Figure 5.

3D zigzag model. (a) Model side view. (b) Transverse cutting view. (c) Model bird’s-eye view. (d) Longitudinal cutting view.
3 Roughness quantization of the3D surface of the structural surface
3.1 3D roughness quantization formula
Figure 6 shows a normal four-pyramid model; point O is the projection of point E on the plane ABCD. Line EF is the section line of the model. By cutting the convex teeth along the line EF, the roughness profile can be obtained. The profile roughness coefficient R pl is used to represent the fluctuation of the structural plane. R pl = EF/OF, and its coordinate expression is as follows:

Normal four-pyramid model and coordinates.
Triangle ΔABE and triangle ΔAOB have a public side AB, EF⊥AB, and OF⊥AB, and ΔABE is a projection of the ABCD in plane ΔAOB, S ΔABE = ½(AB × EF), S ΔAOB = ½(AB × OF).
Thus, we obtain formula (3) as follows:
The profile roughness coefficient of the 3D surface of the structural surface is denoted by
where S Q represents the slope area of the structural plane and S T represents the projected area in the horizontal plane.
The profile roughness coefficient R
p can reflect the undulating state of the structure. However, to avoid the surface area of the structural surface becoming 0, the situation of
3.2 Effect of scanning resolution on 3D roughness
In general, the higher the resolution, the more detailed the model is, and the closer it is to the real shape of the structural plane. To study the effect of scanning accuracy on the 3D roughness coefficient

Model and grid of a 3D scanned model. (a) 3D model (Δr = 0.4 mm). (b) Triangular grid diagram (Δr = 0.4 mm). (c) 3D model (Δr = 0.6 mm). (d) Triangular grid diagram (Δr = 0.6 mm). (e) 3D model (Δr = 0.8 mm). (f) Triangular grid diagram (Δr = 0.8 mm). (g) 3D model (Δr = 1.0 mm). (h) Triangular grid diagram (Δr = 1.0 mm). (i) 3D model (Δr = 2.0 mm). (j) Triangular grid diagram (Δr = 2.0 mm). (k) 3D model (Δr = 3.0 mm). (l) Triangular grid diagram (Δr = 3.0 mm). (m) 3D model (Δr = 4.0 mm). (n) Triangular grid diagram (Δr = 4.0 mm).
Geometric parameters of the structural plane at different resolutions
| Number | Scanning resolution (mm) | Triangular mesh number | Slope area of the structural plane (mm2) | Area of the horizontal projection (mm2) |
|
|---|---|---|---|---|---|
| 1 | 0.4 | 62,040 | 5648.3 | 4775.94 | 1.182 |
| 2 | 0.6 | 27,525 | 5414.6 | 4775.94 | 1.133 |
| 3 | 0.8 | 15,650 | 5404.5 | 4775.94 | 1.131 |
| 4 | 1 | 9,940 | 5356.1 | 4775.94 | 1.121 |
| 5 | 2 | 2,620 | 5306.2 | 4775.94 | 1.111 |
| 6 | 3 | 1,247 | 5262.2 | 4775.94 | 1.101 |
| 7 | 4 | 706 | 5224.7 | 4775.94 | 1.093 |
Table 2 shows, when the resolution of Δr = 0.4 mm, the scanning model is most similar to that of the original rock surface, and the detailed characteristics are very clear. When the resolution is gradually reduced, the details of the structural surface become blurred, and the model surface becomes smooth. When the resolution reaches 4 mm, the detailed morphology can hardly be observed, and only the areas with prominent fluctuations can be reflected; the whole plane gradually tends to a smooth plane. The relationship between scanning resolution and

Relation curve of Δr with
The JRC value is the parameter reflecting the roughness of the structural surface. At different resolutions, the roughness coefficient JRC of the structural surface image changes. To study the change rule of JRC under different scanning accuracies, six profile lines were taken of the different scanning resolution models. Based on the Barton model, which links the roughness of the structural plane with the shear strength and compressive strength, the roughness coefficient JRC value of the profile line was calculated. The relationship between Δr and JRC was studied. Similar to Figure 9, the JRC values of the profile lines are shown in Figure 10.

Section line of the structural plane.

Sectional morphology and JRC value at different resolutions.
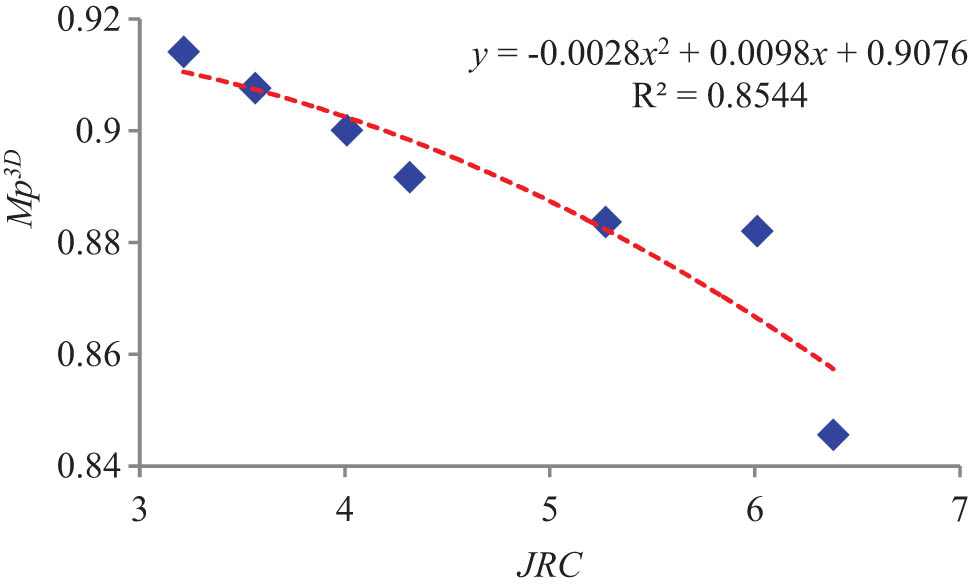
The relationship curve of JRC to Δr is shown in Figure 11. With a decrease in resolution (Δr increasing), the roughness of the structural surface gradually decreases, and they are related exponentially. Its change trend is basically consistent with the change trend of
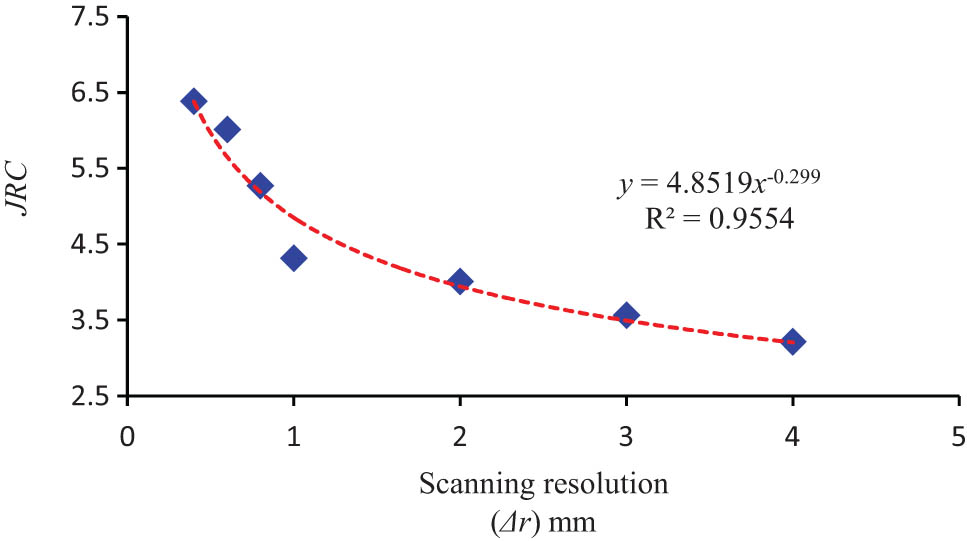
Relation curve of JRC with different resolutions.
We can see from the aforementioned figures that with a decrease in the scanning resolution (an increase in Δr),
where
In the above formula,
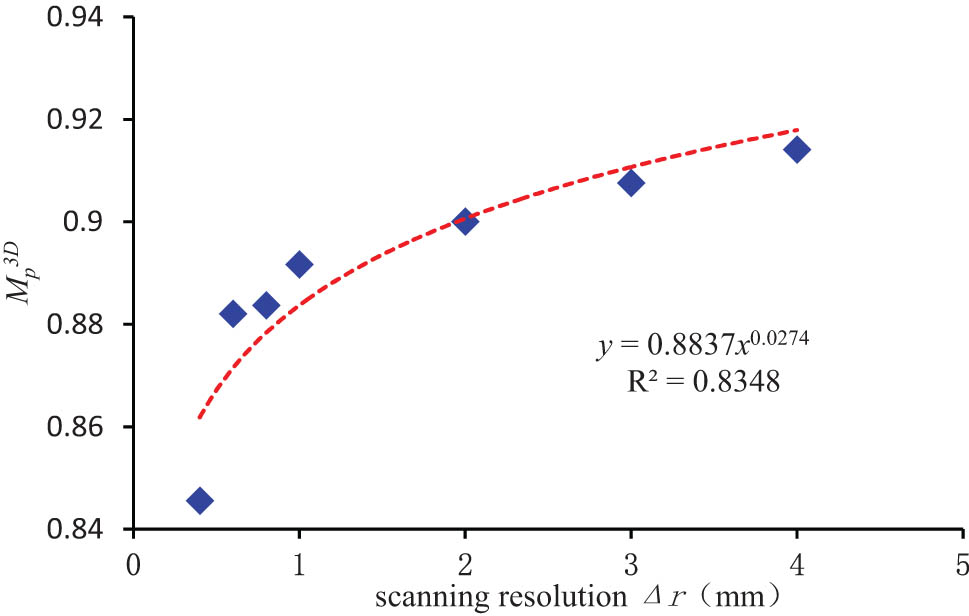
Relation curve of
Relation curve of
4 Prediction model of shear strength based on 3D roughness
On the basis of the quantitative description of the 3D structural surface and the Barton model [48], we established a 3D shear strength estimation formula by adopting the
(Δr = 0.4 mm), where
In the above formula,
5 Discussion
A shear test under different stress levels was conducted to verify the reliability of the shear strength model. The reliability of the theoretical formula was evaluated by comparing the error of the test value to the predicted value. During the experiment, the normal stress was 0.5, 1.0, 1.5, 2.0, 2.5, and 3.0 MPa. The structural surface sample is shown in Figure 14. The compressive strength was 52.5 MPa and the basic friction angle was 45.48° after 28 days of standard curing. The resolution of the scanning instrument was 0.4 mm, via scanning and calculation,

Model of structural plane sample.
Figure 15 shows the laser scanning image following the shear test under different stresses. With an increase in the normal stress, the loss degree of the structural surface gradually increases. When the normal stress is relatively low, the surface of the structural plane is significantly damaged, and this results in a sliding type after climbing over the convex body.

Laser scanning image of the structural plane after the shear test.
When the normal stress was increased gradually, the convex was cut and slippage shear failure occurred. According to the experimental data of the shearing results, the relationship curve between the shear stress and the positive stress was plotted. The shear stress was the vertical coordinate and the normal stress was the horizontal coordinate, and C and φ were obtained according to formula (9). At the same time, the theoretical prediction model was applied. C and φ were obtained after accurate determination of

Relationship curves of τ–σ under different methods: (a) based on prediction model and (b) based on shear test.
Experimental values and theoretical prediction values were calculated, and the results are shown in Table 3. The friction angle was 41.5° and the cohesion coefficient C was 0.32 MPa by experiment. The friction angle was 42.9° and the cohesion C was 0.29 MPa using the theoretical prediction model. Through the linear fitting of the 95% confidence interval of the model formula, the experimental values are within the confidence band. The average error of the shear strength was 10.4%. The errors of friction angle and the cohesion C were 3.4% and 9.4%. The results show that the formula is reliable.
Comparison of the experimental value of shear strength and the prediction value of the theoretical model
| No. | Normal stress (MPa) | Shear strength based on tests |
|
Shear strength based on prediction model | Error (%) | ||||
|---|---|---|---|---|---|---|---|---|---|
| τ (MPa) | C (MPa) | φ | τ (MPa) | C (MPa) | φ | ||||
| 1 | 0.5 | 0.6908 | 0.32 | 41.5 | 0.7642 | 0.5423 | 0.29 | 42.9 | 21.5 |
| 2 | 1.0 | 1.3188 | 0.7642 | 1.0742 | 18.6 | ||||
| 3 | 1.5 | 1.6956 | 0.7642 | 1.6022 | 5.5 | ||||
| 4 | 2.0 | 2.0560 | 0.7642 | 2.1277 | 3.4 | ||||
| 5 | 2.5 | 2.4288 | 0.7642 | 2.6515 | 9.2 | ||||
| 6 | 3.0 | 3.0533 | 0.7642 | 3.1737 | 4.0 | ||||
The test assumes that the structural plane is hard and does not consider the anisotropy of the structural plane. The established theoretical prediction model can well predict the friction angle and the cohesion C, but the shear strength is not very ideal when the normal stress is small. We believe that the cohesion C still has some internal relationships with
6 Conclusions
The model of an irregular structure was prepared via material preparation and 3DP. Laser scanning was used to obtain the surface topography of the rock structural surface and produce a quantitative model of the 3D topography of the irregular structure. Based on the fluctuation coefficient
Using the composite silicate cement and sand as main ingredients, silica powder and silicon carbide were added as additives, and with a small amount of early strength admixture, rock model materials were prepared. The ratio of cement to sand is 1:1.5, cement to water is 1:0.3. In addition, 10% silica powder, 15% silicon carbide, 1.5% water reducer, and 2% accelerator were used.
The undulation coefficient
A ZScanner® 800 portable 3D laser scanner was used for structural plane scanning, and the relationship curves of Δr to
A formula for estimating the shear strength of the 3D structural surface was established based on the quantization parameters of the 3D structural surface. Experimental verification was conducted. The experimental values are within the confidence band of the 95% confidence interval of the model formula, and the average error of the shear strength was 10.4%. The errors of friction angle and the cohesion C were 3.4 and 9.4%, showing that the formula of the shear strength model is reliable.
Acknowledgments
We acknowledge the support of the National Key Research and Development Program of China (Grant No. 2021YFB2301304) and the Natural Science Foundation of China (No. 41977237). The authors are grateful to all the technicians who worked in the laboratory at SKLGP for aiding throughout the experimental work.
-
Funding information: The National Key Research and Development Program of China (Grant No. 2021YFB2301304) and the Natural Science Foundation of China (No. 41977237).
-
Author contributions: Feng Ji and Yuchuan Shi contributed to the conception of the study and field survey; Lei Wang and Xiao He performed the experiment; Shengshan Hou and Wenkai Feng contributed significantly to analysis and manuscript preparation; Feng Ji and Lei Wang performed the data analyses and wrote the manuscript; Shengshan Hou, Wenkai Feng and Changjiang Liu helped perform the analysis with constructive discussions.
-
Conflict of interest: Authors state no conflict of interest.
-
Data availability statement: All data included in this study are available upon request by contact with the corresponding author.
References
[1] Yao, C., Q. Jiang, J. Shao, and C. Zhou. Modelling of hydro-mechanical coupling and transport in densely fractured rock mass. European Journal of Environmental and Civil Engineering, Vol. 19, No. 5, 2013, pp. 521–538.10.1080/19648189.2013.851037Search in Google Scholar
[2] Yao, C., Q. H. Jiang, and J. F. Shao. Numerical simulation of damage and failure in brittle rocks using a modified rigid block spring method. Computers and Geotechnics, Vol. 64, 2015, pp. 48–60.10.1016/j.compgeo.2014.10.012Search in Google Scholar
[3] Jiang, Q., W. Wei, N. Xie, and C. Zhou. Stability analysis and treatment of a reservoir landslide under impounding conditions: A case study. Environmental Earth Sciences, Vol. 75, No. 1, 2015.10.1007/s12665-015-4790-zSearch in Google Scholar
[4] Zhou, Y. Q., Q. Sheng, N. N. Li, and X. D. Fu. The dynamic mechanical properties of a hard rock under true triaxial damage-controlled dynamic cyclic loading with different loading rates: A case study. Rock Mechanics and Rock Engineering, Vol. 55, 2022, pp. 2471–2492. 10.1007/s00603-021-02756-w.Search in Google Scholar
[5] Zhang, X., Q. Jiang, N. Chen, W. Wei, and X. Feng. Laboratory investigation on shear behavior of rock joints and a new peak shear strength criterion. Rock Mechanics and Rock Engineering, Vol. 49, No. 9, 2016, pp. 3495–3512.10.1007/s00603-016-1012-2Search in Google Scholar
[6] Patton, F. D. Multiple modes of shear failure in rock. Proceeding of the Congress of International Society of Rock Mechanics, 1966, pp. 509–513.Search in Google Scholar
[7] Barton, N. and V. Choubey. The shear strength of rock joints in theory and practice. Rock Mechanics Felsmechanik Mécanique des Roches, Vol. 10, No. 1, 1977, pp. 1–54.10.1007/BF01261801Search in Google Scholar
[8] Barton, N. Review of a new shear-strength criterion for rock joints. Engineering Geology, Vol. 7, No. 4, 1977, pp. 287–332.10.1016/0013-7952(73)90013-6Search in Google Scholar
[9] Grasselli, G. Shear Strength of Rock Joints Based on Quantified Surface Description. Doctoral dissertation. Federal Institute of Technology, Swiss, 2001.Search in Google Scholar
[10] Asadollahi, P. and F. Tonon. Constitutive model for rock fractures: Revisiting Barton’s empirical model. Engineering Geology, Vol. 113, No. 1–4, 2010, pp. 11–32.10.1016/j.enggeo.2010.01.007Search in Google Scholar
[11] Bahaaddini, M., P. C. Hagan, R. Mitra, and B. K. Hebblewhite. Scale effect on the shear behaviour of rock joints based on a numerical study. Engineering Geology, Vol. 181, No. 1, 2014, pp. 212–233.10.1016/j.enggeo.2014.07.018Search in Google Scholar
[12] Bahaaddini, M., P. C. Hagan, R. Mitra, and M. H. Khosravi. Experimental and numerical study of asperity degradation in the direct shear test. Engineering Geology, Vol. 204, No. 8, 2016, pp. 41–52.10.1016/j.enggeo.2016.01.018Search in Google Scholar
[13] Ji, F., C. J. Liu, Y. Zhang, L. B. Zheng, K. Pan, and X. Tan. High-strength model material production for structural plane replica and its shear testing. KSCE Journal of Civil Engineering, Vol. 22, No. 1, 2017, pp. 174–184.10.1007/s12205-017-0636-4Search in Google Scholar
[14] Singh, H. K. and A. Basu. Shear behaviors of ‘real’ natural un-matching joints of granite with equivalent joint roughness coefficients. Engineering Geology, Vol. 21123, 2016, pp. 120–134.10.1016/j.enggeo.2016.07.004Search in Google Scholar
[15] Li, L., W. Wu, M. H. El Naggar, G. Mei, and R. Liang. Characterization of a jointed rock mass based on fractal geometry theory. Bulletin of Engineering Geology and the Environment, Vol. 78, No. 8, 2019, pp. 6101–6110.10.1007/s10064-019-01526-xSearch in Google Scholar
[16] Wei, Y., L. Sifan, T. Hanhua, N. Jiandong, J. Zhiling, L. Xilai, et al. A new approach for quantifying the two-dimensional joint roughness coefficient (JRC) of rock joints. Environmental Earth Sciences, Vol. 80, 2021, id. 484.10.1007/s12665-021-09780-7Search in Google Scholar
[17] Tse, R. and D. M. Cruden. Estimating joint roughness coefficients. International Journal of Rock Mechanics and Mining Sciences, Vol. 16, No. 5, 1979, pp. 303–307.10.1016/0148-9062(79)90241-9Search in Google Scholar
[18] Yu, X. and B. Vayssade. Joint profiles and their roughness parameters. International Journal of Rock Mechanics and Mining Sciences and Geomechanics Abstracts, Vol. 28, No. 4, 1991, pp. 333–336.10.1016/0148-9062(91)90598-GSearch in Google Scholar
[19] Yang, Z. Y., S. C. Lo, and C. C. Di. Reassessing the joint roughness coefficient (JRC) estimation using Z2. Rock Mechanics and Rock Engineering, Vol. 34, No. 3, 2001, pp. 243–251.10.1007/s006030170012Search in Google Scholar
[20] Tatone, B. S. A. and G. Grasselli. A new 2D discontinuity roughness parameter and its correlation with JRC. International Journal of Rock Mechanics and Mining Sciences, Vol. 47, No. 8, 2010, pp. 1391–1400.10.1016/j.ijrmms.2010.06.006Search in Google Scholar
[21] Jang, H. S., S. S. Kang, and B. A. Jang. Determination of joint roughness coefficients using roughness parameters. Rock Mechanics and Rock Engineering, Vol. 47, No. 6, 2014, pp. 2061–2073.10.1007/s00603-013-0535-zSearch in Google Scholar
[22] Li, Y. and Y. Zhang. Quantitative estimation of joint roughness coefficient using statistical parameters. International Journal of Rock Mechanics and Mining Sciences, Vol. 77, 2015, pp. 27–35.10.1016/j.ijrmms.2015.03.016Search in Google Scholar
[23] Liu, X. G., W. C. Zhu, Q. L. Yu, S. J. Chen, and R. F. Li. Estimation of the joint roughness coefficient of rock joints by consideration of two-order asperity and its application in double-joint shear tests. Engineering Geology, Vol. 220, 2017, pp. 243–255.10.1016/j.enggeo.2017.02.012Search in Google Scholar
[24] Abolfazli, M. and A. Fahimifar. An investigation on the correlation between the joint roughness coefficient (JRC) and joint roughness parameters. Construction and Building Materials, Vol. 25911, 2020, id. 120415.10.1016/j.conbuildmat.2020.120415Search in Google Scholar
[25] Feng, Q. H., N. Fardin, L. Jing, and O. Stephansson. A new method for in situ non-contact roughness measurement of large rock fracture surfaces. Rock Mechanics and Rock Engineering, Vol. 36, No. 1, 2003, pp. 3–25.10.1007/s00603-002-0033-1Search in Google Scholar
[26] Morelli, G. L. On joint roughness: Measurements and use in rock mass characterization. Geotechnical and Geological Engineering, Vol. 32, No. 2, 2014, pp. 345–362.10.1007/s10706-013-9718-3Search in Google Scholar
[27] Sakellariou, M., B. Nakos, and C. Mitsakaki. On the fractal character of rock surfaces. International Journal of Rock Mechanics and Mining Sciences and Geomechanics Abstracts, Vol. 28, No. 6, 1991, pp. 527–533.10.1016/0148-9062(91)91129-FSearch in Google Scholar
[28] Xie, H., J. A. Wang, and M. A. Kwaśniewski. Multifractal characterization of rock fracture surfaces. International Journal of Rock Mechanics and Mining Sciences, Vol. 36, No. 1, 1999, pp. 19–27.10.1016/S0148-9062(98)00172-7Search in Google Scholar
[29] Stach, S., J. Cybo, and J. Chmiela. Fracture surface – fractal or multifractal. Materials Characterization, Vol. 46, No. 2, 2001, pp. 163–167.10.1016/S1044-5803(01)00119-XSearch in Google Scholar
[30] Zheng, B., S. Qi, G. Luo, F. Liu, X. Huang, and S. Guo. Characterization of discontinuity surface morphology based on 3D fractal dimension by integrating laser scanning with ArcGIS. Bulletin of Engineering Geology and the Environment, Vol. 80, No. 3, 2021, pp. 2261–2281.10.1007/s10064-020-02011-6Search in Google Scholar
[31] Son, B. K., Y. K. Lee, and C. I. Lee. Elasto-plastic simulation of a direct shear test on rough rock joints. International Journal of Rock Mechanics and Mining Sciences, Vol. 41, No. 3, 2004, pp. 354–359.10.1016/j.ijrmms.2004.03.066Search in Google Scholar
[32] Singh, M. and K. S. Rao. Empirical methods to estimate the strength of jointed rock masses. Engineering Geology, Vol. 77, No. 1-2, 2005, pp. 127–137.10.1016/j.enggeo.2004.09.001Search in Google Scholar
[33] Usefzadeh, A., H. Yousefzadeh, H. Salari-Rad, and M. Sharifzadeh. Empirical and mathematical formulation of the shear behavior of rock joints. Engineering Geology, Vol. 164, No. 1–2, 2013, pp. 243–252.10.1016/j.enggeo.2013.07.013Search in Google Scholar
[34] Sun, F. C., C. X. She, L. T. Wan., and Q. R. Jiang. Peak shear strength criterion for rock joints based on three-dimensional morphology characteristics. Chinese Journal of Geotechnical Engineering, Vol. 36, No. 3, 2014, pp. 529–553.Search in Google Scholar
[35] Yang, J., G. Rong, D. Hou, J. Peng, and C. B. Zhou. Experimental study on peak shear strength criterion for rock joints. Rock Mechanics and Rock Engineering, Vol. 49, No. 3, 2016, pp. 821–835.10.1007/s00603-015-0791-1Search in Google Scholar
[36] Liu, Q. S., Y. C. Tian, P. Q. Ji, and H. Ma. Experimental investigation of the peak shear strength criterion based on three-dimensional surface description. Rock Mechanics and Rock Engineering, Vol. 51, No. 4, 2017, pp. 1005–1025.10.1007/s00603-017-1390-0Search in Google Scholar
[37] Liu, C. J., X. C. Huang, Y. Y. Wu, X. W. Deng, Z. L. Zheng, Z. Xu, et al. Advance on the dispersion treatment of graphene oxide and the graphene oxide modified cement-based materials. Nanotechnology Reviews, Vol. 10, No. 1, 2021, pp. 34–49.10.1515/ntrev-2021-0003Search in Google Scholar
[38] Liu, C. J., X. Su, Y. Y. Wu, Z. L. Zheng, B. Yang, Y. B. Luo, et al. Effect of nano-silica as cementitious materials-reducing admixtures on the workability, mechanical properties and durability of concrete. Nanotechnology Reviews, Vol. 10, No. 1, 2021, pp. 1395–1409.10.1515/ntrev-2021-0097Search in Google Scholar
[39] Xu, Z., Z. P. Huang, C. J. Liu, X. W. Deng, D. Hui, Y. T. Deng, et al. Experimental study on mechanical properties and microstructures of steel fiber-reinforced fly ash-metakaolin geopolymer-recycled concrete. Reviews on Advanced Materials Science, Vol. 60, No. 1, 2021, pp. 578–590.10.1515/rams-2021-0050Search in Google Scholar
[40] Kim, S. H., S. M. Park, and S. J. Park. Role of dry ozonization of basalt fibers on interfacial properties and fracture toughness of epoxy matrix composites. Nanotechnology reviews, Vol. 10, No. 1, 2021, pp. 710–718.10.1515/ntrev-2021-0048Search in Google Scholar
[41] Tang, Y. C., Z. Chen, W. H. Feng, Y. M. Nong, C. Li, and J. M. Chen. Combined effects of nano-silica and silica fume on the mechanical behavior of recycled aggregate concrete. Nanotechnology Reviews, Vol. 10, No. 1, 2021, pp. 819–838.10.1515/ntrev-2021-0058Search in Google Scholar
[42] Ahmed, S., T. Meng, and M. Taha. Utilization of red mud for producing a high strength binder by composition optimization and nano strengthening. Nanotechnology Reviews (Berlin), Vol. 9, No. 1, 2020, pp. 396–409.10.1515/ntrev-2020-0029Search in Google Scholar
[43] Meng, T., K. J. Ying, X. F. Yang, and Y. P. Hong. Comparative study on mechanisms for improving mechanical properties and microstructure of cement paste modified by different types of nanomaterials. Nanotechnology Reviews (Berlin), Vol. 10, No. 1, 2021, pp. 370–384.10.1515/ntrev-2021-0027Search in Google Scholar
[44] Zhuang, C. L. and Y. Chen. The effect of nano-SiO2 on concrete properties: a review. Nanotechnology Reviews (Berlin), Vol. 8, No. 1, 2019, pp. 562–572.10.1515/ntrev-2019-0050Search in Google Scholar
[45] Long, Z., L. You, X. Tang, W. Ma, Y. Ding, and F. Xu. Analysis of interfacial adhesion properties of nano-silica modified asphalt mixtures using molecular dynamics simulation. Construction and Building Materials, Vol. 255, 2020, pp. 891–909.10.1016/j.conbuildmat.2020.119354Search in Google Scholar
[46] Long, Z., S. Zhou, S. Jiang, W. Ma, Y. Ding, L. You, et al. Revealing compatibility mechanism of nanosilica in asphalt through molecular dynamics simulation. Journal of Molecular Modeling, Vol. 27, No. 3, 2021, pp. 27–81.10.1007/s00894-021-04697-1Search in Google Scholar
[47] Long Z., X. Tang, N. Guo, Y. Ding, W. Ma, L. You, et al. Atomistic-scale investigation of self-healing mechanism in Nano-silica modified asphalt through molecular dynamics simulation. Journal of Infrastructure Preservation and Resilience, Vol. 3, No. 1, 2022, id. 4.10.1186/s43065-022-00049-2Search in Google Scholar
[48] Barton, N. J. E. G. Review of a new shear-strength criterion for rock joints. Engineering Geology, Vol. 7, No. 4, 1973, pp. 287–332.10.1016/0013-7952(73)90013-6Search in Google Scholar
© 2022 Feng Ji et al., published by De Gruyter
This work is licensed under the Creative Commons Attribution 4.0 International License.
Articles in the same Issue
- Review Articles
- State of the art, challenges, and emerging trends: Geopolymer composite reinforced by dispersed steel fibers
- A review on the properties of concrete reinforced with recycled steel fiber from waste tires
- Copper ternary oxides as photocathodes for solar-driven CO2 reduction
- Properties of fresh and hardened self-compacting concrete incorporating rice husk ash: A review
- Basic mechanical and fatigue properties of rubber materials and components for railway vehicles: A literature survey
- Research progress on durability of marine concrete under the combined action of Cl− erosion, carbonation, and dry–wet cycles
- Delivery systems in nanocosmeceuticals
- Study on the preparation process and sintering performance of doped nano-silver paste
- Analysis of the interactions between nonoxide reinforcements and Al–Si–Cu–Mg matrices
- Research Articles
- Study on the influence of structural form and parameters on vibration characteristics of typical ship structures
- Deterioration characteristics of recycled aggregate concrete subjected to coupling effect with salt and frost
- Novel approach to improve shale stability using super-amphiphobic nanoscale materials in water-based drilling fluids and its field application
- Research on the low-frequency multiline spectrum vibration control of offshore platforms
- Multiple wide band gaps in a convex-like holey phononic crystal strip
- Response analysis and optimization of the air spring with epistemic uncertainties
- Molecular dynamics of C–S–H production in graphene oxide environment
- Residual stress relief mechanisms of 2219 Al–Cu alloy by thermal stress relief method
- Characteristics and microstructures of the GFRP waste powder/GGBS-based geopolymer paste and concrete
- Development and performance evaluation of a novel environmentally friendly adsorbent for waste water-based drilling fluids
- Determination of shear stresses in the measurement area of a modified wood sample
- Influence of ettringite on the crack self-repairing of cement-based materials in a hydraulic environment
- Multiple load recognition and fatigue assessment on longitudinal stop of railway freight car
- Synthesis and characterization of nano-SiO2@octadecylbisimidazoline quaternary ammonium salt used as acidizing corrosion inhibitor
- Perforated steel for realizing extraordinary ductility under compression: Testing and finite element modeling
- The influence of oiled fiber, freeze-thawing cycle, and sulfate attack on strain hardening cement-based composites
- Perforated steel block of realizing large ductility under compression: Parametric study and stress–strain modeling
- Study on dynamic viscoelastic constitutive model of nonwater reacted polyurethane grouting materials based on DMA
- Mechanical behavior and mechanism investigation on the optimized and novel bio-inspired nonpneumatic composite tires
- Effect of cooling rate on the microstructure and thermal expansion properties of Al–Mn–Fe alloy
- Research on process optimization and rapid prediction method of thermal vibration stress relief for 2219 aluminum alloy rings
- Failure prevention of seafloor composite pipelines using enhanced strain-based design
- Deterioration of concrete under the coupling action of freeze–thaw cycles and salt solution erosion
- Creep rupture behavior of 2.25Cr1Mo0.25V steel and weld for hydrogenation reactors under different stress levels
- Statistical damage constitutive model for the two-component foaming polymer grouting material
- Nano-structural and nano-constraint behavior of mortar containing silica aggregates
- Influence of recycled clay brick aggregate on the mechanical properties of concrete
- Effect of LDH on the dissolution and adsorption behaviors of sulfate in Portland cement early hydration process
- Comparison of properties of colorless and transparent polyimide films using various diamine monomers
- Study in the parameter influence on underwater acoustic radiation characteristics of cylindrical shells
- Experimental study on basic mechanical properties of recycled steel fiber reinforced concrete
- Dynamic characteristic analysis of acoustic black hole in typical raft structure
- A semi-analytical method for dynamic analysis of a rectangular plate with general boundary conditions based on FSDT
- Research on modification of mechanical properties of recycled aggregate concrete by replacing sand with graphite tailings
- Dynamic response of Voronoi structures with gradient perpendicular to the impact direction
- Deposition mechanisms and characteristics of nano-modified multimodal Cr3C2–NiCr coatings sprayed by HVOF
- Effect of excitation type on vibration characteristics of typical ship grillage structure
- Study on the nanoscale mechanical properties of graphene oxide–enhanced shear resisting cement
- Experimental investigation on static compressive toughness of steel fiber rubber concrete
- Study on the stress field concentration at the tip of elliptical cracks
- Corrosion resistance of 6061-T6 aluminium alloy and its feasibility of near-surface reinforcements in concrete structure
- Effect of the synthesis method on the MnCo2O4 towards the photocatalytic production of H2
- Experimental study of the shear strength criterion of rock structural plane based on three-dimensional surface description
- Evaluation of wear and corrosion properties of FSWed aluminum alloy plates of AA2020-T4 with heat treatment under different aging periods
- Thermal–mechanical coupling deformation difference analysis for the flexspline of a harmonic drive
- Frost resistance of fiber-reinforced self-compacting recycled concrete
- High-temperature treated TiO2 modified with 3-aminopropyltriethoxysilane as photoactive nanomaterials
- Effect of nano Al2O3 particles on the mechanical and wear properties of Al/Al2O3 composites manufactured via ARB
- Co3O4 nanoparticles embedded in electrospun carbon nanofibers as free-standing nanocomposite electrodes as highly sensitive enzyme-free glucose biosensors
- Effect of freeze–thaw cycles on deformation properties of deep foundation pit supported by pile-anchor in Harbin
- Temperature-porosity-dependent elastic modulus model for metallic materials
- Effect of diffusion on interfacial properties of polyurethane-modified asphalt–aggregate using molecular dynamic simulation
- Experimental study on comprehensive improvement of shear strength and erosion resistance of yellow mud in Qiang Village
- A novel method for low-cost and rapid preparation of nanoporous phenolic aerogels and its performance regulation mechanism
- In situ bow reduction during sublimation growth of cubic silicon carbide
- Adhesion behaviour of 3D printed polyamide–carbon fibre composite filament
- An experimental investigation and machine learning-based prediction for seismic performance of steel tubular column filled with recycled aggregate concrete
- Effects of rare earth metals on microstructure, mechanical properties, and pitting corrosion of 27% Cr hyper duplex stainless steel
- Application research of acoustic black hole in floating raft vibration isolation system
- Multi-objective parametric optimization on the EDM machining of hybrid SiCp/Grp/aluminum nanocomposites using Non-dominating Sorting Genetic Algorithm (NSGA-II): Fabrication and microstructural characterizations
- Estimating of cutting force and surface roughness in turning of GFRP composites with different orientation angles using artificial neural network
- Displacement recovery and energy dissipation of crimped NiTi SMA fibers during cyclic pullout tests