Effect of cooling rate on the microstructure and thermal expansion properties of Al–Mn–Fe alloy
-
Juan Wang
 ,
Hongbo Duan
,
Hongbo Duan

Abstract
Al–Mn–Fe alloy was prepared by traditional casting, injection casting, and melt spinning. The effect of cooling rate on the microstructure of alloy was studied. Results show that the phases in the alloy are the same for the three methods, including quasicrystal icosahedral phase (I-phase), Al6Mn phase, and Al phase. With the increase in cooling rate, the morphology of the I-phase changed from long strips to short rods and gradually to a daisy shape, and the content of the I-phase increased from 28 to 70%. Meanwhile, the morphology of the Al6Mn phase in the alloy changed from long bars to short rods, and the content decreased from 45 to 20%. Meanwhile, the thermal expansion coefficient of the alloy in the injection casting state is significantly reduced by about 15% at all temperature stages compared with that in as-cast state, and the results show that an appropriate cooling rate can improve the microstructure and properties of the alloy.
1 Introduction
Quasicrystals were first discovered in Al–Mn alloys [1,2] and have received a lot of attention from researchers because of their high hardness, high wear resistance, good corrosion resistance, and low coefficient of thermal expansion [3]. However, quasicrystals have the disadvantage of being brittle. Generally, quasicrystals can be divided into aluminum-based, magnesium-based, and titanium-based. Aluminum base is the most widely studied, especially Al–Cu–Fe series and Al–Mn series. Because the added elements are cheap, easy to obtain, and non-toxic, they are very popular. Meanwhile, Al–Mn alloy is used widely due to the formation of part of the pure aluminum phase and to a certain extent to improve the brittleness of the alloy.
However, the Al–Mn alloy suffers from poor thermal stability and is in a sub-stable state. So researchers tried to further improve the stability of the alloy by the addition of transition group elements [4,5]. For example, the studies on the Al–Mn system were focused on the influence of alloying elements like Fe [6], Be [7], and Ce [8] on its microstructure and properties. However, the addition of a third or even multiple elements can be problematic; for example, the addition of Be increases the ability of I-phase nucleation in the alloy [9,10,11]. However, beryllium is known for being carcinogenic and causing other serious diseases such as berylliosis [12]. Thus, other elements that could enhance the I-phase formation during conventional casting processes are desirable. Cerium was reported to be an effective addition in improving the I-phase formation in Al–Mn alloys under different solidification conditions [13]; nonetheless, its effectiveness was recently disputed by Coury et al. [14].
Combined with related studies [15,16,17,18], the addition of Fe not only increases the thermal stability of the alloy, but also increases the ability to form quasicrystalline phases, and Fe is cheap, easily available, and non-toxic. The effect of iron addition on the formed phases of the alloy has also been studied in the literature [19,20], but there are few systematic studies in the literature on the types, morphology, and thermal expansion properties of the formed phases of the alloy under different preparation processes.
At the same time, combined with the research work of Balanetskyy et al. [20], it can be seen that the partial isothermal section of Al–Mn–Fe alloy rich in aluminum at 740, 695, and 650°C is shown in Figure 1(a–c). Also, the Al6Mn phase exists in the isothermal section at three temperatures. Then, when a faster cooling rate is adopted, does the Al6Mn phase exist in the alloy? If so, what are the changes in the morphology and quantity of the Al6Mn phase? Meanwhile, it is well known that the formation process of the I-phase is closely related to the cooling rate. The changes in microstructure and properties of alloys prepared by traditional casting, injection casting, and melt spinning were studied, which laid a foundation for the systematic study of Al–Mn–Fe alloy.
![Figure 1
Partial isothermal section of Al–Mn–Fe alloy at 740°C (a), 695°C (b) and 650°C (c) [20]. Reproduced by permission of Elsevier.](/document/doi/10.1515/rams-2022-0031/asset/graphic/j_rams-2022-0031_fig_001.jpg)
Partial isothermal section of Al–Mn–Fe alloy at 740°C (a), 695°C (b) and 650°C (c) [20]. Reproduced by permission of Elsevier.
In this study, Al83Mn14Fe3 alloy was produced by adding the appropriate amount of iron. The microstructure and thermal expansion properties of the Al–Mn–Fe alloys prepared by ordinary iron mold casting, copper mold injection casting method, and melt spinning were analyzed. Combined with the relevant literature [21], the three preparation methods were found to correspond to cooling rates of 10−1 to 10−2, 102, and 105 K·s−1, respectively. The present study was conducted to further determine the effect of the cooling rate on the microstructure as well as the thermal expansion properties of the alloy, with a view to obtaining quasicrystalline alloys with high quasicrystalline content, relatively low brittleness, and excellent microstructure and properties.
2 Experimental details
2.1 Preparation of materials
In this study, the following raw materials were used, including high-purity Al (99.99 wt%), Al–50Mn (99.98 wt%), and Al–60Fe (99.98 wt%) master alloys. The samples were dosed according to the atomic ratio of Al83Mn14Fe3 (in atomic percent, at%) and melted in an intermediate frequency induction melting furnace. The weight of the alloy ingot obtained by this method is about 1 kg.
Then, the samples were poured into the metal iron mold preheated to 180°C, and the samples prepared by the traditional casting method were obtained after cooling. Subsequently, this sample was used as the master alloy to prepare injection casting samples and melt-spun samples by a high vacuum single-roller spin quenching and injection-casting system under an argon-protected atmosphere. A copper mold was used to prepare the injection casting sample, and a rod of 2 mm diameter was obtained. During the preparation using the melt-spinning process, the melt was ejected onto a copper wheel rotating at a speed of about 3,500 rpm, corresponding to a cooling rate of about 105 K·s−1. The pressure of the gas ejecting the molten alloy was 180 mbar. A strip with a thickness of about 20–30 μm and a width of 2–3 mm was obtained. Table 1 gives a summary of the three cooling methods used in this study.
Brief introduction of three preparation processes
| Preparation process | Cooling method | Cooling rate |
|---|---|---|
| Conventional casting | Iron mold pouring, air cooling | 10−1 to 10−2 K·s−1 |
| Injection casting | 2-mm diameter copper mold cooling | 102 K·s−1 [21] |
| Single copper roller melt-spinning method | High-speed rotating copper roller for cooling | 105 K·s−1 [21,22] |
When Al83Mn14Fe3 alloy is prepared using iron mold, the cooling rate is determined by analyzing the microstructure as in ref. [19]. The schematic diagram of iron mold used in conventional casting in this experiment is shown in Figure 2. It is consistent with the mold used in ref. [19] in length and width direction, so the cooling rate of iron mold is determined in combination with the research of Stan-Głowińska et al. [19]. When the alloy bar is prepared using injection casting, the cooling rate is determined according to the research results of Stan-Głowińska et al. [21]. For the powder samples prepared using the single copper roller melt-spinning method, the cooling rate is determined in combination with the research of Cantor [22,23]. Figure 3 shows the process flowchart of melt spinning. Since the injection casting process is consistent with the melt-spinning process, only the melt-spinning process flowchart is shown here.

Schematic diagram of iron mold cavity used in the experiment.
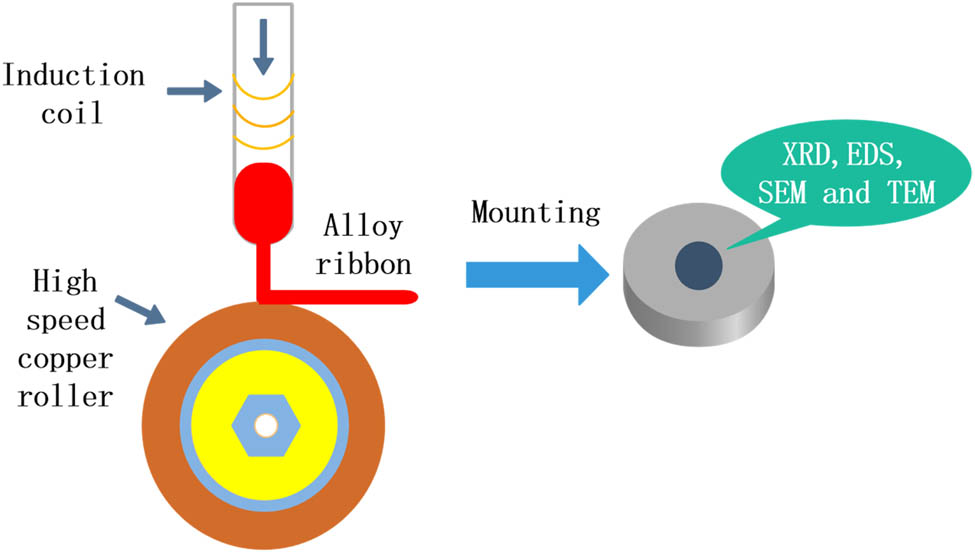
The process flowchart of the single copper roller melt-spinning method.
The specific operation process is as follows: knock down a small piece of conventionally cast alloy, put it into the quartz tube, and melt it through the induction coil. After that, the red molten alloy liquid forms a strip belt driven by the high-speed rotating copper roller, which is the preparation of melt-spinning samples. After that, the melt-spinning sample is cold-mounted with mounting powder and mounting liquid, and then, the cast sample and the cold-mounted melt-spinning sample are mechanically ground and polished, adopted the diluted Keller’s reagent (consisting of 2.5 mL HNO3, 1.0 mL HF, 1.5 mL HCl, and 95 mL water) to be the etchant for those samples polished, and the microstructure was observed.
2.2 Material characterization methods
X-Ray diffractometer (XRD-6000) was used to analyze the formed phases of the samples under the three preparation process conditions, and scanning electron microscope, energy spectrum analyzer, and transmission electron microscope (JEM-2010) were used to characterize the microstructures of the alloys. The area fractions of the I-phase as well as the Al6Mn phase in the samples under the three preparation process conditions were calculated using Image-Pro Plus 6.0 software. The quantitative analysis of phases is carried out according to Rietveld method (Ratio of Intensity Reference [RIR] method), and then, the content distribution of each phase in the alloy is further determined by comparing the measured data of Image-Pro Plus 6.0 software. Each sample was calculated 30 times under the same process based on scanning morphology at different magnifications, and then, the average value was taken as the final calculation result.
Microstructures were analyzed using scanning electron microscopy (SEM, TESCAN, VEGA II-XMU). The SEM instrument was coupled with high-resolution transmission electron microscopy (HRTEM, JM-2010) as well as energy-dispersive X-ray spectroscopy (EDS). We also conducted EDS point analysis and X-ray elemental mapping for exploring diverse phase nature and elemental distribution of Al–Mn–Fe samples.
In the presence of Cu Kα radiation (λ = 0.15406 nm), we recorded the X-ray diffraction (XRD-6000) patterns of Al–Mn–Fe samples under three preparation process conditions. The scanning speed and scanning angle were set at 4°·min−1 and 10–90°, respectively. The thermal expansion characteristics of the material were studied using a thermomechanical analyzer (TMA/SDTA-840) in different treatment states, with heating temperatures from room temperature to 500°C at the 5°C·min−1 heating rate, protected by argon atmosphere. The computer was utilized to record all data, while Mettler Toledo thermal analysis system was adopted for data analysis.
3 Results
3.1 Analysis of X-ray diffraction results of Al83Mn14Fe3 alloy at different cooling rates
Figure 4 shows the analysis of X-ray diffraction results of Al–Mn–Fe alloy at different cooling rates. It can be seen from Figure 4 that when Al83Mn14Fe3 alloy is prepared using the traditional casting method, the main formation phases in the alloy are the Al6Mn phase, I-phase, and face centered cubic aluminum phase. When the cooling rate is increased and the 2 mm quasicrystal alloy bar is prepared using injection casting, the diffraction peak intensity corresponding to the I-phase in the alloy increases. It shows that when the composition is constant, the increase in the cooling rate is conducive to the formation of the I-phase in the alloy. When the cooling rate is further increased and the alloy is prepared using melt-spinning process, the diffraction peak intensity corresponding to I-phase in the alloy is significantly increased, and the peak intensity corresponding to Al phase and Al6Mn phase is significantly reduced.

XRD patterns of Al–Mn–Fe alloy at different cooling rates.
3.2 Microstructure of Al83Mn14Fe3 alloys at different cooling rates
The equilibrium crystallization process of Al83Mn14Fe3 alloy is simulated using Pandat software, and the simulation results are shown in Figure 5. It can be seen that under the condition of equilibrium crystallization, the alloy is composed of face-centered cubic aluminum phase and Al6Mn phase. During the solidification process of the alloy, the Al4Fe phase precipitates from the liquid phase first with the decrease in temperature. Before the alloy is at lower than about 700°C, the alloy has only Al4Fe phase and liquid phase. At about 700°C, the Al4Fe phase in the alloy disappears, and Al6Mn phase and Al13Fe4 phase appear at the same time. When the temperature is about 640°C, all the liquid phases are consumed. At this time, there are only three phases in the alloy, and with the progress of the solidification process, the Al6Mn phase increases, while face-centered cubic aluminum phase and Al13Fe4 phase decrease slowly. It shows that with the decrease in temperature, the Al13Fe4 phase reacts with the liquid phase to form the Al6Mn phase. Until the end of the solidification process, the alloy only contains face-centered cubic aluminum phase and Al6Mn phase.

Simulation of Al–Mn–Fe alloy equilibrium crystallization process.
According to the XRD analysis results of the alloy at different cooling rates, the phase in the alloy has a quasicrystal I-phase at three cooling rates, but this phase does not appear in the just balanced crystallization process. It shows that the quasicrystal I-phase is formed in the process of nonequilibrium solidification. Even for the alloy prepared by iron mold, the cooling rate is still greater than that in the process of equilibrium crystallization.
Figure 6(a–c) shows the microstructure of the alloy in the as-cast state. It can be seen that the alloy is mainly composed of black area, dark gray area, and light gray area, where the dark gray area is surrounded by the light gray area, and both of them show a striped distribution. In order to further determine the formation phases represented by each region in the alloy, energy spectra and element area distribution analysis were performed to determine the phases represented by each region in the alloy, as well as the distribution of elements in each region. As can be seen from Figure 6a, the black area is the pure Al-phase, which is mainly composed of aluminum elements and also contains a small amount of manganese elements. The dark gray area is the Al6Mn phase, striped and distributed around the light gray phase, containing a particularly small amount of iron elements, mainly composed of Al and Mn elements. The light gray area shows the I-phase.

Morphology of Al–Mn–Fe alloy in the as-cast state at different magnification: (a) 500×, (b) 1.00k×, (c) 2.00 k×.
Combining Figures 6 and 7, it can be seen that the Al6(Mn, Fe) phase is a product of a peritectic reaction, while quasicrystals were formed directly from the undercooled liquid as primary particles. The obtained results suggest that Fe addition enhances the I-phase formation. Although the Al–Mn–Fe alloy was prepared by the traditional casting method, the moderate addition of iron promotes the formation of the I-phase to some extent.

Scanning morphology of Al–Mn–Fe cast alloy at high magnification and EDS.
The elemental distribution of each phase in the alloy was further determined from the analysis of the element area distribution of the alloy. As can be seen in Figure 8, quasicrystalline particles are surrounded by a layer of Al6(Mn, Fe).

Microstructure morphology (a) and SEM-EDS elemental map showing the distribution of Al (b) Mn (c) and Fe (d) of Al–Mn–Fe alloy in the as-cast state.
Figures 9 and 10 show the scanning morphology and energy spectrum of 2 mm quasicrystal alloy rods prepared by a single-roller spin quenching injection casting system. As can be seen from Figure 9, the main phases in the alloy are short rod-shaped with stoichiometry close to I-phase and black aluminum matrix (dark phase in Figure 10a).

Morphology of the Al–Mn–Fe alloy prepared by injection casting method at different magnification: (a) 500×, (b) 1.00k×, (c) 2.00 k×.

Microstructure of the Al–Mn–Fe alloy prepared by injection casting method: (a) SEM image; (b and c) corresponding SAED patterns of the Al6Mn phase and I-phase in (a).
As can be seen from Figure 9, when the Al–Mn–Fe alloy is prepared by the injection casting method with a faster cooling rate, the subcooling degree is greatly increased. The nucleation drive increases and the nucleation mass also increases greatly, which inhibits the formation of coarse dendrites, and the microstructure obtained is fine and needle-like. According to the high-magnification scanning morphology combined with energy spectrum analysis, the main phases in the alloy are the I-phase and aluminum matrix, in which the I-phase presents a needle or rod shape, and the matrix presents a black area, which is distributed around the I-phase. Compared with traditional casting, the content of the I-phase in the alloy increases significantly and the microstructure is refined obviously.
Figure 10b and c shows the microstructure of the alloy prepared by the injection casting process, the electron diffraction pattern of the Al6Mn phase in the alloy, and the diffraction pattern of the I-phase in the direction of the fifth axis of symmetry. Due to the brittleness of the material itself, the electron diffraction pattern of the I-phase is observed through the powder sample. The injection cast sample is ground, sieved, and filtered through a copper mesh, and the transmission sample is observed. The original morphology of the sample is damaged during grinding, so only the selected area electron diffraction pattern is shown here. Figure 10b shows the electron diffraction spots of the Al6Mn phase of the dark gray phase orthorhombic system surrounded by the I-phase, and TEM studies revealed that the observed Al6Mn phase can be indexed as the orthorhombic Al6Mn phase with lattice parameters a = 7.56 Å, b = 6.5 Å, and c = 8.87 Å.
The Al83Mn14Fe3 alloy was prepared using the melt-spinning method by further increasing the cooling rate. The morphology of the alloy is shown in Figure 11a–c. Due to the large cooling speed of the melt spinning method, the obtained microstructure is very fine, like a budding flower. The phases in the alloy were further determined to be mainly I-phases with a daisy-like shape by high-magnification scanning morphology combined with relevant literature [24]. It shows that the I-phase increases gradually with the increase in the cooling rate. It can be seen from the microstructure patterns of different cooling rates that the microstructure of the alloy becomes smaller and smaller with the increase in the cooling rate. At the same time, the I-phase morphology changed significantly, from a long strip shape to a short rod shape, and then to a chrysanthemum shape. Careful observation shows that there are some pentagonal small quasicrystals with small particles near the chrysanthemum I-phases. The reason for these small quasicrystals is that the cooling rate increases and atoms do not have time to fully diffuse, so the sizes of I-phase particles are different.

Morphology of Al–Mn–Fe alloy prepared by melt spinning.
3.3 Coefficient of thermal expansion of Al83Mn14Fe3 alloy at different cooling rates
The coefficient of thermal expansion of Al83Mn14Fe3 alloy in normal cast state and copper mold injection cast state was tested at each temperature stage of 30–100, 30–200, 30–300, 30–400, and 30–500°C, and the test results are shown in Figure 12. As can be seen from Figure 12, the coefficient of thermal expansion increases gradually with the increase in temperature in both states. However, a longitudinal comparison shows that the coefficient of thermal expansion of the bar alloy at all temperature stages is lower than that in the as-cast state, especially at 30–100°C, which is about 15% lower, indicating that a suitable cooling rate not only improves the alloy morphology but also enhances the alloy properties.

Thermal expansion coefficient of Al–Mn–Fe alloy at different temperature stages during casting and injection casting.
The phenomenon of thermal expansion of matter is a well-known fact, and most substances, with the exception of a few, increase in volume with increasing temperature while external forces remain constant. Let all the atoms in the crystal vibrate at the same frequency. As the temperature increases, the amplitude of the lattice junction increases, and the vibration of the junction is non-simple harmonic vibration, so the temperature increases, the equilibrium position of the lattice junction pushes outward, and the cell size increases, and the expansion property is displayed [23,25].
At the same time, the expansion coefficient of the alloy at each temperature stage is small when injection casting. The reasons are as follows: the cooling rate is large when preparing the bar, the content of the I-phase in the alloy is large, and the thermal expansion coefficient of the I-phase is small, which makes the thermal expansion coefficient of the whole alloy low. At the same time, the cooling rate of the injection casting state is large, which makes the alloy structure smaller, and the hindrance of dislocation movement is strong, which makes the binding force between atoms stronger in the process of thermal expansion, so the overall thermal expansion coefficient is small.
4 Discussion
In order to determine the grain size of Al83Mn14Fe3 alloy prepared by different processes, the XRD spectrum in Figure 4 is used as the calculation basis and calculated according to the Scherrer formula [26]:
where D is the crystallite size; K is the particle shape factor, 0.943; λ is the X-ray wavelength, 0.15406 nm; β hkl is the half-width of (hkl) reflection; and θ = 2θ/2 is the Bragg angle corresponding to (hkl) reflection.
The average grain size of materials under three different processes is calculated. First, we need to determine peak position and FWHM from XRD data, and then, we put it in the Scherrer equation for the calculation of crystallites size. First, import the XRD test data into Origin software, click Analysis, open multiple peak fit in peaks and baseline for fitting, and get the value corresponding to xc and FWHM. Values of xc and FWHM are used in formula (1) for calculation. The calculation results are as follows (Tables 2 and 3).
Calculation parameters of crystallite size under three processes
| Traditional casting | Injection casting | Melt spinning | ||||||
|---|---|---|---|---|---|---|---|---|
| Peak position (2 theta) | FWHM | Crystallite size D (nm) | Peak position (2 theta) | FWHM | Crystallite Size D (nm) | Peak position (2 theta) | FWHM | Crystallite size D (nm) |
| 23.645 | 0.495 | 17.174 | 62.428 | 4.646 | 2.095 | 43.727 | 0.635 | 14.130 |
| 22.133 | 0.566 | 14.983 | 60.959 | 52.646 | 0.183 | 40.978 | 5.682 | 1.564 |
| 17.977 | 0.402 | 20.964 | 44.775 | 0.528 | 17.041 | 40.075 | 37.398 | 0.237 |
| 43.629 | 0.512 | 17.522 | 43.644 | 0.591 | 15.177 | 27.156 | 0.525 | 16.310 |
| 44.763 | 0.442 | 20.366 | 39.798 | 0.482 | 18.382 | 44.847 | 422.422 | 0.021 |
| 78.304 | 0.579 | 18.543 | 62.428 | 101.148 | 0.096 | 44.847 | 81.220 | 0.111 |
| 41.674 | 4.702 | 1.894 | 87.053 | 10.363 | 1.108 | 84.516 | 83.189 | 0.135 |
Statistics of average crystallite size under three processes
| Method | Average crystallite size (nm) |
|---|---|
| Traditional casting | 10.598 |
| Injection casting | 6.828 |
| Melt spinning | 4.644 |
It can be seen that when the melt spinning technology is used to prepare samples, the grain size is the smallest, followed by the alloy prepared using the spray casting method, and the alloy grain prepared using an iron mold is relatively large.
The quantitative analysis of phases is carried out according to the Rietveld method (RIR method). The specific steps are as follows: open jade 6.0 software and then click search/match to determine the type of phase and the K value (RIR) of each phase. The phases of the three preparation processes are mainly Al6Mn phase, I-phase, and pure aluminum phase. Click Analyze → Fit Peak Profile → Refine. Then, open Options → Calc wt% to calculate the mass fraction of each phase. The calculation results are shown in Figure 13.

Weight percentage of each phase under three processes (a) traditional casting, (b) injection casting and (c) melt spinning.
In order to quantitatively estimate and compare the content of the I-phase in the alloy at three cooling rates, the area fraction of the I-phase in the alloy was measured using Image Pro Plus 6.0 software. The calculation process is as follows: open the scanned image to be calculated and find Count/Size in Measure. In select Ranges, select the dark gray corresponding to I-phase, that is, the area of the color to be counted, and click Count to calculate. It can be seen that there are less quasicrystals in the alloy as cast, about 28%. With the increase in the cooling rate, the area fraction of the I-phase increases. When the alloy is prepared using melt spinning, the area fraction of the I-phase in the alloy increases significantly, about 70%. As the cooling rate increases, the actual crystallization temperature decreases, the subcooling degree increases, the crystallization driving force increases, and the nucleation rate (N) and the growth rate (G) are large [27]. And the increase in nucleation rate is faster than the increase in growth rate, which improves the ratio between N and G and the grain refinement. It shows that the proper adjustment of the cooling rate is conducive to the formation of the I-phase.
With the increase in the cooling rate, the undercooling degree increases and the nucleation rate increases. At the same time, due to the increase in cooling rate, the actual crystallization temperature of the alloy decreases, the diffusion after nucleation is not sufficient, and there is no time to fully grow, so the microstructure of the alloy is refined [27,28]. The formation of the I-phase is closely related to the cooling rate. In the case of slow cooling, I-phase is formed by peritectic reaction, but with the increase in cooling rate, I-phase can be solidified and precipitated directly from supercooled liquid [29]. At the same time, the formation of the I-phase is different from the solidification of amorphous. It needs to go through the process of nucleation and growth, which are controlled by atomic diffusion. Therefore, when the cooling rate increases, the I-phase formed is fine [30].
The results show that the cooling rate has no significant effect on the formed phase of the alloy, but has a significant effect on the morphology of the phase. In other words, the quasicrystal I-phase exists in the alloys prepared under the three processes, but the morphology of this phase changes significantly with the increase in cooling rate, which is the result of the change of cooling rate. With the increase in cooling rate, the microstructure of the alloy is obviously refined, especially the alloy prepared by the melt spinning process. At a very high cooling rate, the initial dendritic shape changes to a more cell-like shape. This phenomenon is consistent with the research conclusion of Antonsson and Fredriksson [31], that is, at a very high cooling rate, the solidification sequence and microstructure change from dendrite to cellular crystal and then to non-diffusion phase transition. Combined with the research materials in this article, it can be seen that when the cooling rate increases, the quasicrystal I-phase in the alloy precipitates directly from the liquid phase, and there is no time to fully grow, so the microstructure is fine.
5 Conclusion
The Al83Mn14Fe3 alloy was prepared using traditional casting, copper mold injection casting, and melt spinning, and the effects of different cold rates on the microstructure and thermal expansion properties were investigated as follows:
With the increase in the cooling rate, the content of the I-phase gradually increases, and its morphology changes from long strips to short rods and gradually to daisy-like.
A gradual decrease in the Al6Mn phase in the alloy as the cooling rate increases.
The increase in cooling rate improves the thermal expansion properties of the alloy and yields alloys with high I-phase content and low coefficient of thermal expansion, laying the foundation for the study of quasicrystalline materials.
Acknowledgments
The authors thank the team members from Shaanxi magnesium aluminum light alloy composite Engineering Research Center, School of Materials and Chemical Engineering, Xi’an Technological University, Xi’an, China.
-
Funding information: This study was financially supported by the Shaanxi Creative Talents Promotion Plan-technological Innovation Team under Grant 2017KCT-05, Key Project of Equipment Pre-research Field Fund under Grant 6140922010301, Shaanxi Provincial Key Research and Development Project under Grant 2019ZDLGY05-09, Shaanxi Provincial Education Department to Serve the Local Special Plan Project under Grant 19JC022, and Yulin Science and Technology Bureau Project under Grant 2019-121.
-
Author contributions: Juan Wang: conceptualization, methodology, formal analysis, investigation, writing-original draft, editing; Zhong Yang: resources, supervision and data curation; Hongbo Duan, Wei Yang: methodology; Zhijun Ma: editing; Jianping Li: validation and supervision.
-
Conflict of interest: Authors state no conflict of interest.
-
Data availability statement: Data available on request due to restrictions, for example, privacy or ethical.
References
[1] Tsai, A. P., A. Inoue, and T. Masumoto. A stable quasicrystal in Al–Cu–Fe System. Japanese Journal of Applied Physics, Vol. 26, No. 9A, 1987, id. L1505.10.1143/JJAP.26.L1505Search in Google Scholar
[2] Yadav, T. P. and N. K. Mukhopadhyay. Quasicrystal: A low frictional novel material. Chemical Engineering, Vol. 19, 2018, pp. 163–169.10.1016/j.coche.2018.03.005Search in Google Scholar
[3] Suck, J. B., M. Schreiber, and P. Hussler. Quasicrystals: An introduction to structure, physical properties and applications, 2002nd edition (23 July 2002), Springer, 2002.10.1007/978-3-662-05028-6Search in Google Scholar
[4] Galano, M., F. Audebert, A. G. Escorial, I. C. Stone, and B. Cantor. Nanoquasicrystalline Al–Fe–Cr-based alloys with high strength at elevated temperature. Journal of Alloys and Compounds, Vol. 495, No. 2, 2010, pp. 372–376.10.1016/j.jallcom.2009.10.208Search in Google Scholar
[5] Vojtěch, D., A. Michalcová, F. Průša, K. Dám, and P. Šedá. Properties of the thermally stable Al95Cr3.1Fe1.1Ti0.8 alloy prepared by cold-compression at ultra-high pressure and by hot-extrusion. Materials Characterization, Vol. 66, No. 1, 2012, pp. 83–92.10.1016/j.matchar.2012.02.011Search in Google Scholar
[6] Singh, A. and S. Ranganathan. A transmission electron microscopic study of icosahedral twins--I. Rapidly solidified Al–Mn–Fe alloys. Acta Metallurgica Et Materialia, Vol. 43, No. 9, 1995, pp. 3539–3551.10.1016/0956-7151(95)00024-PSearch in Google Scholar
[7] Zupanič, F., T. Bončina, A. Križman, W. Grogger, C. Gspan, B. Markoli, et al. Quasicrystalline phase in melt-spun Al–Mn–Be ribbons. Journal of Alloys & Compounds, Vol. 452, No. 2, 2008, pp. 343–347.10.1016/j.jallcom.2006.11.041Search in Google Scholar
[8] Inoue, A., M. Watanabe, H. M. Kimura, F. Takahashi, A. Nagata, and T. Masumoto. High mechanical strength of quasicrystalline phase surrounded by fcc-Al phase in rapidly solidified Al–Mn–Ce alloys. Materials Transactions, JIM, Vol. 33, 1992, pp. 723–729.10.2320/matertrans1989.33.723Search in Google Scholar
[9] Chang, H. J., E. Fleury, G. S. Song, M. H. Lee, W. T. Kim, and D. H. Kim. Microstructure modification and quasicrystalline phase formation in Al–Mn–Si–Be cast alloys. Materials Science & Engineering A, Vol. 375–377, 2004, pp. 992–997.10.1016/j.msea.2003.10.004Search in Google Scholar
[10] Chang, H. J., E. Fleury, G. S. Song, W. T. Kim, and D. H. Kim. Formation of quasicrystalline phases in Al-rich Al–Mn–Be alloys. Journal of Non-Crystalline Solids, Vol. 334, 2004, pp. 12–16.10.1016/j.jnoncrysol.2003.11.005Search in Google Scholar
[11] Zupanic, F., T. Boncina, N. Rozman, I. Anzel, W. Grogger, C. Gspan, et al. Development of an Al–Mn–Be–Cu alloy with improved quasicrystalline forming ability. International Journal for Structural Physical & Chemical Aspects of Crystalline Materials, Vol. 223, No. 11–12, 2008, pp. 735–738.10.1524/zkri.2008.1037Search in Google Scholar
[12] Eisenbud, M., P. Kotin, and F. Miller. Is beryllium carcinogenic in humans? Journal of Occupational & Environmental Medicine, Vol. 39, No. 3, 1997, pp. 205–208.10.1097/00043764-199703000-00009Search in Google Scholar
[13] Schurack, F., J. Eckert, and L. Schultz. Synthesis and mechanical properties of cast quasicrystal-reinforced Al-alloys. Acta Materialia, Vol. 49, No. 8, 2001, pp. 1351–1361.10.1016/S1359-6454(01)00045-3Search in Google Scholar
[14] Coury, F. G., W. J. Botta, C. Bolfarini, C. S. Kiminami, and M. J. Kaufman. Reassessment of the effects of Ce on quasicrystal formation and microstructural evolution in rapidly solidified Al–Mn alloys. Acta Materialia, Vol. 98, 2015, pp. 221–228.10.1016/j.actamat.2015.07.046Search in Google Scholar
[15] Stan, K., L. Lityńska-Dobrzyńska, J. Dutkiewicz, L. Rogal, and A. M. Janus. TEM study of quasicrystals in Al–Mn–Fe melt-spun ribbon. Solid State Phenomena, Vol. 186, 2012, pp. 255–258.10.4028/www.scientific.net/SSP.186.255Search in Google Scholar
[16] Stan, K., L. Lityńska-Dobrzyńska, J. L. Lábár, and A. Góral. Effect of Mo on stability of quasicrystalline phase in Al–Mn–Fe alloy. Journal of Alloys and Compounds, Vol. 586, 2014, pp. S395–S399.10.1016/j.jallcom.2012.12.013Search in Google Scholar
[17] Stan-Głowińska, K., L. Lityńska-Dobrzyńska, B. Kania, J. Dutkiewicz, W. Skuza, J. Wojewoda-Budka, et al. Effects of hot-compaction on the structure and properties of AlMn-Fe-X alloys strengthened with quasi-crystalline icosahedral phase. Materials & Design, Vol. 126, 2017, pp. 162–173.10.1016/j.matdes.2017.04.043Search in Google Scholar
[18] Stan-Głowińska, K. and L. Lityńska-Dobrzyńska. Influence of Fe addition on the formation of a quasicrystalline phase in bulk Al-rich Al-Mn base alloys. Materials Characterization, Vol. 128, 2017, pp. 203–208.10.1016/j.matchar.2017.04.006Search in Google Scholar
[19] Stan-Głowińska, K., L. Lityńska-Dobrzyńska, and Ł. Rogal. Influence of Fe addition on the formation of a quasicrystalline phase in bulk Al-rich Al Mn base alloys. Materials Characterization, Vol. 128, 2017, pp. 203–208.10.1016/j.matchar.2017.04.006Search in Google Scholar
[20] Balanetskyy, S., D. Pavlyuchkov, T. Velikanova, and B. Grushko. The Al-rich region of the Al-Fe-Mn alloy system. Journal of Alloys and Compounds, Vol. 619, 2014, pp. 211–220.10.1016/j.jallcom.2014.08.232Search in Google Scholar
[21] Stan-Głowińska, K., Ł. Rogal, A. Góral, A. Wierzbicka-Miernik, J. Wojewoda-Budka, N. Schell, et al. Formation of a quasicrystalline phase in Al–Mn base alloys cast at intermediate cooling rates. Metals, Vol. 52, 2017, pp. 7794–7807.10.1007/s10853-017-1011-zSearch in Google Scholar
[22] Yang, Y. Microstructure and properties of rapidly solidified Cu–Sn hypoperitectic alloys, Xi’an University of Technology, Xi’an, 2007.Search in Google Scholar
[23] Cantor, B. Fundamentals of rapid solidification: Rapid solidification materials and technologies, Springer, Netherlands, 1986.10.1007/978-94-009-4456-5_1Search in Google Scholar
[24] Li, W., L. Xiaofeng, and Z. Yuqing. Morphology and chemical composition of quasi-crystalline phases in rapidly cooled Al-Mn alloys. Journal of Beijing University of Iron and Steel Technology, Vol. 4, 1986, pp. 13–17.Search in Google Scholar
[25] Feng, N. Study on the microstructures and thermophysical properties of Mg-Zn-Y alloys, Xi’an University of Technology, Xi’an, 2006.Search in Google Scholar
[26] Bokuniaeva, A. and A. Vorokh. Estimation of particle size using the Debye equation and the Scherrer formula for polyphasic TiO2 powder. Journal of Physics: Conference Series, Vol. 1410, 2019, id. 12057.10.1088/1742-6596/1410/1/012057Search in Google Scholar
[27] Hu, G., X. Cai, and Y. Rong. Fundamentals of materials science, Shanghai Jiaotong University Press, Shanghai, 2010.Search in Google Scholar
[28] Zhongguo, W. Effects of the superheating temperature and the cooling history on As-cast microstructure of AZ series magnesium alloys, Chongqing University, Chongqing, 2009.Search in Google Scholar
[29] Li, X. A study of process in Al63Cu25Fe12 quasicrystalline combined with Mg/Al and their alloys, Shanghai Jiao Tong University, Shanghai, 2007.Search in Google Scholar
[30] Liu, J. Study on the preparation, microstructure and property of rapidly solidified Mg–Zn–Y alloy, Nanjing University of Technology, Nanjing, 2006.Search in Google Scholar
[31] Antonsson, T. and H. Fredriksson. The effect of cooling rate on the solidification of INCONEL 718. Metallurgical and Materials Transactions B, Vol. 36, 2005, pp. 85–96.10.1007/s11663-005-0009-0Search in Google Scholar
© 2022 Juan Wang et al., published by De Gruyter
This work is licensed under the Creative Commons Attribution 4.0 International License.
Articles in the same Issue
- Review Articles
- State of the art, challenges, and emerging trends: Geopolymer composite reinforced by dispersed steel fibers
- A review on the properties of concrete reinforced with recycled steel fiber from waste tires
- Copper ternary oxides as photocathodes for solar-driven CO2 reduction
- Properties of fresh and hardened self-compacting concrete incorporating rice husk ash: A review
- Basic mechanical and fatigue properties of rubber materials and components for railway vehicles: A literature survey
- Research progress on durability of marine concrete under the combined action of Cl− erosion, carbonation, and dry–wet cycles
- Delivery systems in nanocosmeceuticals
- Study on the preparation process and sintering performance of doped nano-silver paste
- Analysis of the interactions between nonoxide reinforcements and Al–Si–Cu–Mg matrices
- Research Articles
- Study on the influence of structural form and parameters on vibration characteristics of typical ship structures
- Deterioration characteristics of recycled aggregate concrete subjected to coupling effect with salt and frost
- Novel approach to improve shale stability using super-amphiphobic nanoscale materials in water-based drilling fluids and its field application
- Research on the low-frequency multiline spectrum vibration control of offshore platforms
- Multiple wide band gaps in a convex-like holey phononic crystal strip
- Response analysis and optimization of the air spring with epistemic uncertainties
- Molecular dynamics of C–S–H production in graphene oxide environment
- Residual stress relief mechanisms of 2219 Al–Cu alloy by thermal stress relief method
- Characteristics and microstructures of the GFRP waste powder/GGBS-based geopolymer paste and concrete
- Development and performance evaluation of a novel environmentally friendly adsorbent for waste water-based drilling fluids
- Determination of shear stresses in the measurement area of a modified wood sample
- Influence of ettringite on the crack self-repairing of cement-based materials in a hydraulic environment
- Multiple load recognition and fatigue assessment on longitudinal stop of railway freight car
- Synthesis and characterization of nano-SiO2@octadecylbisimidazoline quaternary ammonium salt used as acidizing corrosion inhibitor
- Perforated steel for realizing extraordinary ductility under compression: Testing and finite element modeling
- The influence of oiled fiber, freeze-thawing cycle, and sulfate attack on strain hardening cement-based composites
- Perforated steel block of realizing large ductility under compression: Parametric study and stress–strain modeling
- Study on dynamic viscoelastic constitutive model of nonwater reacted polyurethane grouting materials based on DMA
- Mechanical behavior and mechanism investigation on the optimized and novel bio-inspired nonpneumatic composite tires
- Effect of cooling rate on the microstructure and thermal expansion properties of Al–Mn–Fe alloy
- Research on process optimization and rapid prediction method of thermal vibration stress relief for 2219 aluminum alloy rings
- Failure prevention of seafloor composite pipelines using enhanced strain-based design
- Deterioration of concrete under the coupling action of freeze–thaw cycles and salt solution erosion
- Creep rupture behavior of 2.25Cr1Mo0.25V steel and weld for hydrogenation reactors under different stress levels
- Statistical damage constitutive model for the two-component foaming polymer grouting material
- Nano-structural and nano-constraint behavior of mortar containing silica aggregates
- Influence of recycled clay brick aggregate on the mechanical properties of concrete
- Effect of LDH on the dissolution and adsorption behaviors of sulfate in Portland cement early hydration process
- Comparison of properties of colorless and transparent polyimide films using various diamine monomers
- Study in the parameter influence on underwater acoustic radiation characteristics of cylindrical shells
- Experimental study on basic mechanical properties of recycled steel fiber reinforced concrete
- Dynamic characteristic analysis of acoustic black hole in typical raft structure
- A semi-analytical method for dynamic analysis of a rectangular plate with general boundary conditions based on FSDT
- Research on modification of mechanical properties of recycled aggregate concrete by replacing sand with graphite tailings
- Dynamic response of Voronoi structures with gradient perpendicular to the impact direction
- Deposition mechanisms and characteristics of nano-modified multimodal Cr3C2–NiCr coatings sprayed by HVOF
- Effect of excitation type on vibration characteristics of typical ship grillage structure
- Study on the nanoscale mechanical properties of graphene oxide–enhanced shear resisting cement
- Experimental investigation on static compressive toughness of steel fiber rubber concrete
- Study on the stress field concentration at the tip of elliptical cracks
- Corrosion resistance of 6061-T6 aluminium alloy and its feasibility of near-surface reinforcements in concrete structure
- Effect of the synthesis method on the MnCo2O4 towards the photocatalytic production of H2
- Experimental study of the shear strength criterion of rock structural plane based on three-dimensional surface description
- Evaluation of wear and corrosion properties of FSWed aluminum alloy plates of AA2020-T4 with heat treatment under different aging periods
- Thermal–mechanical coupling deformation difference analysis for the flexspline of a harmonic drive
- Frost resistance of fiber-reinforced self-compacting recycled concrete
- High-temperature treated TiO2 modified with 3-aminopropyltriethoxysilane as photoactive nanomaterials
- Effect of nano Al2O3 particles on the mechanical and wear properties of Al/Al2O3 composites manufactured via ARB
- Co3O4 nanoparticles embedded in electrospun carbon nanofibers as free-standing nanocomposite electrodes as highly sensitive enzyme-free glucose biosensors
- Effect of freeze–thaw cycles on deformation properties of deep foundation pit supported by pile-anchor in Harbin
- Temperature-porosity-dependent elastic modulus model for metallic materials
- Effect of diffusion on interfacial properties of polyurethane-modified asphalt–aggregate using molecular dynamic simulation
- Experimental study on comprehensive improvement of shear strength and erosion resistance of yellow mud in Qiang Village
- A novel method for low-cost and rapid preparation of nanoporous phenolic aerogels and its performance regulation mechanism
- In situ bow reduction during sublimation growth of cubic silicon carbide
- Adhesion behaviour of 3D printed polyamide–carbon fibre composite filament
- An experimental investigation and machine learning-based prediction for seismic performance of steel tubular column filled with recycled aggregate concrete
- Effects of rare earth metals on microstructure, mechanical properties, and pitting corrosion of 27% Cr hyper duplex stainless steel
- Application research of acoustic black hole in floating raft vibration isolation system
- Multi-objective parametric optimization on the EDM machining of hybrid SiCp/Grp/aluminum nanocomposites using Non-dominating Sorting Genetic Algorithm (NSGA-II): Fabrication and microstructural characterizations
- Estimating of cutting force and surface roughness in turning of GFRP composites with different orientation angles using artificial neural network
- Displacement recovery and energy dissipation of crimped NiTi SMA fibers during cyclic pullout tests