Frost resistance of fiber-reinforced self-compacting recycled concrete
-
Chuanlei Zheng
 ,
Shuxiang Li
,
Shuxiang Li

Abstract
Freeze–thaw damage and the lack of aggregate resources have become two major problems facing the construction industry. The use of recycled aggregate to produce recycled concrete has good social and economic value. In this study, the author used recycled coarse aggregate as a substitute for stone to mix recycled concrete. In order to enhance the performance of concrete, a microwave heating modification process was introduced and 0.10% volume fraction of polypropylene fiber (PPF) was added. The effect of microwave heating modification on the frost resistance of fiber-reinforced self-compacting recycled concrete was studied. The results show that with the increase in the number of freeze–thaw cycles, the degree of denudation and deterioration of the three groups of concrete surfaces becomes more and more serious, the number of surface cracks gradually increases after the concrete is damaged, and the plastic deformation becomes more and more serious, W n gradually increases, E n gradually increases, D n gradually increases, σ 0 gradually decreases, ε 0 gradually increases, ε u gradually increases, E c gradually decreases, and μ gradually decreases. Under the same number of freeze–thaw cycles, the frost resistance of the three groups of concrete is A > C > B. Microwave heating modification improved the frost resistance of group C concrete compared to that of group B concrete. Due to the incorporation of PPF into the concrete, the load did not drop sharply when the load acting on the concrete reached the failure load. The prediction results of the established constitutive model are in good agreement with the experimental results.
1 Introduction
As an indispensable material for building concrete, sand, and gravel, its reserves and quality affect urban construction and social and economic development. The over-mining of sand and gravel has caused the depletion of aggregates and caused serious damage to the natural environment [1,2]. With the development concept of global carbon emission reduction increasingly accepted by people, the use of construction waste for production and construction will become the trend of low-carbon development of building materials in the future [3,4,5].
For concrete buildings in cold areas, antifreeze performance is very important, which determines the safe use and long-term work performance of concrete buildings. Recycled coarse aggregate (RCA) obtained from waste concrete after crushing, screening, and grading can be used to mix recycled concrete. Due to the existence of new mortar–NCA, old mortar–NCA and old mortar–new mortar interfaces, recycled concrete suffers more serious damage when faced with freeze–thaw damage. In order to improve the performance of recycled concrete, many scholars have conducted a lot of research [6,7,8]. Polypropylene fiber (PPF) has a low price, lightweight, good ductility and durability, and stable chemical and physical properties [9,10]. PPF has been applied in many professional fields [11,12,13]. Adding appropriate PPF to concrete can improve its mechanical and durability properties [14,15].
Compared with NCA, the RCA interfacial transition zone has a large amount of old mortar attached, which negatively affects the performance of recycled concrete. Stripping old mortar from the interfacial transition zone of RCA becomes a key consideration for the recovery of high-quality recycled aggregate [5,6,16]. Although the old mortar on the surface of RCA and the NCA inside of RCA are dielectric materials, their electromagnetic characteristics are quite different. Using a microwave heating modification process to heat RCA can achieve rapid and instantaneous selective heating of multiphase materials, to promote the stripping of old mortar from the interfacial transition zone of aggregate. Unlike traditional heating methods, microwave heating offers a unique heating method. Microwave technology has been extensively studied in the fields of electronics and machinery [17,18,19,20], but research into improving the quality of RCA is still in the exploratory stage.
In order to obtain concrete with both high performance and high durability, Okamura first proposed the concept of self-compacting concrete in 1986 [21]. Self-compacting concrete has the advantages of low water-binder ratio, high sand ratio, high fluidity, high performance, and no vibration. Self-compacting concrete is a high-performance concrete that can improve the performance of concrete, reduce the construction time, and reduce the overall cost of the project. Even if the formwork contains dense reinforcement or has complex shapes, self-compacted concrete can quickly fill every corner of the formwork. Therefore, self-compacting concrete is widely used in precast concrete members, drilling shafts, and noise-limiting places [22]. Self-compacting recycled concrete uses all or part of the recycled aggregate to replace natural sand and gravel, which can achieve the recycling and reuse of waste concrete. Self-compacting recycled concrete not only meets many advantages of self-compacting concrete but also has the characteristics of green environmental protection and saving natural resources, which can bring higher social and economic benefits to the construction industry.
In this study, the author replaced NCA with RCA obtained from the multi-process treatment of waste concrete pavement in Ningxia and carried out the mix design according to self-compacting concrete. In order to enhance the performance of concrete, the microwave heating modification process was introduced and 0.10% volume fraction PPF was added to the concrete, and the recycled concrete was configured with a 50%RCA replacement rate and other mass instead of NCA. The effects of the microwave modification process and the freeze–thaw cycle on the freeze–thaw resistance of polypropylene fiber reinforced self-compacting recycled concrete have been studied by the rapid freeze–thaw process.
2 Test design
2.1 Test raw materials
The cement is Ningxia Saima brand 42.5 R ordinary Portland cement. The fly ash is class I ash produced by Ningxia Jintai Company. NCA is the crushed stone produced by Yinchuan Lanshan Sand and Gravel Factory. RCA is the crushed stone obtained from C30 strength abandoned pavement slab concrete after multiple processes such as crushing, screening, and grading. Part of the RCA will be modified by microwave heating. Section 2.2 shows the specific implementation steps of microwave heating to modify RCA. The performance indexes of coarse aggregate are shown in Table 1. The sand is washed medium sand produced by Yinchuan Lanshan Sand and Stone Factory. The test water was urban tap water. PPF is a product of Shanghai Yingjia Co., Ltd. The water-reducing agent is a standard HWR-S polycarboxylate superplasticizer (powder) produced by Beijing Muhu Company, with a water-reducing rate of about 20%. The appearance of coarse aggregate and PPF is shown in Figure 1. The particle size distribution of coarse aggregate, sand, cement and fly ash is shown in Figure 2.
Coarse aggregate performance indicators
| Type | Particle size range (mm) | Apparent density (kg·m−3) | Bulk density (kg·m−3) | Void ratio (%) | Moisture content (%) | Water absorption (%) | Crush index (%) |
|---|---|---|---|---|---|---|---|
| NCA | 5–20 | 2,708 | 1,496 | 44.76 | 0.37 | 0.74 | 8.8 |
| RCA | 5–20 | 2,613 | 1,310 | 49.87 | 1.7 | 4.15 | 12.0 |
| RCA-20 | 5–20 | 2,655 | 1,360 | 48.66 | 1.05 | 4.07 | 10.1 |
Note: RCA-20 – Perform 20 times the microwave heating modification treatment on RCA.

Appearance of coarse aggregate and PPF: (a) NCA, (b) RCA, (c) RCA-20, and (d) PPF.

Particle size distribution of coarse aggregate, sand, cement, and fly ash.
2.2 RCA modified by microwave heating
Although the old mortar on the surface of the RCA and the NCA inside are both dielectric materials, the electromagnetic properties of the two are quite different. When RCA is heated by microwave instantaneously, the temperature of the surface old mortar will rise rapidly, while the temperature of the internal NCA will rise slowly, resulting in a rapid temperature gradient stress between the old mortar and NCA. When the old mortar is in a high-temperature state, the C–S–H and C–A–H gels in the old mortar will be dehydrated quickly, and Ca(OH)2 will likewise be decomposed into less stable CaO. At this time, the strength of the old mortar is weak and it is easy to break and peel from the surface of the NCA when subjected to an external force. In addition, the water vapor formed by the water in the aggregate during heating will exert a certain pore pressure on the RCA. These internal stresses will weaken the bond strength of the old mortar–NCA interface and eventually lead to the peeling of the old mortar. After heating, the RCA was placed in water and shaken to cool. At this time, due to the rapid cooling of the old mortar and the slow cooling of NCA, secondary temperature gradient stress will be generated between the old mortar and NCA, thus accelerating the peeling of the old mortar.
The microwave heating modification instrument is a household mechanical microwave oven. The specific implementation process is as follows:
The RCA was placed in a plastic box and heated in a microwave oven for 5 min, and the power was set to 800 W.
Use a dense mesh sieve to soak the RCA in water and shake it for 1 min.
Repeat the operation Steps (1) and (2) 20 times, take out the RCA and let it dry until the surface is dry, and then use it for mixing concrete as soon as possible.
2.3 Experimental design
According to previous studies, adding an air entraining agent to concrete can improve frost resistance, but it will reduce its strength [23]. Adding 0.10% PPF to concrete can increase the strength and frost resistance of concrete at the same time [14,15]. According to the self-compacting concrete design mix ratio [24], the water binder ratio of concrete is 0.41, the substitution rate of fly ash is 25%, the sand rate is 49%, the content of PPF is 0.10%, the content of water reducing agent is 0.10%, the filling performance grade is SF3, and the strength grade is C30. The size of the concrete specimen is 100 mm × 100 mm × 300 mm. The concrete mix ratio design is shown in Table 2.
Mix ratio design
| No | RCA replacement rate (%) | Material consumption per unit volume (kg·m−3) | |||||||
|---|---|---|---|---|---|---|---|---|---|
| Water | Cement | Fly ash | NCA | RCA | Sand | PPF | Water reducer | ||
| A | 0 | 202 | 361 | 120 | 851 | 0 | 816 | 1.30 | 0.241 |
| B | 50 | 202 | 361 | 120 | 425.5 | 425.5 | 816 | 1.30 | 0.251 |
| C | 50 | 202 | 361 | 120 | 425.5 | 425.5 (20 times microwave) | 816 | 1.30 | 0.251 |
2.3.1 Freeze–thaw cycle test
The freeze–thaw instrument is the HDK-3 concrete rapid freeze–thaw test machine produced by the China Academy of Building Research. After curing the concrete for 24 days, the concrete is immersed in water with a temperature of 20 ± 2°C and a water surface 20–30 mm higher than the concrete for 4 days [25]. The concrete is taken out and wiped the surface, swiftly measured the initial mass, initial ultrasonic wave speed and initial dynamic elastic modulus of the concrete, and then put the concrete into the freeze–thaw machine for freeze–thaw cycle test. During the test, the concrete core temperature was −17 to 5°C, and the time of one freeze–thaw cycle was about 4 h [25]. The working diagram of the freezing and thawing test machine is shown in Figure 3. When the number of freeze–thaw cycles attained 0, 25, 50, 75, 100, and 125, the mass, ultrasonic wave velocity, and dynamic elastic modulus of the concrete were measured before the uniaxial compressive test of the concrete.

Working diagram of concrete rapid freeze–thaw testing machine: (a) internal arrangement of the freeze–thaw machine; (b) temperature control curve of the freeze–thaw machine.
2.3.2 Dynamic elastic modulus and mass measurement
The dynamic elastic modulus measuring instrument is the DT-20 dynamic elastic modulus measuring instrument produced by Jinan Langrui Company. The inductance and maximum range of the electronic scale used to measure the quality of concrete are 1 g and 30 kg. After the concrete quality measurement is completed, the concrete is placed on the foam plastic board with a thickness of more than 20 mm with the pouring side facing up. Before testing the dynamic elastic modulus, a layer of medical alum was evenly spread on the contact surface between the probe and the concrete as a coupling medium. The diagram of the dynamic elastic modulus test is illustrated in Figure 4.
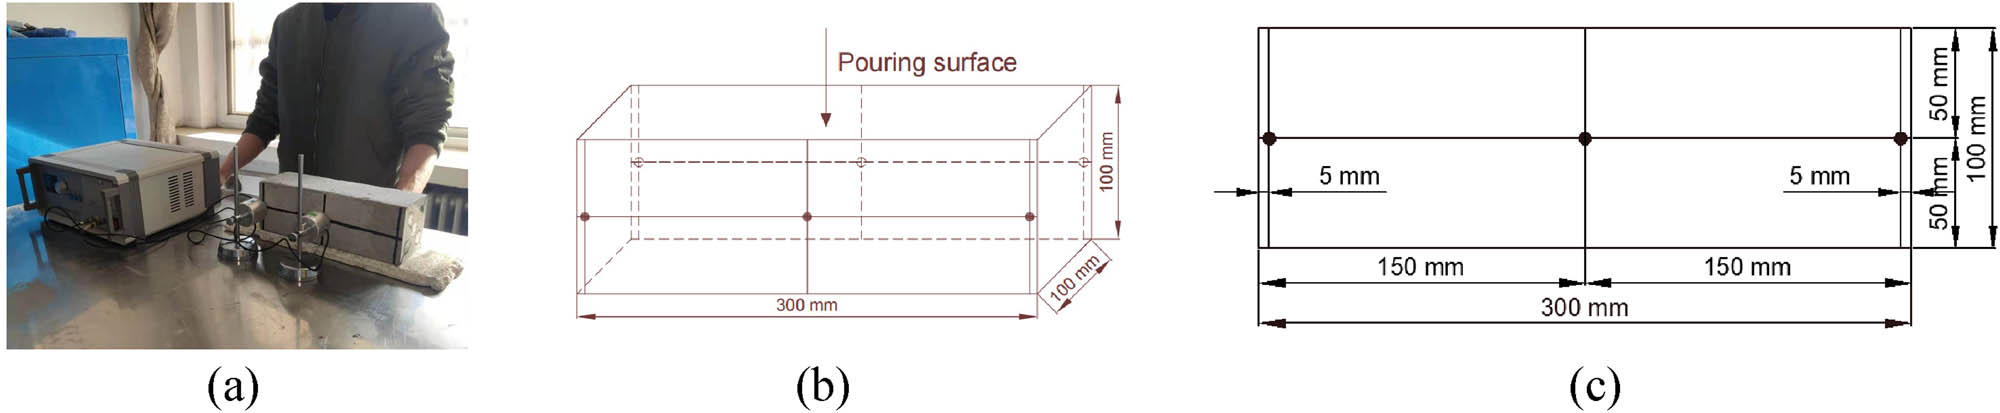
Dynamic elastic modulus test: (a) actual operation diagram, (b) layout of measuring points, and (c) front view of the survey point.
The formula for computing the mass loss rate is shown in formula (1) [25]:
Among them: W n is the mass loss rate; G 0 is the initial mass, in kg; G n is the mass of concrete after n freeze–thaw cycles, in kg.
The calculation formula of the damage value of dynamic elastic modulus is shown in formula (2) [25]:
Among them: E n is the damage value of the dynamic elastic modulus; E d0 is the initial dynamic elastic modulus, in MPa; E dn is the dynamic elastic modulus of concrete after n freeze–thaw cycles, in MPa.
2.3.3 Ultrasonic wave velocity measurement
The ultrasonic wave velocity measuring instrument is the DJUS-05 non-metal ultrasonic instrument produced by Beijing Dadi Company. Before measuring the ultrasonic wave speed, a layer of medical alum is evenly applied to the receiver and the measuring point as a coupling medium. The ultrasonic wave velocity measurement diagram is illustrated in Figure 5.
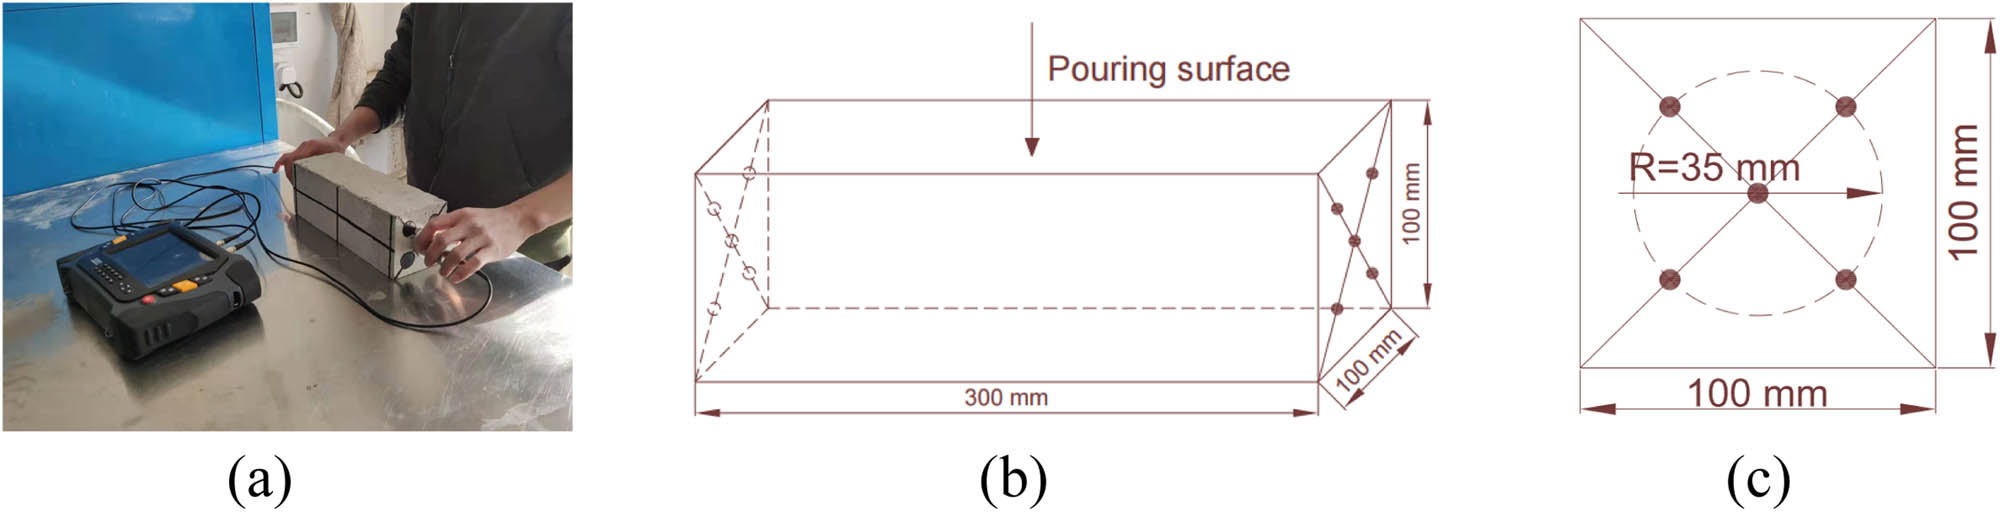
Ultrasonic wave velocity measurement: (a) actual operation diagram, (b) layout of measuring points, and (c) front view of the survey point.
The calculation formula of ultrasonic wave velocity damage value is shown in formula (3) [26]:
Among them, D n is the ultrasonic wave velocity damage value; D d0 is the initial ultrasonic wave velocity, in km·s−1; and D dn is the ultrasonic wave velocity of concrete after n freeze–thaw cycles, in km·s−1.
2.3.4 Axial compression test
The test loading instrument is the SHT4106 microcomputer-controlled electrohydraulic servo universal testing machine produced by Meters with a maximum load of 1,000 kN and accuracy of 0.001 N. The loading method of the testing machine is stress loading, the loading rate for measuring elastic modulus and Poisson’s ratio is 0.05 MPa·s−1, and the loading rate for measuring axial compressive strength and stress–strain data is 0.5 MPa·s−1. The data acquisition instrument is the JM3813 multifunctional static strain gauge produced by Yangzhou Jingming Company, with a resolution of 0.5 µε, a range of ± 15,000 µε, and a measurement accuracy of ± 0.2% FS ± 1 με. The data collection mode of the strain gauge is timed collection, and the time interval of the timed collection is 1 s. The displacement sensor is a 5G101 displacement sensor produced by Jiangsu Donghua Company, with a sensitivity of 90 με·mm−1, a range of 60 mm, and an accuracy of 0.3% FS. The strain gauge is a BX series product produced by Zhejiang Huangyan Testing Instrument Factory, with a resistance of 120 Ω and a sensitivity coefficient of 2.08%. The length of the axial strain gauge is 100 mm, and the length of the transverse strain gauge is 50 mm, which are placed in a “+” shape. The diagram of the axial compression test is shown in Figure 6. When the concrete surface is severely harmed, epoxy resin is applied to the concrete surface where the strain gauges are attached to make the concrete surface flat.

Diagram of an axial compression test: (a) actual loading diagram, (b) instrument layout diagram, and (c) loading diagram.
3 Test results and analysis
3.1 Apparent characteristics
By observing the apparent characteristics of concrete, its frost resistance can be directly reflected. Figure 7 shows the apparent characteristics of concrete before and after freezing and thawing. Figure 7 shows that when the concrete is not frozen and thawed, the surfaces of the three concrete groups are smooth and flat without damage and without exposed aggregates. After 50 freeze–thaw cycles, a small part of the mortar was eroded on the concrete surface, forming a small number of micro-holes and micro-cracks, but the integrity was comparatively intact. After 125 freeze–thaw cycles, a large area of dense holes appeared on the concrete surface. At this time, part of the mortar on the concrete surface appears to peel off, exposing the coarse aggregate. Under the same freeze–thaw cycle times, the surface erosion deterioration degree of group B concrete mixed with RCA is the most serious, and the surface erosion deterioration degree of group C concrete modified by microwave is between group A concrete and group C concrete.
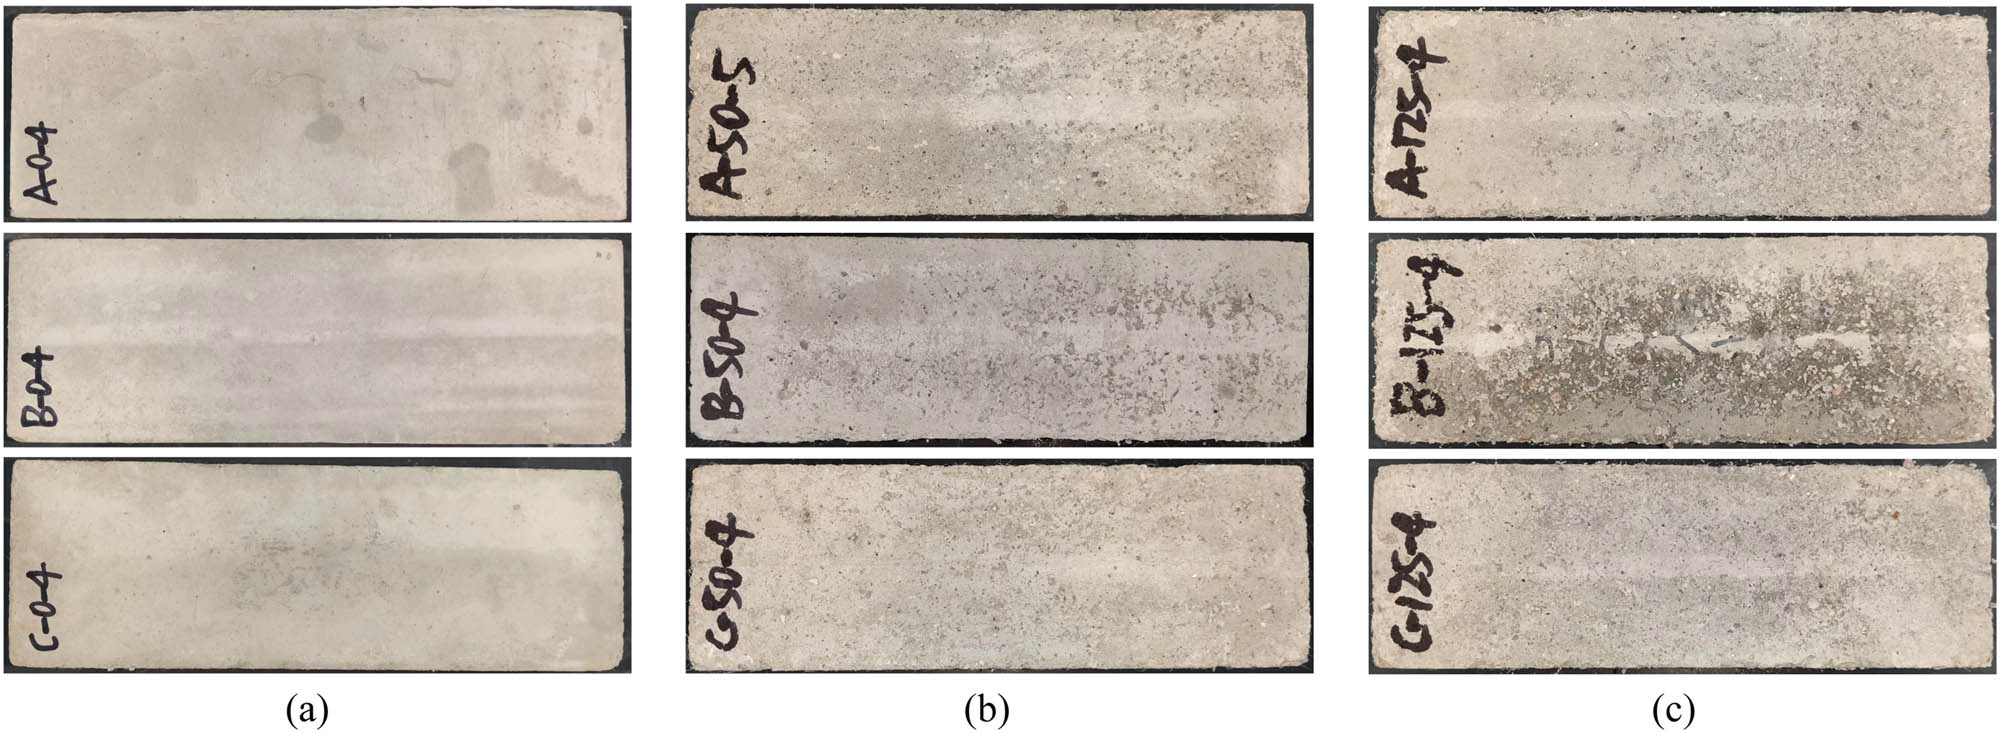
Appearance characteristics of concrete before and after freezing and thawing: (a) 0 time, (b) 50 time, and (c) 125 time.
3.2 Quality loss
Figure 8 is a graph showing the relationship between W n and the number of freeze–thaw cycles. It can be seen from Figure 8 that with the increase in the number of freeze–thaw cycles, the W n of the concrete in group A continued to increase, and the W n of the concrete in groups B and C showed a trend of initial negative growth and then continuous positive growth before and after 50 freeze–thaw cycles. Compared with NCA, RCA has a higher water absorption capacity. After the concrete has undergone 50 freeze–thaw cycles, the mortar and aggregate on the concrete surface are less peeled, and the concrete absorbs a lot of water to increase its weight [27]. After the number of freeze–thaw cycles exceeds 50, the mortar and aggregates on the concrete surface begin to peel off a lot, and the quality of the peeling is greater than the quality of water absorption so that the W n of the concrete progressively increases. Within 125 freeze–thaw cycles, the W n of the three concrete groups was small, less than 0.75%, which was related to the hydrophobicity of PPF. Incorporating PPF into concrete can hinder the penetration of water inside the matrix, decrease the osmotic pressure, evenly alleviate the internal stress caused by the temperature change of the concrete during the freezing and thawing process, and limit the expansion and contraction of the concrete, thereby enhancing the frost resistance of the concrete. After 125 freeze–thaw cycles, the order of W n of the three groups of concrete is B > C > A. The quality of the RCA used in group C concrete is improved after microwave heating modification treatment, which improves the frost resistance of group C concrete.

Relationship between W n and freeze–thaw cycles.
3.3 Loss of dynamic elastic modulus
Figure 9 is a graph showing the relationship between E n and the number of freeze–thaw cycles. It can be seen from Figure 9 that E n slowly increases at 0–50 freeze–thaw cycles and accelerates at 50–125 freeze–thaw cycles. When the concrete is in a negative temperature state, its internal tensile strength is not sufficient to withstand the expansion pressure caused by the freezing of water, which causes the concrete to be damaged. The degree of concrete damage will continue to accumulate with the increase in the number of freeze–thaw cycles, so that E n slowly increases and the growth rate gradually accelerates. It can be seen from Figure 9 that the E n of the three groups of concrete increases slowly with the increase in the number of freeze–thaw cycles, among which group B has the fastest growth rate, group C is the second, and group A is slower. It shows that RCA decreases the frost resistance of concrete. Compared with native aggregate concrete, recycled concrete has not only the new mortar–stone interface but also the old mortar–stone and old mortar–new mortar interfaces with poor adhesion. The existence of a badly cohesive interface makes the recycled concrete poor in frost resistance when faced with freeze–thaw damage, which is shown in Figure 9 as a rapid increase in E n of group B concrete. The microwave heating modification therapy can play a certain peeling effect on the mortar on the surface of the RCA, thereby decreasing the interface area of the old mortar–stone and the old mortar–new mortar, thereby enhancing the quality of the aggregate and improving the frost resistance of concrete. After 125 freeze–thaw cycles, the E n of the three groups of concrete were all less than 0.40, implying that the concrete was not damaged, which was related to the incorporation of PPF into the concrete. The three-dimensional network structure formed by PPF in the concrete matrix can bear part of the tensile stress generated by the freeze–thaw cycle, which can limit the expansion and contraction of the concrete and decrease the freeze–thaw damage to the concrete. The relationship between the E n of concrete and the number of freeze–thaw cycles follows a logarithmic function, as shown in equations (4)–(6):
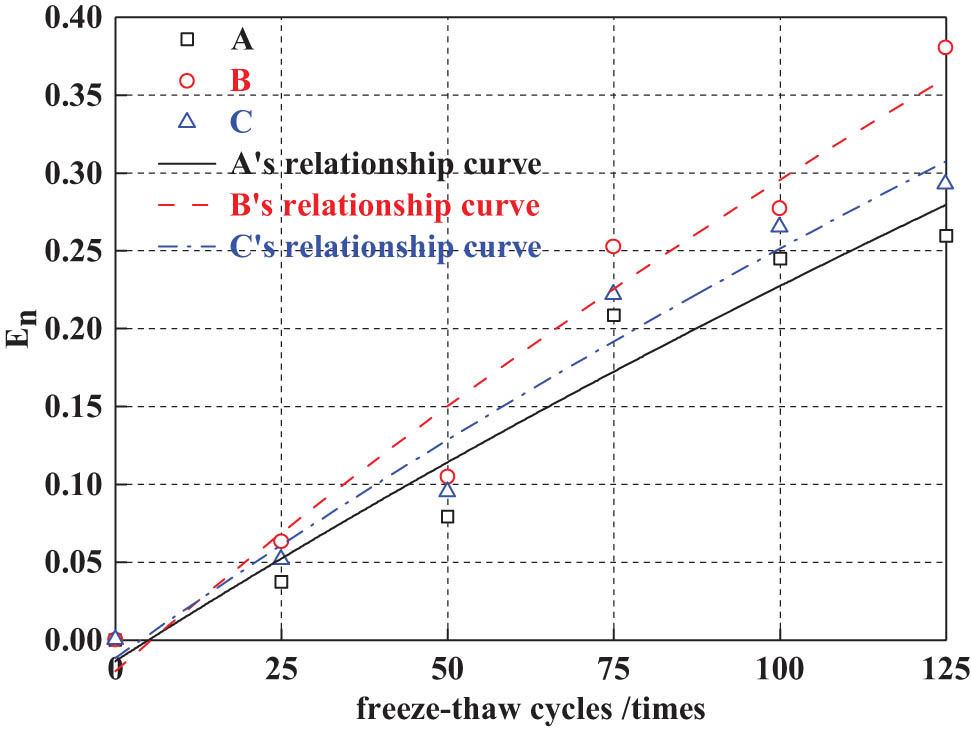
Relationship between E n and freeze–thaw cycles.
3.4 Ultrasonic wave velocity loss
Ultrasonic nondestructive testing is a nondestructive testing method that indirectly evaluates the internal density of concrete by measuring the ultrasonic wave speed. The denser the concrete is, the higher the wave speed. The relationship between the measured D n and the number of freeze–thaw cycles is shown in Figure 10. It can be seen from Figure 10 that as the number of freeze–thaw cycles increases, D n increases accordingly. From 0 to 50 freeze–thaw cycles, the D n of concrete slowly increased. In 50–125 freeze–thaw cycles, the D n growth rate accelerated. After 125 freeze–thaw cycles, the D n of the three groups of concrete were all less than 0.33. The relationship between the D n of concrete and the number of freeze–thaw cycles follows an exponential function, as shown in equations (7)–(9):
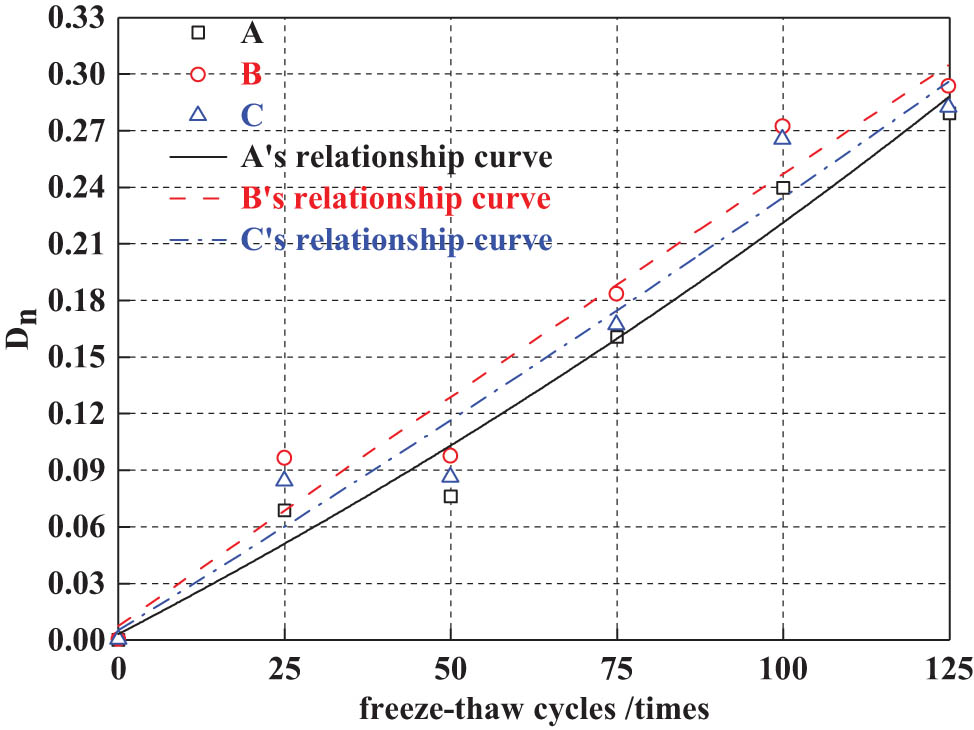
Relationship between D n and freeze–thaw cycles.
4 Uniaxial compression test results
4.1 Uniaxial compressive failure mode
Figure 11 shows the failure patterns of the three concrete groups before and after freezing and thawing. It can be seen from Figure 11 that with the increase in the number of freeze–thaw cycles, the number of surface cracks progressively increases after the concrete is damaged, and the plastic deformation tends to be severe. Under the same number of freeze–thaw cycles, the plastic deformation of concrete in group B is the most severe, followed by group C and the smallest in group A. It can be shown from the observation and test that in the initial stage of loading, there is no obvious crack on the concrete surface, and the shape of the load–time curve rises in a straight line. As the load continued to rise, short sloping cracks started to appear at the bottom of the concrete, the slope of the load–time curve began to decrease, and the shape of the curve deviates from a straight line. With the further increase in the load, when the load exceeds the failure load, the small sloping cracks steadily extend from both ends to the middle in a short time, and gradually form through oblique cracks, thereby destroying the concrete. During the loading process of concrete, when the load reaches the failure load point, the load does not decrease sharply due to the bridging cracks and stress transfer of PPF. The uniaxial compressive failure patterns of the three concrete groups are comparable, which is a longitudinal splitting failure, and the concrete retains good integrity after failure.

Concrete failure form before and after freezing and thawing: (a) 0 time, (b) 50 time, and (c) 125 time.
4.2 Uniaxial compressive performance index and analysis
The peak stress (σ 0), peak strain (ε 0), ultimate strain (ε u), elastic modulus (E c), and Poisson’s ratio (μ) of the three groups of concrete are listed in Table 3.
Uniaxial compressive performance index
| No | Index | Freeze–thaw cycles (times) | |||||
|---|---|---|---|---|---|---|---|
| 0 | 25 | 50 | 75 | 100 | 125 | ||
| A | σ 0 (MPa) | 31.4 | 30.1 | 28.9 | 27.1 | 22.8 | 20.2 |
| ε 0 (×10−3) | 2.15 | 2.27 | 2.48 | 2.7 | 3.2 | 3.78 | |
| ε u (×10−3) | 4.94 | 4.99 | 4.71 | 5.32 | 6.72 | 7.54 | |
| E c (GPa) | 21.66 | 17.71 | 15.41 | 12.18 | 7.61 | 5.28 | |
| μ | 0.208 | 0.181 | 0.167 | 0.154 | 0.144 | 0.136 | |
| B | σ 0 (MPa) | 27.7 | 25 | 24.5 | 23.5 | 20.2 | 18.4 |
| ε 0 (×10−3) | 2.22 | 2.4 | 2.58 | 2.79 | 3.36 | 3.96 | |
| ε u (×10−3) | 4.01 | 4.34 | 4.56 | 4.46 | 5.37 | 6.43 | |
| E c (GPa) | 18.78 | 13.89 | 11.17 | 9.04 | 7.09 | 4.78 | |
| μ | 0.203 | 0.177 | 0.154 | 0.146 | 0.141 | 0.131 | |
| C | σ 0 (MPa) | 29.8 | 26.9 | 26.1 | 22.8 | 21.1 | 19 |
| ε 0 (×10−3) | 2.19 | 2.34 | 2.52 | 2.71 | 3.32 | 3.91 | |
| ε u (×10−3) | 3.94 | 4.21 | 4.53 | 4.77 | 5.77 | 6.64 | |
| E c (GPa) | 19.54 | 13.62 | 13.56 | 9.41 | 6.75 | 4.87 | |
| μ | 0.204 | 0.181 | 0.159 | 0.148 | 0.137 | 0.129 | |
Figure 12 shows the stress–strain curves of three groups of concrete before and after freezing and thawing. It can be seen from Figure 12 that the stress–strain curves of the three concrete groups have similar development laws. In the early loading stage, the rising section of the curve presents a concave shape. When the stress is between 30% and 80% of σ 0, the shape of the curve rises approximately linearly. As the stress increases, the slope of the curve gradually becomes smaller. Then, the slope of the curve begins to drop sharply, and when the stress reaches 20–30% of σ 0, the curve turns almost horizontal.

Stress–strain curves before and after freezing and thawing: (a) A; (b) B; and (c) C.
Freeze–thaw erosion is a gradual process. During the freeze–thaw cycle of concrete, the failure stress generated by the volume expansion and contraction of free water in the capillary pores of the concrete makes the concrete structure loose and numerous micro-cracks appear. With the increase in the number of freeze–thaw cycles, the original micro-cracks will continue to generate and evolve, and the damage will continue to accumulate, which will steadily undermine the performance of concrete. In the stress–strain curve, the concrete performance is weakened as the tangent modulus of the initial point decreases gradually, the slope of the ascending part of the curve decreases and the concave part becomes obvious gradually, the curve deviates from the vertical axis, σ 0 decreases and ε 0 increases, the area surrounded by the curve and the horizontal axis decreases, and the descending part of the curve flattens gradually.
Figure 13 shows the comparison of the stress–strain curves of the three concrete groups before and after freezing and thawing. As can be seen from Figure 13, under the same number of freezing–thawing cycles, the size of σ 0 of the three groups of concrete is in the order of A > C > B; the order of ε 0 is B > C > A; the order of the area enclosed by the stress–strain curve, and the horizontal axis is A > C > B.

Comparison of stress–strain curves before and after freezing and thawing: (a) 0 time, (b) 50 time, and (c) 125 time.
4.2.1 Peak stress
As shown in Table 3, as the number of freeze–thaw cycles increases, the σ 0 of the three groups of concretes steadily decreases. After 25, 50, 75, 100, and 125 freeze–thaw cycles, the σ 0 of group A concrete decreased by 4.14, 7.96, 13.69, 27.39, and 35.67%, respectively, compared to before freezing. The σ 0 of group B concrete decreased by 9.75, 11.55, 15.16, 27.08, and 33.57%, respectively. The σ 0 of group C concrete decreased by 9.73, 12.42, 23.49, 29.2, and 36.24%, respectively. Under the same number of freeze–thaw cycles, the numerical order of the three groups of concrete σ 0 is A > C > B. The existence of new mortar–NCA, old mortar–NCA, and old mortar–new mortar interfaces in reused concrete makes the internal occlusal force and bonding strength of recycled concrete poor, which affects the basic performance of concrete. It can be seen from Table 3 that removing the old mortar on the surface of the RCA through microwave heating can increase the σ 0 of recycled concrete.
Figure 14 shows the relative peak stress (

Among them:
4.2.2 Peak strain
As shown in Table 3, the ε 0 of the three concrete groups increases with the increase in the number of freeze–thaw cycles. After 25, 50, 75, 100, and 125 freezing cycles, the ε 0 of group A concrete increases by 5.58, 15.35, 25.58, 48.84, and 75.81%, respectively, compared to before freezing. The ε 0 of group B concrete increased by 8.11, 16.22, 25.68, 51.35, and 78.38%, respectively. The ε 0 of group C concrete increased by 6.85, 15.07, 23.74, 51.6, and 78.54%, respectively. Under the same number of freeze–thaw cycles, the numerical order of the three groups of concrete ε 0 is roughly as follows: B > C > A. RCA has a low elastic modulus and poor adhesion with new mortar. Its surface mortar is porous, and there are also micro cracks and holes inside. The concrete mixed with RCA deforms greatly when subjected to external force, so the ε 0 of group B concrete is larger than that of group A concrete. Microwave heating modification reduced the amount of old mortar on the surface of RCA and increased the point-to-point bonding ratio of the bonding surface between new mortar and aggregate, resulting in an increase in bite force and bonding strength, and increased the compactness of recycled concrete, resulting in a decrease in ε 0 of group C concrete compared with that of group B concrete.
Figure 15 shows the relative peak strain (
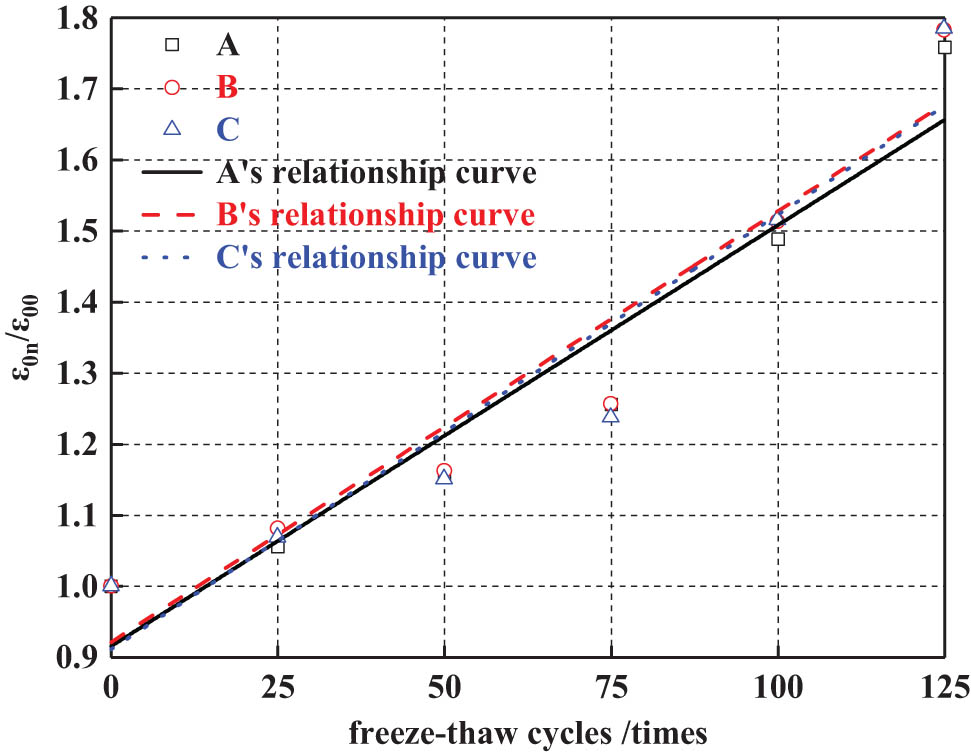
Among them,
4.2.3 Ultimate strain
According to the provisions of figure C.2.3 and annex C.2.4 of the “Code for Design of Concrete Structures,” ε u takes the longitudinal strain corresponding to the stress of the descending section of the stress–strain curve at 0.5σ 0 [28]. Figure 16 is a graph showing the relationship between ε u and the number of freeze–thaw cycles. It can be seen from Figure 16 that the ε u of the three concrete groups increases with the number of freeze–thaw cycles. Compared with that before freeze–thaw, after 25, 50, 75, 100, and 125 freeze–thaw cycles, the ε u of group A concrete increased by 1.01, −4.66, 7.69, 36.03, and 52.63%, respectively. The ε u of group B concrete increased by 8.23, 13.72, 11.22, 33.92, and 60.35%, respectively. The ε u of group C concrete increased by 6.85, 14.97, 21.07, 46.45, and 68.53%, respectively. Under the same number of freeze–thaw cycles, the ε u size of the three groups of concrete is roughly as follows: B > C > A. The weak interface inside reused concrete makes recycled concrete brittle and less ductile. It can be seen from Figure 16 that the microwave heating modification has a certain influence on the recycled concrete ε u.

Relationship between ε u and freeze–thaw cycles.
4.2.4 Elastic modulus
E c is one of the important assessment indicators reflecting the internal force of concrete structures and the ability to resist deformation and cracking. Figure 17 is a graph showing the relationship between E c and the number of freeze–thaw cycles. It can be seen from Figure 17 that the E c of the three groups of concretes decreases with the increase in the number of freeze–thaw cycles. Compared with before freeze–thaw, after 25, 50, 75, 100, and 125 freeze–thaw cycles, the E c of concrete in group A decreased by 18.24, 28.86, 43.77, 64.87, and 75.62%, respectively. The E c of group B concrete decreased by 26.3, 40.52, 51.86, 62.25, and 74.55%, respectively. The E c of group C concrete decreased by 30.3, 30.6, 51.84, 65.46, and 75.08%, respectively. Under the same number of freeze–thaw cycles, the order of E c values of the three groups of concrete is roughly as follows: A > C > B.

Relationship between E c and freeze–thaw cycles.
4.2.5 Poisson’s ratio
μ is the same as E c, and its size can reflect the internal force of the concrete structure and the resistance to deformation and crack. Figure 18 is a graph showing the relationship between μ and the number of freeze–thaw cycles. It can be seen from Figure 18 that the μ of the three concrete groups decreases with the increase in the number of freeze–thaw cycles. When not frozen and thawed, the μ of the three concrete groups is between 0.187 and 0.208. Compared with before freeze–thaw, after 25, 50, 75, 100, and 125 freeze–thaw cycles, the μ of concrete in group A decreased by 12.98, 19.71, 25.96, 30.77, and 34.62%, respectively. The μ of group B concrete decreased by 12.81, 24.14, 28.08, 30.54, and 35.47%, respectively. The μ of group C concrete decreased by 11.27, 22.06, 27.45, 32.84, and 36.76%, respectively. After 125 freeze–thaw cycles, the μ of the concrete was about 65% of that of the unfrozen concrete. Under the same number of freeze–thaw cycles, there is little difference in μ of the three groups of concrete, and the size of μ is roughly as follows: A > C > B.

Relationship between μ and freeze–thaw cycles.
4.3 Constitutive model
The concrete constitutive model is of great significance for the theoretical analysis and structural design of concrete structures. At present, many scholars at home and abroad have proposed constitutive models for the uniaxial compressive stress relationship of concrete, such as Guo [29], Bairagi et al. [30], and Topcu and Guncan [31]. A reasonable model should not only have good agreement with the test results, but also have simple form, convenient calculation, and few undetermined parameters. The concrete axial pressure segmental constitutive model proposed by Guo meets these requirements. By observing Figures 12 and 13, it can be shown that the stress–strain curve of reused concrete after freeze–thaw is similar to that of ordinary concrete in overall shape. In view of this, this article adopts the constitutive model proposed by Guo to analyze the test results for simplicity. Guo proposed the constitutive model as shown in formula (16) [29]:
Among them y is the relative stress, y = σ/σ 0. x is the relative strain, x =ε/ε 0. a and b are undetermined parameters for the ascending segment and descending segment, respectively. The value a is numerically the ratio of the initial tangent modulus to the secant modulus at the peak point, and the b value reflects the area enclosed by the curve of the descending segment and the horizontal axis. The smaller the a value or the larger the B value, the smoother the curve, the smaller the area surrounded by the curve and the horizontal axis, the smaller the elastic deformation of concrete, the lower the residual strength, and the slower the failure process [32].
After fitting analysis, the fitting graph of the stress–strain curve before and after freezing and thawing is obtained as shown in Figure 19, and the undetermined parameters a and b of the stress–strain curve before and after freezing and thawing are shown in Table 4. It can be seen from Figure 19 that the fitting of the ascending segment of the curve is better and the fitting degree of the descending segment is slightly worse. In Table 4, with the increase in the number of freeze–thaw cycles, the undetermined parameters of the fitting curves of the three groups of concrete generally show that the value of parameter a decreases gradually, while the value of parameter b increases gradually. Under the same number of freeze–thaw cycles, the value of a is A > C > B, and the value of b is B > C > A.

Stress–strain curve fitting before and after freezing and thawing: (a) 0 time, (b) 50 time, and (c) 125 time.
Undetermined parameters a and b of stress–strain curves before and after freezing and thawing
| Freeze–thaw cycles (times) | ||||||||
|---|---|---|---|---|---|---|---|---|
| NO | 0 | 25 | 50 | 75 | 100 | 125 | ||
| Parameter | a | A | 1.41 | 1.16 | 1.03 | 0.89 | 0.64 | 0.39 |
| B | 1.36 | 1.14 | 1.01 | 0.84 | 0.59 | 0.31 | ||
| C | 1.37 | 1.13 | 0.96 | 0.87 | 0.63 | 0.34 | ||
| b | A | 1.57 | 1.63 | 1.83 | 2.15 | 2.05 | 2.11 | |
| B | 2.56 | 2.87 | 3.2 | 3.56 | 3.62 | 3.72 | ||
| C | 2.41 | 2.74 | 2.86 | 3.3 | 3.43 | 3.6 | ||
| Parameter correlation coefficient R 2 | a | A | 0.9908 | 0.9901 | 0.9792 | 0.9689 | 0.999 | 0.9846 |
| B | 0.9931 | 0.9907 | 0.9826 | 0.9906 | 0.9746 | 0.9809 | ||
| C | 0.9903 | 0.9949 | 0.9964 | 0.997 | 0.9932 | 0.9973 | ||
| b | A | 0.9951 | 0.981 | 0.9881 | 0.9878 | 0.9746 | 0.9771 | |
| B | 0.9912 | 0.9983 | 0.9949 | 0.9918 | 0.9887 | 0.9944 | ||
| C | 0.9964 | 0.9971 | 0.9941 | 0.9871 | 0.9869 | 0.9881 | ||
4.4 Relationship between peak stress and dynamic elastic modulus
Figure 20 shows the fitting relationship curves of σ 0 and E dn of the three concrete groups under different freeze–thaw cycles. With the increase of E dn , σ 0 of the three concrete groups increases gradually, and the relationship between σ 0 and E dn is a linear function. The fitting formulas are shown in equations (17)–(19):

Relationship σ 0 with E dn .
4.5 Relationship between peak stress and ultrasonic wave velocity
Figure 21 shows the fitting relationship curves of σ 0 and D dn of the three concrete groups under different freeze–thaw cycles. With the increase of D dn , σ 0 of the three concrete groups gradually increases, and the relationship between σ 0 and D dn has a good linear correlation. The fitting formulas are shown in equations (20)–(22):

Relationship σ 0 with D dn .
5 Conclusions
As the number of freeze–thaw cycles increases, the deterioration of the three groups of concrete surfaces becomes more and more serious. After the concrete is damaged, the number of surface cracks gradually increases, the plastic deformation becomes more and more serious, W n gradually increases, E n gradually increases, D n gradually increases, σ 0 gradually decreases, ε 0 gradually increases, ε u gradually increases, E c gradually decreases, and μ gradually decreases.
Under the same number of freeze–thaw cycles, the frost resistance of the three groups of concrete is A > C > B. The old mortar on the surface of RCA was removed by microwave heating, which increased the percentage of point-to-point bonding between new mortar and aggregate, and enhanced the compactness and frost resistance of group C concrete.
The presence of a 0.10% volume fraction of PPF in the concrete makes the W n of the three groups of concrete to be small. When the load acting on concrete is added to the failure load, the load does not drop sharply. Good integrity is retained when the concrete fails.
The prediction results of the established constitutive model are in good agreement with the experimental results.
-
Funding information: The authors thank the grant from the National Natural Science Foundation of China (Reference: 51968060) and the Graduate Innovation Project of Ningxia University (Reference: CXXM202239).
-
Author contributions: Chuanlei Zheng is responsible for preliminary research and thesis writing. Shuxiang Li is responsible for arranging the research progress of the project and providing technical guidance. Yufei Hou and Baohong Jin are responsible for the implementation of the project.
-
Conflict of interest: There is no conflict of interest.
References
[1] Harrison, D. and E. Steadman. “Alternative source of aggregates.”British Geological Survey Commissioned Report. CR/03/95N, British Geological Survey, Nottingham, UK, 2003.Search in Google Scholar
[2] Pilkey, O., R. Young, J. Kelley, and A. Griffith. Mining of Coastal Sand: A Critical Environmental and Economic Problem for morocco, White Paper, Western Carolina University, Cullowhee, NC, USA, 2007.Search in Google Scholar
[3] Maddodi, B., R. P. Bhandary, V. Sharma, J. S. Yadav, S. Mohapatra, A. U. Rao, et al. Experimental and statistical evaluation of mechanical properties of green cement concretes-taguchi integrated supervised learning approach. Engineered Science, Vol. 18, 2022, pp. 148–158.10.30919/es8e689Search in Google Scholar
[4] Singh, M. Conversions of waste tube-tyres (WTT) and waste polypropylene (WPP) into diesel fuel through catalytic pyrolysis using base SrCO3. Engineered Science, Vol. 13, No. 3, 2020, pp. 87–97.10.30919/es8d1158Search in Google Scholar
[5] Buttress, A., A. Jones, and S. Kingman. Microwave processing of cement and concrete materials-towards an industrial reality? Cement and Concrete Research, Vol. 68, 2015, pp. 112–123.10.1016/j.cemconres.2014.11.002Search in Google Scholar
[6] Al-bayati, H. K. A., P. K. Das, S. L. Tighe, and H. Baaj. Evaluation of various treatment methods for enhancing the physical and morphological properties of coarse recycled concrete aggregate. Construction and Building Materials, Vol. 112, 2016, pp. 284–298.10.1016/j.conbuildmat.2016.02.176Search in Google Scholar
[7] Zhang, H., W. Liu, X. Lin, S. Su, and B. Zhao. To ameliorate the performance of recycled aggregate concrete (RAC) by pre-treating aggregate in sulfoaluminate cement slurry and water glass solution. Journal of Building Engineering, Vol. 44, 2021, id. 103364.10.1016/j.jobe.2021.103364Search in Google Scholar
[8] Yu, F., X. Li, J. Song, Y. Fang, Y. Qin, and S. Bu. Experimental study on flexural capacity of PVA fiber-reinforced recycled concrete slabs. Archives of Civil and Mechanical Engineering, Vol. 21, No. 4, 2021, pp. 1–23.10.1007/s43452-021-00314-3Search in Google Scholar
[9] Yan, X., J. Liu, M. Khan, S. Sheriff, S. Vupputuri, R. Das, et al. Efficient solvent-free microwave irradiation synthesis of highly conductive polypropylene nanocomposites with lowly loaded carbon nanotubes. ES Materials & Manufacturing, Vol. 9, No. 15, 2020, pp. 21–33.10.30919/esmm5f716Search in Google Scholar
[10] Jing, X., Y. Li, J. Zhu, L. Chang, S. Maganti, N. Naik, et al. Improving thermal conductivity of polyethylene/polypropylene by styrene-ethylene-propylene-styrene wrapping hexagonal boron nitride at the phase interface. Advanced Composites and Hybrid. Materials, Vol. 5, 2022, pp. 1090–1099.10.1007/s42114-022-00438-xSearch in Google Scholar
[11] Zhang, H., Y. Cao, Q. Zhen, J. J. Hu, J. Q. Cui, and X. M. Qian. High strength, flexible, and conductive graphene/polypropylene fiber paper fabricated via papermaking process. Advanced Composites and Hybrid. Materials, Vol. 5, 2022, pp. 104–112.10.1007/s42114-021-00374-2Search in Google Scholar
[12] Tsai, P. Performance of masks and discussion of the inactivation of SARS-CoV-2. Engineered Science, Vol. 10, No. 5, 2020, pp. 1–7.10.30919/es8d1110Search in Google Scholar
[13] Su, Y., H. Yin, X. Wang, Y. Ma, S. Vupputuri, Z. Guo, et al. Preparation and properties of ethylene-acrylate salt ionomer/polypropylene antistatic alloy. Advanced Composites and Hybrid Materials, Vol. 4, No. 1, 2021, pp. 104–113.10.1007/s42114-021-00219-ySearch in Google Scholar
[14] Chen, Y., G. Cen, and Y. Cui. Comparative study on the effect of synthetic fiber on the preparation and durability of airport pavement concrete. Construction and Building Materials, Vol. 184, 2018, pp. 34–44.10.1016/j.conbuildmat.2018.06.223Search in Google Scholar
[15] Smarzewski, P. and D. Barnat-hunek. Effect of fiber hybridization on durability related properties of ultra-high performance concrete. International Journal of Concrete Structures and Materials, Vol. 11, No. 2, 2017, pp. 315–325.10.1007/s40069-017-0195-6Search in Google Scholar
[16] Chen, W., Z. Shao, and W. Wei. Experimental study of the heating potential of mortar-aggregate under microwave irradiation. Journal of Materials in Civil Engineering, Vol. 33, No. 7, 2021, id. 04021153.10.1061/(ASCE)MT.1943-5533.0003782Search in Google Scholar
[17] Wu, N., B. Zhao, X. Chen, C. Hou, M. Huang, A. Alhadhrami, et al. Dielectric properties and electromagnetic simulation of molybdenum disulfide and ferric oxide-modified Ti3C2TX MXene hetero-structure for potential microwave absorption. Advanced Composites and Hybrid Materials, Vol. 5, 2022, pp. 1548–1556.10.1007/s42114-022-00490-7Search in Google Scholar
[18] Pan, D., G. Yang, H. M. Abo-dief, J. Dong, F. Su, C. Liu, et al. Vertically aligned silicon carbide nanowires/boron nitride cellulose aerogel networks enhanced thermal conductivity and electromagnetic absorbing of epoxy composites. Nano-micro Letters, Vol. 14, No. 1, 2022, pp. 1–19.10.1007/s40820-022-00863-zSearch in Google Scholar
[19] Li, T., X. Cheng, P. Qian, and L. Zhang. One-step microwave hydrothermal preparation of Cd/Zr-bimetallic metal–organic frameworks for enhanced photochemical properties. Advanced Composites and Hybrid Materials, Vol. 4, No. 1, 2021, pp. 150–161.10.1007/s42114-020-00199-5Search in Google Scholar
[20] Zhang, Z., Y. Zhao, Z. Li, L. Zhang, Z. Liu, Z. Long, et al. Synthesis of carbon/SiO2 core-sheath nanofibers with Co-Fe nanoparticles embedded in via electrospinning for high-performance microwave absorption. Advanced Composites and Hybrid Materials, Vol. 5, No. 1, 2022, pp. 513–524.10.1007/s42114-021-00350-wSearch in Google Scholar
[21] Okamura, H. and M. Ouchi. Self-compacting concrete. Journal of Advanced Concrete Technology, Vol. 1, No. 1, 2003, pp. 5–15.10.3151/jact.1.5Search in Google Scholar
[22] Hu, B., N. Wang, X. Bi, E. S. Karaaslan, A. L. Weber, W. Zhu, et al. Three-dimensional modeling of the distribution and orientation of steel fibers during the flow of self-compacting concrete. Structural Concrete, Vol. 20, No. 5, 2019, pp. 1722–1733.10.1002/suco.201900072Search in Google Scholar
[23] Huang, W., D. Yang, and J. Zhou. Influence of admixtures and air-entraining agents on concrete properties. Concrete, Vol. 09, 2010, pp. 80–82.Search in Google Scholar
[24] China Standards: JGJ/T 283-2012. Technical specification for application of self-compacting concrete, 2012, p. 3.Search in Google Scholar
[25] China Standards: GB/T 50082-2009. Standard for test methods of long-term performance and durability of ordinary concrete, 2009, p. 11.Search in Google Scholar
[26] Liu, H., Y. Ma, J. Ma, W. Yang, and J. Che. Frost resistance of desert sand concrete. Advances in Civil Engineering, Vol. 2021, 2021, pp. 1–17.10.1155/2021/6620058Search in Google Scholar
[27] Luan, H., J. Wu, and J. Pan. Freeze-thaw durability of recycled aggregate concrete: an overview. Journal of Wuhan University of Technology-Materials Science Editorial., Vol. 36, No. 1, 2021, pp. 58–69.10.1007/s11595-021-2378-xSearch in Google Scholar
[28] China Standards: GB 50010-2010. Code for design of concrete structures, 2013, p. 1.Search in Google Scholar
[29] Guo, Z. Strength and deformation of concrete: experimental basis and constitutive relationship, Tsinghua University Press, Beijing, 1997, pp. 35–38.Search in Google Scholar
[30] Bairagi, N., K. Ravande, and V. Pareek. Behavior of concrete with different proportions of natural and recycled aggregates. Conservation and Recycling, Vol. 9, No. 3, 1993, pp. 109–126.10.1016/0921-3449(93)90036-FSearch in Google Scholar
[31] Topcu, I. and N. Guncan. Using waste concrete as aggregate. Cement and Concrete Research, Vol. 25, No. 7, 1995, pp. 1385–1390.10.1016/0008-8846(95)00131-USearch in Google Scholar
[32] Chen, Z., C. Zhou, and Y. Chen. Mechanical property and strain-stress constitutive relationship of recycled pebble aggregate concrete. Journal of Basic Science and Engineering, Vol. 22, No. 4, 2014, pp. 763–774.Search in Google Scholar
© 2022 Chuanlei Zheng et al., published by De Gruyter
This work is licensed under the Creative Commons Attribution 4.0 International License.
Articles in the same Issue
- Review Articles
- State of the art, challenges, and emerging trends: Geopolymer composite reinforced by dispersed steel fibers
- A review on the properties of concrete reinforced with recycled steel fiber from waste tires
- Copper ternary oxides as photocathodes for solar-driven CO2 reduction
- Properties of fresh and hardened self-compacting concrete incorporating rice husk ash: A review
- Basic mechanical and fatigue properties of rubber materials and components for railway vehicles: A literature survey
- Research progress on durability of marine concrete under the combined action of Cl− erosion, carbonation, and dry–wet cycles
- Delivery systems in nanocosmeceuticals
- Study on the preparation process and sintering performance of doped nano-silver paste
- Analysis of the interactions between nonoxide reinforcements and Al–Si–Cu–Mg matrices
- Research Articles
- Study on the influence of structural form and parameters on vibration characteristics of typical ship structures
- Deterioration characteristics of recycled aggregate concrete subjected to coupling effect with salt and frost
- Novel approach to improve shale stability using super-amphiphobic nanoscale materials in water-based drilling fluids and its field application
- Research on the low-frequency multiline spectrum vibration control of offshore platforms
- Multiple wide band gaps in a convex-like holey phononic crystal strip
- Response analysis and optimization of the air spring with epistemic uncertainties
- Molecular dynamics of C–S–H production in graphene oxide environment
- Residual stress relief mechanisms of 2219 Al–Cu alloy by thermal stress relief method
- Characteristics and microstructures of the GFRP waste powder/GGBS-based geopolymer paste and concrete
- Development and performance evaluation of a novel environmentally friendly adsorbent for waste water-based drilling fluids
- Determination of shear stresses in the measurement area of a modified wood sample
- Influence of ettringite on the crack self-repairing of cement-based materials in a hydraulic environment
- Multiple load recognition and fatigue assessment on longitudinal stop of railway freight car
- Synthesis and characterization of nano-SiO2@octadecylbisimidazoline quaternary ammonium salt used as acidizing corrosion inhibitor
- Perforated steel for realizing extraordinary ductility under compression: Testing and finite element modeling
- The influence of oiled fiber, freeze-thawing cycle, and sulfate attack on strain hardening cement-based composites
- Perforated steel block of realizing large ductility under compression: Parametric study and stress–strain modeling
- Study on dynamic viscoelastic constitutive model of nonwater reacted polyurethane grouting materials based on DMA
- Mechanical behavior and mechanism investigation on the optimized and novel bio-inspired nonpneumatic composite tires
- Effect of cooling rate on the microstructure and thermal expansion properties of Al–Mn–Fe alloy
- Research on process optimization and rapid prediction method of thermal vibration stress relief for 2219 aluminum alloy rings
- Failure prevention of seafloor composite pipelines using enhanced strain-based design
- Deterioration of concrete under the coupling action of freeze–thaw cycles and salt solution erosion
- Creep rupture behavior of 2.25Cr1Mo0.25V steel and weld for hydrogenation reactors under different stress levels
- Statistical damage constitutive model for the two-component foaming polymer grouting material
- Nano-structural and nano-constraint behavior of mortar containing silica aggregates
- Influence of recycled clay brick aggregate on the mechanical properties of concrete
- Effect of LDH on the dissolution and adsorption behaviors of sulfate in Portland cement early hydration process
- Comparison of properties of colorless and transparent polyimide films using various diamine monomers
- Study in the parameter influence on underwater acoustic radiation characteristics of cylindrical shells
- Experimental study on basic mechanical properties of recycled steel fiber reinforced concrete
- Dynamic characteristic analysis of acoustic black hole in typical raft structure
- A semi-analytical method for dynamic analysis of a rectangular plate with general boundary conditions based on FSDT
- Research on modification of mechanical properties of recycled aggregate concrete by replacing sand with graphite tailings
- Dynamic response of Voronoi structures with gradient perpendicular to the impact direction
- Deposition mechanisms and characteristics of nano-modified multimodal Cr3C2–NiCr coatings sprayed by HVOF
- Effect of excitation type on vibration characteristics of typical ship grillage structure
- Study on the nanoscale mechanical properties of graphene oxide–enhanced shear resisting cement
- Experimental investigation on static compressive toughness of steel fiber rubber concrete
- Study on the stress field concentration at the tip of elliptical cracks
- Corrosion resistance of 6061-T6 aluminium alloy and its feasibility of near-surface reinforcements in concrete structure
- Effect of the synthesis method on the MnCo2O4 towards the photocatalytic production of H2
- Experimental study of the shear strength criterion of rock structural plane based on three-dimensional surface description
- Evaluation of wear and corrosion properties of FSWed aluminum alloy plates of AA2020-T4 with heat treatment under different aging periods
- Thermal–mechanical coupling deformation difference analysis for the flexspline of a harmonic drive
- Frost resistance of fiber-reinforced self-compacting recycled concrete
- High-temperature treated TiO2 modified with 3-aminopropyltriethoxysilane as photoactive nanomaterials
- Effect of nano Al2O3 particles on the mechanical and wear properties of Al/Al2O3 composites manufactured via ARB
- Co3O4 nanoparticles embedded in electrospun carbon nanofibers as free-standing nanocomposite electrodes as highly sensitive enzyme-free glucose biosensors
- Effect of freeze–thaw cycles on deformation properties of deep foundation pit supported by pile-anchor in Harbin
- Temperature-porosity-dependent elastic modulus model for metallic materials
- Effect of diffusion on interfacial properties of polyurethane-modified asphalt–aggregate using molecular dynamic simulation
- Experimental study on comprehensive improvement of shear strength and erosion resistance of yellow mud in Qiang Village
- A novel method for low-cost and rapid preparation of nanoporous phenolic aerogels and its performance regulation mechanism
- In situ bow reduction during sublimation growth of cubic silicon carbide
- Adhesion behaviour of 3D printed polyamide–carbon fibre composite filament
- An experimental investigation and machine learning-based prediction for seismic performance of steel tubular column filled with recycled aggregate concrete
- Effects of rare earth metals on microstructure, mechanical properties, and pitting corrosion of 27% Cr hyper duplex stainless steel
- Application research of acoustic black hole in floating raft vibration isolation system
- Multi-objective parametric optimization on the EDM machining of hybrid SiCp/Grp/aluminum nanocomposites using Non-dominating Sorting Genetic Algorithm (NSGA-II): Fabrication and microstructural characterizations
- Estimating of cutting force and surface roughness in turning of GFRP composites with different orientation angles using artificial neural network
- Displacement recovery and energy dissipation of crimped NiTi SMA fibers during cyclic pullout tests