Creep rupture behavior of 2.25Cr1Mo0.25V steel and weld for hydrogenation reactors under different stress levels
-
Yan Song
 ,
Junnan Lv
,
Junnan Lv

Abstract
In the present research work, the 2.25Cr1Mo0.25V steel plates with a thickness of 112 mm were welded using the multi-pass submerged automatic arc welding process. The creep specimens were prepared from the base metal (BM) and weld metal (WM) in the welded joint after heat treatment process. The uniaxial creep tests were performed to investigate the creep deformation and rupture behaviors at 550°C under different applied stress levels. The microstructure and fracture surface morphology of crept BM and WM samples were also characterized using the scanning electron microscope with energy-dispersive X-ray spectroscopy. The results showed that typical three-stage creep deformation curves are observed in both BM and WM specimens, and the BM exhibits a faster deformation rate than the WM. Both the creep rupture time and uniaxial creep ductility are found to be increased with a decrease in applied stress. Furthermore, the relationship between the minimum creep rate and time to rupture of both BM and WM samples was obtained, and it can be described using a unified Monkman–Grant equation. In addition, it is found that the creep fractures of the BM and WM are a transgranular ductile failure. The creep damages of both materials are mainly associated with the microstructural degradations, that is, the initiation and coalescence of creep cavities at second phase particles such as carbide and inclusion particles along the loading direction.
1 Introduction
Hydrogenation reactor is the core process equipment in petrochemical hydroreforming, hydrofefining, and other petrochemical plants. Conventional high-strength chromium–molybdenum steels such as the 2.25Cr–1Mo and 9Cr–1Mo steel have been extensively used for more than 50 years in the manufacture of hydrogenation reactors and other pressure vessels that suffer high temperature and high pressure. Many studies have been performed concerning the hydrogen-assisted cracking, microstructure evolution, and fracture behaviors of these Cr–Mo steels and their welded joints in service environment for ensuring the reliability of reactors [1,2,3,4]. However, the severer operating environment and the lightweight design of the hydrogenation reactor require structural material with superior mechanical properties [5]. Thus, a vanadium-modified Cr–Mo steel (i.e., 2.25Cr1Mo0.25V steel), which exhibits superior strength and resistance to hydrogen damage, has been developed and used in the manufacture of heavy-wall hydrogenation reactors [5,6].
For Cr–No steels are used for producing hydrogenation reactors that operate at elevated temperatures, the time-dependent deformation and damage processes at elevated temperatures need to be considered in the equipment design and reliability analysis [7]. Such a phenomenon of time-dependent deformation at high temperatures is known as creep. To guarantee the safety of the newly built reactors in service process, it is necessary to fully understand the creep deformation and rupture behaviors of the 2.25Cr1Mo0.25V steel at elevated temperatures. On the other hand, the creep strength and life analysis and design of weldment are critical issues in practice for components operated at high temperatures [7,8]. It is known that welding is an important procedure in producing reactors. However, a weld is usually considered the weakest part of high-temperature equipment owing to the mismatch of chemical compositions, microstructures, and hence mechanical performance in weld, which are inevitably caused by the fusion welding process. A typical weld in the component consists of the base metal (BM), heat-affected zone (HAZ), and weld metal (WM). According to the crack location, the failure of the welded joint can be classified into four types, that is, Type I (cracks occur within the WM), Type II (cracks occur across the WM and HAZ), Type III (cracks occur in the coarse-grained HAZ), and Type IV (cracks take place in the fine-grained HAZ) [9]. Many studies have pointed out that the local nonuniform microstructure of the weld is the fundamental reason causing different types of creep failure [10,11,12,13,14]. For instance, Pandey et al. reported that the Type IV cracking dominated the creep life of the P91 steel weldments in both as-welded and post-weld heat treatment (PWHT) conditions [12,13]. The creep fracture location in a 9Cr–1.8W–0.5Mo–VNb steel weldment was found to shift from the BM to HAZ with a decrease in the applied stress level [14]. Such complicated creep response in the weld leads to the difficulty in accurately assessing the creep life of components. Fully understanding the creep rupture behavior and failure mechanism of the BM and weld is thus vital in the integrity assessment of hydrogenation reactors.
A number of studies so far have been conducted to investigate the creep rupture properties of the conventional 2.25Cr1Mo steel and its weld [15,16,17,18,19,20] for providing references for the service integrity of the equipment. For instance, Ray et al. [15] carried out a number of creep-rupture tests of 17-year service exposed 2.25Cr1Mo steel from a thermal power plant at the temperature range of 500–600°C. The results showed that both the steady-state creep rate and rupture time could be described by the Monkman–Grant relationship. Chaudhuri and Ghosh [16] found that the main damage mechanism dominating the creep strain evolutions of the 2.25Cr1Mo steel is the softening caused by carbide coarsening. Furthermore, a mechanism-based model was used to estimate the creep curve, and a precise estimation of creep life up to 5% strain was obtained. As for the vanadium-modified 2.25Cr1Mo steel, however, the study on creep rupture behavior is limited. Most studies regarding the 2.25Cr1Mo0.25V steel focused on the microstructures and tensile behaviors [21,22,23], reheat cracking sensitivity [24,25], and hydrogen-induced damage [26,27]. Only a few experimental investigations have been conducted to study the creep performance of various regions in 2.25Cr1Mo0.25V welded joint [28,29] and the creep–fatigue interaction behavior [30]. Thus, more data are necessary for establishing the Monkman–Grant relationship between the rupture time and steady-state creep rate for the prediction of creep lifetime. Moreover, the creep damage associated with the nucleation and coalescence of cavities needs to be clarified for a better understanding of the creep fracture mechanism of 2.25Cr1Mo0.25V steel and weld.
The purpose of the present research work is to experimentally study the creep deformation and rupture behaviors of BM and WM specimens extracted from a 2.25Cr1Mo0.25V steel welded joint with a thickness of 112 mm, which is prepared for the fabrication of a heavy-wall hydrogenation reactor. Tensile creep tests were performed at 550°C under different applied stress levels for the round-bar BM and WM specimens in the welding direction (WP). The quantitative relationship between the steady-state creep rate and time to rupture of both BM and WM was obtained based on the Monkman–Grant equation for creep life prediction. The differences in the creep deformation and rupture properties between BM and WM samples were also analyzed. Finally, the fracture surface morphology and microstructural change ahead of the fracture tip were investigated to clarify the creep damage mechanism.
2 Experimental details
2.1 Materials and specimen preparation
The investigated material was the 2.25Cr1Mo0.25V steel, which is low alloy steel widely used for manufacturing hydrogenation reactors in the petrochemical and coal chemical industries. The chemical compositions (wt%) of the investigated steel are given in Table 1. The specimens used for tensile creep tests were extracted from a multi-pass welded steel plate with a thickness of 112 mm, as displayed in Figure 1(a). The schematic of the groove design is depicted in Figure 1(b). The welding process involved the root pass and filling pass. Specifically, the shielded metal arc welding (SMAW) and submerged automatic arc welding (SAAW) techniques were utilized for the root pass and the filling pass, respectively. The welding process parameters including the welding voltage, current, travel speed, and thermal efficiency are shown in Table 2. Because the welding thermal cycles can induce significant welding residual stress and have an adverse impact on the microstructure and mechanical property of WM, a PWHT was conducted to minimize the welding residual stress and refine the microstructure of the weld. In particular, the PWHT temperature and the soaking time were 705°C and 8 h, respectively. In addition, the non-destructive X-radiography testing was carried out to inspect any welding defects such as microcracks or pores in the weld.
Chemical compositions (wt%) of BM and WM in the 2.25Cr1Mo0.25V steel welded joint
| Element | C | Si | Mn | P | S | Cr | Mo | V |
|---|---|---|---|---|---|---|---|---|
| BM | 0.15 | 0.10 | 0.54 | 0.009 | 0.01 | 2.30 | 0.98 | 0.30 |
| WM | 0.12 | 0.22 | 1.07 | 0.004 | 0.004 | 2.45 | 1.03 | 0.42 |
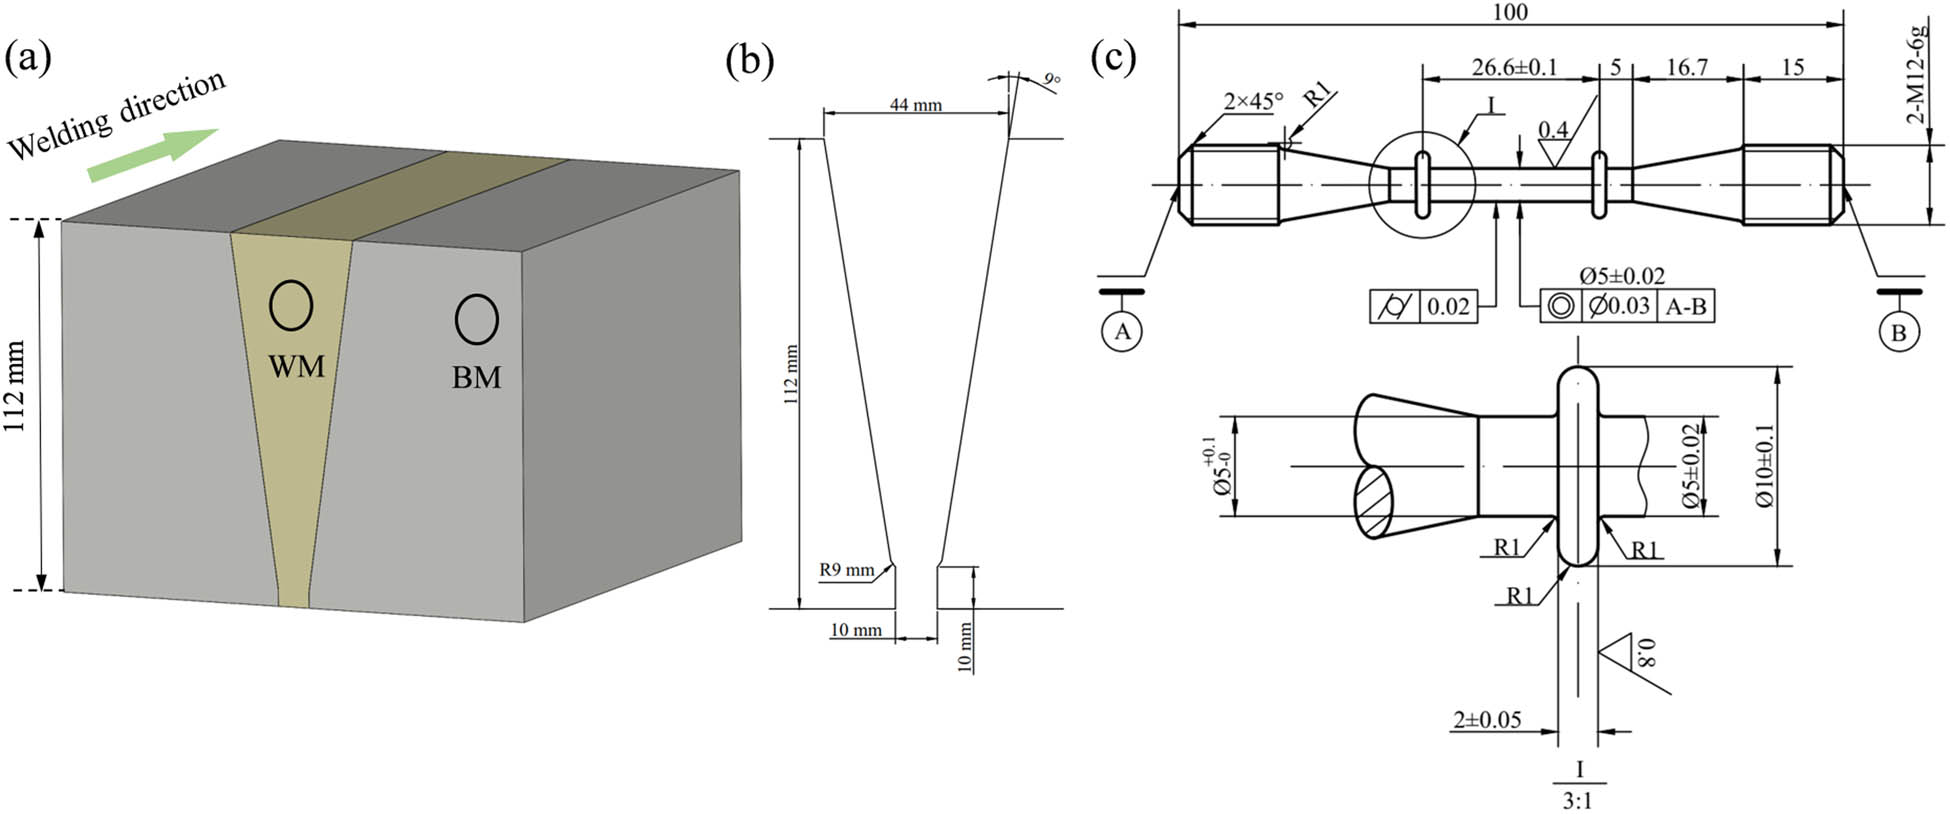
Schematics for (a) extracting creep samples from the 2.25Cr1Mo0.25V steel welded joint and (b) the groove design; (c) dimensions of creep specimen (unit: mm).
Welding parameters during the SMAW and SAAW processes
| Passes | Welding process | Voltage (V) | Current (A) | Travel speed (mm·min−1) | Efficiency |
|---|---|---|---|---|---|
| Root passes | SMAW | 26 | 230 | 129.2 | 0.75 |
| Filling passes | SAAW | 32 | 580 | 316.7 | 0.90 |
2.2 Microstructure observation
Metallographic specimens with the size of 10 mm × 10 mm × 10 mm were extracted from the welded steel plate for observing initial microstructures of the BM and WM after the heat treatment process. The metallographic specimens were mechanically polished with grinding papers and etched with a solution of 20 mL HCl + 4 g CuSO4·5H2O + 20 mL H2O. The microstructures of materials were observed with the aid of an OLYMPUS optical microscope and a field emission scanning electron microscope (FE-SEM, MAIA3LMH, TESCAN, Czech Republic) with energy-dispersive X-ray spectroscopy (EDS). In addition, creep ruptured specimens were also prepared to study the creep fracture mechanism with the aid of FE-SEM. Specifically, half of the fractured samples were sectioned longitudinally for observing the microstructures and distribution of creep cavities ahead of the fracture tip, whereas the other half was cut transversely for investigating the fracture surface morphologies.
2.3 Creep rupture tests
The round-bar specimen with a gauge length of 24.6 mm and a diameter of 5 mm was used for creep tests. The scheme of sampling for creep specimens is shown in Figure 1(a), and the geometrical dimension of the creep specimen is displayed in Figure 1(b). Uniaxial tensile creep tests were performed at 550°C under constant applied stress based on the ASTM E139-11 standard [31]. The experimental temperature is slightly higher than the design temperature of the hydroreforming reactor in the petrochemical industry. The applied constant stress is required to be below the yield strength of the tested material. Thus, prior to creep tests, uniaxial tensile tests were carried out on the BM and WM tensile specimens at 550°C under a strain rate of 2.5 × 10⁻⁴ s−1 to obtain the yield properties. The tensile properties of the BM and WM including the strength and ductility at 550°C are summarized in Table 3. Specifically, the yield strength of the BM and WM at 0.2% offset of plastic strain was determined as 393 and 416 MPa, respectively. Based on these results, different applied stress levels ranging from 375 to 275 MPa were selected in the present creep tests. Two specimens were tested under the stress of 375 and 275 MPa, while only one specimen was tested for other conditions (i.e. 350, 325, and 300 MPa). The loading direction was parallel to the WP, as depicted in Figure 1(b). During the creep tests, the engineering strain was automatically measured as a function of time until the rupture occurred.
Tensile properties of the BM and WM at 550°C
| Material | Temperature (°C) | Yield strength (MPa) | Tensile strength (MPa) | Reduction of area (%) |
|---|---|---|---|---|
| BM | 550 | 393 | 430 | 82.6 |
| WM | 550 | 416 | 450 | 79.4 |
3 Results and discussion
3.1 Microstructure characteristics
The microstructures of the 2.25Cr1Mo0.25V steel BM and WM after heat treatment are observed by using an optical microscope and illustrated in Figure 2. Both BM and WM exhibit typical granular bainite characteristics. However, it is worth noting the grain size of the WM is finer than that of BM, indicating the grain refinement in the WM caused by the PWHT process. The probability distributions of grain sizes were determined by Image-Pro Plus software and the results are shown in Figure 3. The average grain sizes of the BM and WM were estimated to be 7.52 and 6.16 μm, respectively. Furthermore, the microstructural morphologies were also observed using the FE-SEM with higher magnification, and the results are shown in Figure 4. The SEM images show that the grain size of the BM is slightly larger than that of the WM. In addition, substantial carbide particles are dispersed inhomogeneously in the ferrite matrix and grain boundaries of both materials.

Optical microscope images showing microstructures of the 2.25Cr1Mo0.25V steel: (a) BM and (b) WM.
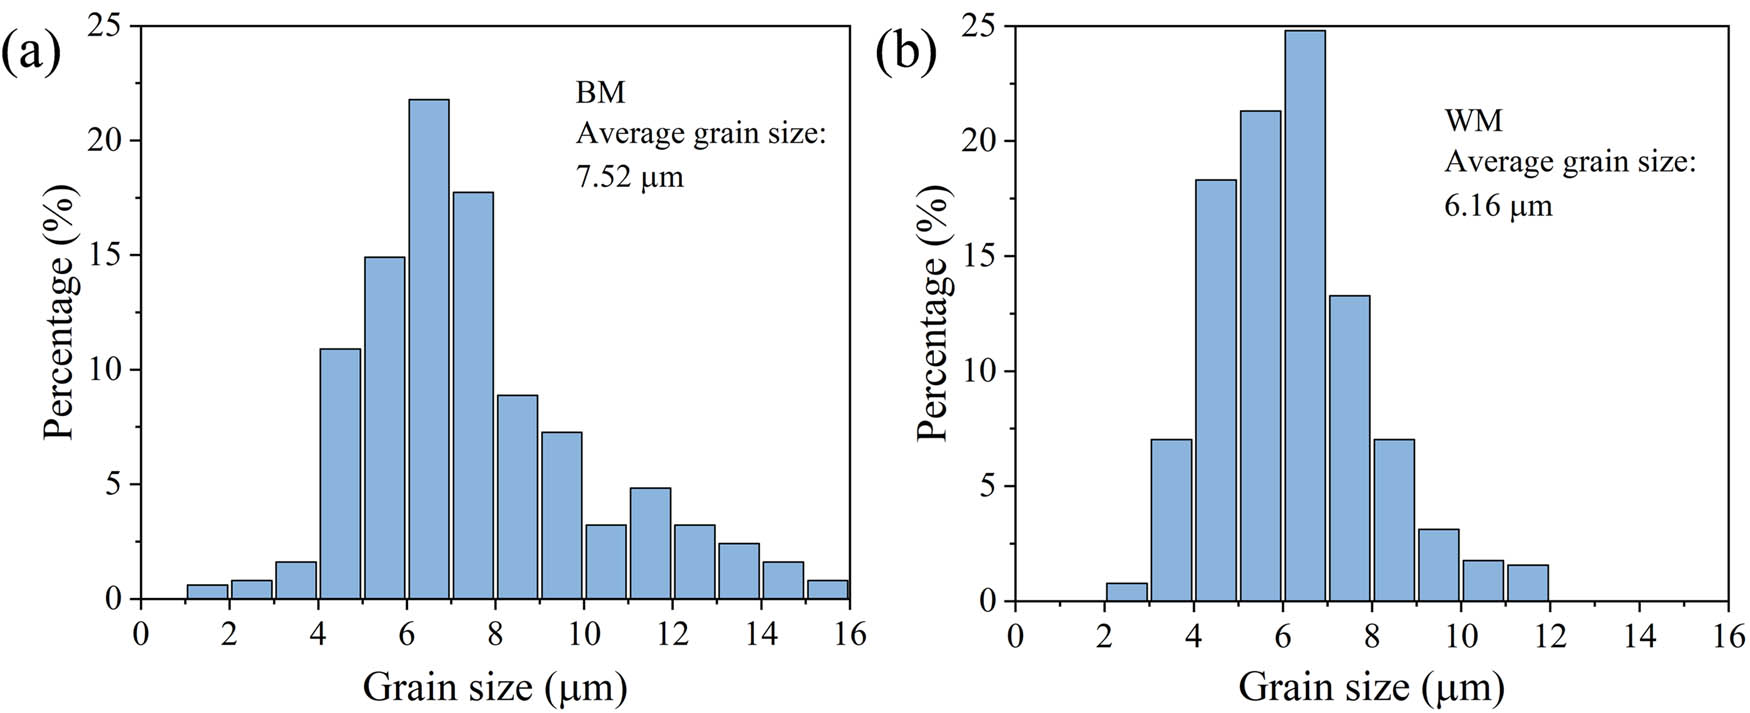
Probability distributions of grain size of the 2.25Cr1Mo0.25V steel: (a) BM and (b) WM. The average grain size of BM and WM are determined as 7.52 and 6.16 μm, respectively.

SEM images showing microstructures of the 2.25Cr1Mo0.25V steel: (a and b) BM and (c and d) WM.
3.2 Creep deformation behavior
Uniaxial tensile creep tests were conducted on the 2.25Cr1Mo0.25V steel BM and WM specimens at 550°C under various stress levels, which are lower than the corresponding yield stresses. The representative evolutions of creep strain versus testing time are illustrated in Figure 5. Clearly, the creep strain curves of both samples show three creep damage stages, that is, the primary creep stage, the secondary/steady-state creep stage, and the tertiary creep stage. The primary creep stage is little for all cases, and the followed secondary stage occupies the majority of creep life. When the steady-state stage appears, the creep rate attains the lowest value and maintains a roughly constant value. Since the tensile creep tests were carried out until rupture, the final tertiary stage in which the creep strain rate increases sharply with increasing time can be seen in all creep curves. On examination of results as shown in Figure 5, it is found that the creep lifetime increases with decreasing applied stress. For instance, the plots in Figure 5(a) indicate that for the creep tests of BM specimens, the creep lifetime shows an increase from 0.2 to 26.8 h with a decrease in the applied stress from 375 to 275 MPa. Likewise, the plots in Figure 5(b) show that with decreasing stress from 375 to 275 MPa for creep tests of the WM specimens, the creep lifetime increases significantly from 0.4 to 52.3 h. Additionally, by comparing the secondary stages under various stress levels, it can be found that the minimum creep rate increases monotonically by increasing the applied stress.

Creep deformation curves of the 2.25Cr1Mo0.25V steel: (a) BM and (b) WM under various stresses.
By comparing the creep curves of both BM and WM specimens, it is obvious the WM exhibits a superior creep damage resistance with a longer creep lifetime at the same level of the applied stress. This result is in agreement with the present tensile results where the WM specimen exhibits superior high-temperature tensile strength. The better creep resistance as well as tensile properties of the WM could be ascribed to the smaller grain size in the weld. To further illustrate the microstructural effect on the creep curves of BM and WM samples, the creep curves at different stress levels were normalized using the corresponding creep rupture time and rupture strain. Figure 6 presents the normalized creep curves of the BM and WM at the applied stress of 275 MPa. It is important to note the normalized creep curves of both materials coincide perfectly with each other, indicating that the influence of microstructural differences in BM and WM on creep deformation in the whole creep lifetime is insignificant in the present study. In addition, it can be seen that the steady-state creep stage dominates the whole creep process of both BM and WM samples. Nearly 60% of the creep life is consumed in this stage.
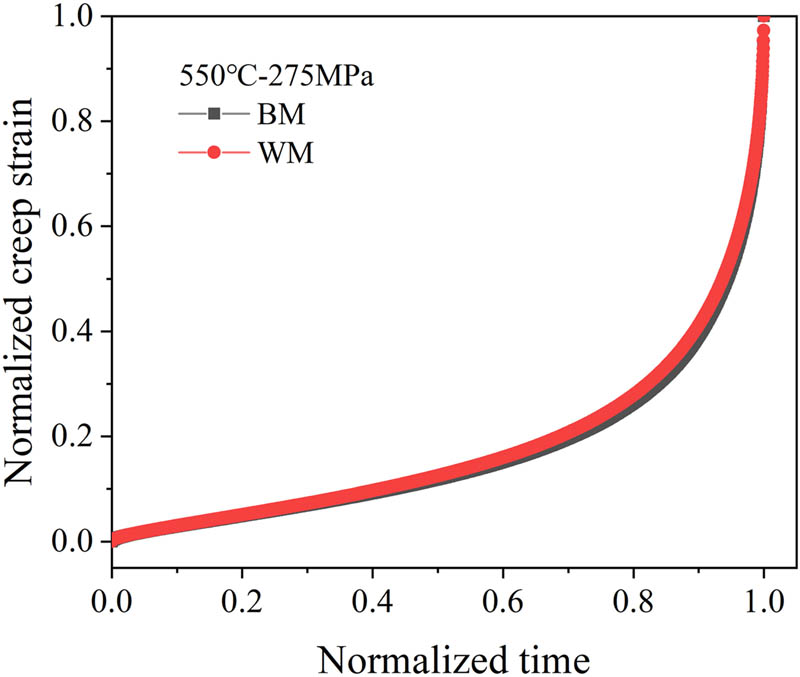
Normalized creep curves of BM and WM using the corresponding lifetime and creep rupture strain at 550°C under 275 MPa.
3.3 Creep rupture behavior
Some important creep properties can be obtained from the uniaxial creep strain curves, including the time to rupture (
Summary of creep-rupture time, minimum creep rate, and rupture elongation of BM and WM in 2.25Cr1Mo0.25V steel welded joint
| Temperature (°C) | Stress (MPa) | Time to rupture (h) | Minimum creep rate (h−1) | Rupture elongation (%) | |||
|---|---|---|---|---|---|---|---|
| BM | WM | BM | WM | BM | WM | ||
| 550 | 375 | 0.18 | 0.36 | 1.57 × 10⁻¹ | 1.09 × 10⁻¹ | 5.16 | 9.26 |
| 550 | 375 | 0.20 | 0.45 | 1.55 × 10⁻¹ | 0.60 × 10⁻¹ | 5.14 | 8.58 |
| 550 | 350 | 0.81 | 1.41 | 3.09 × 10⁻² | 2.06 × 10⁻² | 10.57 | 12.95 |
| 550 | 325 | 2.34 | 6.66 | 1.32 × 10⁻² | 4.59 × 10⁻³ | 15.87 | 13.76 |
| 550 | 300 | 9.99 | 16.70 | 3.85 × 10⁻³ | 2.24 × 10⁻³ | 17.22 | 15.62 |
| 550 | 275 | 28.16 | 40.80 | 1.24 × 10⁻³ | 1.07 × 10⁻³ | 20.10 | 20.48 |
| 550 | 275 | 26.83 | 52.41 | 1.45 × 10⁻³ | 8.29 × 10⁻⁴ | 18.43 | 19.13 |

Variation of (a) time to rupture and (b) minimum strain rate with respect to applied stress for BM and WM specimens.

Variation of rupture elongation with respect to (a) applied stress and (b) time to rupture for BM and WM specimens.
Generally, for the given temperature, the relationship between the creep life (
where M is the Monkman–Grant constant, A is the material constant, n is the stress exponent for creep, Q c is the activation energy for creep, R is the gas constant, and T is the absolute test temperature. The coefficients of determination (R 2) for linear fitting of the creep data in Figure 7 are found to be close to 1, indicating a good fit. The stress exponent n can be calculated as the slopes in Figure 7(b) using equation (1). The obtained values of n for both BM and WM samples are 15.08 and 14.26, respectively. Yang and Xuan [35] studied the creep behavior of the weld pass metal in the WP and the multiple weld passes through the thickness direction (MWP) in a Cr–Mo–V weldment using miniature specimens at 538°C. Their results showed that the stress exponents were obtained as 13.48 and 13.14 for the MWP and WP specimens, respectively, which are quite close to those of the present results. Previous studies regarding the creep rupture properties of the 2.25Cr1Mo steels with various testing conditions have shown that the values of stress exponents distributed in the range of 5–13 [15,19,20,36]. The obtained stress exponents in this work are also in agreement with the upper limit in the literature. In addition, it is shown that the variation in stress exponent can be interpreted by the change in creep fracture mechanism [37]. Thus, the almost same stress exponents between BM and WM samples suggest a similar fracture mechanism.
Figure 9 shows the variation of the minimum creep rate with the creep rupture time for BM and WM samples. Obviously, there is a perfect linear relationship between the rupture time and the minimum creep rate for both BM and WM samples in the double logarithmic coordinates with an R 2 value of 0.994. The linear fitting equation is as follows:

The relationship between the minimum creep rate and the creep rupture time.
It can also be written as the Monkman–Grant (M–G) relation:
where m = 1.054 and C = 0.0263. The M–G parameters m and C are independent of test temperature and applied stress. Moreover, the obtained two parameters in this study are in good agreement with previous results of the 2.25Cr1Mo steels in creep-rupture studies reported by Ray et al. [15], Chen et al. [17], and Song et al. [19]. Their results are m = 1.027 and C = 0.0278, and m = 1.04 and C = 0.046, and m = 1.016 and C = 0.0528, respectively. It should be noted that this equation is of great significance in practice for the prediction of creep lifetime. Generally, the hydrogenation reactor in service suffers high-temperature environment, and therefore, the creep lifetime needs to be estimated for ensuring the reliability and integrity. However, the creep rupture time is difficult to be directly measured by testing. The Monkman–Grant law provides us an opportunity for estimating the creep lifetime by using the minimum creep rate, which can be achieved by performing standard creep tests within a short period. A number of investigations have demonstrated that the Monkman–Grant relationship between the minimum creep rate and the rupture time applies to a broad range of temperatures and applied stresses [15,38,39,40]. Therefore, it is believed that equation (3) is helpful for the prediction of the creep lifetime of hydrogenation reactors and other pressure vessels made from the 2.25Cr1Mo0.25V steel. Because such steel is believed to have at least 20-year lifetime in hydrogenation reactors, further studies should be carried out to investigate the long-term creep rupture behavior under lower applied stress, which helps to provide significant data support for the prediction of long-term creep lifetime by equation (3).
It is also worth noting that in the present study, the BM and WM samples follow a single Monkman–Grant equation, indicating the insignificant effect of microstructures on the linear relationship. Previous studies have shown that microstructural variations in materials during creep have little influence on the Monkman–Grant relation [17,19,40,41], which is consistent with our results. It has been confirmed that once the initial state of an alloy is fixed, the corresponding Monkman–Grant equation will not be changed [19]. For instance, Hug et al. [41] studied the creep behavior of nodular cast irons with three various matrix compositions and microstructures at various temperatures. Their results showed the relationship between the minimum creep rate and creep rupture time of all materials obeyed a unified Monkman–Grant law. A similar result was also obtained in the creep studies of the 2.25Cr1Mo steels with and without impurity element Sb [17]. Thus, it is reasonable for both BM and WM specimens to obey a unified Monkman–Grant law. In this study, the change in microstructures has an influence on the creep lifetime and creep rate, however, has no effect on the Monkman–Grant relation.
3.4 Fracture surface morphology
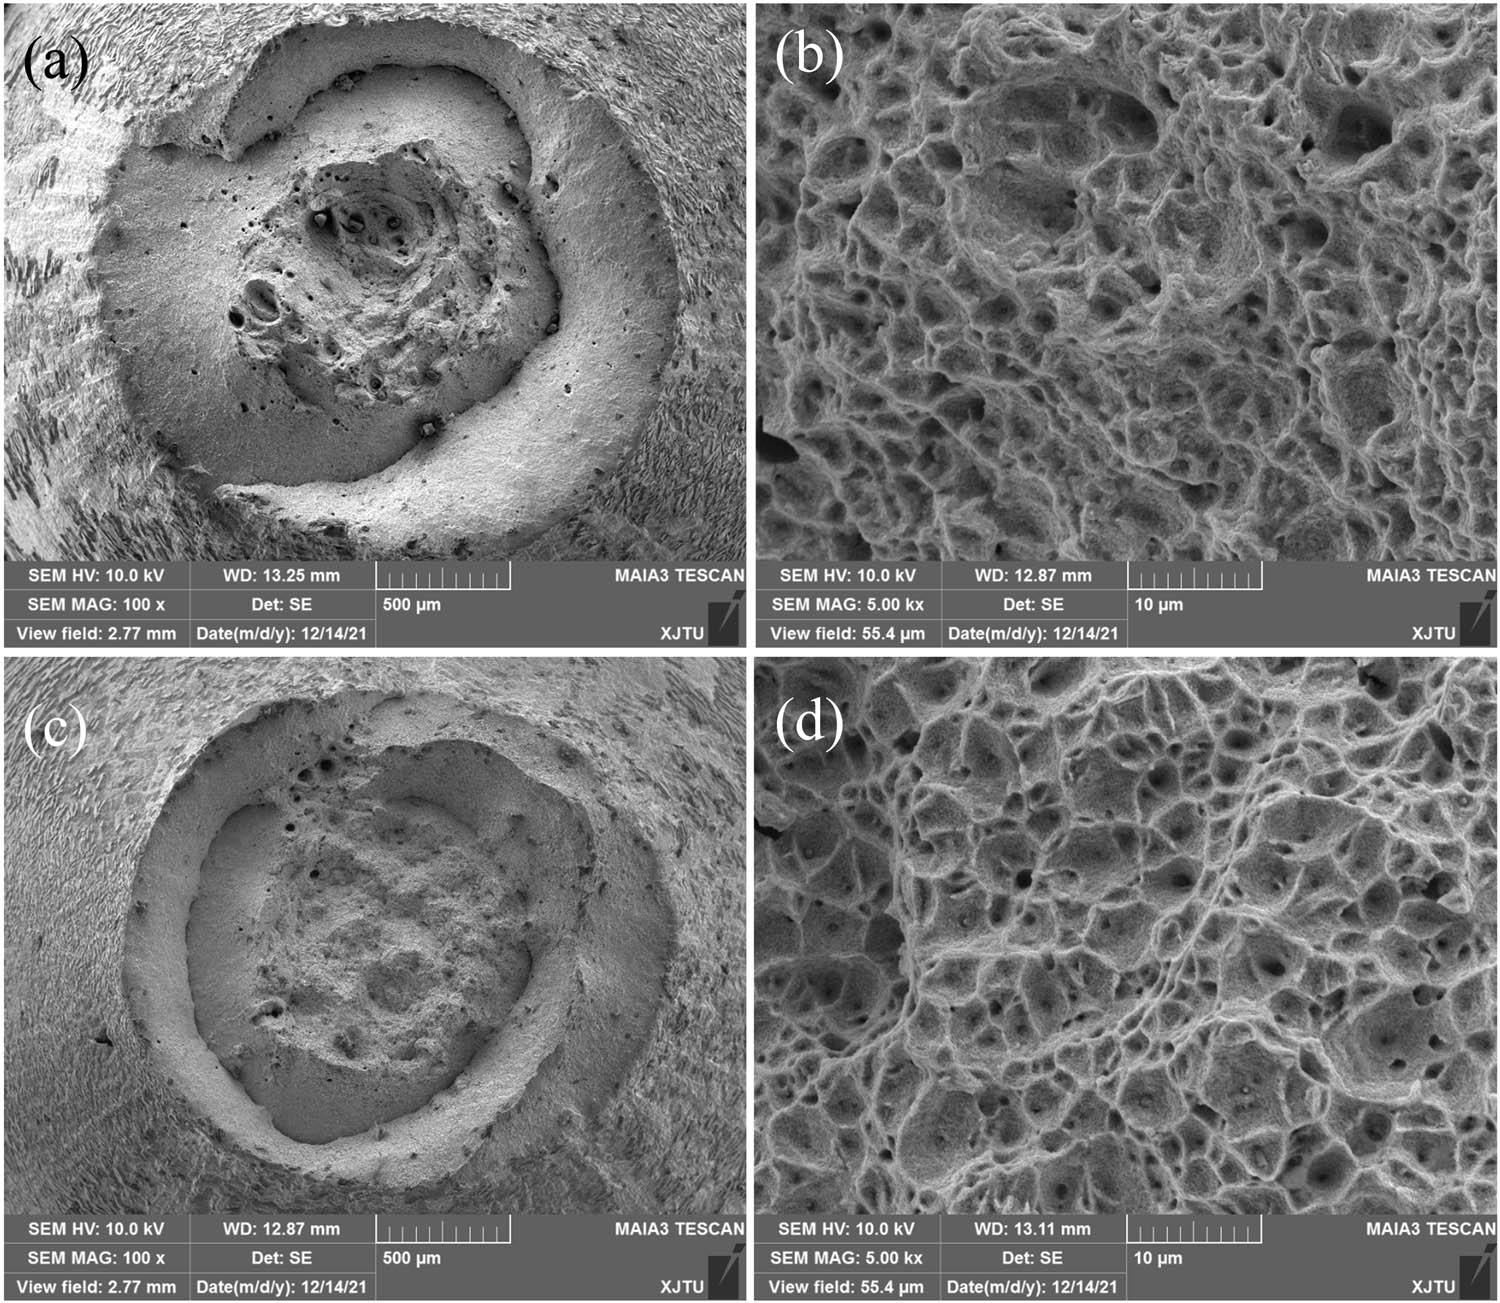
To investigate the fracture mode, the creep ruptured specimens were sectioned transversely and the fracture morphologies were observed by SEM. Figures 10–12 show the fracture appearances of fractured BM and WM samples under different stress levels (i.e. 375, 325, and 275 MPa). It can be noted that all the fractured specimens exhibit obvious necking after creep damages under different applied stresses, indicating ductile failure. The overall fracture surface includes the ductile fracture region located in the center of the sample, and the shear fracture region next to the surface, indicating that the creep damage initiates in the center of the specimen and then propagates to the surface. The existence of numerous equal-axis dimples, which results from the micro-void nucleation and coalescence, indicates that normal stress acts as a dominant role during the creep process. Comparisons of the overall fracture surfaces of BM and WM samples suggest that the BM specimens have many dimples with an obviously larger diameter and depth, while the dimples in fracture surfaces of the WM specimens are relatively small and shallow. Such phenomenon is independent of the applied stress, suggesting that the BM exhibits a higher ductility than WM. The magnified SEM images (i.e. Figures 10(b and d), 11(b and d), and 12(b and e)) in the center of the sample show the presence of fine equiaxial dimples. The inclusion can also be observed in the center of dimples on fracture surface of the WM samples, as shown in Figures 10(d) and 12(f). The elements of the inclusion located inside the dimple in weld (Figure 12(f)) were measured by EDS, and the corresponding results are described in Figure 13. Substantially high contents of oxygen, aluminum, silicon, and manganese can be found in the EDS spectra of the inclusion. The existence of inclusions in weld promotes the nucleation and growth of dimples.

SEM fracture morphologies of the creep ruptured (a and b) BM and (c and d) WM specimens at 550°C under the stress of 375 MPa.
SEM fracture morphologies of the creep ruptured (a and b) BM and (c and d) WM specimens at 550°C under the stress of 325 MPa.
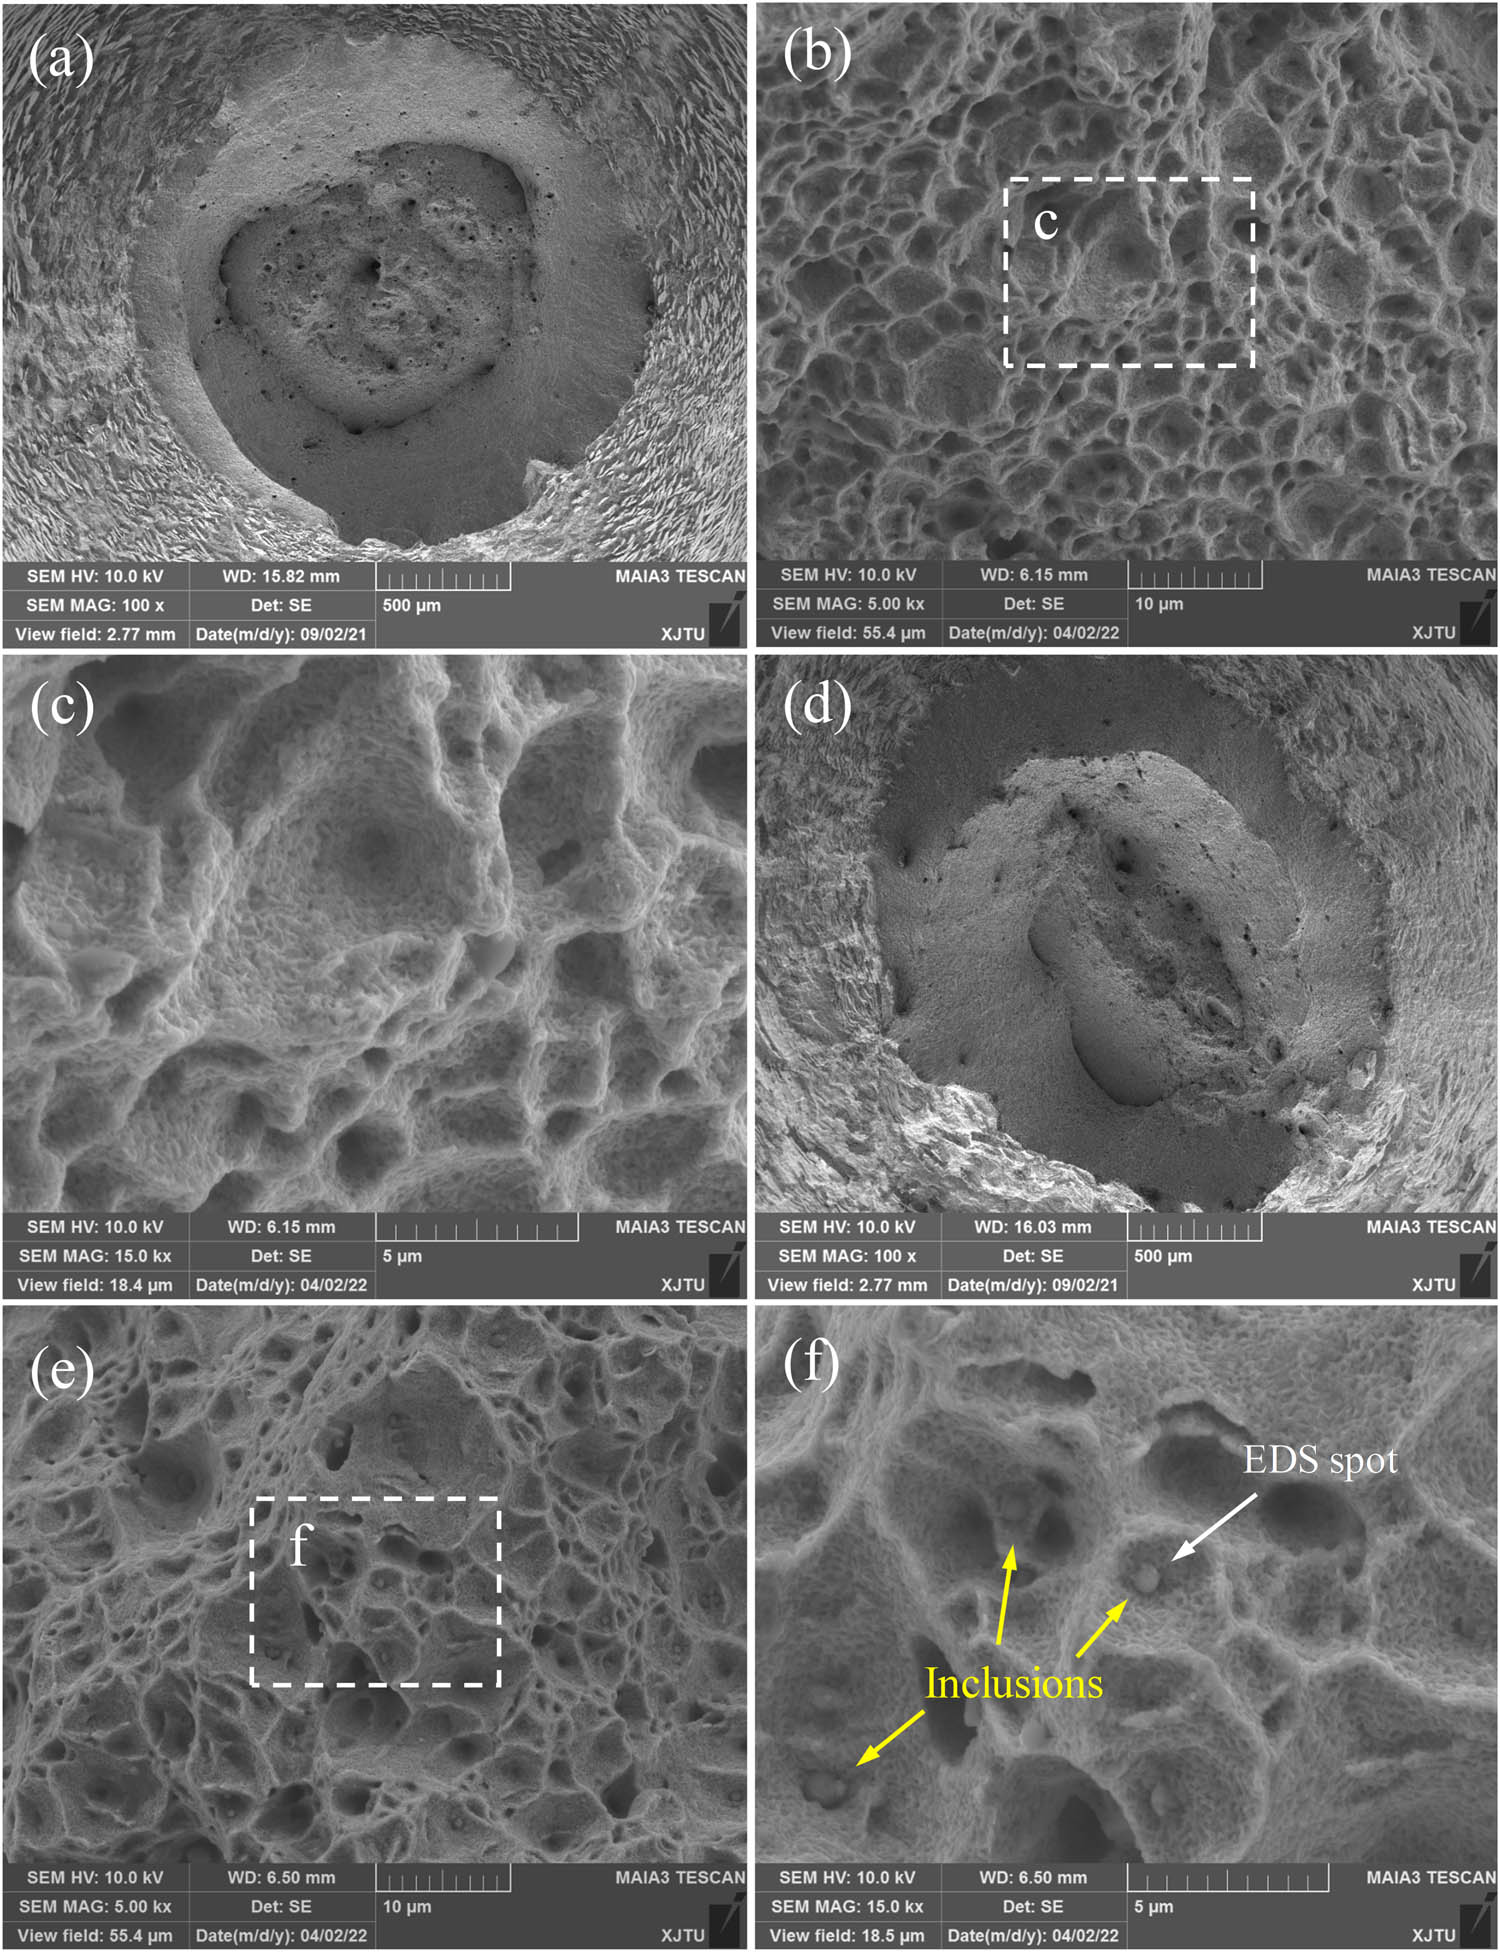
SEM fracture morphologies of the creep ruptured (a–c) BM and (d–f) WM specimens at 550°C under the stress of 275 MPa; (c) and (f) are the morphologies of dimples in (b) and (e), respectively.

EDS result of the inclusion inside the dimple in the fracture surface of WM in Figure 12(f).
Additionally, it can be observed that the average size of fine dimples located in the center of the specimens increases with a decrease in the applied stress. This phenomenon is particularly obvious for the BM specimens, as shown in Figures 10(b) and 11(b) and and 12(b). Generally, the larger size of dimples indicates a higher ductility of material. That is to say, in this study, the lower applied stress results in higher ductility of both BM and WM samples. This result is consistent with the experimental observation of the variation of creep rupture elongation with applied stress, as displayed in Figure 8. Such a result is also consistent with the previous experimental phenomenon in a 2.25Cr1Mo steel [19], Zr–2.5Nb alloy [38] and 9Cr–1Mo steel [42]. It was reported that during the creep tests under high applied stresses, the coalescence of micro-voids may occur before they grow to a large size, whereas at low applied stresses, the micro-voids can preferentially grow prior to their coalescence [38]. As a result, an increase in dimple size with decreasing applied stress is reasonably obtained.
3.5 Creep damage mechanism
On the basis of the continuum damage mechanics, the creep damage evolution process prior to rupture can be elucidated by the creep damage tolerance factor λ, which is used for evaluating the susceptibility of a material to strain concentration. The value of λ can be obtained as the ratio of strain to rupture
Previous studies have shown that different damage micro-mechanisms during creep generally lead to different characteristic values of λ [37,44]. As stated in ref. [43], for λ = 1, the material has a very low creep strain and no appreciable plastic deformation occurs, leading to brittle failure. A higher value of λ in the range of 1–2.5 indicates that a low rupture strain occurs in the material and the damage is caused by the intergranular cavitation. If the value of λ lies in the range of 2.5–5, the material experience appreciable localized plastic deformation, resulting in significant necking in the gauge section. Besides, the value of λ higher than 5 indicates the dominant damage mechanism is microstructural degradation such as the coarsening of precipitates and rearrangement of dislocations. Additionally, it is recommended that the value of λ is equal to or larger than 5 so that sufficient localized strain levels typically occurred during service can be ensured. In this investigation, the calculated values of λ at all stress levels are found to be in the range of 5.4–10.5, indicating the creep failure of both BM and WM samples are mainly caused by the microstructural degradation.
In order to observe the microstructure after creep failure, the ruptured BM and WM samples were first longitudinally sectioned, then mechanically polished, and finally etched with the appropriate chemical solution. Figure 14(a) shows the entire graph of the longitudinal cross-section of the BM sample under the stress of 275 MPa, and Figure 14(b–e) shows the microstructures near the fracture tip. An apparent necking can be seen in Figure 14(a). By carefully observing the microstructures with high magnifications, numerous elongated creep cavities showing different sizes, which are mostly initiated ahead of carbide particles (Figure 14(c and e)), can be found inside the material. These cavities propagate parallel to the loading direction, suggesting the applied stress plays a dominant role in the coalescence of cavities. Furthermore, the creep cavities have a tendency to gather into a micro-crack with several microns in length along the carbide particles (Figure 14(c and e)). The linkage of these cavities to form a crack and its propagation under the applied stress could accelerate the creep failure of material.

SEM images showing the damage zones of the creep ruptured BM specimen under the stress of 275 MPa. (a) The entire image of the longitudinal cross-section; (b) and (d) are the distribution of creep cavities in the BM; (c) and (e) are the morphologies of corresponding creep cavities in (b) and (d), respectively.
Figure 15 displays the entire image of the longitudinal cross-section of the creep ruptured WM specimen and the corresponding microstructures near the fracture tip at the stress of 275 MPa. An obvious necking is also observed in the fracture surface, as displayed in Figure 15(a). A large number of small cavities can be found in the microstructure, as displayed in Figure 15(b and d). It can also be observed that the density of carbide particles in the WM is smaller than that in BM, indicating that the precipitation of carbides in the BM is easier to occur under creep. The ellipse cavities shown in Figure 15(c, e, and f) are found to be initiated at both carbide particles and inclusions. The propagation of these cavities was also parallel to the loading direction. The main elements of the inclusion, which is located inside the cavity and marked by the yellow arrow in Figure 15(e), were measured by an EDS. The corresponding EDS results are shown in Figure 15(g). Obviously, the EDS spectra exhibit distinctly high contents of oxygen, aluminum, silicon, and manganese of the inclusion in WM. The existence of inclusion causes localized stress concentration for the initiation and propagation of cavities, as shown in Figure 15(e and f).

SEM images showing the damage zones of the creep ruptured WM specimen under the stress of 275 MPa. (a) The entire image of longitudinal cross-section; (b) and (d) are the distribution of creep cavities in WM; (c)– (f) are the morphologies of creep cavities in (b) and (d); and (g) is the point scanning by EDS for the inclusion in the creep cavity in the WM.
It is vital to clarify the creep damage mechanism of the 2.25Cr1Mo0.25V steel and weld for better understanding of the creep deformation and rupture behaviors. As analyzed above, the creep strength prediction model and the creep rupture properties are independent of the applied stress level. The almost identical stress exponents of BM and WM samples indicate a similar creep damage mechanism for both materials. In general, the growth and coalescence of creep cavities are the primary damage mechanism causing creep failure [45]. It is shown that the cavities are probably to initiate and grow in the early stage of the creep process at some localized regions such as grain boundaries or particles [45,46,47]. In this work, the analyses on the distribution of cavities demonstrate that the initiation and growth of creep cavities at second phase particles along the loading direction are the main reason leading to the transgranular ductile failure for both specimens. In particular, for BM specimens, the cavities mainly nucleate at carbide particles grow in the loading direction. Precipitates observed in Figure 13(c and e) in a crept BM specimen indicate that the carbides aided in the cavity formation. On the other hand, for WM specimens, both carbide and inclusion particles play as the preferential sites for cavity formation, as shown in Figure 14(e and f). These second phase particles with various sizes can lead to sufficient stress concentration for cavity formation under the effect of applied stress. The number of cavities increases gradually with increasing creep time and cavities can grow and coalesce to form numerous micro-cracks, as depicted in Figure 13(c). Further propagation of these micro-cracks will lead to the tertiary creep stage with rapid strain rate and final fracture. Therefore, one can conclude that the microstructural degradations, that is the initiation and growth of creep cavities at second phase particles along the loading direction, are the primary failure mechanism resulting in the creep failure of BM and WM in the 2.25Cr1Mo0.25V steel welded joint.
4 Conclusions
In the present research work, the creep deformation and rupture properties of the BM and WM in a 2.25Cr1Mo0.25V steel welded joint used for manufacturing the hydrogenation reactor were experimentally investigated at 550°C under different applied stress levels ranging from 375 to 275 MPa. The prediction of creep rupture strength and the microscopic analyses on creep damages have been performed. Major findings and conclusions are summarized as follows:
The minimum creep rate increases with increasing applied stress, while the creep ductility decreases with the applied stress for both BM and WM samples. The WM exhibits a superior resistance to creep damage than that of the BM.
The relationship between the minimum creep rate and time to rupture of both BM and WM samples can be described by a unified Monkman–Grant equation, expressed as
The creep fractures of both BM and WM are characterized by transgranular ductile failure. The creep damages inside both materials are mainly associated with the initiation and growth of creep cavities at second phase particles such as carbide and inclusion particles along the loading direction.
-
Funding information: The study was supported by the China Postdoctoral Science Foundation (No. 2021M692532), the National Nature Science Foundation of China (No. 12072249), the National Science and Technology Major Project (2019-VII-0007-0147), and the Innovative Scientific Program of CNNC.
-
Author contributions: All authors have accepted responsibility for the entire content of this manuscript and approved its submission.
-
Conflict of interest: Authors state no conflict of interest.
References
[1] Costa, L. R. O., L. F. Lemus, and D. S. dos Santos. Hydrogen embrittlement susceptibility of welded 2¼Cr–1Mo steel under elastic stress. International Journal of Hydrogen Energy, Vol. 40, 2015, pp. 17128–17135.10.1016/j.ijhydene.2015.08.027Search in Google Scholar
[2] Saini, N., C. Pandey, and M. M. Mahapatra. Effect of diffusible hydrogen content on embrittlement of P92 steel. International Journal of Hydrogen Energy, Vol. 42, 2017, pp. 17328–17338.10.1016/j.ijhydene.2017.05.214Search in Google Scholar
[3] Pandey, C., M. M. Mahapatra, P. Kumar, and N. Saini. Effect of weld consumable conditioning on the diffusible hydrogen and subsequent residual stress and flexural strength of multipass welded P91 steels. Metallurgical and Materials Transactions B: Process Metallurgy and Materials Processing Science, Vol. 49, 2018, pp. 2881–2895.10.1007/s11663-018-1314-8Search in Google Scholar
[4] Sauraw, A., A. K. Sharma, D. Fydrych, S. Sirohi, A. Gupta, A. Swierczynska, et al. Study on microstructural characterization, mechanical properties and residual stress of GTAW dissimilar joints of P91 and P22 steels. Materials (Basel), Vol. 14, No. 21, 2021, id. 6591.10.3390/ma14216591Search in Google Scholar PubMed PubMed Central
[5] Chen, X., Z. Fan, Y. Chen, X. Zhang, and B. Shou. Development of lightweight design and manufacture of heavy-duty pressure vessels in China. Proceedings of ASME Pressure Vessels Piping Conference (PVP 2018), Prague, Czech Republic, 2018.10.1115/PVP2018-84176Search in Google Scholar
[6] Huang, S., Y. Li, X. Song, H. Hui, and J. Zhong. Experimental and numerical investigation on manufacturing-induced material inhomogeneity in hydrogenation reactor shell. Journal of Pressure Vessel Technology, Vol. 142, No. 5, 2020, id. 051504.10.1115/1.4046887Search in Google Scholar
[7] Xuan, F. Z., J. J. Chen, Z. Wang, and S. T. Tu. Time-dependent deformation and fracture of multi-material systems at high temperature. International Journal of Pressure Vessels and Piping, Vol. 86, 2009, pp. 604–615.10.1016/j.ijpvp.2009.04.013Search in Google Scholar
[8] Perrin, I. J. and J. D. Fishburn. A perspective on the design of high-temperature boiler components. International Journal of Pressure Vessels and Piping, Vol. 85, 2008, pp. 14–21.10.1016/j.ijpvp.2007.06.008Search in Google Scholar
[9] Shüller, H. J., L. Haigh, and A. Woitscheck. Cracking in the weld region of shaped components in hot steam lines-materials investigations. Der Masinenschaden, Vol. 47, 1974, pp. 1–13.Search in Google Scholar
[10] DuPont, J. N. Microstructural evolution and high temperature failure of ferritic to austenitic dissimilar welds. International Materials Reviews, Vol. 57, 2012, pp. 208–234.10.1179/1743280412Y.0000000006Search in Google Scholar
[11] Xu, X., J. A. Siefert, J. D. Parker, and R. C. Thomson. Influence of microstructure on cavitation in the heat affected zone of a Grade 92 steel weld during long-term high temperature creep. Materials Characterization, Vol. 170, 2020, id. 110663.10.1016/j.matchar.2020.110663Search in Google Scholar
[12] Pandey, C., M. M. Mahapatra, and P. Kumar. Effect of post weld heat treatments on fracture frontier and type IV cracking nature of the crept P91 welded sample. Materials Science & Engineering, A: Structural Materials: Properties, Microstructure and Processing, Vol. 731, 2018, pp. 249–265.10.1016/j.msea.2018.06.038Search in Google Scholar
[13] Pandey, C., M. M. Mahapatra, P. Kumar, S. Kumar, and S. Sirohi. Effect of post weld heat treatments on microstructure evolution and type IV cracking behavior of the P91 steel welds joint. Journal of Materials Processing Technology, Vol. 266, 2019, pp. 140–154.10.1016/j.jmatprotec.2018.10.024Search in Google Scholar
[14] Sakthivel, T., M. Vasudevan, K. Laha, P. Parameswaran, K. S. Chandravathi, S. Panneer Selvi, et al. Creep rupture behavior of 9Cr–1.8W–0.5Mo–VNb (ASME grade 92) ferritic steel weld joint. Materials Science & Engineering, A: Structural Materials: Properties, Microstructure and Processing, Vol. 591, 2014, pp. 111–120.10.1016/j.msea.2013.10.071Search in Google Scholar
[15] Ray, A. K., K. Diwakar, B. N. Prasad, Y. N. Tiwari, R. N. Ghosh, and J. D. Whittenberger. Long term creep–rupture behaviour of 813K exposed 2.25–1Mo steel between 773 and 873K. Materials Science & Engineering, A: Structural Materials: Properties, Microstructure and Processing, Vol. 454–455, 2007, pp. 124–131.10.1016/j.msea.2006.11.020Search in Google Scholar
[16] Chaudhuri, S. and R. N. Ghosh. Creep behavior of 2.25Cr1Mo steel – effects of thermal ageing and pre-strain. Materials Science & Engineering, A: Structural Materials: Properties, Microstructure and Processing, Vol. 510, 2009, pp. 136–141.10.1016/j.msea.2008.04.108Search in Google Scholar
[17] Chen, K., Y. Xu, and S. Song. Effect of impurity antimony on the creep behavior of 2.25Cr–1Mo heat-resistant steel. Results in Physics, Vol. 13, 2019, id. 102208.10.1016/j.rinp.2019.102208Search in Google Scholar
[18] Shinya, N., J. Kyono, and M. Mathew. Creep rupture ductility related to creep fracture mechanisms in 2.25Cr–1Mo steel. Metal Science Journal, Vol. 19, 2013, pp. 1571–1574.10.1179/026708303225008158Search in Google Scholar
[19] Song, S. H., J. Wu, X. J. Wei, D. Kumar, S. J. Liu, and L. Q. Weng. Creep property evaluation of a 2.25Cr–1Mo low alloy steel. Materials Science & Engineering, A: Structural Materials: Properties, Microstructure and Processing, Vol. 527, 2010, pp. 2398–2403.10.1016/j.msea.2010.01.007Search in Google Scholar
[20] Laha, K., K. S. Chandravathi, K. B. S. Rao, S. L. Mannan, and D. H. Sastry. Prediction of creep deformation and rupture behaviour of 2.25Cr–1Mo weld joint. International Journal of Pressure Vessels and Piping, Vol. 77, 2000, pp. 761–769.10.1016/S0308-0161(00)00060-0Search in Google Scholar
[21] Jiang, Z., P. Wang, D. Li, and Y. Li. The evolutions of microstructure and mechanical properties of 2.25Cr–1Mo–0.25V steel with different initial microstructures during tempering. Materials Science & Engineering, A: Structural Materials: Properties, Microstructure and Processing, Vol. 699, 2017, pp. 165–175.10.1016/j.msea.2017.05.095Search in Google Scholar
[22] Fu, R. D., S. F. Wu, W. H. Zhou, W. H. Zhang, Y. Q. Yang, and F. C. Zhang. Effects of heat treatment processes on microstructure and properties of 2.25Cr–1Mo–0.25V HSLA steels. Metal Science Journal, Vol. 25, 2013, pp. 50–55.10.1179/174328407X213143Search in Google Scholar
[23] Wang, Y., G. Cheng, M. Qin, Q. Li, Z. Zhang, K. Chen, et al. Effect of high temperature deformation on the microstructure, mechanical properties and hydrogen embrittlement of 2.25Cr–1Mo–0.25V steel. International Journal of Hydrogen Energy, Vol. 42, No. 38, 2017, pp. 24549–24559.10.1016/j.ijhydene.2017.07.237Search in Google Scholar
[24] Han, Y., X. Chen, Z. Fan, H. Bu, and Y. Zhou. Reheat cracking sensitivity of CGHAZ in Vanadium-modified 2.25Cr1Mo welds. American Society of Mechanical Engineers, Pressure Vessels and Piping Division (Publication) PVP, 2014, p. 6.10.1115/PVP2014-28706Search in Google Scholar
[25] Chauvy, C. D. and S. Pillot. Prevention of weld metal reheat cracking during Cr–Mo–V heavy reactors fabrication. ASME Pressure Vessels Piping Conference, 2009 Jul 26–30, Prague, Czech Republic, 2010.10.1115/PVP2009-78144Search in Google Scholar
[26] Huang, S., Z. Chen, Y. Li, and D. Zhang. Impact of hot bending on the high-temperature performance and hydrogen damage of 2.25Cr–1Mo–0.25V steel. Journal of Materials Engineering and Performance, Vol. 28, 2019, pp. 567–577.10.1007/s11665-018-3777-9Search in Google Scholar
[27] Song, Y., M. Y. Chai, W. J. Wu, Y. L. Liu, M. Qin, and G. X. Cheng. Experimental investigation of the effect of hydrogen on fracture toughness of 2.25Cr–1Mo–0.25V steel and welds after annealing. Materials, Vol. 11, 2018, id. 499.10.3390/ma11040499Search in Google Scholar
[28] Yang, B. and F. Z. Xuan. Nonhomogeneous microstructure related creep damage of the CrMoV multi-pass weld metal. Materials Science & Engineering, A: Structural Materials: Properties, Microstructure and Processing, Vol. 763, 2019, id. 138122.10.1016/j.msea.2019.138122Search in Google Scholar
[29] Chu, L., X. Chen, Z. Fan, Y. Zhou, Z. Wu, and Q. Cui. Characterization of heterogeneous creep deformation in vanadium-modified 2.25Cr1Mo steel weldments by digital image correlation. Materials Science & Engineering, A: Structural Materials: Properties, Microstructure and Processing, Vol. 816, 2021, id. 141350.10.1016/j.msea.2021.141350Search in Google Scholar
[30] Yang, T., D. Yu, Z. Zhao, C. Gang, and C. Xu. Low cycle fatigue and creep–fatigue interaction behaviour of 2.25Cr1MoV steel at elevated temperature. High Temperature Technology, Vol. 33, 2016, pp. 75–84.10.1080/09603409.2015.1108504Search in Google Scholar
[31] ASTM E139-06. Standard test methods for conducting creep, creep-rupture, and stress-rupture tests of metallic materials. Available from: https://www.astm.org/e0139-06.html.Search in Google Scholar
[32] Ragab, R., J. Parker, M. Li, T. Liu, A. Morris, and W. Sun. Requirements for and challenges in developing improved creep ductility-based constitutive models for tempered martensitic CSEF steels. Journal of Materials Research and Technology, Vol. 17, 2022, pp. 3337–3360.10.1016/j.jmrt.2022.02.047Search in Google Scholar
[33] Monkman, F. C. and N. J. Grant. An empirical relationship between rupture life and minimum creep rate in creep-rupture tests, proc. ASTM., Vol. 56, 1956, pp. 91–103.Search in Google Scholar
[34] Kassner, M. E. Chapter 1 – Fundamentals of creep in materials. In M. E. Kassner, editor, Fundamentals of creep in metals and alloys, 3rd edition, Butterworth-Heinemann, Boston, 2015, pp. 1–6.10.1016/B978-0-08-099427-7.00001-3Search in Google Scholar
[35] Yang, B. and F. Z. Xuan. Creep behavior of subzones in a CrMoV weldment characterized by the in-situ creep test with miniature specimens. Materials Science & Engineering, A: Structural Materials: Properties, Microstructure and Processing, Vol. 723, 2018, pp. 148–156.10.1016/j.msea.2018.03.051Search in Google Scholar
[36] Maruyama, K., K. Sawada, J. Koike, H. Sato, and K. Yagi. Examination of deformation mechanism maps in 2.25Cr–1Mo steel by creep tests at strain rates of 10−11 to 10−6 s−1. Materials Science & Engineering, A: Structural Materials: Properties, Microstructure and Processing, Vol. 224, 1997, pp. 166–172.10.1016/S0921-5093(96)10566-9Search in Google Scholar
[37] Luo, Y., W. Jiang, Y. Zhang, M. Hao, and S. T. Tu. Creep rupture behavior of Hastelloy C276-BNi2 brazed joint. Materials Science & Engineering, A: Structural Materials: Properties, Microstructure and Processing, Vol. 711, 2018, pp. 223–232.10.1016/j.msea.2017.11.033Search in Google Scholar
[38] Guguloth, K., M. Ghosh, J. Swaminathan, and R. Mitra. Tensile creep and rupture behavior along with evolution of microstructure in a Zr–2.5Nb alloy. Materials Science & Engineering, A: Structural Materials: Properties, Microstructure and Processing, Vol. 791, 2020, id. 139681.10.1016/j.msea.2020.139681Search in Google Scholar
[39] Ishikawa, K. and Y. Kobayashi. Creep and rupture behavior of a commercial aluminum–magnesium alloy A5083 at constant applied stress. Materials Science & Engineering, A: Structural Materials: Properties, Microstructure and Processing, Vol. 387–389, 2004, pp. 613–617.10.1016/j.msea.2004.01.099Search in Google Scholar
[40] Haney, E. M., F. Dalle, M. Sauzay, L. Vincent, I. Tournié, L. Allais, et al. Macroscopic results of long-term creep on a modified 9Cr–1Mo steel (T91). Materials Science & Engineering, A: Structural Materials: Properties, Microstructure and Processing, Vol. 510–511, 2009, pp. 99–103.10.1016/j.msea.2008.04.099Search in Google Scholar
[41] Hug, E., C. Keller, J. Favergeon, and K. Dawi. Application of the Monkman–Grant law to the creep fracture of nodular cast irons with various matrix compositions and structures. Materials Science & Engineering, A: Structural Materials: Properties, Microstructure and Processing, Vol. 518, 2009, pp. 65–75.10.1016/j.msea.2009.04.020Search in Google Scholar
[42] Pandey, C., M. M. Mahapatra, P. Kumar, and S. Sirohi. Fracture behaviour of crept P91 welded sample for different post weld heat treatments condition. Engineering Failure Analysis, Vol. 95, 2019, pp. 18–29.10.1016/j.engfailanal.2018.08.029Search in Google Scholar
[43] Ashby, M. F. and B. F. Dyson. Creep damage mechanics and micro-mechanisms. In S. R. Valluri, Taplin, D. M. R., Rao, P. R., Knott, J. F., and Dubey, R., editors, Fracture 84, Pergamon, 1984, pp. 3–30.10.1016/B978-1-4832-8440-8.50017-XSearch in Google Scholar
[44] Wilshire, B. and H. Burt. Damage evolution during creep of steels. International Journal of Pressure Vessels and Piping, Vol. 85, 2008, pp. 47–54.10.1016/j.ijpvp.2007.06.002Search in Google Scholar
[45] Kassner, M. E. and T. A. Hayes. Creep cavitation in metals. International Journal of Plasticity, Vol. 19, 2003, pp. 1715–1748.10.1016/S0749-6419(02)00111-0Search in Google Scholar
[46] Xu, X., J. A. Siefert, J. D. Parker, and R. C. Thomson. Localised creep cavitation on boron nitride in the heat affected zone of 9% Cr tempered martensitic steel welds. Materials & Design, Vol. 196, 2020, id. 109046.10.1016/j.matdes.2020.109046Search in Google Scholar
[47] Laha, K., K. S. Chandravathi, P. Parameswaran, K. B. S. Rao, and S. L. Mannan. Characterization of microstructures across the heat-affected zone of the modified 9Cr–1Mo weld joint to understand its role in promoting type IV cracking. Metallurgical and Materials Transactions A: Physical Metallurgy and Materials Science, Vol. 38, 2007, pp. 58–68.10.1007/s11661-006-9050-0Search in Google Scholar
© 2022 Yan Song et al., published by De Gruyter
This work is licensed under the Creative Commons Attribution 4.0 International License.
Articles in the same Issue
- Review Articles
- State of the art, challenges, and emerging trends: Geopolymer composite reinforced by dispersed steel fibers
- A review on the properties of concrete reinforced with recycled steel fiber from waste tires
- Copper ternary oxides as photocathodes for solar-driven CO2 reduction
- Properties of fresh and hardened self-compacting concrete incorporating rice husk ash: A review
- Basic mechanical and fatigue properties of rubber materials and components for railway vehicles: A literature survey
- Research progress on durability of marine concrete under the combined action of Cl− erosion, carbonation, and dry–wet cycles
- Delivery systems in nanocosmeceuticals
- Study on the preparation process and sintering performance of doped nano-silver paste
- Analysis of the interactions between nonoxide reinforcements and Al–Si–Cu–Mg matrices
- Research Articles
- Study on the influence of structural form and parameters on vibration characteristics of typical ship structures
- Deterioration characteristics of recycled aggregate concrete subjected to coupling effect with salt and frost
- Novel approach to improve shale stability using super-amphiphobic nanoscale materials in water-based drilling fluids and its field application
- Research on the low-frequency multiline spectrum vibration control of offshore platforms
- Multiple wide band gaps in a convex-like holey phononic crystal strip
- Response analysis and optimization of the air spring with epistemic uncertainties
- Molecular dynamics of C–S–H production in graphene oxide environment
- Residual stress relief mechanisms of 2219 Al–Cu alloy by thermal stress relief method
- Characteristics and microstructures of the GFRP waste powder/GGBS-based geopolymer paste and concrete
- Development and performance evaluation of a novel environmentally friendly adsorbent for waste water-based drilling fluids
- Determination of shear stresses in the measurement area of a modified wood sample
- Influence of ettringite on the crack self-repairing of cement-based materials in a hydraulic environment
- Multiple load recognition and fatigue assessment on longitudinal stop of railway freight car
- Synthesis and characterization of nano-SiO2@octadecylbisimidazoline quaternary ammonium salt used as acidizing corrosion inhibitor
- Perforated steel for realizing extraordinary ductility under compression: Testing and finite element modeling
- The influence of oiled fiber, freeze-thawing cycle, and sulfate attack on strain hardening cement-based composites
- Perforated steel block of realizing large ductility under compression: Parametric study and stress–strain modeling
- Study on dynamic viscoelastic constitutive model of nonwater reacted polyurethane grouting materials based on DMA
- Mechanical behavior and mechanism investigation on the optimized and novel bio-inspired nonpneumatic composite tires
- Effect of cooling rate on the microstructure and thermal expansion properties of Al–Mn–Fe alloy
- Research on process optimization and rapid prediction method of thermal vibration stress relief for 2219 aluminum alloy rings
- Failure prevention of seafloor composite pipelines using enhanced strain-based design
- Deterioration of concrete under the coupling action of freeze–thaw cycles and salt solution erosion
- Creep rupture behavior of 2.25Cr1Mo0.25V steel and weld for hydrogenation reactors under different stress levels
- Statistical damage constitutive model for the two-component foaming polymer grouting material
- Nano-structural and nano-constraint behavior of mortar containing silica aggregates
- Influence of recycled clay brick aggregate on the mechanical properties of concrete
- Effect of LDH on the dissolution and adsorption behaviors of sulfate in Portland cement early hydration process
- Comparison of properties of colorless and transparent polyimide films using various diamine monomers
- Study in the parameter influence on underwater acoustic radiation characteristics of cylindrical shells
- Experimental study on basic mechanical properties of recycled steel fiber reinforced concrete
- Dynamic characteristic analysis of acoustic black hole in typical raft structure
- A semi-analytical method for dynamic analysis of a rectangular plate with general boundary conditions based on FSDT
- Research on modification of mechanical properties of recycled aggregate concrete by replacing sand with graphite tailings
- Dynamic response of Voronoi structures with gradient perpendicular to the impact direction
- Deposition mechanisms and characteristics of nano-modified multimodal Cr3C2–NiCr coatings sprayed by HVOF
- Effect of excitation type on vibration characteristics of typical ship grillage structure
- Study on the nanoscale mechanical properties of graphene oxide–enhanced shear resisting cement
- Experimental investigation on static compressive toughness of steel fiber rubber concrete
- Study on the stress field concentration at the tip of elliptical cracks
- Corrosion resistance of 6061-T6 aluminium alloy and its feasibility of near-surface reinforcements in concrete structure
- Effect of the synthesis method on the MnCo2O4 towards the photocatalytic production of H2
- Experimental study of the shear strength criterion of rock structural plane based on three-dimensional surface description
- Evaluation of wear and corrosion properties of FSWed aluminum alloy plates of AA2020-T4 with heat treatment under different aging periods
- Thermal–mechanical coupling deformation difference analysis for the flexspline of a harmonic drive
- Frost resistance of fiber-reinforced self-compacting recycled concrete
- High-temperature treated TiO2 modified with 3-aminopropyltriethoxysilane as photoactive nanomaterials
- Effect of nano Al2O3 particles on the mechanical and wear properties of Al/Al2O3 composites manufactured via ARB
- Co3O4 nanoparticles embedded in electrospun carbon nanofibers as free-standing nanocomposite electrodes as highly sensitive enzyme-free glucose biosensors
- Effect of freeze–thaw cycles on deformation properties of deep foundation pit supported by pile-anchor in Harbin
- Temperature-porosity-dependent elastic modulus model for metallic materials
- Effect of diffusion on interfacial properties of polyurethane-modified asphalt–aggregate using molecular dynamic simulation
- Experimental study on comprehensive improvement of shear strength and erosion resistance of yellow mud in Qiang Village
- A novel method for low-cost and rapid preparation of nanoporous phenolic aerogels and its performance regulation mechanism
- In situ bow reduction during sublimation growth of cubic silicon carbide
- Adhesion behaviour of 3D printed polyamide–carbon fibre composite filament
- An experimental investigation and machine learning-based prediction for seismic performance of steel tubular column filled with recycled aggregate concrete
- Effects of rare earth metals on microstructure, mechanical properties, and pitting corrosion of 27% Cr hyper duplex stainless steel
- Application research of acoustic black hole in floating raft vibration isolation system
- Multi-objective parametric optimization on the EDM machining of hybrid SiCp/Grp/aluminum nanocomposites using Non-dominating Sorting Genetic Algorithm (NSGA-II): Fabrication and microstructural characterizations
- Estimating of cutting force and surface roughness in turning of GFRP composites with different orientation angles using artificial neural network
- Displacement recovery and energy dissipation of crimped NiTi SMA fibers during cyclic pullout tests