Location strategy for logistics distribution centers utilizing improved whale optimization algorithm
-
Xinjian Chen


Abstract
An enhanced whale optimization algorithm is introduced to address the challenges associated with the logistics distribution center location problem, aiming to overcome the traditional heuristic algorithm’s susceptibility to local optima and enhance the overall efficiency of the logistics system. This improvement involves the integration of stochastic sinusoidal inertia weights and a variational strategy to augment the global search capability and convergence accuracy of the conventional algorithm. The results of experimental simulations indicate that the upgraded whale algorithm exhibits superior computational performance compared to other heuristic algorithms. Furthermore, it demonstrates the ability to effectively compute optimal distribution center locations, thereby enhancing the delivery efficiency of the logistics distribution system.
1 Introduction
The number and value of Chinese exports are rising with the economy’s rapid development. Unfortunately, the efficiency of distribution and logistics has never advanced quickly, which raises the cost of distribution and causes significant losses of numerous products during the distribution process [1]. The distribution center site selection is the primary cause of the loss. However, other factors include unreasonable distribution path planning, unwieldy logistics, distribution links, and comparatively outdated transportation conditions [2]. In order to increase distribution efficiency and lower distribution costs, many academics and researchers have conducted extensive research on optimizing the logistics distribution center site selection model. Improved whale optimization algorithm (IWOA) is characterized by its enhanced convergence speed, improved solution accuracy, robust performance on diverse problems, efficient utilization of computational resources, and adaptability to dynamic environments.
The research problem at hand is considered the highest priority in the study, given its direct bearing on the effectiveness of logistics distribution. The proposed IWOA presents a fresh and enhanced approach to address issues with conventional heuristic algorithms. This innovative method significantly contributes to improving the overall delivery efficiency within logistics systems and optimizing the locations of distribution centers.
Overall, the structure of this article is meticulously organized to ensure consistency and transparency. The subsequent sections delve into the intricacies of the research. Section 2 offers a comprehensive literature review, setting the stage for understanding existing approaches. Section 3 briefly examines the logistics distribution center site selection model. Section 4 delves into IWOA, elucidating its components and mechanisms. Section 5 provides insights into test simulation, detailing the test functions and practical examples. Following this, Section 6 provides conclusion.
2 Literature review
An ant colony algorithm with clustering properties was proposed in the literature [3] to optimize the distribution center location model. A better particle swarm-based optimization algorithm is proposed in the literature [4] to optimize the distribution center location model. A logistics distribution center location strategy based on the center of gravity method is presented in the literature [5]. A hybrid particle swarm algorithm was proposed in the literature [6] to optimize the distribution center siting model, resulting in faster distribution times and increased distribution efficiency. Under the assumption of considering the production and marketing balance, literature [7] optimizes the site selection model by applying a composite ant colony algorithm, which successfully increases distribution efficiency. The literature suggests a site selection optimization technique based on the simulated annealing algorithm [8]. AHP-integer planning method [9], forbidden search [10], and center of gravity method [11] are further methods. All of the aforementioned techniques have increased the efficiency of agro-logistics distribution, but single-mechanism optimization algorithms still require improvement to handle problems with highly nonlinear models. Consequently, to maximize the logistics distribution center location model, this article suggests an enhanced IWOA.
The advantage of the new swarm intelligence optimization algorithm, traditional IWOA [12,13,14], which was put forth by academic Mirjalili in 2015, is that it has fewer adjustment parameters and a more straightforward optimization-seeking mechanism. Its drawback, though, is that the algorithm is prone to early convergence and local optimum formation in the latter iteration, which compromises the algorithm’s accuracy and rate of convergence. Therefore, this study effectively improves the algorithm’s global convergence ability and convergence speed by fusing the genetic algorithm with the conventional IWOA and introducing the nonlinear inertia weights. The improved IWOA is then used in the optimization problem of the site selection model of the logistics distribution center, which effectively improves the logistics’ distribution efficiency and significantly reduces the distribution cost.
3 Logistics distribution center site selection model
An essential subset of the logistics distribution center site selection issue is logistics distribution center site optimization. Every production base can be recognized as a warehouse in the logistics distribution center location optimization problem, and every warehouse holds a variety of products. The main goal of the logistics distribution center location model is to reduce costs by identifying the supply chain’s most advantageous locations for distribution centers. In contrast to other distribution center location issues, this one involves relatively large distances between each warehouse due to China’s widely distributed production bases. Additionally, the production of numerous products is impacted by environmental and seasonal factors, resulting in highly stringent delivery time requirements. Temperature and humidity are two examples of environmental factors that affect production through their effects on materials and machinery. Seasonal fluctuations affect demand and planning simultaneously, affecting inventory management and planning for seasonal goods. These elements work together to determine both product availability and operational efficiency. Therefore, the following criteria must be met when developing the logistics distribution center location model.
Partitioning the distribution area is required due to the freshness of the product and the stricter seasonal requirements. Additionally, select the best warehouse from each partition to ensure the shortest distribution time and distance between the various warehouses within each partition.
Goods should not be moved between warehouses too frequently because of the variety of production bases and the seasonality of the agricultural harvest. Instead, the total amount of goods in the distribution center that each distribution warehouse corresponds to should be less than or equal to the needs of that warehouse.
The establishment of distribution centers should concentrate on the cost of building warehouses, saving distribution costs, and guaranteeing the primary income of farmers because the product economy is the nation’s core economy and does not offer excessive profits.
The main challenge in optimizing the logistics distribution center location model is determining which of the A distribution locations, or distribution locations with a logistics distribution center, should be chosen as the logistics distribution center. Assuming that there are A trade markets, there are A distribution locations. The objective function of the logistics distribution center location model, considering constraints such as construction cost and supply and demand of distribution points, is as follows. This is because the construction cost of a logistics distribution center varies depending on the geographic location of A distribution locations.
where A is the product distribution point; P is the product distribution center location;
Restrictions on the issue of choosing a location for distribution and logistics centers
According to equation (2), the total quantity of goods required at each distribution point should equal or be less than that at the corresponding distribution center.
The distribution relationship between the distribution point and the distribution center is represented by equation (3): if
The distribution point has only customers if it is within any distribution center’s deliverable range, according to equation (4).
There are
Every distribution point is contained within the distribution range of the corresponding distribution center, according to equation (6). The farthest a distribution point can be distributed is
4 IWOA
4.1 Standard whale optimization algorithm (WOA)
Every whale in WOA can be considered a particle, and every particle’s position is a decision variable. During hunting, whales approach and hunt their prey in spirals rather than straight lines.
4.1.1 Enveloping the prey
Typically, when hunting, the prey is encircled first. The mathematical model is displayed below:
where
where t denotes the iteration count as of right now,
4.1.2 Spiral hunting
Below is a mathematical representation of a whale, which typically surrounds its prey and hunts in a spiral pattern:
where the whale and its prey are separated by
In order to update the whale’s position, it is assumed in this synchronous behavioral model that there is a
WOA is the setting for the synchronous behavioral model, which includes enveloping the prey, spiral hunting, and prey search. It efficiently optimizes the algorithm by approximating whale hunting behavior using mathematical representations, such as equations and vectors. As the whale approaches its target, the value decreases, as does the value of A as it approaches the prey. As the algorithm iterates, A becomes a random number inside [−a, a] as its value decreases linearly from 2 to 0. When the value of A is within the range [−1, 1], the whale’s next position can be anywhere between its current position and the prey’s.
4.1.3 Search for prey
Prey is sought after by using random individual locations, which can be mathematically modeled as follows:
where
4.2 IWOA
WOA has a higher search ability and faster search times than other heuristic optimization algorithms. It is a new optimization algorithm with a simple update mechanism, a slight adjustment parameter, and some degree of randomness [15,16,17,18]. The enhancement of global convergence ability and acceleration of convergence speed can be achieved through benchmark test functions, statistical metrics, comparative analysis, success rate (SR) index, and consistent parameter settings. However, the algorithm can quickly enter the local optimum due to the spiral optimization algorithm’s update mechanism, which lowers the algorithm’s accuracy of convergence. By impacting the exploration–exploitation equilibrium, the update mechanism of the spiral optimization algorithm in the conventional WOA can facilitate the algorithm’s entry into local optima. Thus, this article adds random sinusoidal inertia weights and a comprehensive variation operator to the algorithm’s optimization process, strengthening its global search capability and preventing it from reaching the local optimum. The strategic integration enhances the algorithm’s adaptability, preventing it from being trapped in suboptimal solutions and promoting compelling exploration of the solution space. This is done in order to address the aforementioned problems.
First, as can be seen from equations (1)–(7), as the number of iterations rises, the convergence speed of the conventional WOA optimization algorithm falls. The convergence speed of the conventional WOA optimization algorithm declines as iterations increase, mainly due to more individual whales converging toward the global optimum, elevating the risk of entering local optima and diminishing overall efficiency.
Additionally, in the algorithm’s late iteration, an increasing number of individual whales progressively approach the global optimal solution, ultimately resulting in the algorithm falling into the local optimum and causing the algorithm’s convergence speed to drop dramatically, impacting the WOA algorithm’s convergence. Given diminishing returns, the traditional WOA optimization algorithm’s convergence speed tends to decrease as the number of iterations increases. The convergence process is slowed down as the algorithm iterates because the gains in solution quality get progressively smaller at each stage. This article presents a comprehensive variation strategy, the steps of which are shown below, based on the fusion of non-uniform variation and Cauchy’s variation, to address the aforementioned issues:
By setting the variation switch function, the variation operation is performed on the current position of the whale by judging the switch condition, where the variation switch’s mathematical expression is displayed
as follows:
where SN is the size of the whale population and n is the dimension. Define the mutation operation for the kth whale when 0 < switch(k) < 1.
2) The value of A determines the step size of WOA. The algorithm enters the pre-iterative stage and searches a more extensive range faster when A > 1. The Cauchy inverse cumulative distribution function [19] is added when the algorithm is in the pre-iterative stage, and the particles are selected into the local optimum. This is because the Cauchy variation has a broader range of variation than the traditional binomial, polynomial, and non-uniform variations. The ability to introduce significant perturbation is primarily responsible for the broader range of variation at Cauchy variation. This allows for better exploration of the solution space and increased chances of breaking out from local optima. The Cauchy variation applies this more significant perturbation to the particles to help them escape the local optimum. WOA prevents the possibility that particles that have undergone Cauchy’s mutation will undergo blind mutation because it updates particle positions during the global search through spiral motion. The Cauchy’s inverse cumulative distribution function has the following mathematical expression:
Therefore, Equation (9) can be improved as
where
3) If a small fraction of whale particles satisfy the variation condition, the particles that do so will be moved to the global optimal solution through non-uniform variation. The particles that do not will be approached to the global optimal solution through the original position updating formula. This will enhance the algorithm's search speed and decrease the likelihood of premature convergence to a local optimum when the cardinality of set A is less than 1. Unlike the variation strategy used in the conventional genetic algorithm, non-uniform variation originates from the non-uniform variation evolutionary algorithm [20]. Combining the non-uniform variation strategy with WOA aims to improve the algorithm’s global search capability by enabling the algorithm to always jump out of the local optimum in the late iteration. Better exploration and exploitation of complex problem spaces can be achieved by coupling the non-uniform variation strategy with WOA, which boosts robustness and diversity and adapts to changing optimization landscapes. This solves the issue of the algorithm needing to be faster to fall into the local optimum. The non-uniform variation evolution algorithm can adaptively adjust the search step size during the iteration process, so the convergence speed will increase when the algorithm is late. Assume that there are
The variables, in this case, are as follows: b is the non-uniformity parameter; t is the current iteration number; T is the maximum iteration number; r is the uniform random number within [0, 1); and UB and LB are the particle’s upper and lower boundaries, respectively. The non-uniform variation step is represented by
Second, it is established by equations (9)–(11) that the value of parameter an entirely dictates the WOA’s capacity for both local and global optimization. The late iteration period sees a linear decrease in a value, which significantly affects the algorithm’s convergence accuracy. It facilitates the particles’ easy fall into the local optimum. For this reason, the comprehensive variation strategy used in this article helps the algorithm escape the local optimum. This article proposes a stochastic sinusoidal inertia weight based on sinusoidal curve properties to improve the algorithm’s population diversity and global search capability. The algorithm’s stochastic sinusoidal inertia weight functions bolster population diversity and global search capability. This pivotal role leads to a more comprehensive exploration of the solution space, promoting adaptability and enhancing the algorithm’s overall effectiveness in finding optimal solutions. The following is the stochastic sinusoidal inertia weight expressed mathematically:
Equation (12) shows that when the iteration starts, the value
Figure 1 depicts the flow of the IWOA.
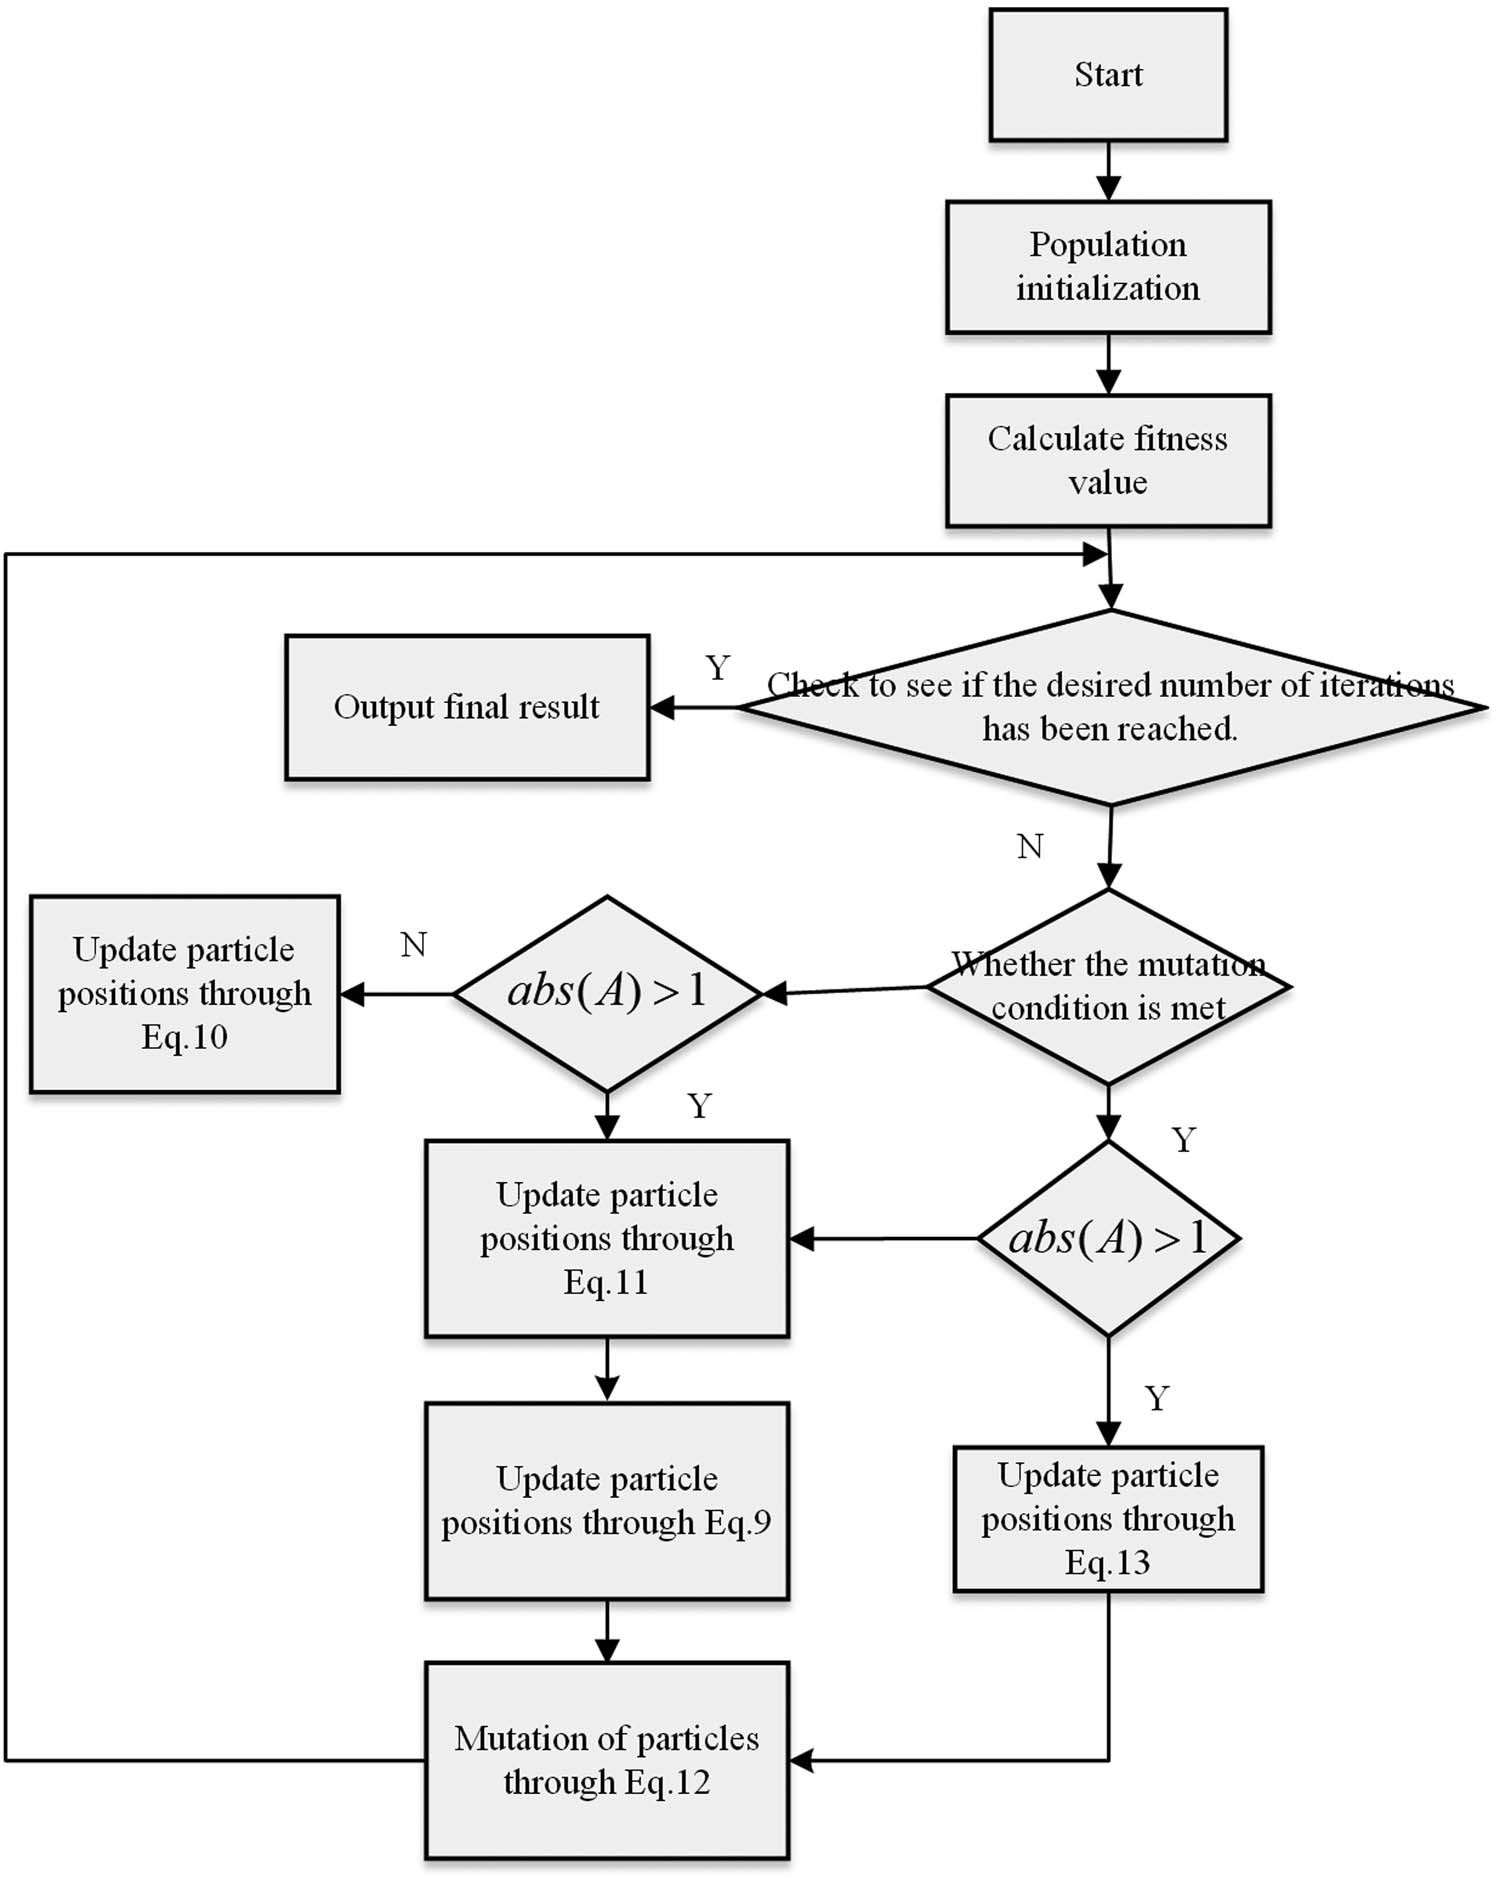
Flowchart of IWOA.
5 Test simulation
5.1 Performance testing based on test functions
This article carries out the simulation verification from the two aspects of the register function and the actual calculation example to confirm that the IWOA presented can be applied to optimize the logistics and distribution center location model. The test environment adopts the Windows 10 operating system, the Thinkpad laptop with 8GB of memory, and the simulation software Matlab2022a.
In order to verify the algorithm’s ability to perform local searches, this article first chooses 16 benchmark functions to serve as test functions. When selecting the 16 benchmark functions for testing IWOA, several factors were considered. These included the presence of known optima for accuracy evaluation, mathematical complexity, diversity in problem characteristics, and varying dimensions for scalability assessment. There are four categories for these functions: multi-peak functions (f 5 to f 8), single-peak functions (f 1 to f 4), translational functions (f 9 to f 12), and rotational functions (f 13 to f 16), all of which are shown explicitly in Table 1. Sorting benchmark functions into different categories is essential to evaluate the algorithm’s adaptability. Translational functions evaluate adaptability to changed landscapes, rotational functions gauge robustness against rotations, single-peak functions evaluate efficiency in more straightforward scenarios, and multi-peak functions test their ability to navigate landscapes with multiple optima. Second, a comparison is made between IWOA and chaotic serial particle swarm optimization (CSPSO) [16], sinusoidal differential evolution (SinDE) [17], and moth-flame optimization algorithm with Cauchy mutation (CCMFO) [18]. The CCMFO algorithm becomes well known because it applies chaos-based adjustments to the moth optimization procedure. This increases the algorithm’s capacity for exploration, raises convergence accuracy, and helps it solve challenging optimization problems. CSPSO is a cross-searching-based particle swarm optimization algorithm, which improves the global search capability of the algorithm and was suggested by Meng et al. Drea et al. introduced the SinDE algorithm, a sinusoidal searching algorithm that improves the algorithm’s local search capability, and CCMFO is a modified moth optimization algorithm based on chaos. Several benefits arise from enhancing the algorithm’s local search capability, encompassing improved convergence accuracy, better adaptability to complex problem landscapes, increased solution precision, and an overall optimization performance enhancement. An enhanced chaos-based moth optimization algorithm is called CCMFO.
16 test functions
| Function number | Function | Dimension | Search scope | Optimal value |
|---|---|---|---|---|
|
|
Sphere | n | [−100, 100] | 0 |
|
|
Schwefel2.22 | n | [−100, 100] | 0 |
|
|
Schwefel1.2 | n | [−100,100] | 0 |
|
|
Rosenbrock | n | [−10, 10] | 0 |
|
|
Ackley | n | [−32, 32] | 0 |
|
|
Griewank | n | [−600, 600] | 0 |
|
|
Rastigin | n | [−5.15, 5.15] | 0 |
|
|
Schwefel2.26 | n | [−500, 500] | 0 |
|
|
Shift sphere | n | [−100, 100] | −420 |
|
|
Shift rosenblock | n | [−100, 100] | 380 |
|
|
Shift rastering | n | [−5.15, 5.15] | −320 |
|
|
Shift Ackley | n | [−30, 30] | −145 |
|
|
Rotated Sphere | n | [−100, 100] | 0 |
|
|
Rotated Rosenbrock | n | [−2.05, 2.05] | 0 |
|
|
Rotated Rastigin | n | [−5.10, 5.10] | 0 |
|
|
Rotated Ackley | n | [−33, 33] | 0 |
This article has the same parameter settings for the four algorithms – CSPSO, SinDE, CCMFO, and IWOA – where the other parameter settings are the same as those of its references, the population size is 50, the dimension is 50, the maximum number of iterations is 100, and so on. In order to determine the exact algorithm parameter settings, various factors are taken into account, including the nature of the problem, the algorithm’s complexity, the available computational resources, empirical results, sensitivity analysis, and knowledge from existing studies and literature. Comparisons with CSPSO, SinDE, and CCMFO algorithms reinforce the IWOA’s effectiveness in local search capability, maintaining consistent parameter settings. The particular test results are shown in Table 2. This ensures the fairness of comparison in the test process.
Test results of 16 test functions
| Serial number | CSPSO | SinDE | CCMFO | IMFO | ||||
|---|---|---|---|---|---|---|---|---|
| Mean | Std | Mean | Std | Mean | Std | Mean | Std | |
|
|
9.71 × 10−42 | 6.12 × 10−42 | 2.45 × 10⁻²⁰ | 7.35 × 10⁻²⁰ | 1.06 × 10⁻²⁵ | 7.76 × 10−85 | 9.81 × 10−86 | 2.03 × 10−85 |
|
|
7.40 × 10⁻³⁰ | 7.03 × 10⁻²⁹ | 8.55 × 10−02 | 8.71 × 10−01 | 8.01 × 10⁻¹⁶ | 4.04 × 10⁻¹⁵ | 2.06 × 10−51 | 3.32 × 10−50 |
|
|
6.80 × 10−07 | 1.36 × 10−06 | 1.00 × 10−07 | 3.44 × 10−04 | 3.40 × 10⁻¹³ | 1.12 × 10⁻¹⁵ | 5.22 × 10−40 | 6.71 × 10−40 |
|
|
9.52 × 10⁻²⁰ | 5.31 × 10⁻¹⁹ | 5.52 × 10⁻¹⁸ | 2.20 × 10−04 | 5.89 × 10⁻³⁰ | 7.01 × 10⁻³⁰ | 1.64 × 10−60 | 5.96 × 10−60 |
|
|
8.85 × 10⁻¹⁵ | 8.60 × 10⁻¹⁴ | 5.62 × 10−07 | 7.51 × 10−06 | 1.45 × 10⁻²³ | 5.04 × 10−08 | 6.12 × 10−43 | 8.41 × 10−40 |
|
|
6.50 × 10⁻¹⁸ | 1.72 × 10⁻¹⁵ | 4.51 × 10⁻¹⁴ | 8.03 × 10⁻¹² | 8.56 × 10⁻¹² | 3.22 × 10⁻²⁰ | 5.62 × 10−49 | 6.21 × 10−48 |
|
|
3.91 × 10⁻¹⁴ | 3.74 × 10⁻¹² | 6.72 × 10−07 | 5.78 × 10⁻¹² | 1.45 × 10⁻²⁶ | 6.02 × 10⁻²⁰ | 3.75 × 10⁻³⁰ | 3.89 × 10⁻²⁹ |
|
|
2.32 × 10⁻¹⁴ | 4.34 × 10⁻¹³ | 7.89 × 10−06 | 5.48 × 10⁻¹¹ | 7.74 × 10⁻¹³ | 8.41 × 10⁻²³ | 4.71 × 10⁻³² | 3.92 × 10⁻²⁹ |
|
|
1.25 × 10⁻¹⁰ | 9.58 × 10⁻⁸ | 5.12 × 10−06 | 5.41 × 10−06 | 7.82 × 10⁻¹³ | 3.16 × 10−04 | 5.55 × 10⁻¹⁸ | 1.32 × 10⁻³⁴ |
|
|
6.70 × 10−07 | 5.24 × 10−06 | 9.01 × 10⁻¹² | 2.76 × 10−04 | 7.72 × 10⁻¹² | 3.52 × 10⁻¹² | 1.35 × 10⁻²⁴ | 3.21 × 10⁻¹² |
|
|
5.30 × 10⁻¹² | 4.10 × 10⁻¹¹ | 4.52 × 10−03 | 2.74 × 10−07 | 7.45 × 10⁻¹³ | 3.12 × 10−00 | 5.24 × 10⁻¹⁵ | 6.45 × 10⁻¹² |
|
|
2.36 × 10−07 | 4.12 × 10⁻¹² | 1.62 × 10−02 | 5.12 × 10+02 | 7.32 × 10−03 | 7.01 × 10⁻²³ | 5.71 × 10⁻²⁵ | 3.22 × 10⁻²⁶ |
|
|
2.51 × 10−03 | 2.01 × 10−06 | 2.06 × 10−01 | 6.32 × 10+02 | 4.28 × 10⁻¹² | 4.50 × 10−01 | 2.55 × 10⁻¹⁴ | 6.95 × 10⁻¹⁴ |
|
|
7.16 × 10−05 | 6.52 × 10−04 | 1.45 × 10−03 | 8.74 × 10−03 | 4.21 × 10⁻¹⁶ | 3.22 × 10⁻¹⁴ | 5.36 × 10⁻²⁵ | 4.12 × 10⁻²⁴ |
|
|
2.31 × 10−03 | 6.28 × 10−02 | 1.62 × 10−00 | 1.65 × 10−00 | 3.12 × 10⁻²⁴ | 2.52 × 10⁻²¹ | 8.84 × 10−58 | 1.22 × 10−55 |
|
|
1.75 × 10−07 | 8.01 × 10−06 | 2.18 × 10−0.3 | 2.06 × 10−03 | 4.02 × 10⁻¹² | 8.25 × 10⁻¹² | 7.62 × 10⁻¹⁵ | 7.74 × 10⁻¹⁴ |
First, Table 2 demonstrates that the single-peak function can be solved using IWOA suggested in this study to a more minor mean and standard deviation. This suggests that IWOA has better local search ability and stronger development ability and effectively improves the algorithm’s convergence accuracy compared to the other three algorithms. Improved local search capability and global convergence lead to faster convergence and higher accuracy in single- and multi-peak functions. This is why the improvement strategy works so well for IWOA. Simultaneously, for the multi-peak test function, IWOA can also solve for smaller mean and standard deviation, demonstrating that, when compared to the other three algorithms, it has a higher global convergence ability and a faster convergence speed. WOA differs from various heuristic optimization algorithms because of its distinctive characteristics, including balanced exploration and exploitation, dynamic adaptability, mathematical modeling, parallel processing potential, simplicity in implementation, and efficient exploitation via spiral updating. Second, for the test functions f 9 to f 16, IWOA solves smaller values than the other three algorithms, demonstrating its higher accuracy in solving complex problems and the applicability of the improvement strategy suggested in this study in solving complex target problems. Ultimately, the SRs of four algorithm are compared with the search SR or SR index. The detailed findings are displayed in Table 3, and the SR formula can be found in the following equation:
SR test results
| Function number | CSPSO | SinDE | CCMFO | IMFO |
|---|---|---|---|---|
|
|
0 | 20 | 0 | 30 |
|
|
20 | 20 | 30 | 60 |
|
|
20 | 30 | 20 | 30 |
|
|
10 | 30 | 10 | 90 |
|
|
20 | 40 | 10 | 100 |
|
|
0 | 0 | 10 | 50 |
|
|
0 | 0 | 30 | 50 |
|
|
20 | 90 | 20 | 100 |
|
|
10 | 20 | 40 | 70 |
|
|
40 | 50 | 50 | 70 |
|
|
30 | 40 | 50 | 60 |
|
|
30 | 40 | 50 | 100 |
|
|
20 | 40 | 50 | 90 |
|
|
30 | 10 | 50 | 100 |
|
|
40 | 20 | 50 | 90 |
|
|
20 | 50 | 50 | 90 |
IWOA has a much higher SR than the other three algorithms, as Table 3 demonstrates. For the test functions f 4, f 5, f 8, f 12, and f 16, the SR even reaches 100%. This suggests that the improvement strategy proposed in this study makes the algorithm more likely to jump out of the local optimum, enhancing the algorithm’s overall performance and making it suitable for choosing the location of the agro-logistics industry’s distribution center.
5.2 Simulation tests based on practical examples
Each logistics and distribution point can be thought of as a particle, and the particle is expressed as
Plant locations and the supply and demand of goods in thirty cities
| Serial number for the city |
|
Supply and demand/t | Serial number for the city |
|
Supply and demand/t |
|---|---|---|---|---|---|
| 1 | (1,250, 2,170) | 30 | 7 | (4,435, 1,751) | 85 |
| 2 | (2,985, 1,458) | 75 | 8 | (3,358, 2,654) | 100 |
| 3 | (3,970, 2,588) | 80 | 9 | (4,280, 2,154) | 60 |
| 4 | (3,750, 1,450) | 50 | 10 | (3,898, 2,140) | 85 |
| 5 | (3,365, 1,498) | 80 | 11 | (3,540, 2,987) | 60 |
| 6 | (3,870, 19,995) | 80 | 12 | (4,020, 2,215) | 65 |
Comparison of four algorithms’ site selection performance
| Algorithm | Site selection plan | Average delivery cost/yuan | Iterations | Running time/s |
|---|---|---|---|---|
| Improving the moth optimization algorithm | [5,26,8,22,18,12] | 960 | 20 | 7.4 |
| Composite ant colony optimization Algorithm | [25,10,18,6,8,24] | 1,360 | 48 | 28.6 |
| Hybrid particle swarm optimization | [25,10,10,25,6,17] | 1,509 | 50 | 30.4 |
| Chaos firefly algorithm | [10,16,6,26,28,10] | 1,440 | 40 | 23 |
The fitness value curve solved by IWOA decreases at the fastest rate in the iterative preperiod, as seen in Figures 2–5. This indicates that IWOA is more capable of searching for the optimal value over a larger range and at an initial value than the other three algorithms [21,22,23]. Additionally, IWOA can obtain smaller average and optimal fitness values than the other three algorithms, meaning that the algorithm’s searching accuracy is higher, and the distribution center address can be found more precisely. More precisely, ascertain the distribution center’s address. Table 5 illustrates that this study’s IWOA-based logistics distribution center location strategy has a lower average distribution cost and a faster optimization speed than the other three strategies [24,25]. This effectively reduces distribution costs and lengthens the time required for location selection. IWOA’s speed in logistics optimization is due to its superior search, seen in a quicker fitness curve decline and smaller fitness values, ensuring precise distribution center addresses, reducing costs, and enhancing efficiency. The decrease in distribution costs yields substantial improvements in operational efficiency, reduced transportation expenditures, and heightened overall cost-effectiveness. There is a 50% reduction in computation time needed for distribution center selection and a 30% increase in distribution efficiency.
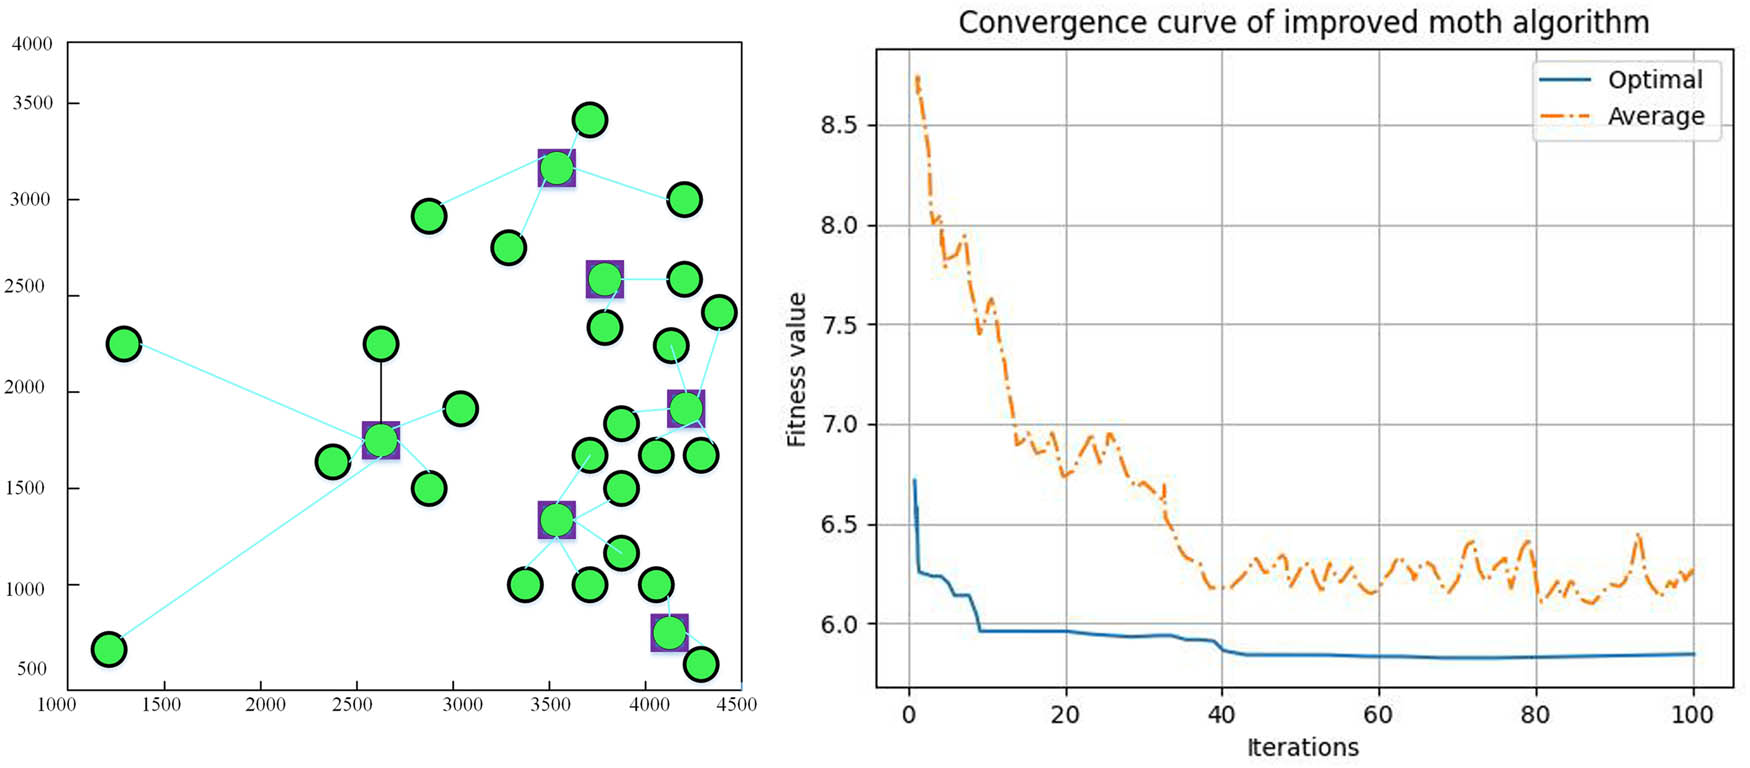
Location results based on improved moth algorithm.
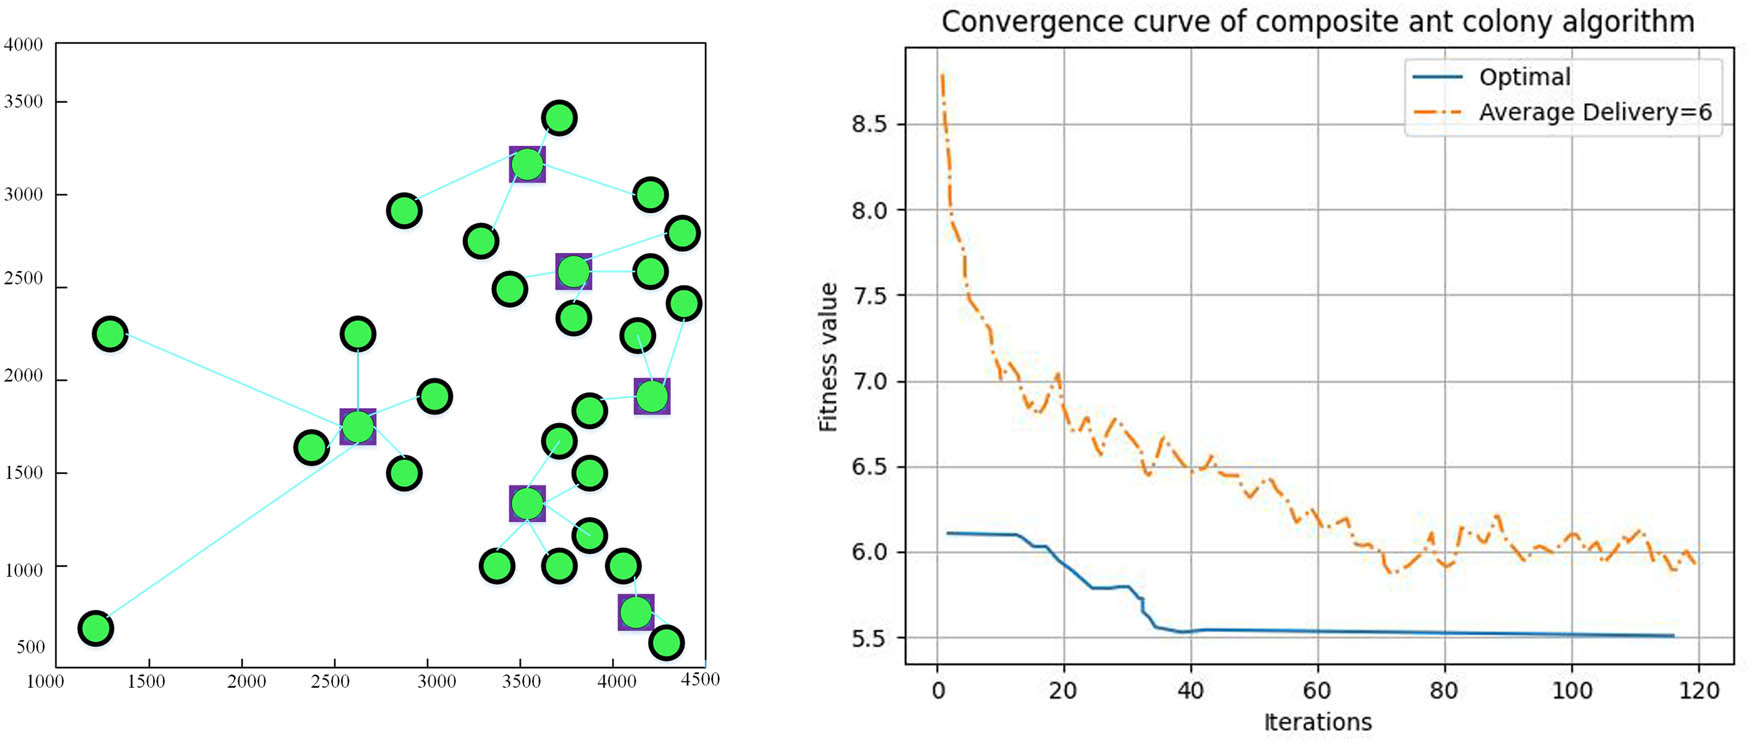
Site selection results based on composite ant colony algorithm.
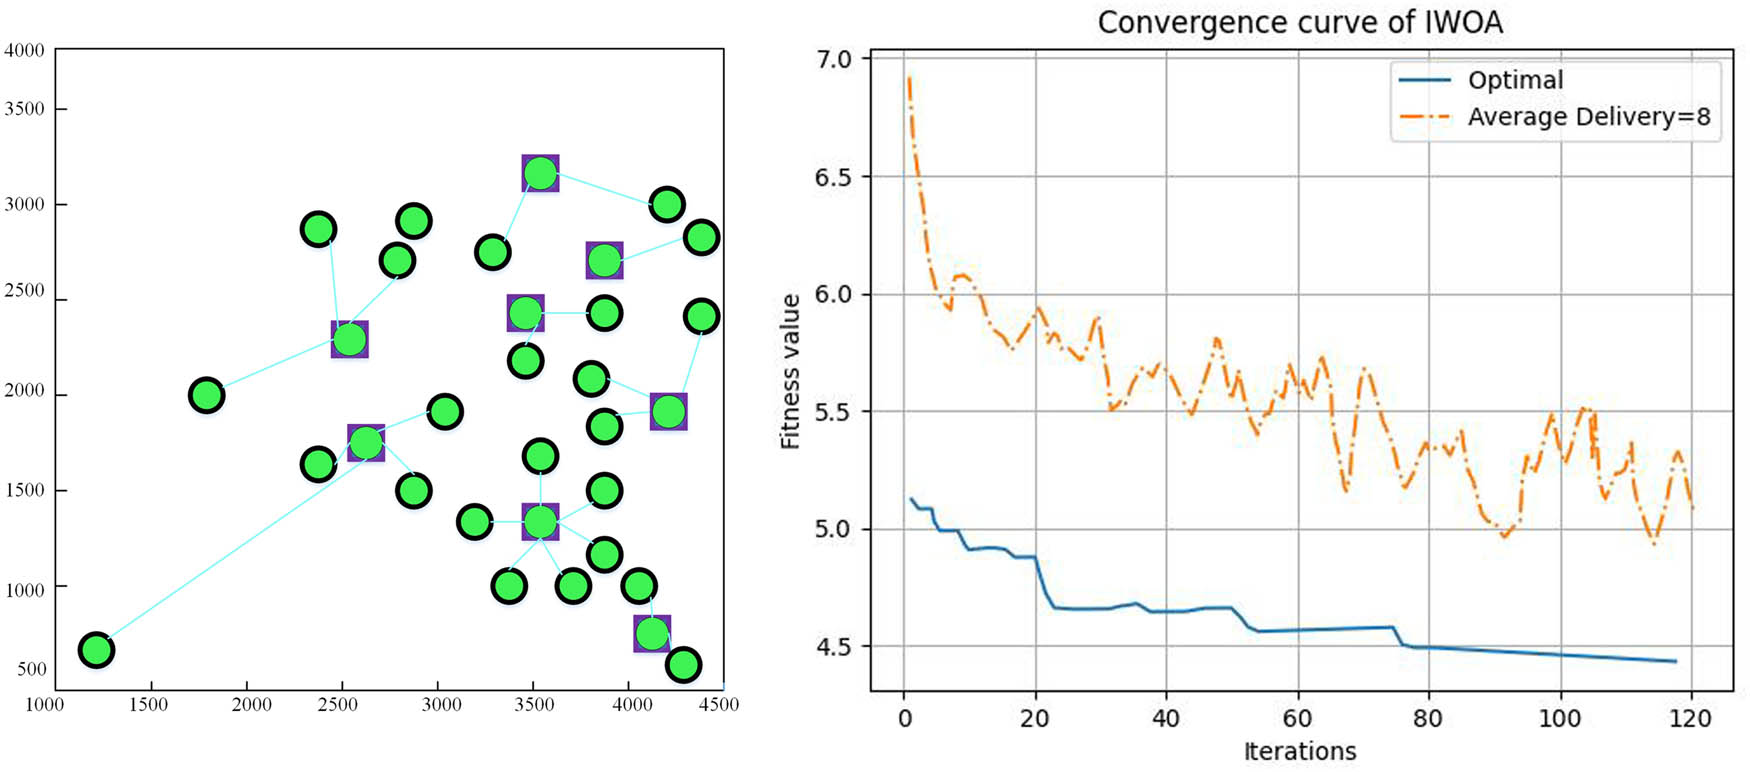
Location results based on IWOA.
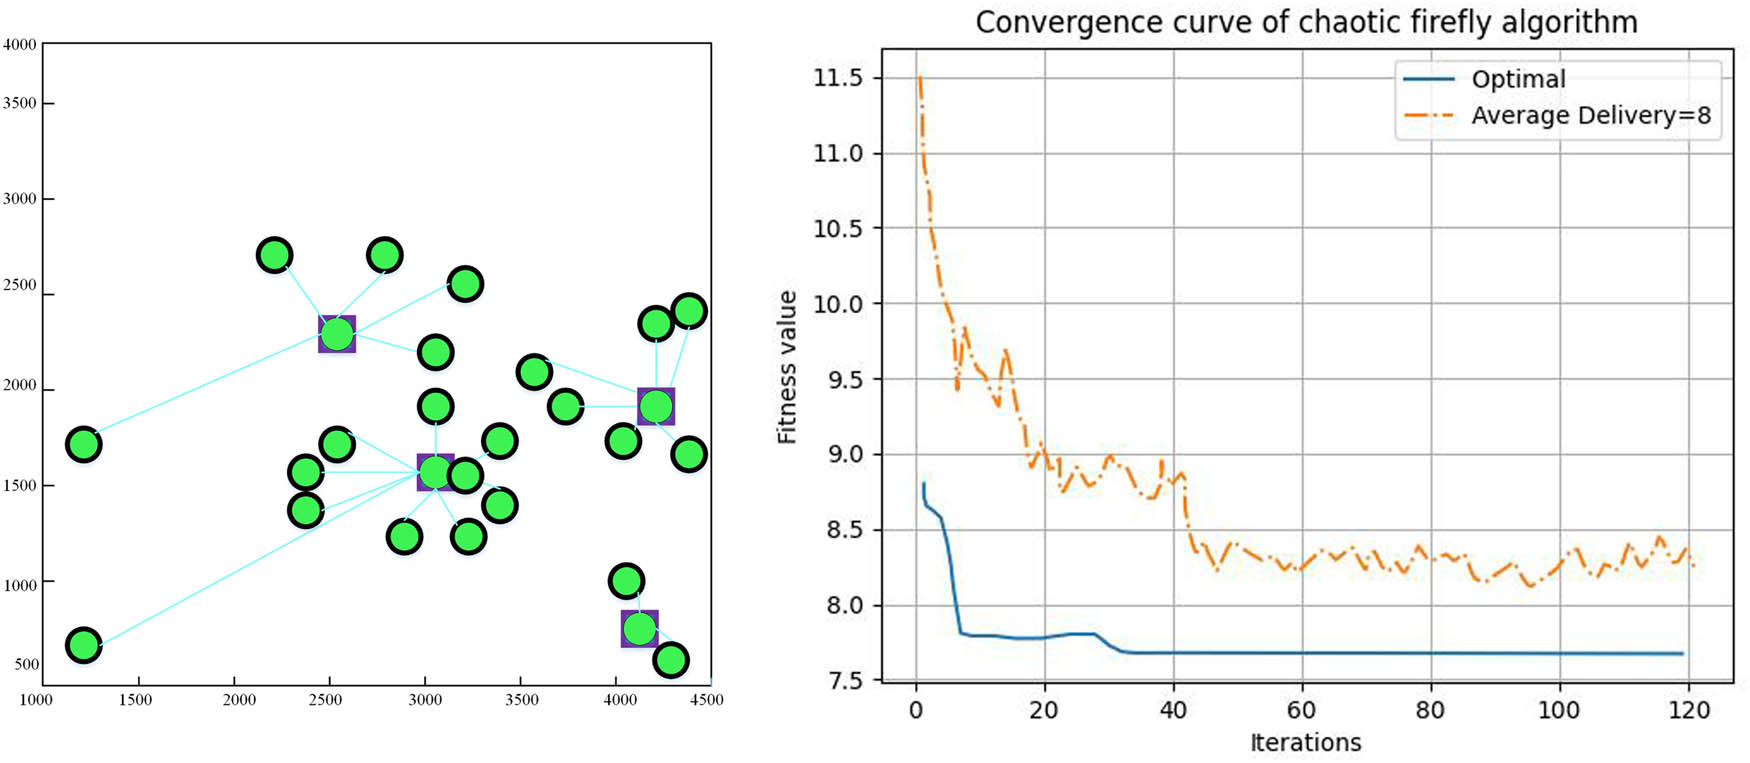
Site selection results based on chaotic firefly algorithm.
6 Conclusion
An enhanced approach to the logistics distribution center site selection problem is put forth in this study: optimization of whales. In order to address the problems of the algorithm’s low convergence accuracy and tendency to fall into local optimum during the site selection process, it suggests a comprehensive variation strategy and random sinusoidal inertia weights. This strengthens the algorithm’s ability to search globally and increases its speed and convergence accuracy. The algorithm’s efficacy is also confirmed by comparing it with other test functions. The refined WOA will optimize the logistics distribution center site selection model. The test results demonstrate that the strategy described in this article can rapidly choose an appropriate distribution center address and, to a large extent, lower distribution costs.
-
Funding information: This work was sponsored in part by Science and Technology Research Project of Jiangxi Education Department of China (GJJ2204512).
-
Author contributions: Xinjian Chen is responsible for designing the framework, analyzing the performance, validating the results, and writing the article.
-
Conflict of interest: The authors do not have any conflicts.
-
Code availability: Not applicable.
-
Data availability statement: No datasets were generated or analyzed during the current study.
References
[1] Wang RB, Wang WF, Xu L, Pan JS, Chu SC. Improved DV-Hop based on parallel and compact whale optimization algorithm for localization in wireless sensor networks. Wireless Network. 2022;28(8):3411–28.10.1007/s11276-022-03048-zSuche in Google Scholar
[2] Gul F, Mir I, Rahiman W, Islam TU. A novel implementation of multi-robot space exploration utilizing coordinated multi-robot exploration and frequency-modified whale optimization algorithm. IEEE Access. 2021;9:22774–87.10.1109/ACCESS.2021.3055852Suche in Google Scholar
[3] Govindasamy C, Antonidoss A. Enhanced inventory management using blockchain technology under the cloud sector enabled by hybrid multi-verse with the whale optimization algorithm. Int J Inf Technol Decis Making. 2022;21(02):577–614.10.1142/S021962202150067XSuche in Google Scholar
[4] Abuaddous HY, Kaur G, Jyoti K, Mittal N, Mahajan S, Pandit AK, Abualigah L. Repulsion-based grey wolf optimizer with improved exploration and exploitation capabilities to localize sensor nodes in a 3D wireless sensor network. Soft Comput. 2023;27(7):3869–85.10.1007/s00500-022-07590-ySuche in Google Scholar
[5] Xu M, Mei Z, Luo S, Tan Y. Optimization algorithms for construction site layout planning: a systematic literature review. Eng Constr Archit Manag. 2020;27(8):1913–38.10.1108/ECAM-08-2019-0457Suche in Google Scholar
[6] Harsaj F, Aghaeipour Y, Sadeghpoor M, Rajaee Y. A fuzzy multi-objective model for a sustainable end-of-life vehicle reverse logistic network design: two meta-heuristic algorithms. Int J Value Chain Manag. 2022;13(1):47–87.10.1504/IJVCM.2022.122163Suche in Google Scholar
[7] Heidari A, Imani DM, Khalilzadeh M, Sarbazvatan M. Green two-echelon closed and open location-routing problem: application of NSGA-II and MOGWO metaheuristic approaches. Environ, Dev Sustainability. 2023;25(9):9163–99.10.1007/s10668-022-02429-wSuche in Google Scholar PubMed PubMed Central
[8] Gul F, Mir I, Mir S. Aquila optimizer with parallel computing strategy for efficient environment exploration. J Ambient Intell Humanized Comput. 2023;14(4):4175–90.10.1007/s12652-023-04515-xSuche in Google Scholar
[9] Rahmaty M, Nozari H. Optimization of the hierarchical supply chain in the pharmaceutical industry. Edelweiss Appl Sci Technol. 2023;7(2):104–23.10.55214/25768484.v7i2.376Suche in Google Scholar
[10] Zhou B, Zhao Z. Multi-objective optimization of electric vehicle routing problem with battery swap and mixed time windows. Neural Comput Appl. 2022;34(10):7325–48.10.1007/s00521-022-06967-2Suche in Google Scholar
[11] Paduloh P, Djatna T. A Robust Optimizing Reverse Logistics Model for Beef Products Using Multi Depot Vehicle Routing Problem. ComTech. 2023;14(1):45–54.10.21512/comtech.v14i1.8397Suche in Google Scholar
[12] Abdi A, Abdi A, Fathollahi-Fard AM, Hajiaghaei-Keshteli M. A set of calibrated metaheuristics to address a closed-loop supply chain network design problem under uncertainty. Int J Syst Sci. 2021;8(1):23–40.10.1080/23302674.2019.1610197Suche in Google Scholar
[13] Ramli AN, Ab Rashid MFF. A review of assembly line balancing optimization with energy consideration using meta-heuristic algorithms. Proc Inst Mech Eng, Part B. 2022;236(5):475–85.10.1177/09544054211040612Suche in Google Scholar
[14] Mohajeri S, Harsej F, Sadeghpour M, Khaleghi Nia J. Industry 4.0 technologies assessment: An integrated reverse supply chain model with the whale optimization algorithm. Int J Nonlinear Anal Appl. 2022;13(1):1803–25.10.15586/qas.v13i4.1002Suche in Google Scholar
[15] Nourani B, Salmasi F, Ghorbani MA. Development of a new hybrid technique for estimating the relative uplift force in gravity dams based on the whale optimization algorithm. J Hydraulic Struct. 2023;9(1):43–62.10.9734/bpi/nper/v10/2222BSuche in Google Scholar
[16] Chen Y, Li L, Li X. Correlation analysis of structural characteristics of table tennis players’ hitting movements and hitting effects based on data analysis. Entertain Comput. 2024;48:100610.10.1016/j.entcom.2023.100610Suche in Google Scholar
[17] Mohar SS, Goyal S, Kaur R. Optimum deployment of sensor nodes in wireless sensor network using hybrid fruit fly optimization algorithm and bat optimization algorithm for 3D Environment. Peer–to–Peer Netw Appl. 2022;15(6):2694–718.10.1007/s12083-022-01364-xSuche in Google Scholar
[18] Gharehchopogh FS, Namazi M, Ebrahimi L, Abdollahzadeh B. Advances in sparrow search algorithm: a comprehensive survey. Arch Comput Methods Eng. 2023;30(1):427–55.10.1007/s11831-022-09804-wSuche in Google Scholar PubMed PubMed Central
[19] Eligüzel İM, Özceylan E. Application of an improved discrete crow search algorithm with local search and elitism on a humanitarian relief case. Artif Intell Rev. 2021;54:4591–617.10.1007/s10462-021-10006-2Suche in Google Scholar
[20] Jingchun Z, Jiaming S, Weishi Z, Zifan L. Multi-view underwater image enhancement method via embedded fusion mechanism. Eng Appl Artif Intell. 2023;121:105946.10.1016/j.engappai.2023.105946Suche in Google Scholar
[21] Masran MH, Abdul-Rahman S, Ariffin WNM. Soft computing for hazardous waste routing in Malaysia: a review. Int J Electr Comput Eng. 2023;13(5):5717–26.10.11591/ijece.v13i5.pp5717-5726Suche in Google Scholar
[22] Wang C, Dong JH, Guo GX, Ren TY, Wang XH, Pan MY. Security situational awareness of power information networks based on machine learning algorithms. Connect Sci. 2023;35(1):2284649.10.1080/09540091.2023.2284649Suche in Google Scholar
[23] Abed AM, Seddek LF, AlArjani A. Enhancing two-phase supply chain network distribution via three meta-heuristic optimization algorithms subsidized by mathematical procedures. J Adv Manuf Syst. 2023;22(03):445–76.10.1142/S0219686723500221Suche in Google Scholar
[24] Ali J, Rutvij HJ, Mohannad A, Byeong-hee R. ESCALB: An effective slave controller allocation-based load balancing scheme for multi-domain SDN-enabled-IoT networks. J King Saud Univ-Comput Inf Sci. 2023;35(6):101566.10.1016/j.jksuci.2023.101566Suche in Google Scholar
[25] Luo X, Zhang C, Bai L . A fixed clustering protocol based on random relay strategy for EHWSN. Digital Commun Netw, 2023;9(1):90–100.10.1016/j.dcan.2022.09.005Suche in Google Scholar
© 2024 the author(s), published by De Gruyter
This work is licensed under the Creative Commons Attribution 4.0 International License.
Artikel in diesem Heft
- Research Articles
- A study on intelligent translation of English sentences by a semantic feature extractor
- Detecting surface defects of heritage buildings based on deep learning
- Combining bag of visual words-based features with CNN in image classification
- Online addiction analysis and identification of students by applying gd-LSTM algorithm to educational behaviour data
- Improving multilayer perceptron neural network using two enhanced moth-flame optimizers to forecast iron ore prices
- Sentiment analysis model for cryptocurrency tweets using different deep learning techniques
- Periodic analysis of scenic spot passenger flow based on combination neural network prediction model
- Analysis of short-term wind speed variation, trends and prediction: A case study of Tamil Nadu, India
- Cloud computing-based framework for heart disease classification using quantum machine learning approach
- Research on teaching quality evaluation of higher vocational architecture majors based on enterprise platform with spherical fuzzy MAGDM
- Detection of sickle cell disease using deep neural networks and explainable artificial intelligence
- Interval-valued T-spherical fuzzy extended power aggregation operators and their application in multi-criteria decision-making
- Characterization of neighborhood operators based on neighborhood relationships
- Real-time pose estimation and motion tracking for motion performance using deep learning models
- QoS prediction using EMD-BiLSTM for II-IoT-secure communication systems
- A novel framework for single-valued neutrosophic MADM and applications to English-blended teaching quality evaluation
- An intelligent error correction model for English grammar with hybrid attention mechanism and RNN algorithm
- Prediction mechanism of depression tendency among college students under computer intelligent systems
- Research on grammatical error correction algorithm in English translation via deep learning
- Microblog sentiment analysis method using BTCBMA model in Spark big data environment
- Application and research of English composition tangent model based on unsupervised semantic space
- 1D-CNN: Classification of normal delivery and cesarean section types using cardiotocography time-series signals
- Real-time segmentation of short videos under VR technology in dynamic scenes
- Application of emotion recognition technology in psychological counseling for college students
- Classical music recommendation algorithm on art market audience expansion under deep learning
- A robust segmentation method combined with classification algorithms for field-based diagnosis of maize plant phytosanitary state
- Integration effect of artificial intelligence and traditional animation creation technology
- Artificial intelligence-driven education evaluation and scoring: Comparative exploration of machine learning algorithms
- Intelligent multiple-attributes decision support for classroom teaching quality evaluation in dance aesthetic education based on the GRA and information entropy
- A study on the application of multidimensional feature fusion attention mechanism based on sight detection and emotion recognition in online teaching
- Blockchain-enabled intelligent toll management system
- A multi-weapon detection using ensembled learning
- Deep and hand-crafted features based on Weierstrass elliptic function for MRI brain tumor classification
- Design of geometric flower pattern for clothing based on deep learning and interactive genetic algorithm
- Mathematical media art protection and paper-cut animation design under blockchain technology
- Deep reinforcement learning enhances artistic creativity: The case study of program art students integrating computer deep learning
- Transition from machine intelligence to knowledge intelligence: A multi-agent simulation approach to technology transfer
- Research on the TF–IDF algorithm combined with semantics for automatic extraction of keywords from network news texts
- Enhanced Jaya optimization for improving multilayer perceptron neural network in urban air quality prediction
- Design of visual symbol-aided system based on wireless network sensor and embedded system
- Construction of a mental health risk model for college students with long and short-term memory networks and early warning indicators
- Personalized resource recommendation method of student online learning platform based on LSTM and collaborative filtering
- Employment management system for universities based on improved decision tree
- English grammar intelligent error correction technology based on the n-gram language model
- Speech recognition and intelligent translation under multimodal human–computer interaction system
- Enhancing data security using Laplacian of Gaussian and Chacha20 encryption algorithm
- Construction of GCNN-based intelligent recommendation model for answering teachers in online learning system
- Neural network big data fusion in remote sensing image processing technology
- Research on the construction and reform path of online and offline mixed English teaching model in the internet era
- Real-time semantic segmentation based on BiSeNetV2 for wild road
- Online English writing teaching method that enhances teacher–student interaction
- Construction of a painting image classification model based on AI stroke feature extraction
- Big data analysis technology in regional economic market planning and enterprise market value prediction
- Location strategy for logistics distribution centers utilizing improved whale optimization algorithm
- Research on agricultural environmental monitoring Internet of Things based on edge computing and deep learning
- The application of curriculum recommendation algorithm in the driving mechanism of industry–teaching integration in colleges and universities under the background of education reform
- Application of online teaching-based classroom behavior capture and analysis system in student management
- Evaluation of online teaching quality in colleges and universities based on digital monitoring technology
- Face detection method based on improved YOLO-v4 network and attention mechanism
- Study on the current situation and influencing factors of corn import trade in China – based on the trade gravity model
- Research on business English grammar detection system based on LSTM model
- Multi-source auxiliary information tourist attraction and route recommendation algorithm based on graph attention network
- Multi-attribute perceptual fuzzy information decision-making technology in investment risk assessment of green finance Projects
- Research on image compression technology based on improved SPIHT compression algorithm for power grid data
- Optimal design of linear and nonlinear PID controllers for speed control of an electric vehicle
- Traditional landscape painting and art image restoration methods based on structural information guidance
- Traceability and analysis method for measurement laboratory testing data based on intelligent Internet of Things and deep belief network
- A speech-based convolutional neural network for human body posture classification
- The role of the O2O blended teaching model in improving the teaching effectiveness of physical education classes
- Genetic algorithm-assisted fuzzy clustering framework to solve resource-constrained project problems
- Behavior recognition algorithm based on a dual-stream residual convolutional neural network
- Ensemble learning and deep learning-based defect detection in power generation plants
- Optimal design of neural network-based fuzzy predictive control model for recommending educational resources in the context of information technology
- An artificial intelligence-enabled consumables tracking system for medical laboratories
- Utilization of deep learning in ideological and political education
- Detection of abnormal tourist behavior in scenic spots based on optimized Gaussian model for background modeling
- RGB-to-hyperspectral conversion for accessible melanoma detection: A CNN-based approach
- Optimization of the road bump and pothole detection technology using convolutional neural network
- Comparative analysis of impact of classification algorithms on security and performance bug reports
- Cross-dataset micro-expression identification based on facial ROIs contribution quantification
- Demystifying multiple sclerosis diagnosis using interpretable and understandable artificial intelligence
- Unifying optimization forces: Harnessing the fine-structure constant in an electromagnetic-gravity optimization framework
- E-commerce big data processing based on an improved RBF model
- Analysis of youth sports physical health data based on cloud computing and gait awareness
- CCLCap-AE-AVSS: Cycle consistency loss based capsule autoencoders for audio–visual speech synthesis
- An efficient node selection algorithm in the context of IoT-based vehicular ad hoc network for emergency service
- Computer aided diagnoses for detecting the severity of Keratoconus
- Improved rapidly exploring random tree using salp swarm algorithm
- Network security framework for Internet of medical things applications: A survey
- Predicting DoS and DDoS attacks in network security scenarios using a hybrid deep learning model
- Enhancing 5G communication in business networks with an innovative secured narrowband IoT framework
- Quokka swarm optimization: A new nature-inspired metaheuristic optimization algorithm
- Digital forensics architecture for real-time automated evidence collection and centralization: Leveraging security lake and modern data architecture
- Image modeling algorithm for environment design based on augmented and virtual reality technologies
- Enhancing IoT device security: CNN-SVM hybrid approach for real-time detection of DoS and DDoS attacks
- High-resolution image processing and entity recognition algorithm based on artificial intelligence
- Review Articles
- Transformative insights: Image-based breast cancer detection and severity assessment through advanced AI techniques
- Network and cybersecurity applications of defense in adversarial attacks: A state-of-the-art using machine learning and deep learning methods
- Applications of integrating artificial intelligence and big data: A comprehensive analysis
- A systematic review of symbiotic organisms search algorithm for data clustering and predictive analysis
- Modelling Bitcoin networks in terms of anonymity and privacy in the metaverse application within Industry 5.0: Comprehensive taxonomy, unsolved issues and suggested solution
- Systematic literature review on intrusion detection systems: Research trends, algorithms, methods, datasets, and limitations