Research on the construction and reform path of online and offline mixed English teaching model in the internet era
-
Ying Lan


Abstract
The Internet era resulted in the rise and advancement of MOOK, WeChat, and mobile networks, making it possible to expand English teaching methods. However, the English teaching industry has the problem of not valuing students’ personalized cognition, and the accuracy of teaching resource delivery is low. Therefore, the research uses the noise gate analysis method to design a cognitive diagnostic model for students and designs an English teaching resource recommendation model in view of a convolutional joint probability matrix (JPM) decomposition algorithm. The research results showed that the cognitive diagnostic model designed in the study had a higher accuracy. Compared to traditional algorithms, the overall recommendation effect of the English teaching resource recommendation model had an average improvement of 11.63% and compared to the JPM algorithm combined with cognitive diagnosis (CD), the overall recommendation effect value had an average improvement of 1.977%. When recommending complex teaching resources, the recommendation effect value had an average improvement of 11.54% compared to traditional algorithms, and the overall average improvement was 1.877% compared to the JPM algorithm combined with CD. In the experimental group, with the assistance of the research algorithm, students’ grades improved by an average of 2.38 points, which was significantly higher than the 0.89 points in the control group. The experiment showcases that the CD and recommendation model designed by the research has higher accuracy, can help improve the efficiency of teaching resource recommendation, reduces teaching costs, and has certain application value.
1 Introduction
The rapid development of Internet technology marks our entry into a brand-new information age, one of the most notable features of which is the massive growth of data and information. In this era, countless data are generated and circulated on the Internet every day from a variety of sources, including text, images, videos, and interactive exchanges. This massive amount of data have not only changed people’s way of life but also profoundly affected the field of education, especially English language teaching (ET) [1]. ET has received the influence of network technology in both vocabulary and grammar, and the online and offline mixed (OOM) ET model has been widely promoted [2,3]. The educational reform in the Internet era (IE) is to combine Internet technology with ET, reform traditional ET models with the help of multi-media teaching means and digital teaching resources (TR), and form a new ET model that adapts to the development of the IE, to improve ET efficiency [4]. However, as far as international education is concerned, ET has not received enough attention, let alone adequate research [5]. Therefore, the aim of this study is to explore and analyze how to innovate and improve the methods and models of ET and learning in such a data-rich environment. The study focuses on building an English OOM teaching model adapted to IE and explores the possibility of combining cognitive diagnosis (CD) and TR recommendation models with Internet technologies. It is hoped that this research will not only improve the teaching effectiveness but also students’ learning efficiency and provide new perspectives and methods for modern English teaching.
2 Related works
In the IE, combining OOM ET with network technology is one of the hot topics studied by scholars. Chowdhury T I proposed a special comparative analysis method to analyze data and design a model of English education. They used a snowball random sampling method to collect data, determine online English education satisfaction, construct a topological structure that perceives the level of online ET, and evaluate the research structure for internal consistency. The research indicated that the data analysis model constructed by the research accurately perceived students’ wishes and enhanced the ET [6]. Huang Y and his team members designed a web-based online ET platform. They used the Internet to design the platform’s hardware and software, used the mean clustering method to cluster learner data on the network, and combined collaborative filtering (CF) algorithms to suggest relevant courses for users. The test indicated that the platform designed by the research had high security, high satisfaction, and fast response [7]. Wang J and other scholars designed a higher education English digital resource library through cloud platform technology and conducted research and analysis on system requirements according to the requirements analysis steps to ensure resource collection and storage. Resource integration and management were achieved through virtualization and distributed storage technology. The simulation results showed that the resource library designed by the research was conducive to achieving resource sharing among multiple platforms and enhancing the utilization rate of English teaching resources (ETR) [8]. Chen W designed a dynamic student English data management system using artificial intelligence computer vision technology, enabling AI archiving and dynamic user access, generating dynamic data processes, managing student data, and comparing it with existing solutions. The simulation results showed that the dynamic student data management system reduced the probability of data loss, had good operational efficiency and reliability, and improved the efficiency of data management in English education [9]. Tang Y and other scholars designed a parallel intelligent artificial education system to collect students’ movement data during English learning and evaluate learning conceptual knowledge through neighborhood classification. It also provided feedback during the learning process, thereby providing students with adaptive instructions and personalized learning services, helping them complete the learning process, and improving learning efficiency [10].
As an important regression analysis method, matrix decomposition is widely used in various model construction. For enhancing the data representation learning tasks, scholars like Sun Y proposed an adaptive graph regularized non-negative matrix (NNM) factorization method based on global constraints, which utilized the self-representation characteristics of data to encode the data representation’s related structure. Combined with the graph decomposition technology, it reduced computational complexity, improved data discrimination and convergence effects, reduced computational model complexity, and improved computational efficiency [11]. To fully characterize heterogeneous network clusters, Zhang B and other scholars presented a joint learning model in view of graph embedding and NNM decomposition. Using graph embedding and potential network structures to simultaneously extract and cluster features, the clustering problem was changed into a constraint optimization problem, and an objective function solution was constructed. Experimental results showed that the joint learning model reduced computational time, accurately revealed structural-functional characteristics, and had good operational efficiency [12]. To improve the accuracy of community structure detection, scholars such as Chang Z proposed a community structure detection algorithm based on NNM factorization, which compared the clustering quality of synthetic networks with real-world networks, analyzed the topology and functions of complex networks, and approximated the maximization of network modules. The experiment illustrated that the improved algorithm reduced network analysis and calculation costs and improved the accuracy of community structure detection [13]. To solve the problem that the maximum margin matrix decomposition is biased towards small sample size analysis, Ravakhah M proposed a hierarchical maximum margin matrix decomposition analysis method, which performed regression analysis based on non-overlapping threshold training data and used an unbalanced tree for rating estimation. The experiment illustrated that the improved analysis method had faster training and testing speed and higher accuracy than traditional analysis methods [14]. To solve the problem of learning feature redundancy in multi-view clustering methods, Cui et al. presented a manifold learning NNM decomposition method based on non-redundant regularization. By minimizing the defined non-redundant regularization factor, using the data manifold structure information manifold regularization factor, analyzing the characteristics of different views, and combining iterative optimization strategies, the redundant information between multiple views was ultimately reduced [15].
Although the above studies have achieved some results in the field of OOM ET, there are still some limitations in data processing and recommendation of TR in the current studies. Moradi and Sharifi’s approach, although capable of constructing a topology that senses the level of online ET, may suffer from inefficiency in dealing with large-scale and complex learning data [16]. Similarly, although Esmaeili et al.’s online ET platform performed well in terms of user experience, there is still room for improvement in accurately recommending personalized TR [17]. Nejad et al.’s digital repository of English in colleges and universities made progress in terms of resource sharing; however, it did not provide adequate solutions in terms of personalized recommendation of resources and assessment of learning effects [18]. In summary, many scholars have attempted to improve students’ English learning efficiency by combining Internet technology. However, with the boost of IE, more extensive and in-depth research is needed to help reform traditional ET models. Therefore, this study uses deterministic input and noise gate models based on time sensitivity to conduct CD for students, Recommending ETR based on the convolutional joint probability matrix (JPM) decomposition model (DM) is expected to help improve learning efficiency and improve the OOM ET model.
3 Construction of OOM English teaching model
3.1 Student CD based on time-sensitive deterministic input, noise, and gate (TDING) model
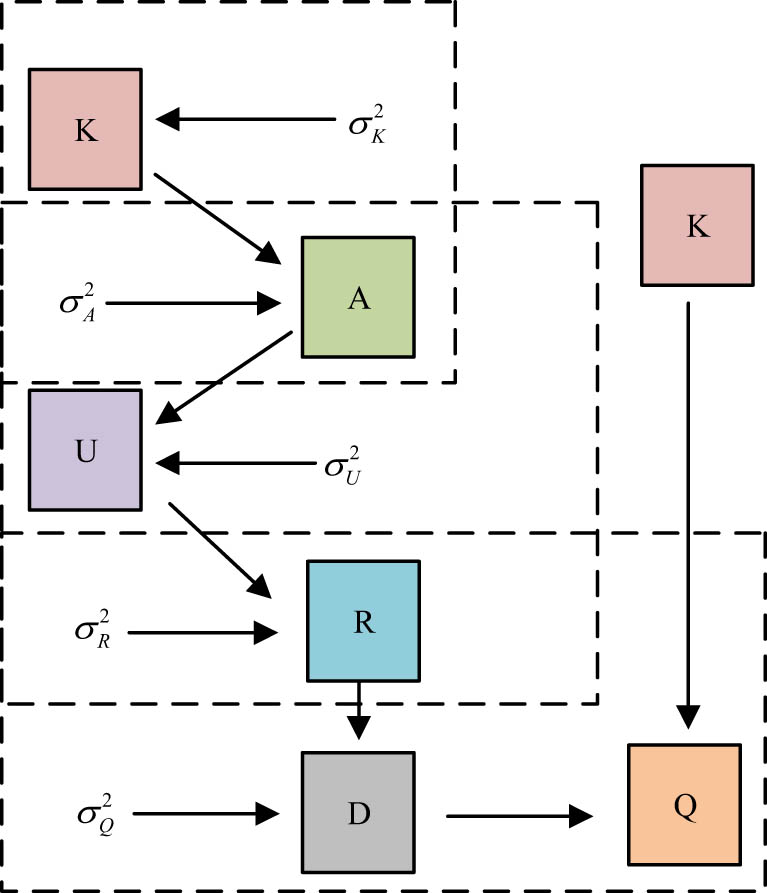
To reform the OOM ET model, it is first necessary to construct an accurate algorithm model to conduct CD for students, understand their mastery of knowledge points (KP), and make personalized resource recommendations. The most widely used cognitive diagnostic model in research is the latent classification model [19,20]. However, the hidden impact factors in the potential classification model are not overall. Hence, this study is based on relevant psychological diagnostic techniques, combined with students’ previous KP, and based on potential classification models, presented a TDING model. Figure 1 indicates the algorithm of the TDING model.
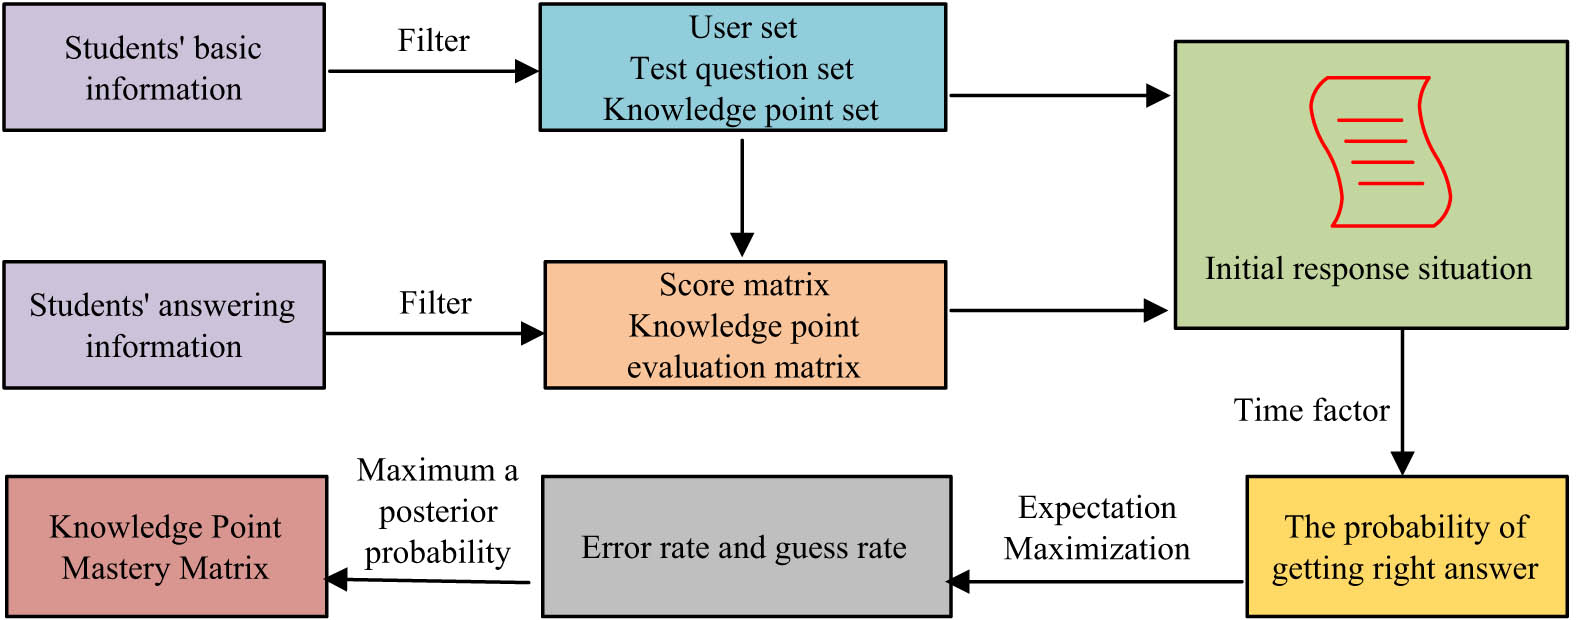
TDING model algorithm flowchart.
The TDING model assumes that the target student is
The KP inspection matrix is constructed by using the KP data labeled by some discipline experts from universities and colleges. The matrix is marked as
Then, each student
where
where
The personalized information of students will affect the positive response rate. Combining formula (5) for obtaining the final positive response rate of students is shown in formula (6).
where
where
where
The MLE of ER and GR obtained by combining the maximum expectation algorithm is shown in formula (10).
where
3.2 Recommendation of TR based on the CUMF model
The research combines intelligent algorithms to personalized recommend ETR for students based on the student CD, improving teaching effectiveness, and promoting the reform of OOM ET models. The study combines a Convolutional Neural Network (CNN) with a cognitive diagnostic model built based on TDING to propose a TR recommendation method in view of the Convolutional Unified Probability Matrix Factorization (CUMF) model. Based on multi-layer deep neural networks, CNN has introduced a more effective feature learning component, making it more capable of feature learning. Specifically, it has introduced local displacement-connected convolutional layers and pooling layers before the original fully connected layer [21,22]. The overall hierarchical structure of CNN is shown in Figure 2.
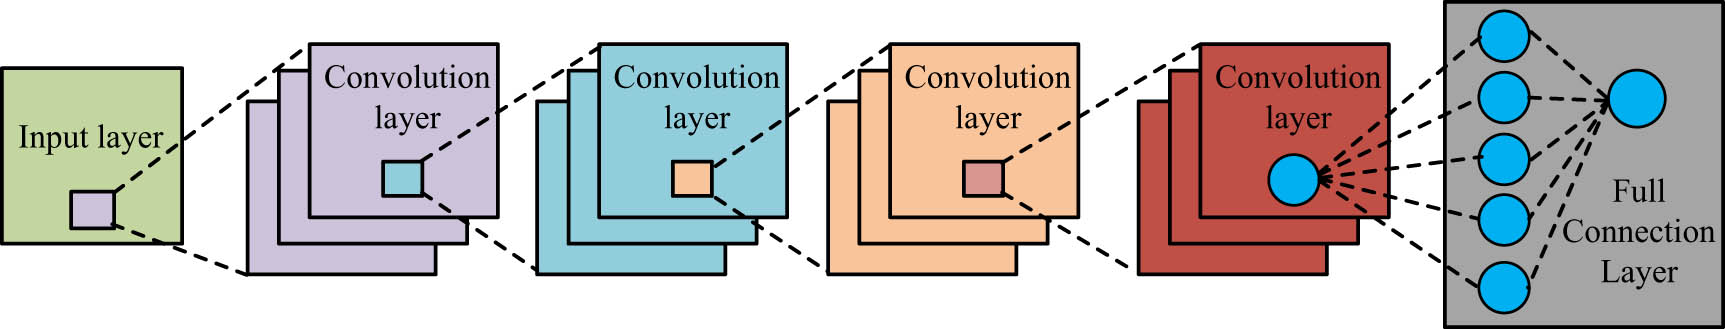
Overall hierarchical structure of CNNs.
The main function of CNN is to reveal the potential features of ETR, obtain implicit feature vectors (IFV) for English tests, and construct implicit feature matrix (IFM) representations of tests with CNN weight parameters for training in JPM DM. The CUMF model combined with the convolutional network is shown in Figure 3.
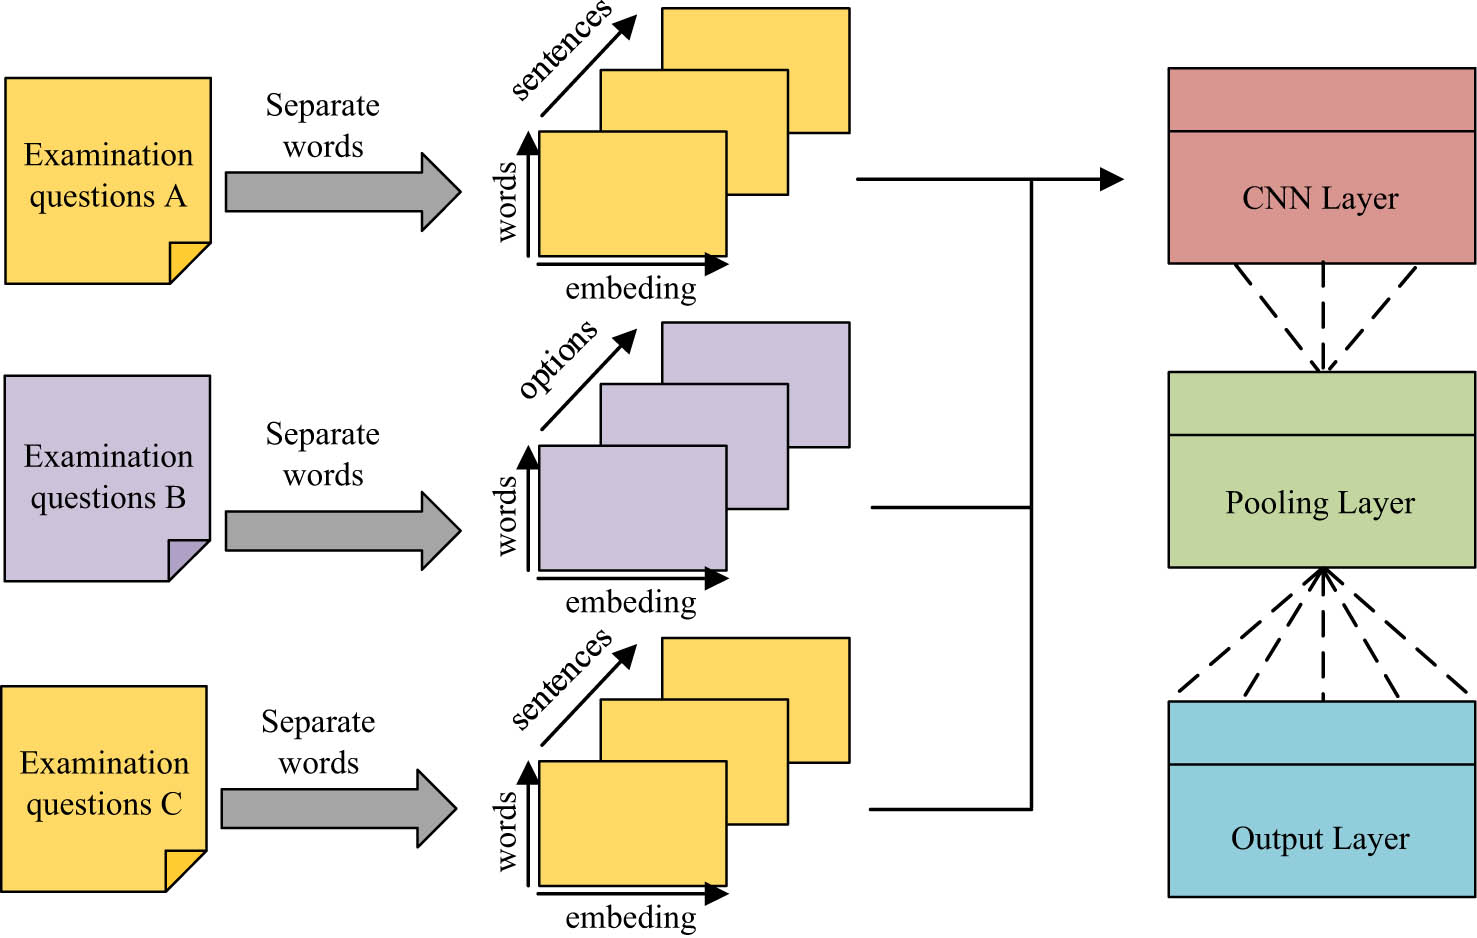
CNN-CUMF model diagram.
CUMF combines factors such as students’ past answers, knowledge levels, mastery of English test sites, and forgetting effects. Meanwhile, it uses CNN to mine ETR, and through non-linear transformation by CNN, it is incorporated into a JPM DM for forecasting student performance. Finally, combined with the related matrix obtained from the TDING model, personalized ETR is recommended to improve students’ learning efficiency and ultimately improve teaching effectiveness. The CUMF recommendation algorithm is shown in Figure 4.
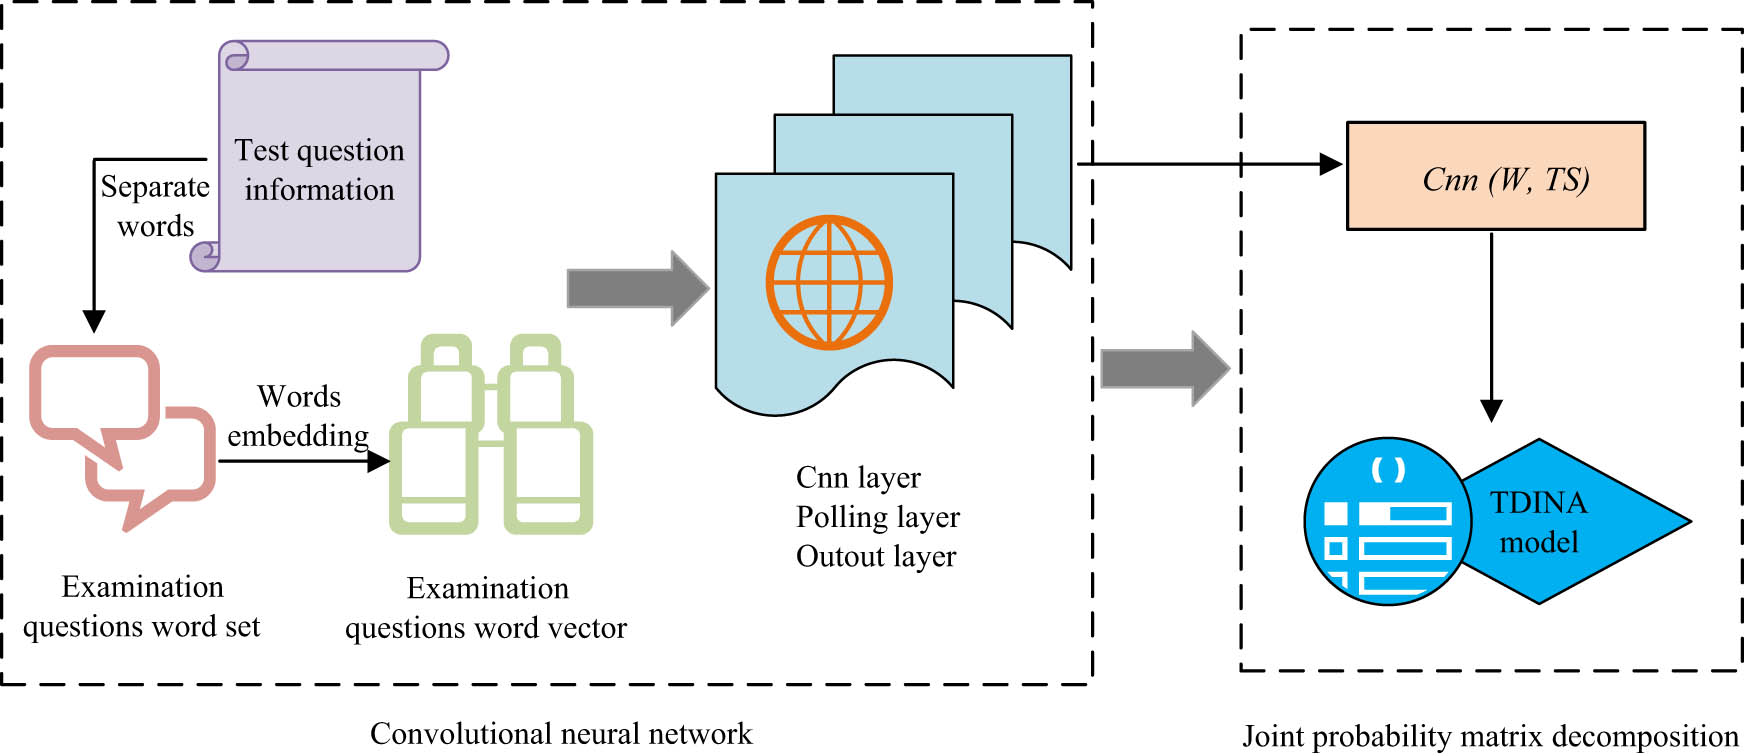
CUMF recommendation algorithm framework.
The CUMF recommendation algorithm framework first filters out exam information based on English students’ response records and then divides the related information into English word sets through word segmentation. Then, the word is transformed into a word vector (WV) through word embedding technology, and the English WV is used as the input of the CNN. Certain transformations related layers obtain the implicit matrix (IM) of the test with CNN and use the IM of the test as the IM parameter in the JPM DM. Last, through the KP mastery matrix from the TDING model, the test KP correlation matrix from specialists, and the test score matrix (TSM) based on the student exam situation, a random gradient descent algorithm is used to obtain each matrix, and these implicit feature matrices are used to obtain the TSM. The implicit matrices’ dot product operation is used to predict students’ performance in testing ETR. Finally, based on students’ cognitive abilities, whether to recommend video TR is chosen. This study combines CNN with a JPM DM, and presents a DM for convolutional joint probability matrices, as shown in Figure 5.
Convolutional JPM DM.
The prior probabilities of initializing implicit feature matrices
where
where
where
where
where
4 Online and offline English learning model simulation test
4.1 Analysis of students’ cognitive diagnostic efficiency
To ensure the effectiveness of OOM ET models and verify the TDING model’s effectiveness proposed in the study in students’ CD, a comparative experiment was conducted between TDING and classical CD methods. Since the test results of different hardware devices may have large differences, the study was conducted in the same experimental environment, which is shown in Table 1.
Experimental environment information
| Name | Configuration |
|---|---|
| Video card | GTX 1080 Ti |
| CPU | Inter(R)Core(TM)i5-7200U |
| GPU-accelerated library | CUDA 10.0 |
| Memory | 64 GB |
| Operating system | Windows 10 |
| Platform | MATLAB R2014a |
The study utilized the publicly available dataset English Language Learner Corpus (ELLC). This dataset is provided by the International Agency for the Teaching of English as a Foreign Language and contains learning data from English learners from different countries and at different stages of learning. The ELLC dataset contains the learning data of more than 10,000 students at different levels of proficiency, ranging from basic to advanced. The data are not only rich in content but also highly diverse and representative because learners come from different countries and cultural backgrounds. The comparative objects include Item Response Theory and Deterministic Inputs, Noise, and Gate (DINA) models. During the experiment, 10, 30, 50, and 70% of the datasets were chosen as test datasets, and commonly utilized evaluation criteria in the industry, namely, Pattern Match Rate (PMR) and Root Mean Square Error (RMSE) indicators, were utilized to detect the modeling effects. PMR is a measure of the predictive accuracy of a model. It evaluates the performance of a model by comparing the similarity between the output patterns predicted by the model and the actual observed data patterns. The higher the PMR value, the better the predictive ability of the model. In cognitive diagnostic models, PMR can effectively reflect the accuracy of the model’s judgment of the learner’s ability level and knowledge mastery and is a key indicator for assessing the effectiveness of the model in actual teaching applications. RMSE is a measure of prediction error. It calculates the square root of the average of the squared values of the differences between the predicted and actual values. The lower the RMSE, the higher the predictive accuracy of the model. The RMSE can visualize the differences between the model predictions and the actual data, which helps to evaluate the accuracy and reliability of the model in detail. The experimental results of different cognitive diagnostic model values under the proportions of each test dataset are shown in Figure 6.
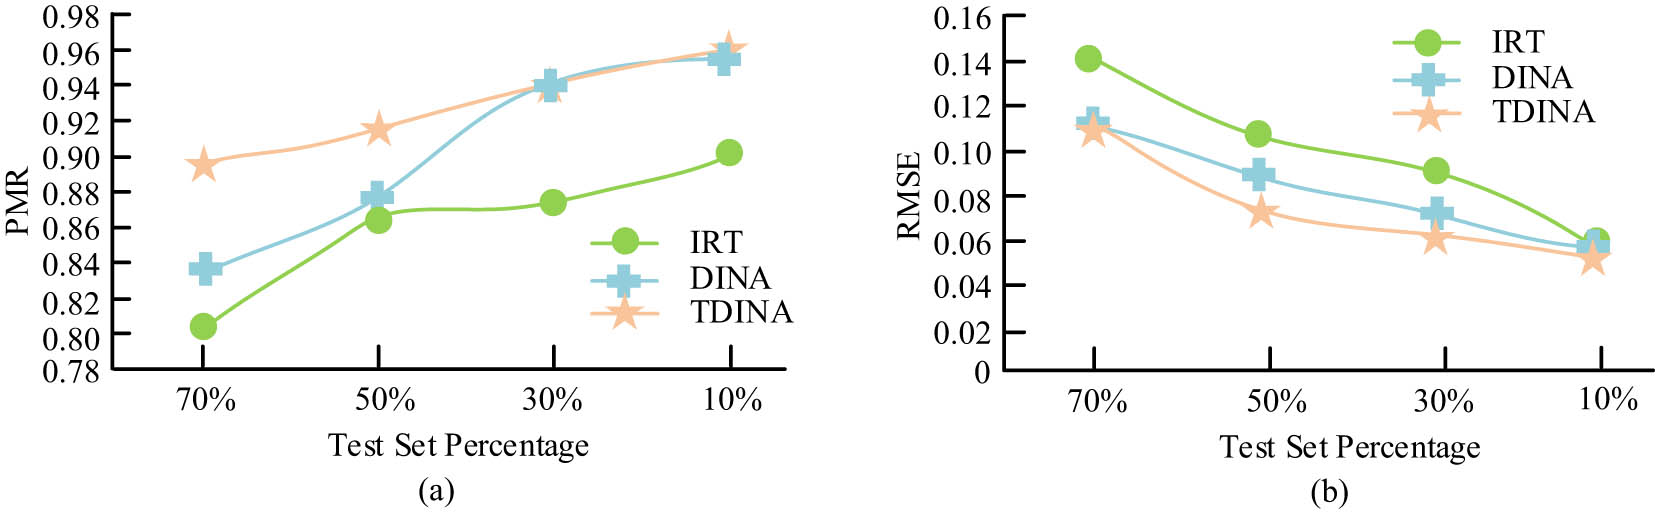
Experimental results of cognitive diagnostic model values. (a) PMR values for each model. (b) RMSE values for each model.
In Figure 6, when modeling students for CD, the PMR value of the TDING model as a whole has increased by 4.664% compared to the other two classical modeling methods, while the RMSE value has decreased by 1.412% compared to the other two modeling methods. The above results indicated that the TDING method significantly enhanced the CD and the diagnostic modeling. To further verify the reliability of the cognitive diagnostic model for students in OOM ET, the study used the Receiver Operation Characteristic Curve (ROC) for estimating the function of the cognitive diagnostic model, as shown in Figure 7.
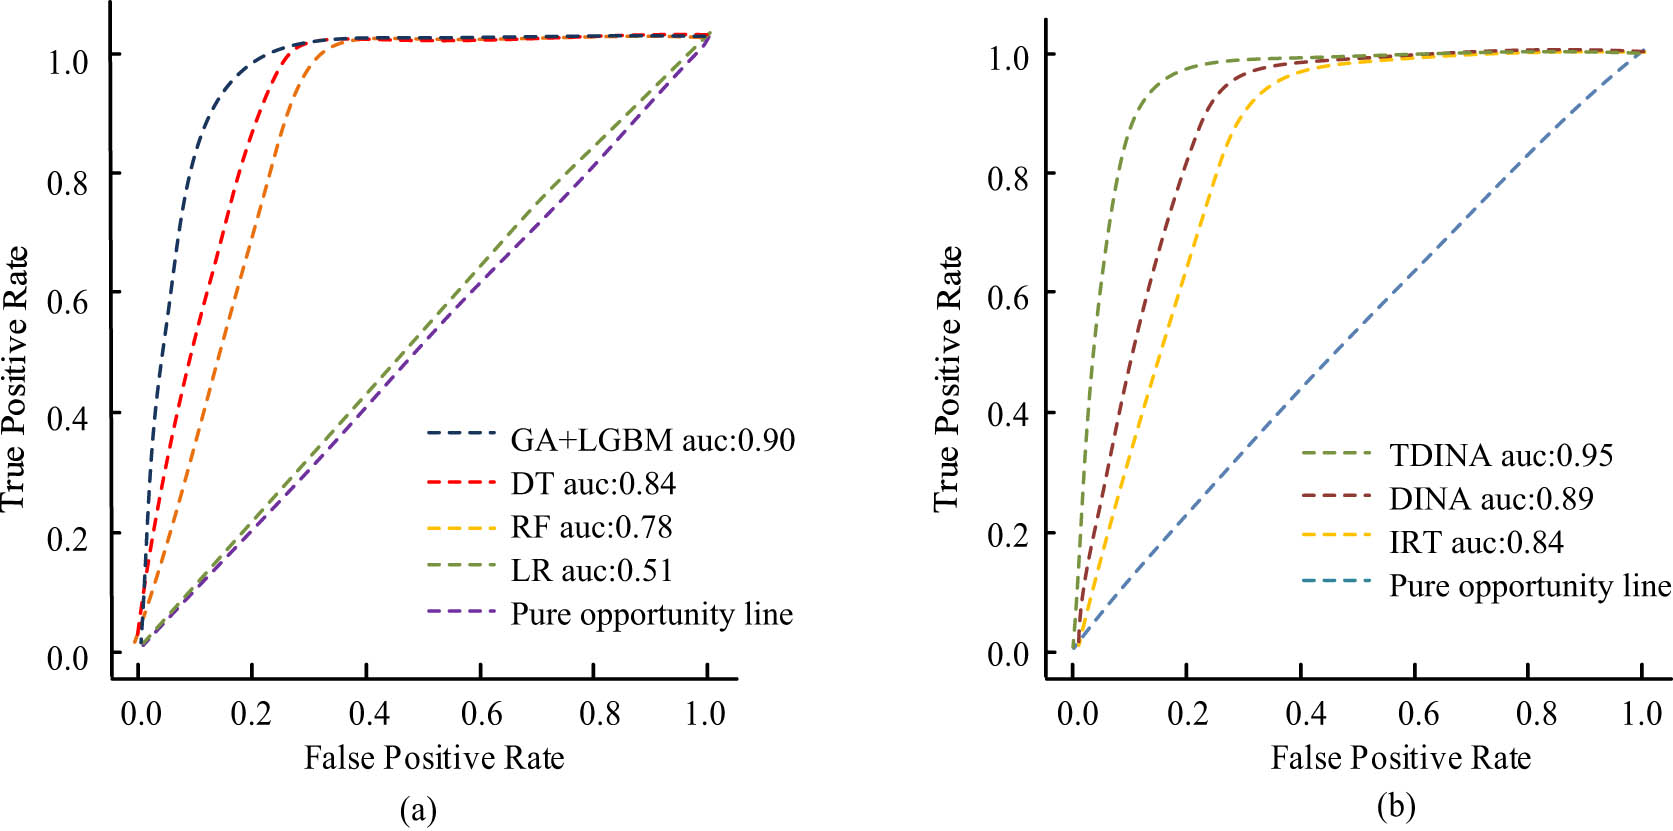
Performance evaluation of cognitive diagnostic models by ROC. (a) ROC curves of course selection probabilities. (b) ROC curves of different algorithms.
The ROC curve is a graphical presentation of the performance of a classification model, which evaluates the model’s classification ability by comparing the True Positive Rate and the False Positive Rate. In the field of CD, the ROC curve helps to determine the efficacy of the model in distinguishing between different cognitive states (e.g., mastery vs non-mastery), and is an important tool for evaluating the diagnostic accuracy of the model. Figure 7 showcases that compared to the feature selection method of genetic algorithm combined with a light gradient boosting machine, the TDING model has the highest authenticity and can more realistically reflect the actual process of students’ answering questions, thereby improving the accuracy of the cognitive diagnostic model.
4.2 Quality analysis of ETR
To verify the reliability of OOM ET models, the study used multiple public datasets for testing the research recommendation algorithm. Table 2 showcases each dataset.
Description statistics for the dataset
| Dataset | TR | Number of students | KP |
|---|---|---|---|
| English0 | 5,684 | 327 | 68 |
| FrcSub | 20 | 4,210 | 12 |
| English1 | 20 | 3,912 | 15 |
| English2 | 20 | 537 | 9 |
During the experiment, to conclude the impact of the sparsity on different algorithms, 70, 50, 30, and 10% of all datasets were chosen as test datasets, and the remaining datasets were selected as training datasets. Moreover, this study separated TR into two resources, which are simple and complex based on a difficulty value of 0.6, and conducted a comparison of the recommended effects of various TR. The related effects (F1 value) are illustrated in Figure 8.
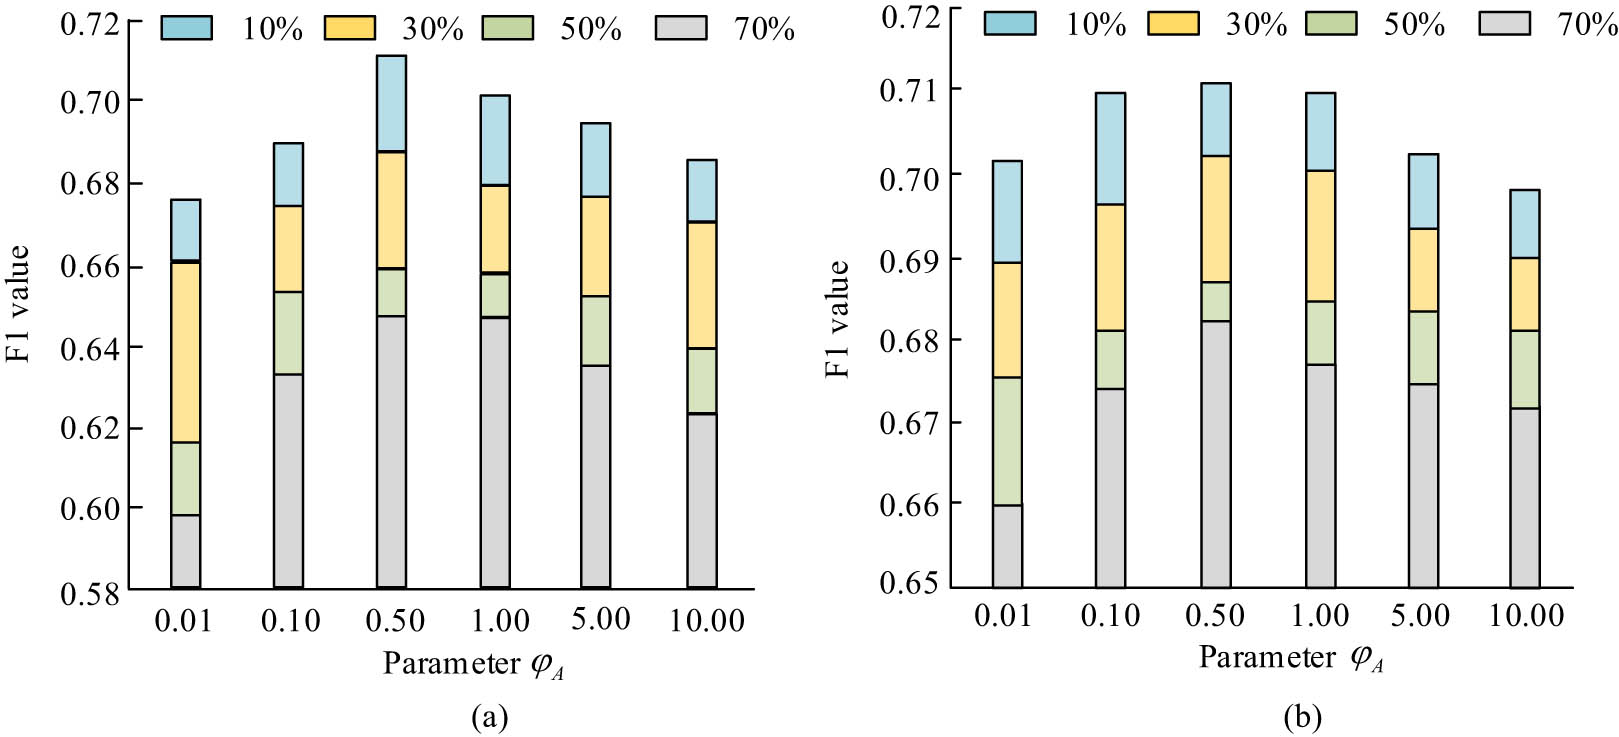
Effect of the first parameter on F1 value. (a) The effect of parameter φ A on simple resource. (b) The effect of parameter φ A on complex resource.
The F1 value is the reconciled average of Precision and Recall, which is a comprehensive measure of the accuracy of the model. The F1 value takes into account the precision and comprehensiveness of the model and is suitable for the case of the unbalanced dataset. In recommender systems, the F1 value can balance the precision and recall and provide a comprehensive evaluation of the model recommendation effect, especially suitable for evaluating the effectiveness of the TR recommender system. In Figure 8, when students mastered the variance parameter
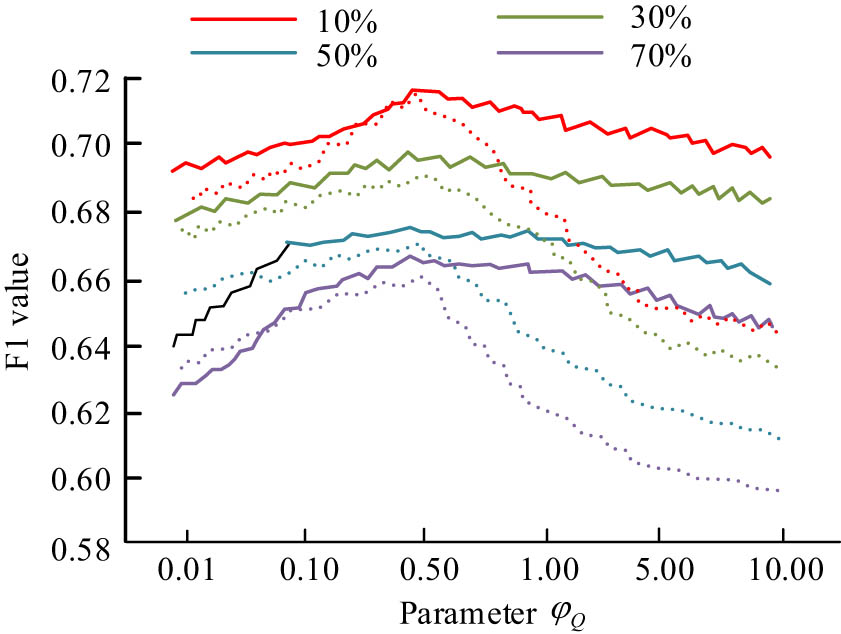
Effect of the second parameter on F1 value.
In Figure 9, the solid line serves as the impact of parameter
4.3 Effect analysis of online and offline English teaching resource recommendation
To analyze the OOM-ET model constructed through research and verify the effectiveness of English resource recommendation, this study recommended three sets of simple teaching resources (STRs) and three sets of complex teaching resources (CTRs) to students in a simulation experiment and compared the CUMF model method with other methods, including user-based CF recommendation method. Also includes considering the deterministic input noise of CD and the gate model (DINA) approach, combined with CD’s (PMF-CD) TR recommendation method, and combined with CD’s JPM (QueRec) CD recommendation method. The recommended experimental results for ETR are shown in Table 3.
Experimental F1 results of ETR
| Recommended algorithm | Test set proportion | |||
|---|---|---|---|---|
| 10% | 30% | 50% | 70% | |
| CUMF of STR | 0.782 | 0.754 | 0.723 | 0.718 |
| QueRec of STR | 0.767 | 0.736 | 0.702 | 0.689 |
| PMF-CD of STR | 0.702 | 0.638 | 0.631 | 0.694 |
| User-Based CF of STR | 0.478 | 0.533 | 0.507 | 0.502 |
| DINA of STR | 0.698 | 0.616 | 0.605 | 0.538 |
| CUMF of CTR | 0.852 | 0.824 | 0.786 | 0.792 |
| QueRec of CTR | 0.831 | 0.796 | 0.788 | 0.758 |
| PMF-CD of CTR | 0.773 | 0.722 | 0.714 | 0.686 |
| User-Based CF of CTR | 0.605 | 0.594 | 0.614 | 0.482 |
| DINA of CTR | 0.742 | 0.707 | 0.654 | 0.692 |
Table 3 indicates that when recommending STR, the F1 value of CUMF increased by an average of 11.63% relative to the other algorithms and increased by an average of 1.977% compared to QueRec algorithm as a whole. When recommending CTR, the F1 value grew by an average of 11.54% relative to the other algorithms and increased by an average of 1.877% compared to QueRec algorithm as a whole. As the test sets continued to decrease, the training sets continued to increase, the CUMF model exceeded the four algorithms in recommendation accuracy for STR and CTR. The above data indicate that the CUMF method can significantly enhance recommendation accuracy and effectiveness. The study was conducted by comparing the response time of different algorithms to compare the computational complexity. The results are shown in Figure 10.
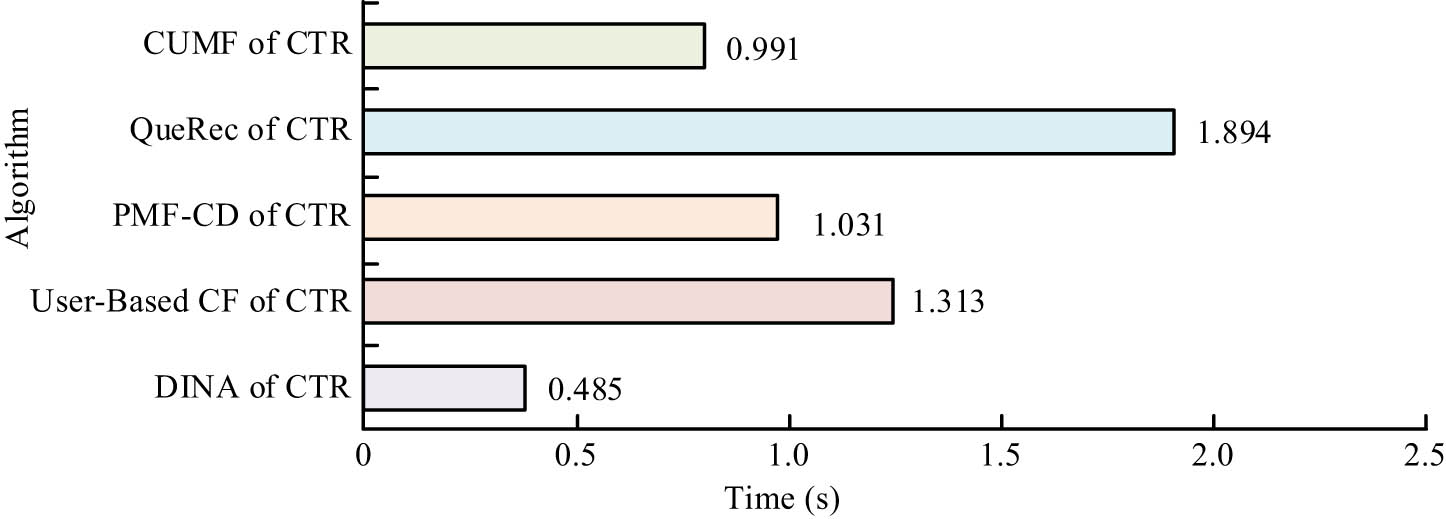
Comparison of computational complexity between different algorithms.
In Figure 10, the response time of CUMF is only longer than that of DINA, with an average single response time of 0.991 s, which is shorter than that of QueRec, PMF-CD, and User-Based CF algorithms. Considering the high accuracy brought by CUMF, the study concluded that the optimized computational complexity was acceptable. For testing the effect in the actual environment, the student data were separated into two groups, G1 and G2, G1 using the algorithm proposed in the study, and G2 using traditional algorithms. A comparative experiment was conducted on the response data through a paired sample t-test. Table 4 showcases the results.
Comparative experimental results
| Answer result data | G1 | G2 | ||
|---|---|---|---|---|
| Pre-test | Post-test | Pre-test | Post-test | |
| Number of people | 30 | 30 | 30 | 30 |
| Standard deviation | 4.145 | 4.065 | 5.366 | 5.045 |
| Mean square deviation | 0.955 | 0.895 | 1.315 | 1.035 |
| Average score | 81.135 | 83.515 | 81.266 | 82.165 |
| conspicuousness | 0.12% | 0.04% | ||
| Difference significance | 4.15% | 6.52% | ||
| Correlation coefficient | 0.964 | 0.765 | ||
| t | −2.095 | −1.762 | ||
Table 4 indicates that there is a dramatic disparity in the pre-test and post-test scores in Group G1, the experimental group, while there is no dramatic disparity in the pre-test and post-test scores in Group G2, the control group. In view of the t-test data results of G1 and G2 groups in Table 4, it showcased that the overall learning effect of G1 group students who use the TR recommended by the CUMF model-based TR recommendation algorithm elaborated by the research institute for autonomous learning is better than that of the control group, namely, G2 group students who only learn through independent search and browsing. Therefore, the effectiveness and feasibility of the proposed TR recommendation algorithm in view of the CUMF model applied in OOM English education models have been confirmed.
5 Discussion
At a time when Internet technology is developing rapidly, the field of education is undergoing a profound change. Especially in the field of ET, the rise of the OOM ET model marks the effective integration of traditional teaching methods and modern technology [23]. This model not only reflects the current development trend of educational technology but also the need for personalization and flexibility in modern education. For English teaching, the development and study of this model have important theoretical and practical value. However, due to the relative newness of this field, research on the OOM ET model in the existing literature is still relatively limited. Most of the existing studies focus on the evaluation of the effectiveness of online teaching, while there are fewer studies on the online-offline combined teaching model [24]. The aim of this study was to fill this gap by providing a comprehensive perspective to understand and improve modern English language teaching through an in-depth analysis of OOM teaching models. The study first validates the effectiveness of using the TDING model in CD, which echoes the research of Sharifi et al. who also found that incorporating technological tools can significantly improve the quality of teaching and learning. However, unlike the study by Sharifi et al., this study went a step further by integrating multiple data analysis tools, such as PMR and RMSE, and validated its effectiveness on real-world datasets [25,26]. In addition, the OOM ET model proposed in the study demonstrated significant advantages in terms of teaching effectiveness and student engagement compared to the traditional offline teaching model. This is similar to the study by Kosari et al. who noted that the richness and interactivity of online TR are crucial for improving learning outcomes [27]. The innovation of the study is that it not only considers the use of online resources but also pays attention to the integration of offline teaching to optimize the teaching method. The results of the study have important implications for current ET practices. Compared with the study by Zamani and other scholars, the teaching model proposed by the study pays more attention to the construction of personalized learning paths, which is important for meeting students’ different learning needs and optimizing the allocation of TR [28]. Although this study provides an in-depth analysis and empirical study of the OOM ET model, there are still some limitations. First, the study mainly relies on a specific dataset and experimental setting, which may not be sufficient to comprehensively reflect the effectiveness of teaching and learning in different cultural contexts, limiting the generalizability of the findings. Second, although a variety of data analysis tools and assessment metrics were used, they may not fully cover all aspects of the OOM ET model. Therefore, some of the assumptions and conclusions of the study may need to be updated and revised in the future, given the rapid developments in technology and the field of education. The best practices of the OOM ET model may change as new technologies emerge and pedagogical concepts are further developed.
6 Conclusion
The aim of this study is to improve students’ English learning outcomes by modeling CDs using the innovative TDING model and optimizing TR recommendations based on the CUMF model. The results of the study not only confirmed the advantages of the TDING model in terms of precision and accuracy but also demonstrated the significant effect of the CUMF model in improving the accuracy of teaching resource recommendations. The TDING model was overall 4.664% higher than the other two classical modeling approaches in terms of PMR value, and 1.412% lower than the other two approaches in terms of RMSE value. This significant performance improvement indicated that the TDING model had a clear advantage in understanding and predicting students’ learning states. This advantage stemmed from the unique algorithm design of the TDING model, which captured and analyzed student learning data more accurately, thus providing teachers and educators with a more accurate analysis of students’ cognitive states. The CUMF model demonstrated excellent performance in recommending TR. The F1 value of the CUMF model was significantly higher than that of the other four algorithms both in recommending simple TRs and complex TRs, especially in comparison with the QueRec algorithm. This result indicates that the CUMF model has a significant advantage in increasing the ETR recommendation accuracy and improving the recommendation effect, which is attributed to its efficient algorithmic design in processing complex data and understanding user needs. Although this study has achieved remarkable results, there are some limitations. The main limitation is that there is still room for improvement in the text feature extraction efficiency of ETR. Future research could consider more advanced feature extraction methods for serialized data to improve the accuracy and learning efficiency of recommender systems. In addition, further research can explore how these models can be applied to ET in different cultural and linguistic contexts to verify their general applicability and effectiveness.
-
Funding information: The author states no funding involved.
-
Author contributions: Ying Lan’s contributions to the article include writing, revision, experimental design, data analysis, etc.
-
Conflict of interest: The authors declare that they have no conflicts of interest.
-
Data availability statement: Some or all data, models, or code that support the findings of this study are available from the corresponding author upon reasonable request.
References
[1] Fndk LY, Bayram L, Canaran Z. Pre-service English language teachers’ conceptions of sustainable development: a case from Turkish higher education context. Int J Sustain High Educ. 2021;22(1):423–56.10.1108/IJSHE-06-2020-0202Search in Google Scholar
[2] Cunningham Christine M, Kelly Gregory J, Meyer N. Affordances of engineering with English learners. Sci Educ. 2021;105(2):255–80.10.1002/sce.21606Search in Google Scholar
[3] Cavaglia C, Machin S, Mcnally S. Gender, achievement, and subject choice in English education. Oxf Rev Econ Policy. 2020;36(4):816–35.10.1093/oxrep/graa050Search in Google Scholar
[4] Mcvee MB, Swenson J, English K. A review of theory and methods for sociocultural research in science and engineering education. J Adolesc Adult Lit. 2020;64(3):360–3.10.1002/jaal.1102Search in Google Scholar
[5] Dimova S. English language requirements for enrolment in EMI programs in higher education: A European case. J Engl Acad Purp. 2020;47(2):189–201.10.1016/j.jeap.2020.100896Search in Google Scholar
[6] Chowdhury TI, Hoque MR, Wanke P, Raihan MZ, Azad MAK. Antecedents of perceived service quality of online education during a pandemic: Configuration analysis based on fuzzy-set qualitative comparative analysis. Eval Rev. 2022;46(3):235–65.10.1177/0193841X221084860Search in Google Scholar PubMed
[7] Huang Y. Research on design and application of online English education platform based on web. Hindawi. 2021;21(3):13–23.10.1155/2021/7648856Search in Google Scholar
[8] Wang J, Li W. The construction of a digital resource library of English for higher education based on a cloud platform. Sci Program. 2021;31(10):20–31.10.1155/2021/4591780Search in Google Scholar
[9] Chen W, Samuel R, Krishnamoorthy S. Computer vision for dynamic student data management in higher education platform. J Mult-Valued Log Soft Comput. 2021;36(1/3):5–23.Search in Google Scholar
[10] Tang Y, Liang J, Hare R, Wang F-Y. A personalized learning system for parallel intelligent education. IEEE Trans Comput Soc Syst. 2020;7(2):352–61.10.1109/TCSS.2020.2965198Search in Google Scholar
[11] Sun Y, Wang J, Guo J, Hu Y, Yin B. Globality constrained adaptive graph regularized non-negative matrix factorization for data representation. IET Image Process. 2022;16(10):2577–92.10.1049/ipr2.12510Search in Google Scholar
[12] Zhang B, Gong M, Huang J. Clustering heterogeneous information network by joint graph embedding and nonnegative matrix factorization. ACM Trans Knowl Discov Data. 2021;15(4):11–25.10.1145/3441449Search in Google Scholar
[13] Chang Z, Zhang ZY, Cheng H, Yan C, Yin X. Optimizing modularity with nonnegative matrix factorization. Int J Mod Phys C. 2021;32(11):1352–70.10.1142/S0129183121501424Search in Google Scholar
[14] Ravakhah M, Jalali M, Forghani Y, Sheibani R. Balanced hierarchical max margin matrix factorization for recommendation system. Expert Syst. 2022;39(4):5–14.10.1111/exsy.12911Search in Google Scholar
[15] Cui G, Li Y. Nonredundancy regularization based nonnegative matrix factorization with manifold learning for multiview data representation. Inf Fusion. 2022;82(3):86–98.10.1016/j.inffus.2021.12.001Search in Google Scholar
[16] Moradi E, Sharifi A. Assessment of forest cover changes using multi-temporal Landsat observation. Environ Dev Sustain. 2023;25(2):1351–60.10.1007/s10668-021-02097-2Search in Google Scholar
[17] Esmaeili M, Abbasi-Moghadam D, Sharifi A, Tariq A, Li Q. Hyperspectral image band selection based on CNN embedded GA (CNNeGA). IEEE J Sel Top Appl Earth Observ Remote Sens. 2023;16:1927–50.10.1109/JSTARS.2023.3242310Search in Google Scholar
[18] Nejad SMM, Abbasi-Moghadam D, Sharifi A, Farmonov N, Amankulova K, Lászlź M. Multispectral crop yield prediction using 3D-convolutional neural networks and attention convolutional LSTM approaches. IEEE J Sel Top Appl Earth Observ Remote Sens. 2022;16:254–66.10.1109/JSTARS.2022.3223423Search in Google Scholar
[19] Adiego J, Martín-Cruz N. Training competences in smart cities: An online program for higher education students. Int J Sustain High Educ. 2021;22(7):1630–45.10.1108/IJSHE-08-2020-0307Search in Google Scholar
[20] Cullinane A. Assessment of practical science in high stakes examinations: A qualitative analysis of high performing English-speaking countries. Int J Sci Educ. 2020;42(3):17–26.Search in Google Scholar
[21] Edwards J, Mohammed N, Nunn C. Mother tongue other tongue: nine years of creative multilingualism in practice. Engl Educ. 2020;17(4):13–25.Search in Google Scholar
[22] Ulum MG. Pre-service English teachers’ practicum expectations and attainments. Turk Stud. 2020;15(2):1287–97.Search in Google Scholar
[23] Du X. Translanguaging practices of students in science and math classes in a Chinese/English dual language bilingual program. Appl Linguist Rev. 2022;13(3):345–57.10.1515/applirev-2021-0019Search in Google Scholar
[24] Sharifi A. Flood mapping using relevance vector machine and SAR data: A case study from Aqqala, Iran. J Indian Soc Remote Sens. 2020;48(9):1289–96.10.1007/s12524-020-01155-ySearch in Google Scholar
[25] Sharifi A, Amini J. Forest biomass estimation using synthetic aperture radar polarimetric features. J Appl Remote Sens. 2015;9(1):097695.10.1117/1.JRS.9.097695Search in Google Scholar
[26] Sharifi A, Amini J, Tateishi R. Estimation of forest biomass using multivariate relevance vector regression. Photogramm Eng Remote Sens. 2016;82(1):41–9.10.14358/PERS.83.1.41Search in Google Scholar
[27] Kosari A, Sharifi A, Ahmadi A, Khoshsima M. Remote sensing satellite’s attitude control system: rapid performance sizing for passive scan imaging mode. Aircr Eng Aerosp Technol. 2020;92(7):1073–83.10.1108/AEAT-02-2020-0030Search in Google Scholar
[28] Zamani A, Sharifi A, Felegari S, Tariq A, Zhao N. Agro climatic zoning of saffron culture in Miyaneh city by using WLC method and remote sensing data. Agriculture. 2022:12(1):118.10.3390/agriculture12010118Search in Google Scholar
© 2024 the author(s), published by De Gruyter
This work is licensed under the Creative Commons Attribution 4.0 International License.
Articles in the same Issue
- Research Articles
- A study on intelligent translation of English sentences by a semantic feature extractor
- Detecting surface defects of heritage buildings based on deep learning
- Combining bag of visual words-based features with CNN in image classification
- Online addiction analysis and identification of students by applying gd-LSTM algorithm to educational behaviour data
- Improving multilayer perceptron neural network using two enhanced moth-flame optimizers to forecast iron ore prices
- Sentiment analysis model for cryptocurrency tweets using different deep learning techniques
- Periodic analysis of scenic spot passenger flow based on combination neural network prediction model
- Analysis of short-term wind speed variation, trends and prediction: A case study of Tamil Nadu, India
- Cloud computing-based framework for heart disease classification using quantum machine learning approach
- Research on teaching quality evaluation of higher vocational architecture majors based on enterprise platform with spherical fuzzy MAGDM
- Detection of sickle cell disease using deep neural networks and explainable artificial intelligence
- Interval-valued T-spherical fuzzy extended power aggregation operators and their application in multi-criteria decision-making
- Characterization of neighborhood operators based on neighborhood relationships
- Real-time pose estimation and motion tracking for motion performance using deep learning models
- QoS prediction using EMD-BiLSTM for II-IoT-secure communication systems
- A novel framework for single-valued neutrosophic MADM and applications to English-blended teaching quality evaluation
- An intelligent error correction model for English grammar with hybrid attention mechanism and RNN algorithm
- Prediction mechanism of depression tendency among college students under computer intelligent systems
- Research on grammatical error correction algorithm in English translation via deep learning
- Microblog sentiment analysis method using BTCBMA model in Spark big data environment
- Application and research of English composition tangent model based on unsupervised semantic space
- 1D-CNN: Classification of normal delivery and cesarean section types using cardiotocography time-series signals
- Real-time segmentation of short videos under VR technology in dynamic scenes
- Application of emotion recognition technology in psychological counseling for college students
- Classical music recommendation algorithm on art market audience expansion under deep learning
- A robust segmentation method combined with classification algorithms for field-based diagnosis of maize plant phytosanitary state
- Integration effect of artificial intelligence and traditional animation creation technology
- Artificial intelligence-driven education evaluation and scoring: Comparative exploration of machine learning algorithms
- Intelligent multiple-attributes decision support for classroom teaching quality evaluation in dance aesthetic education based on the GRA and information entropy
- A study on the application of multidimensional feature fusion attention mechanism based on sight detection and emotion recognition in online teaching
- Blockchain-enabled intelligent toll management system
- A multi-weapon detection using ensembled learning
- Deep and hand-crafted features based on Weierstrass elliptic function for MRI brain tumor classification
- Design of geometric flower pattern for clothing based on deep learning and interactive genetic algorithm
- Mathematical media art protection and paper-cut animation design under blockchain technology
- Deep reinforcement learning enhances artistic creativity: The case study of program art students integrating computer deep learning
- Transition from machine intelligence to knowledge intelligence: A multi-agent simulation approach to technology transfer
- Research on the TF–IDF algorithm combined with semantics for automatic extraction of keywords from network news texts
- Enhanced Jaya optimization for improving multilayer perceptron neural network in urban air quality prediction
- Design of visual symbol-aided system based on wireless network sensor and embedded system
- Construction of a mental health risk model for college students with long and short-term memory networks and early warning indicators
- Personalized resource recommendation method of student online learning platform based on LSTM and collaborative filtering
- Employment management system for universities based on improved decision tree
- English grammar intelligent error correction technology based on the n-gram language model
- Speech recognition and intelligent translation under multimodal human–computer interaction system
- Enhancing data security using Laplacian of Gaussian and Chacha20 encryption algorithm
- Construction of GCNN-based intelligent recommendation model for answering teachers in online learning system
- Neural network big data fusion in remote sensing image processing technology
- Research on the construction and reform path of online and offline mixed English teaching model in the internet era
- Real-time semantic segmentation based on BiSeNetV2 for wild road
- Online English writing teaching method that enhances teacher–student interaction
- Construction of a painting image classification model based on AI stroke feature extraction
- Big data analysis technology in regional economic market planning and enterprise market value prediction
- Location strategy for logistics distribution centers utilizing improved whale optimization algorithm
- Research on agricultural environmental monitoring Internet of Things based on edge computing and deep learning
- The application of curriculum recommendation algorithm in the driving mechanism of industry–teaching integration in colleges and universities under the background of education reform
- Application of online teaching-based classroom behavior capture and analysis system in student management
- Evaluation of online teaching quality in colleges and universities based on digital monitoring technology
- Face detection method based on improved YOLO-v4 network and attention mechanism
- Study on the current situation and influencing factors of corn import trade in China – based on the trade gravity model
- Research on business English grammar detection system based on LSTM model
- Multi-source auxiliary information tourist attraction and route recommendation algorithm based on graph attention network
- Multi-attribute perceptual fuzzy information decision-making technology in investment risk assessment of green finance Projects
- Research on image compression technology based on improved SPIHT compression algorithm for power grid data
- Optimal design of linear and nonlinear PID controllers for speed control of an electric vehicle
- Traditional landscape painting and art image restoration methods based on structural information guidance
- Traceability and analysis method for measurement laboratory testing data based on intelligent Internet of Things and deep belief network
- A speech-based convolutional neural network for human body posture classification
- The role of the O2O blended teaching model in improving the teaching effectiveness of physical education classes
- Genetic algorithm-assisted fuzzy clustering framework to solve resource-constrained project problems
- Behavior recognition algorithm based on a dual-stream residual convolutional neural network
- Ensemble learning and deep learning-based defect detection in power generation plants
- Optimal design of neural network-based fuzzy predictive control model for recommending educational resources in the context of information technology
- An artificial intelligence-enabled consumables tracking system for medical laboratories
- Utilization of deep learning in ideological and political education
- Detection of abnormal tourist behavior in scenic spots based on optimized Gaussian model for background modeling
- RGB-to-hyperspectral conversion for accessible melanoma detection: A CNN-based approach
- Optimization of the road bump and pothole detection technology using convolutional neural network
- Comparative analysis of impact of classification algorithms on security and performance bug reports
- Cross-dataset micro-expression identification based on facial ROIs contribution quantification
- Demystifying multiple sclerosis diagnosis using interpretable and understandable artificial intelligence
- Unifying optimization forces: Harnessing the fine-structure constant in an electromagnetic-gravity optimization framework
- E-commerce big data processing based on an improved RBF model
- Analysis of youth sports physical health data based on cloud computing and gait awareness
- CCLCap-AE-AVSS: Cycle consistency loss based capsule autoencoders for audio–visual speech synthesis
- An efficient node selection algorithm in the context of IoT-based vehicular ad hoc network for emergency service
- Computer aided diagnoses for detecting the severity of Keratoconus
- Improved rapidly exploring random tree using salp swarm algorithm
- Network security framework for Internet of medical things applications: A survey
- Predicting DoS and DDoS attacks in network security scenarios using a hybrid deep learning model
- Enhancing 5G communication in business networks with an innovative secured narrowband IoT framework
- Quokka swarm optimization: A new nature-inspired metaheuristic optimization algorithm
- Digital forensics architecture for real-time automated evidence collection and centralization: Leveraging security lake and modern data architecture
- Image modeling algorithm for environment design based on augmented and virtual reality technologies
- Enhancing IoT device security: CNN-SVM hybrid approach for real-time detection of DoS and DDoS attacks
- High-resolution image processing and entity recognition algorithm based on artificial intelligence
- Review Articles
- Transformative insights: Image-based breast cancer detection and severity assessment through advanced AI techniques
- Network and cybersecurity applications of defense in adversarial attacks: A state-of-the-art using machine learning and deep learning methods
- Applications of integrating artificial intelligence and big data: A comprehensive analysis
- A systematic review of symbiotic organisms search algorithm for data clustering and predictive analysis
- Modelling Bitcoin networks in terms of anonymity and privacy in the metaverse application within Industry 5.0: Comprehensive taxonomy, unsolved issues and suggested solution
- Systematic literature review on intrusion detection systems: Research trends, algorithms, methods, datasets, and limitations