Abstract
Multiple sclerosis (MS) is a dangerous illness that strikes the central nervous system. The body’s immune system attacks myelin (an entity above the nerves) and impairs brain-to-body communication. To date, it is not possible to cure MS. However, symptoms can be managed, and treatments can be provided if the disease is diagnosed early. Hence, supervised machine learning (ML) algorithms and several hyperparameter tuning techniques, including Bayesian optimization, have been utilized in this study to predict MS in patients. Descriptive and inferential statistical analysis has been conducted before training the classifiers. The most essential markers were chosen using a technique called mutual information. Among the search techniques, the Bayesian optimization search technique prevailed to be pre-eminent, with an accuracy of 89%. To comprehend the diagnosis generated by the ML classifiers, four techniques of explainable artificial intelligence were utilized. According to them, the crucial attributes are periventricular magnetic resonance imaging (MRI), infratentorial MRI, oligoclonal bands, spinal cord MRI, breastfeeding, varicella disease, and initial symptoms. The models could be deployed in various medical facilities to detect MS in patients. The doctors could also use this framework to get a second opinion regarding the diagnosis.
1 Introduction
Multiple sclerosis (MS), a complex and often unpredictable autoimmune disease, disrupts communication within the central nervous system, leading to debilitating neurological symptoms [1]. This disease occurs when the body unconditionally targets itself [2]. Myelin, the lipid-rich multilamellar membrane ensheathed around neural fibers [3], undergoes focal, segmental breakdown in MS patients [4]. This demyelination process weakens axonal signal propagation, consequently hindering neurotransmission between central and peripheral organ systems.
The precise origin of MS is currently undetermined. Nevertheless, robust evidence implicates the multifaceted interaction of genetic vulnerabilities, environmental modulators, and potential infectious insults in its initiation and progression [5]. Studies have indicated that viruses such as Epstein–Barr have induced MS in patients [6]. According to some researchers, a lack of vitamin D can also increase the chance of MS in patients [7]. The symptoms of MS are generally erratic. How they manifest depends on the particular part of the impacted neurological system. The first signs of MS include complete/partial loss of vision, trouble walking, and numbness in the body. Other symptoms include muscle pain, trouble coordinating, spasticity, tiredness, loss of sensation, problems speaking, tremors, fainting sensation, trouble hearing, bowel and urinary issues, and mental illness. Patients have experienced issues with cognition, including difficulties with memory retention, concentration, and decision-making abilities. Coping with a chronic ailment such as MS can be very challenging, and this can lead to depression and other mental illnesses [8].
To date, there is no permanent solution for MS. However, several treatments and medicines have been included to reduce the severe symptoms and slow their progression [9]. These include disease-modifying therapies, relapse management treatments, physical rehabilitation, and counselling. The flare-ups can also be reduced by leading a healthy lifestyle. This includes eating healthy, exercising regularly, managing stress, and limiting smoking and alcohol intake.
There is no specific technique to diagnose MS. However, a combination of techniques such as magnetic resonance imaging (MRI) scans, evoked potentials, cerebral spinal fluid analysis, blood tests, and OCT (optical coherence tomography) scans have been used to detect MS [10]. The details mentioned above are summarized in Figure 1.
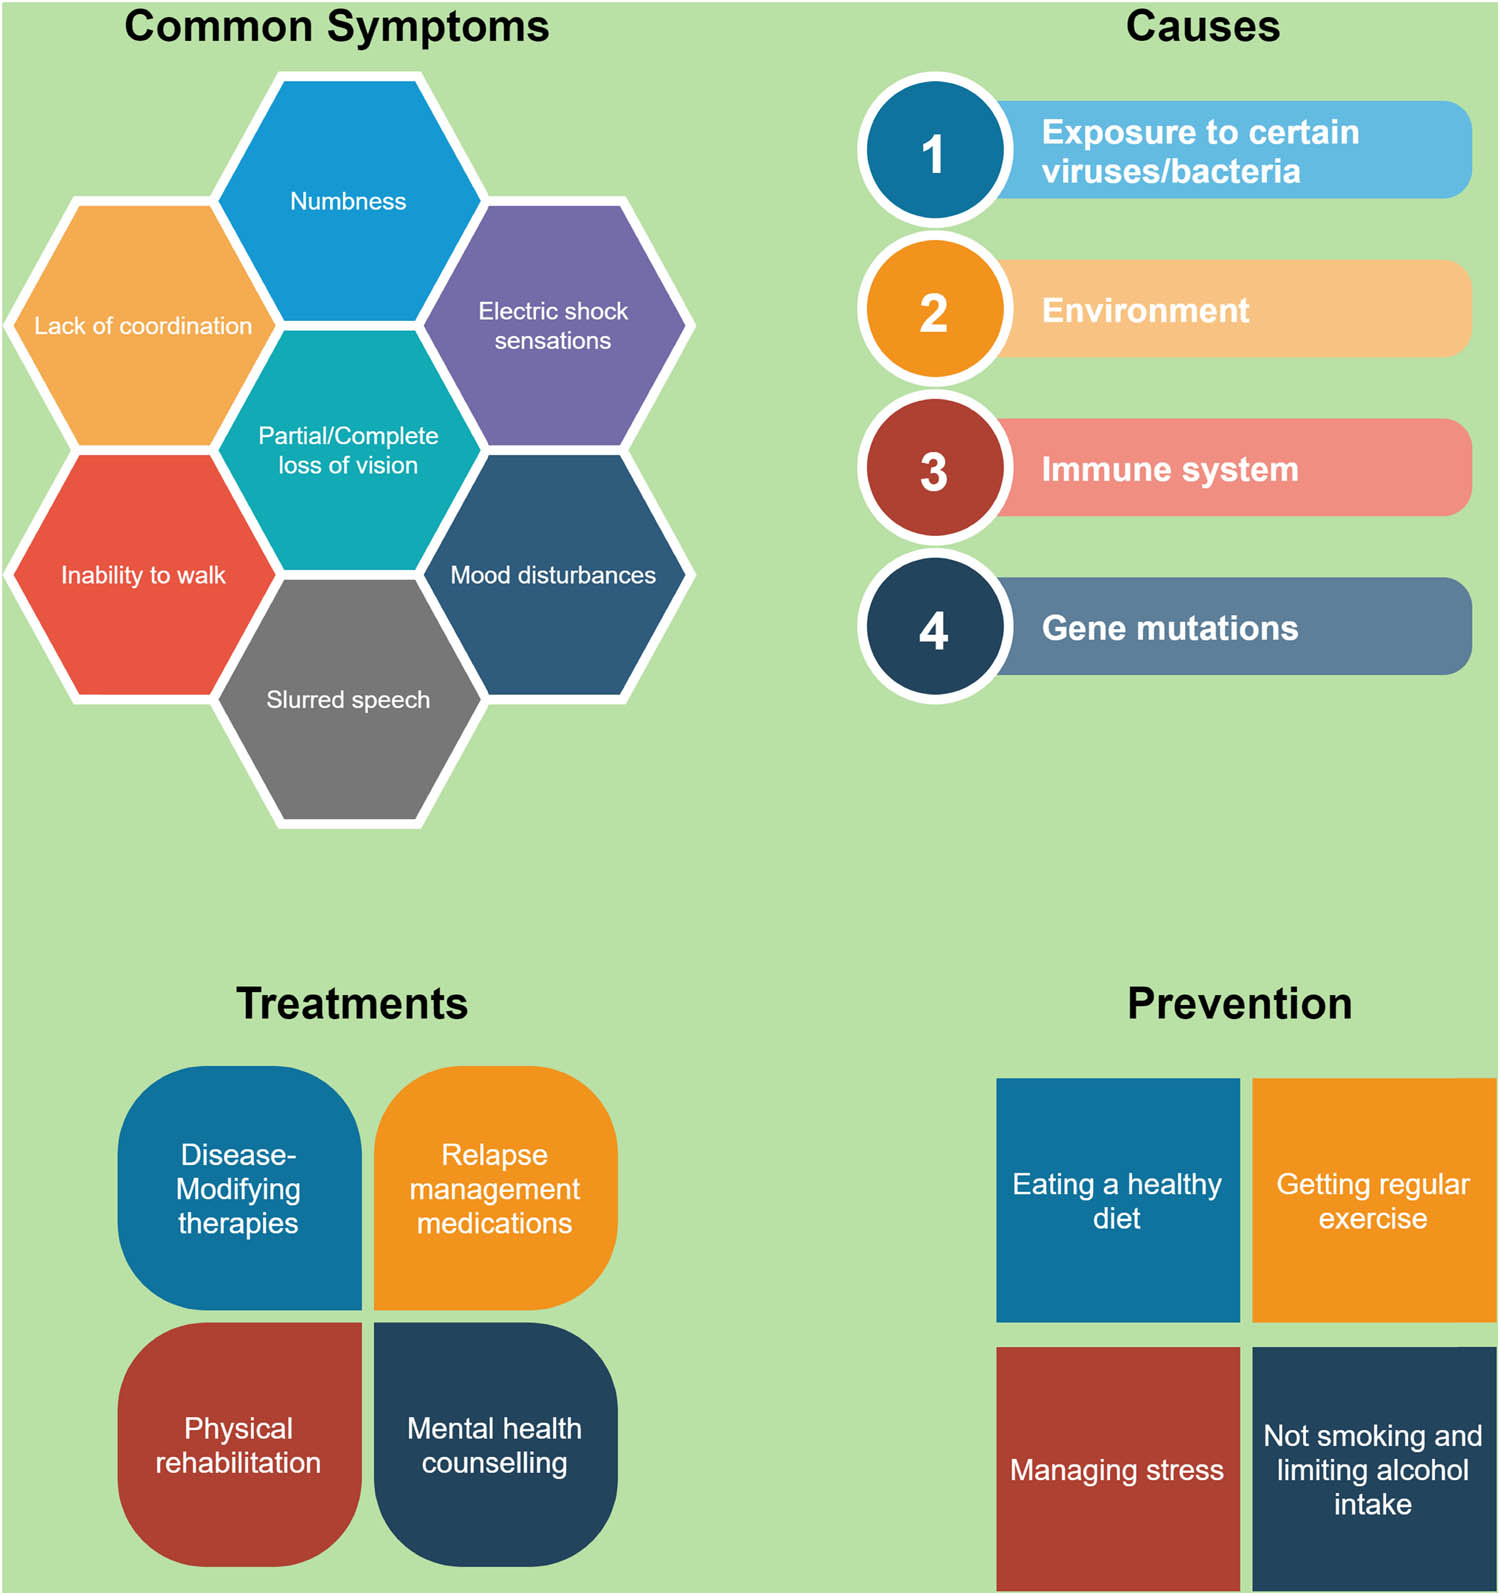
The common symptoms, causes, treatments, and prevention of multiple sclerosis.
Artificial intelligence (AI) techniques are being heavily deployed in various sectors, and machine learning (ML) models are being used for predicting diagnosis, prognosis, mortality, patient care, preliminary screening, and medical resource utilization [11]. Explainable AI (XAI) makes the ML classifiers interpretable [12]. Ensuring transparent and reliable predictions through clear visual communication would unlock the potential of these models for real-world application in medical settings, empowering doctors with valuable decision-making tools [13].
Several studies have already been conducted that use ML algorithms to diagnose MS. In a study by Law et al. [14], ML was used to predict secondary progressive MS. Three ML classifiers were chosen for prediction. The number of patients selected was 485. The decision tree obtained optimal results with an area under the curve (AUC) of 0.61. Another research used XAI to differentiate MS phenotypes [15]. The subjects considered in this research were from Raffaele Scientific Institute, Italy. A graphic clustering framework was used for detection. Zhao et al. [16] used ML classifiers to predict MS prognosis. Support vector machine (SVM) and logistic regression were the classifiers utilized. The algorithms obtained a maximum sensitivity of 86%. The critical features were family history, race, brain T2 lesion volume, and brain parenchymal fraction. Denissen et al. [17] conducted a systematic review of the literature investigating the potential of ML algorithms for prognostication of MS, with a significant emphasis on studies employing biological markers as predictors.
Building upon the demonstrated capability of ML algorithms in predicting MS disease course [18], this investigation broadened its scope to encompass pertinent considerations for real-world implementation, including data limitations, bias mitigation, missing data imputation, data integration, and the imperative for interpretable AI models. Prioritizing informative features through dimensionality reduction proved crucial in another study [18], where deep learning algorithms successfully predicted MS with an accuracy of 80%. This approach streamlined model complexity and potentially enhanced interpretability. Another study leveraged radiological and clinical markers to predict MS prognosis in a cohort of 163 patients, with the best-performing classifier achieving an accuracy of 79% [19]. This multimodal approach demonstrates the potential for integrating diverse data sources to enhance predictive accuracy. A recent investigation [20] employed an SVM model to classify MS based on 11 gait variables, attaining a noteworthy accuracy of 81%. Pinto et al. [21] used ML to predict the disease progression. The maximum AUC, recall, and specificity obtained were 0.89, 0.84, and 0.81, respectively. According to the study, the most key features were age, disability status scale value, and affected functions during relapse.
Building upon the established role of ML in predicting disease progression, this investigation tackles the crucial challenge of model interpretability. We propose a novel framework for developing transparent and explainable models, addressing a significant unmet need in this field. The contributions made in this study are listed as follows.
Prior to model training, comprehensive descriptive and inferential statistical analysis was conducted using JAMOVI to uncover salient patterns and relationships within the dataset.
Mutual information was employed to identify the most informative features, ensuring model parsimony and potentially enhancing interpretability.
Bayesian optimization was adopted for fine-tuning model hyperparameters, offering a potentially more efficient approach than conventional grid search and randomized search methods.
A diverse array of ML classifiers was rigorously assessed, including a customized stacking model, a deep neural network (DNN), and a long short-term memory (LSTM) network to harness their unique strengths and identify the best-performing architecture.
To demystify model predictions and build trust, we leveraged four diverse XAI methods (SHAP, LIME, Eli5, and QLattice) for valuable insights into their decision-making processes.
We explored how our findings could refine diagnosis, personalize treatment, and deepen medical understanding of the disease.
2 Materials and methods
In this section, we begin by exploring the data through descriptive and inferential statistics and then refine its features using mutual information. ML terminology specific to our analysis will be clarified later.
2.1 Dataset description
The MS dataset was procured from a public repository called Mendeley [22]. The authors collected the dataset from the National Institute of Neurology and Neurosurgery, Mexico. The details of 273 Mexican patients tested from 2006 to 2010 were tabulated. The dataset contained 20 features, including the target group. Only four variables were continuous, and the rest were categorical. The target variable “group” contained “1s” and “2s.” “1” confirmed MS, and “2” indicated that the patient does not suffer from MS. The dataset had a balance of classes with 125 MS and 148 cases without MS. The attributes present in the tabular dataset are described in Table 1.
Marker description
| Sl. no. | Clinical parameter | Description (units) | Sl. no. | Clinical parameter | Description (units) |
|---|---|---|---|---|---|
| 1 | Patient ID | Unique patient identifier | 11 | ULSSEP | Somatosensory evoked potentials (SSEPs) use the spine/scalp to record electric signals. In higher extremity SSEPs, signals are recorded from N9, N13–P14 and N20–P23 spots [27] (0 – negative and 1 – positive) |
| 2 | Gender | Sex of a patient (1 – male and 2 – female) | 12 | Visual evoked potential (VEP) | Impaired transmission in the optic nerve can be found using VEP [28] (0 – negative and 1 – positive) |
| 3 | Age | Age of a patient (in years) | 13 | Brainstem auditory evoked potentials (BAEP) test | BAEP test finds impaired transmission between ears and brain [29] (0 – negative and 1 – positive) |
| 4 | Schooling | The number of years a patient went to school (in years) | 14 | Periventricular MRI | Presence of periventricular lesions in the brain [30] (0 – negative and 1 – positive) |
| 5 | Breast feeding | Did the patient have access to breastfeeding when they were an infant? (1 – yes, 2 – no, and 3 – unknown) | 15 | Cortical MRI | Presence of cortical lesions in the brain [31] (0–negative and 1 – positive) |
| 6 | Varicella | Has the patient suffered from varicella-zoster virus infection? (1 – yes, 2 – no, and 3 – don’t know) [23] | 16 | Infratentorial MRI | Presence of infratentorial lesions in the brain [32] (0 – negative and 1 – positive) |
| 7 | Initial symptom | Types of symptoms observed in patients (1 – visual, 2 – sensory, 3 – motor, 4 – others, 5 – visual and sensory, 6 – visual and motor, 7 – visual and others, 8 – sensory and motor, 9 – sensory and others, 10 – motor and other, 11 – visual, sensory, and motor, 12 – visual, sensory, and others, 13 – visual, motor and others, 14 – sensory, motor and others, and 15 – visual, sensory, motor, and others) | 17 | Spinal cord MRI | Presence of spinal cord lesions [33] (0 – negative and 1 – positive) |
| 8 | Mono or polysymptomatic | Does the patient suffer from mono or polysymptomatic enuresis? (1 – monosymptomatic, 2 – polysymptomatic, and 3 – unknown) [24] | 18 | Initial Expanded Disability Status Scale (EDSS) | Initial EDSS test performed? [34] (1 – yes, 2 – no, and 3 – unknown) |
| 9 | Oligoclonal bands | They are a type of protein. It can indicate damage to the central nervous system (0 – negative, 1 – positive, and 2 – unknown) [25] | 19 | Final EDSS | Final EDSS test performed? [34] (1 – yes, 2 – no, and 3 – unknown) |
| 10 | LLSSEP | SSEPs use the spine/scalp to record electric signals. In lower extremity SSEPs, signals are recorded from LP, N34, and P37–N45 spots [26] (0 – negative and 1 – positive) | 20 | groups | Clinically definite multiple sclerosis (CDMS) diagnosis (1 – CDMS, 2 – non-CDMS) |
2.2 Statistical analysis, data preprocessing, and feature selection
Initially, we removed four unimportant attributes. “Patient ID” is irrelevant to ML analysis and was not included for further analysis. In this study, “schooling” was also not considered. The variables “Initial EDSS” and “Final EDSS” were directly correlated with the target variable and would make the results biased [35]. Hence, they were not considered. Sixteen features, including the target variable, were considered for further research. Further, statistical analysis was conducted on the data. Since most were categorical variables, bar graphs were used to describe them. Some of these attributes are described in Figure 2. It is observed that male patients were at a greater risk compared to female patients. The virus “Varicella” was not an essential factor since patients who contracted the virus and those who did not were at risk. A positive test for “oligoclonal bands” was observed in patients undergoing investigations for MS. Patients who tested positive for “LLSSEP” and “ULSSEP” were also at significant risk. Among the MRI scans, the most important were “periventricular MRI,” “cortical MRI,” and “infratentorial MRI.” Further, hypothesis testing was performed to gain more inferences from the data [36]. If the p-value is less than 0.001, the variable is considered necessary. Most markers were considered crucial except “breastfeeding,” “mono or polysymptomatic,” “BAEP” and “spinal cord MRI” (Table 2).
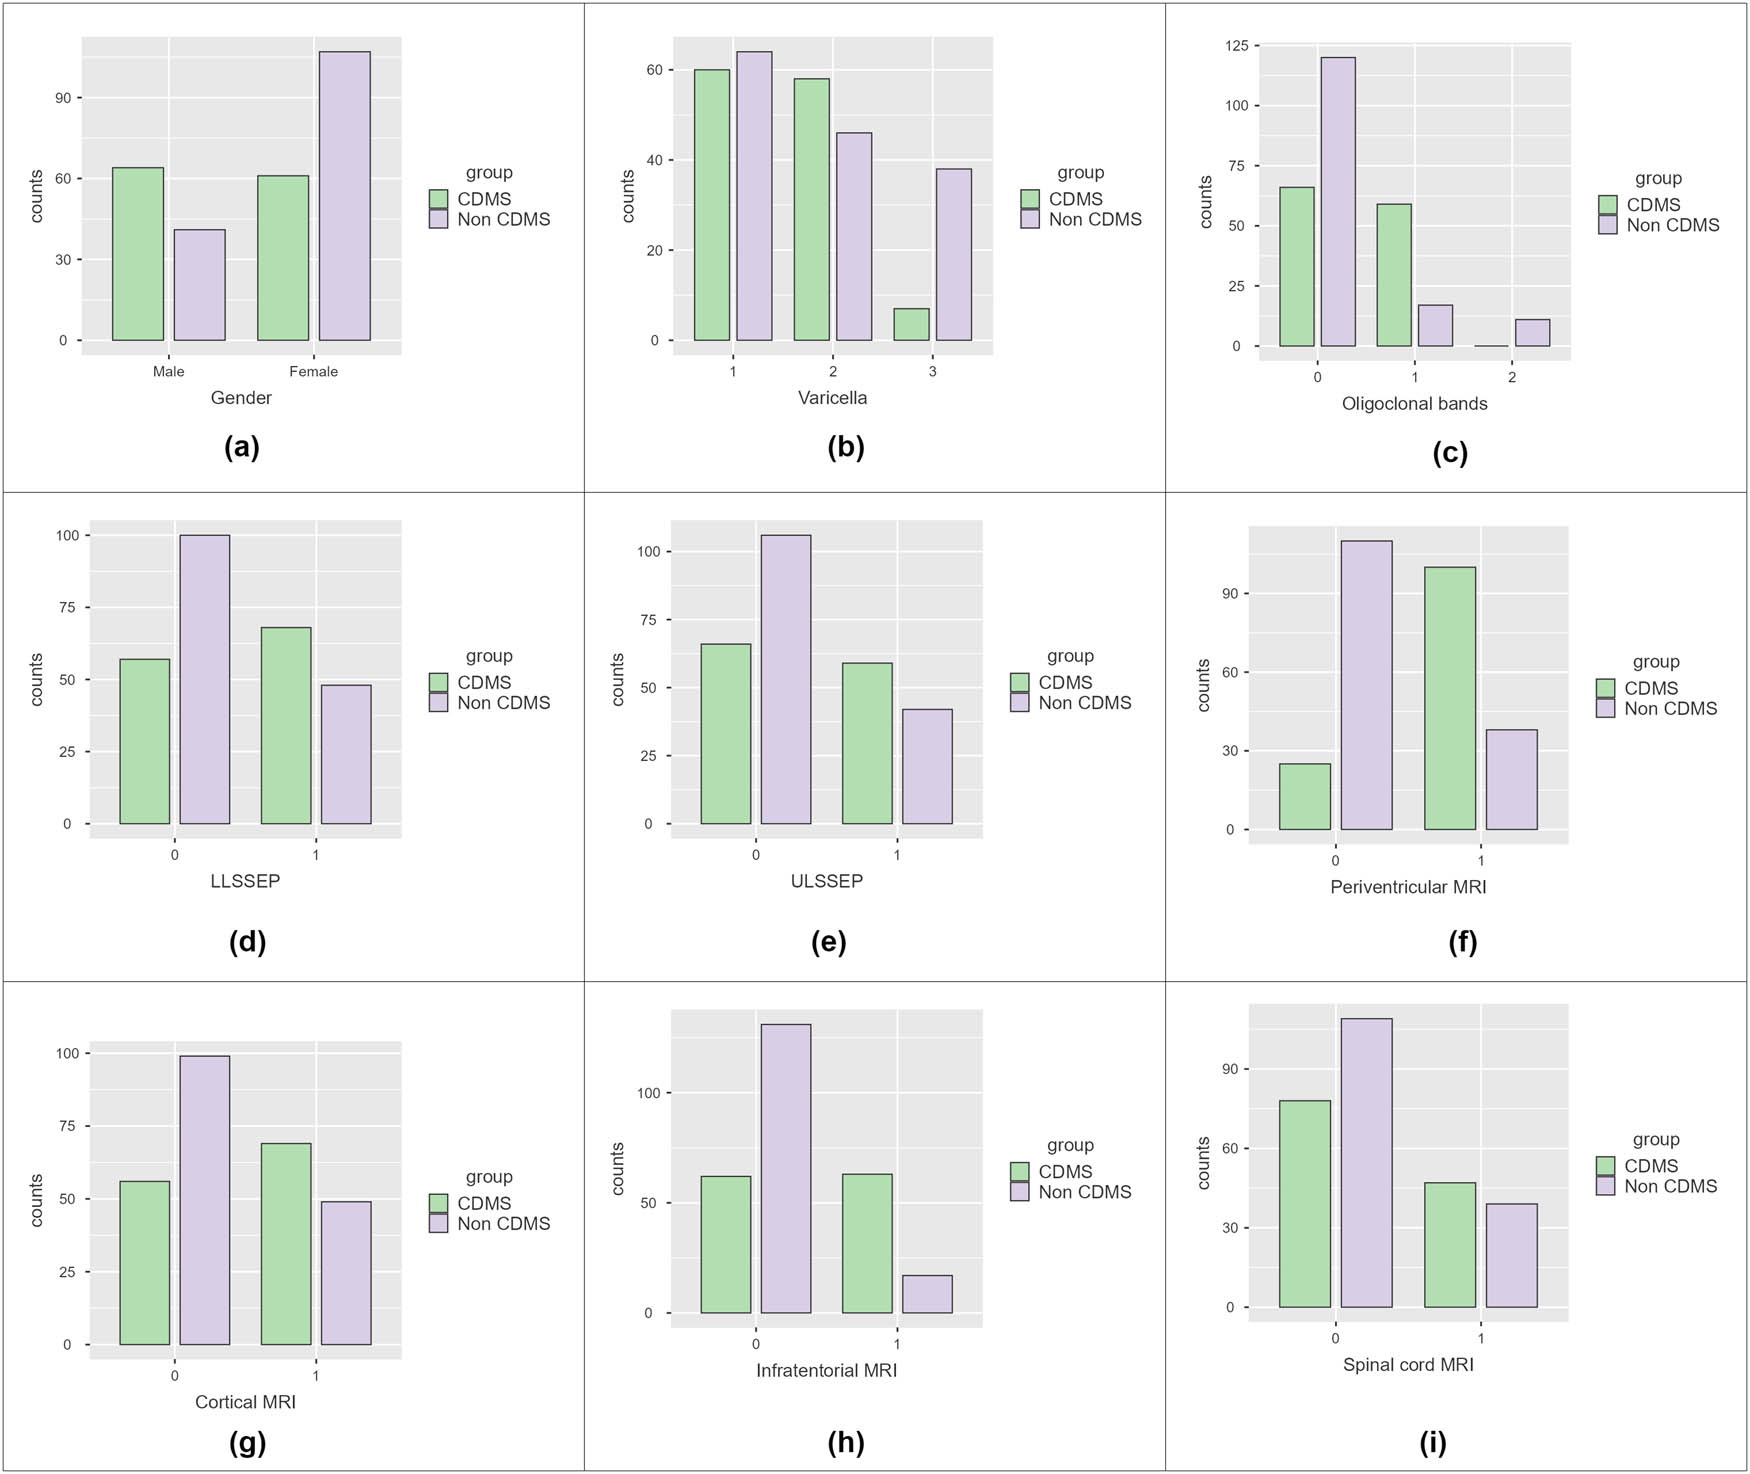
Bar plots to visualize the count of categorical variables. (a) Gender, (b) varicella, (c) oligoclonal bands, (d) LLSSEP, (e) ULSSEP, (f) periventricular MRI, (g) cortical MRI, (h) infratentorial MRI, and (i) spinal cord MRI.
Chi square test results
| Attribute | p-value | Attribute | p-value |
|---|---|---|---|
| Gender | <0.001 | ULSSEP | 0.001 |
| Breast feeding | 0.004 | VEP | <0.001 |
| Varicella | <0.001 | BAEP | 0.389 |
| Initial symptom | <0.001 | Periventricular MRI | <0.001 |
| Mono or polysymptomatic | 0.021 | Cortical MRI | <0.001 |
| Oligoclonal bands | <0.001 | Infratentorial MRI | <0.001 |
| LLSSEP | <0.001 | Spinal cord MRI | 0.046 |
Two variables were continuous: age and initial symptoms. The descriptive statistics conducted for the above features are described in Table 3. Violin plots for the two continuous attributes are observed in Figure 3. There is no drastic difference in age between the two groups. When there were more than eight initial symptoms, MS was diagnosed. Further, t-tests were conducted to obtain more inferences on the data. The attribute is considered critical if the obtained p-value is less than 0.001. Among the two attributes, initial symptoms were considered crucial by the Student’s t-test (Table 4).
Descriptive statistical testing of continuous variables
| Group | N | Mean | Median | SD | Variance | IQR | Range | Minimum | Maximum | |
|---|---|---|---|---|---|---|---|---|---|---|
| Age (years) | CDMS | 125 | 34.84 | 34 | 11.42 | 130.4 | 14 | 55 | 15 | 70 |
| Non-CDMS | 148 | 33.41 | 32.5 | 10.85 | 117.7 | 14.25 | 61 | 16 | 77 | |
| Initial symptom | CDMS | 125 | 8.21 | 8 | 4.32 | 18.6 | 8 | 14 | 1 | 15 |
| Non-CDMS | 148 | 4.92 | 4 | 3.5 | 12.2 | 6 | 14 | 1 | 15 |
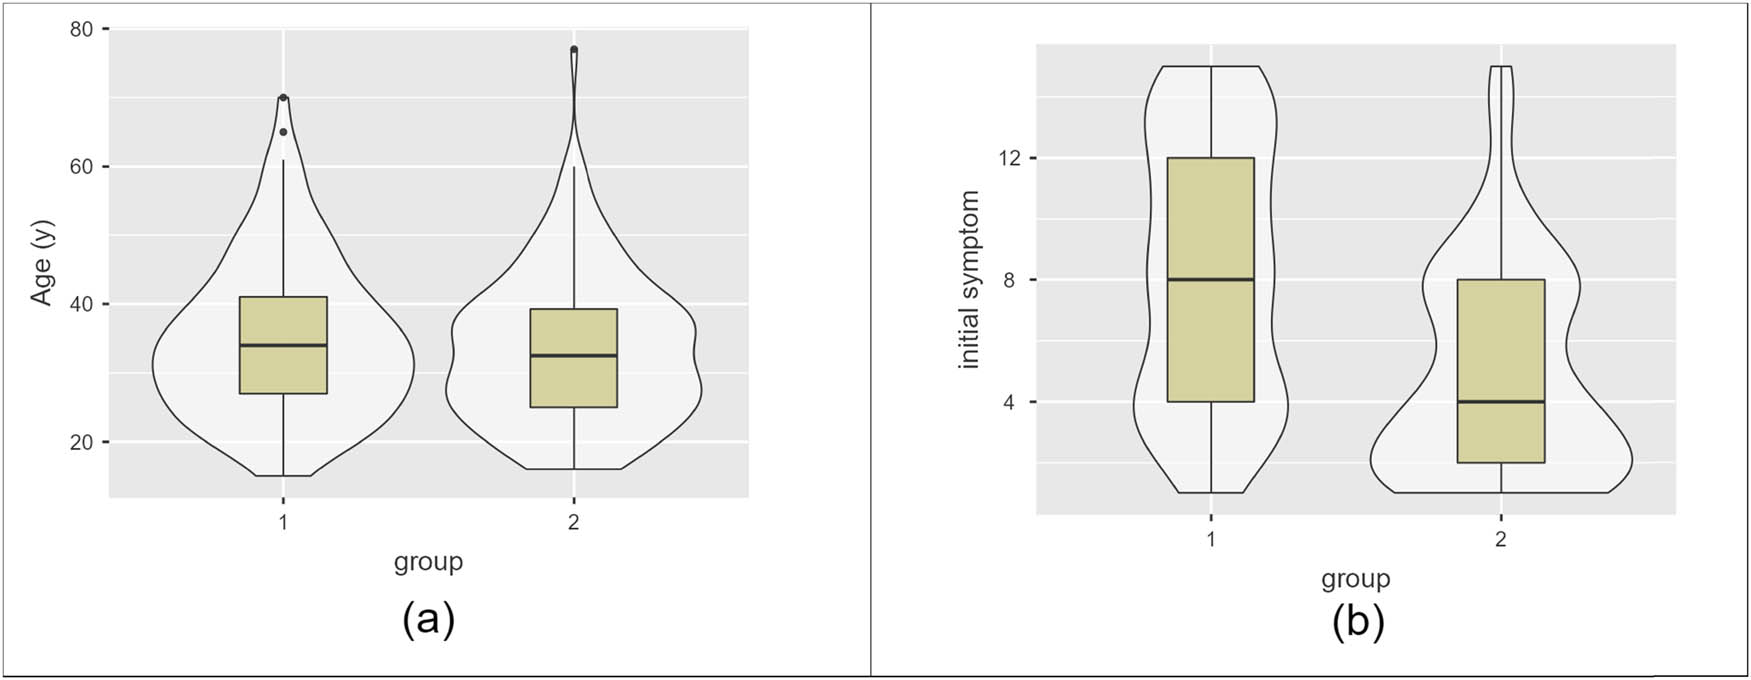
Violin plots to represent the two groups: (a) age (years) and (b) initial symptoms.
Student’s t-test
| Attribute | Test type | p |
|---|---|---|
| Age (years) | Student’s t | 0.289 |
| Initial symptom | Student’s t | <0.001 |
Since most variables are categorical, they can only be used with appropriate encoding [37]. This study utilized one hot encoding since they are efficient [38]. The continuous attributes have to be scaled before model training. This is because ML classifiers favor attributes with higher values. To prevent this, we utilized a method called “standardization.” In standardization, all the values are transformed into the range of “−1” to “1” using the respective attribute’s mean and standard deviation [39]. This dataset was immune to data imbalance since both the classes had similar instances. Hence, no data balancing technique was utilized.
Choosing the correct number of features is critical in supervised ML [40]. The accuracy decreases when unwanted features are included. In this study, mutual information was chosen for feature selection [41]. It uses the concept of “information gain” and “entropy.” When the entropy decreases, information gain increases. Figure 4 depicts the most critical attributes according to mutual information. The attributes are organized, with the best one being at the top. The figure shows that the most important attributes are “periventricular MRI,” “initial symptom,” and “infratentorial MRI.” It could also be seen that the attributes “Age,” “BAEP_Positive,” “mono or polysymptomatic unknown,” and “spinal cord MRI_Positive” do not contribute to differentiating the two classes. Hence, these features were dropped from further analysis. The data were then split into training/testing at an 80:20 ratio.
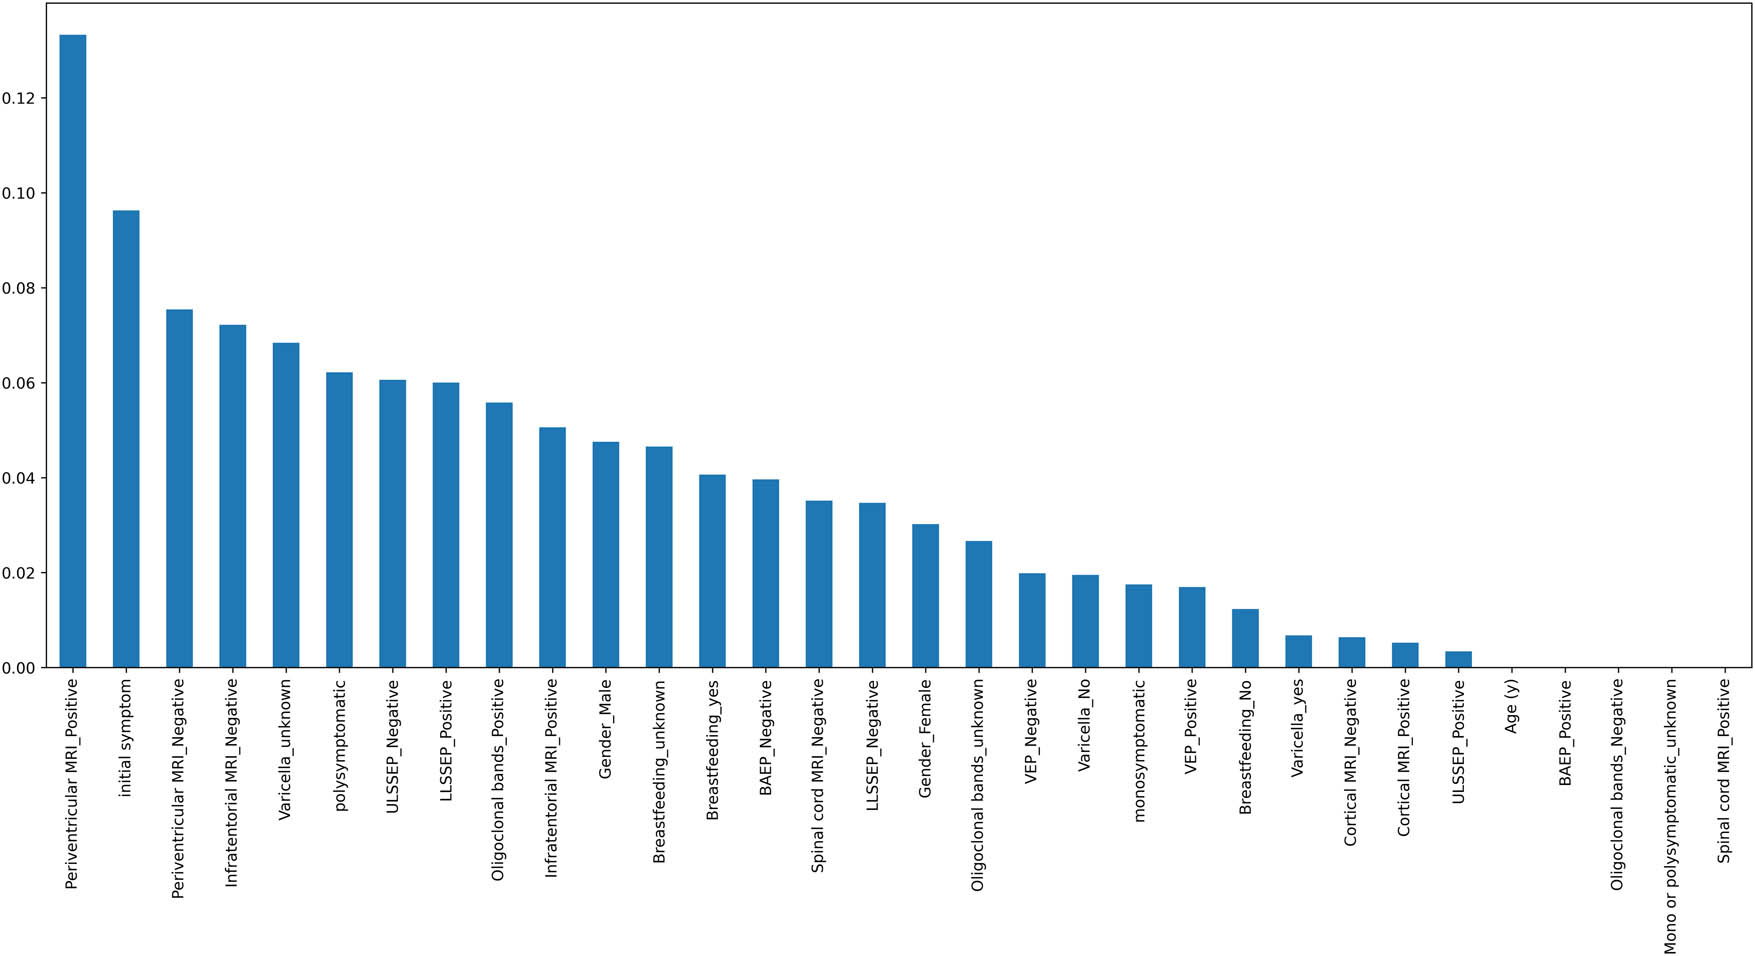
Feature selection using mutual information.
2.3 Common ML terminologies
In this research, supervised ML algorithms, including bagging, boosting, and stacking, have been used. Labelled data are utilized in supervised ML to make accurate predictions [42]. The models are trained with the results to make accurate predictions. After the training phase, the classifiers accurately predict the new data (test data). Bagging (bootstrap aggregation) is an ensemble technique integrating multiple classifiers to make accurate predictions [43]. This technique makes the predictions more robust and accurate. Further, it uses the concept of “bootstrap sampling,” in which several subsets of the original data are trained separately. Boosting is an ensemble technique, which is similar to bagging. In contrast to bagging, which trains algorithms on their own before combining them, boosting trains classifiers sequentially, with every classifier striving to fix the previous one [44]. Further, they use concepts such as weak learners, weighted training data, sequential model training, iterative processes, and combining predictions. Stacking is an ensemble technique that trains multiple classifiers using a meta-learner [45]. The meta-learner optimizes the diagnostic predictions made by the base algorithms. It is successful when the initial algorithms differ, causing various errors in the collected information. Combining such heterogeneous models also tends to surpass any single classifier and be more resilient. In this study, we have utilized eight different classifiers. The architecture of the final STACK is described in Figure 5.
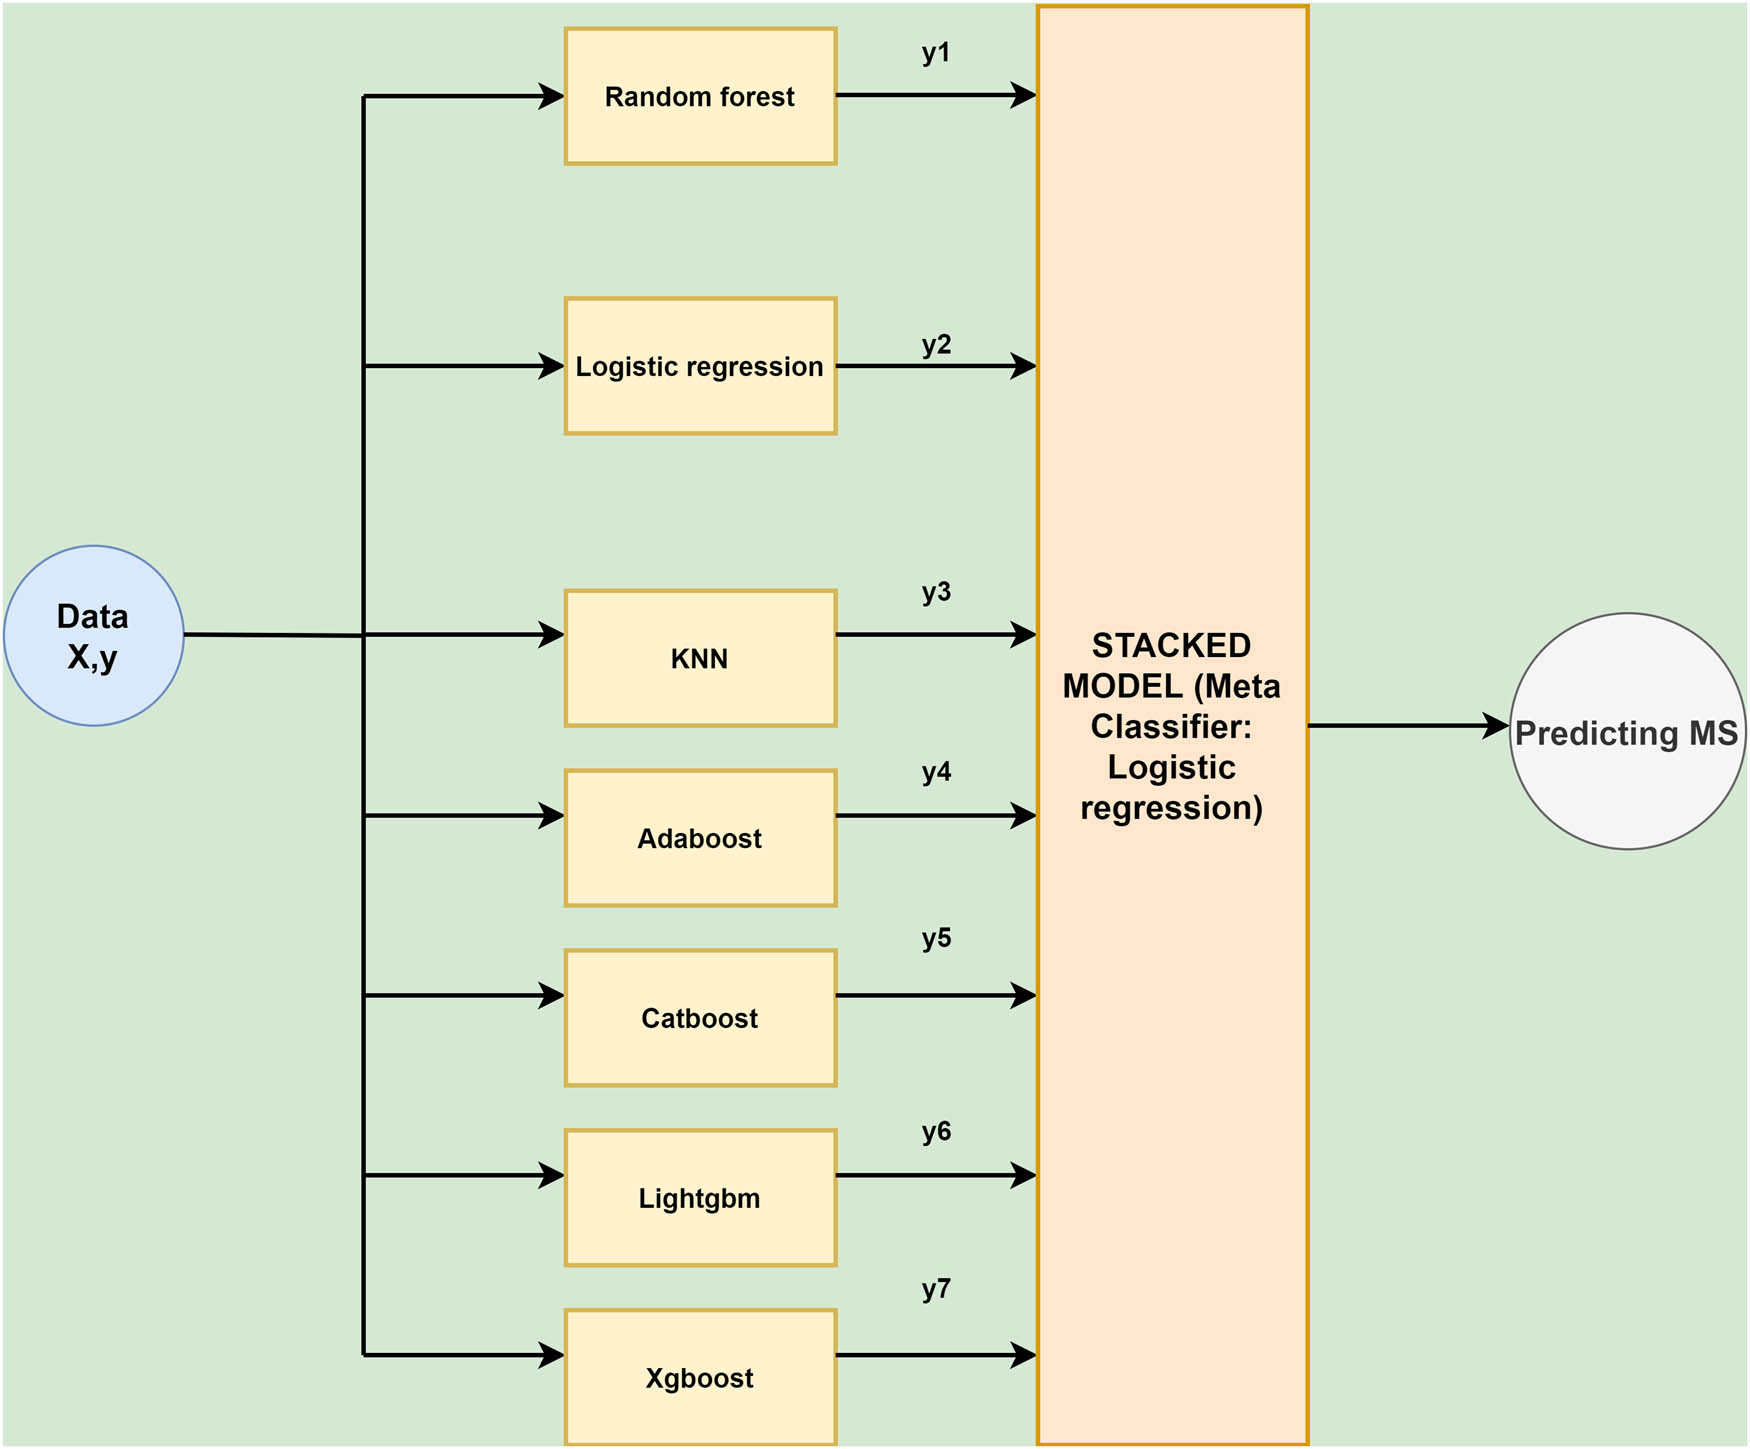
Stacking architecture utilized to predict MS.
Hyperparameter tuning is an essential step in ML [46]. The user sets hyperparameters before the beginning of model training. Choosing the best hyperparameters can optimize the results obtained by the algorithm. In this study, three hyperparameter tuning techniques have been utilized. They are grid search, randomized search, and Bayesian optimization search. To identify the most effective combinations, grid search extensively looks through a subset of hyperparameters [47]. While grid search comprehensively explores hyperparameter combinations, often proving effective but time-consuming, random search offers potentially faster optimization for large datasets by sampling combinations randomly [48]. In Bayesian optimization, the objective function is modelled using probabilistic combinations and is known to generate promising hyperparameters [49].
Deep learning is an aspect of ML. It entails teaching artificial neural networks to acquire knowledge from information, which is motivated by the anatomy and workings of the brain [50]. A neural network has many layers, including input, output, and hidden layers. The output of the previous layer serves as input for the next layer. Every layer contains neurons that activate based on the specific input. LSTMs are recurrent networks that work on sequential data [51]. It consists of a memory cell and many gates, such as input, output, and forget gates. Its ability to completely avoid the vanishing gradient issue is its biggest strength [51].
XAI makes the models interpretable. It uses various algorithms and visualization techniques to interpret the predictions [12,13]. It can be beneficial in fields such as healthcare and medicine. In this study, SHAP, LIME, Eli5, and QLattice explainers have been utilized. SHAP uses Shapley values based on cooperative game theory, where each player is assigned points based on their combination [52]. SHAP can be utilized for global transparency. Various plots, such as beeswarm, force, summary, and dependence plots, are easily obtained using this algorithm. LIME is an explainer that uses linear regression to make local explanations [53]. It is model-agnostic and can be used to demystify any model. Eli5 is a Python package used to understand the importance of the features [54]. It uses the concept of bias and tree-based learners to make predictions. QLattice was developed by a company Abzu. It uses quantum computing principles to generate valuable explanations [55]. The above four explainers have been utilized to understand the predictions. Various classification and loss metrics have been utilized to test the efficiency of the models, as described in Table 5. The process flow model of this study is pictorially depicted in Figure 6.
Classification and loss metrics
| Metric | Meaning | Formula |
|---|---|---|
| Accuracy | It calculates the percentage of instances that were rightly classified among all instances |
|
| Precision | It is a measure that determines the correctness of a classifier’s positive prediction |
|
| Recall | It is a measure that determines the model’s ability to avoid false negative results |
|
| F1-score | It balances the trade-off between recall and precision |
|
| AUC | At various points, false positive rate is plotted against the true positive rate. The area under the curve is called AUC | — |
| Precision recall (PR) curve | At various points, precision is plotted against recall | — |
| Hamming loss (HL) | It measures the percentage of labels wrongly predicted |
|
| where N is the number of instances,
|
||
| Jaccard score (JS) | It measures the similarity between true and predicted values |
|
| where
|
||
| Log loss (LL) | It assesses the efficacy of a classifier in which the predicted outcome is a probability value ranging from 0 to 1 |
|
| where
|
||
| Mathews correlation coefficient (MCC) | It is a metric that uses true positive, true negative, false positive and false negative results |
|
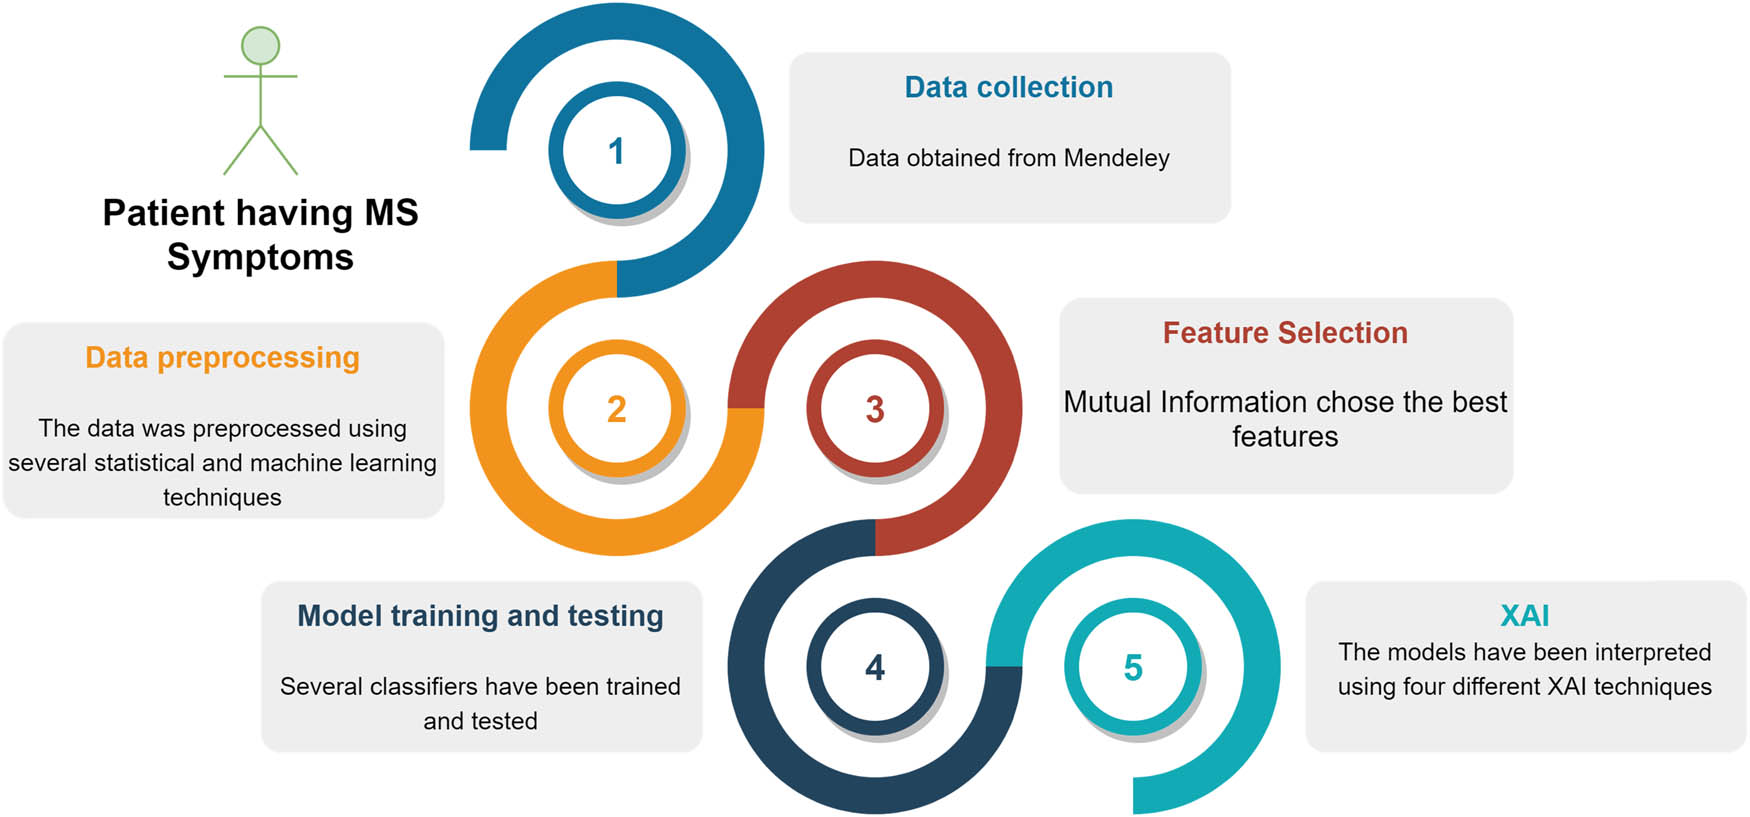
ML work flow utilized in this study.
3 Results
This section tests the various ML models using three hyperparameter tuning techniques. The results are also compared with deep learning algorithms. The diagnostic results obtained by the algorithms were further explored using four XAI methodologies. Table 6 describes the performance of all algorithms for the three search techniques. Among the three, the Bayesian optimization search technique provided the optimal results. The random forest and xgboost achieved an accuracy of 89%. The STACK attained an accuracy of 88%. The grid search technique also performed well. A maximum accuracy of 87% was obtained by logistic regression, adaboost, catboost, and lightgbm. The ensemble STACK model obtained an accuracy of 84%. When the randomized search technique was utilized, an 87% accuracy was obtained by the logistic regression, adaboost, and lightgbm models. The final STACK obtained an accuracy of 86%. Among all the models, logistic regression, catboost, and lightgbm performed well consistently. The hyperparameters chosen by every algorithm for all three search techniques are detailed in Table 7. The AUC curves for the final STACK classifier for the three search techniques are pictorially shown in Figure 7. From the figure, it can be inferred that most instances were correctly predicted. The precision–recall curves for the final STACK for the three search methods are detailed in Figure 8. From the graph, it can be inferred that the precision–recall trade-off was meagre. The confusion matrices of the final STACK for the three search techniques are detailed in Figure 9. Most cases were predicted correctly according to this metric. Further, the number of false positive cases was zero.
Classification and loss metrics
| Algorithm | Accuracy (%) | Precision (%) | Recall (%) | F1-score (%) | AUC score | PR score | HL | Jaccard score | Log loss | Mathews correlation coefficient |
|---|---|---|---|---|---|---|---|---|---|---|
| Bayesian optimization search | ||||||||||
| Random forest | 84 | 84 | 84 | 84 | 0.94 | 0.92 | 0.16 | 0.71 | 5.65 | 0.67 |
| Logistic regression | 89 | 90 | 89 | 89 | 0.98 | 0.98 | 0.10 | 0.80 | 3.67 | 0.79 |
| KNN | 85 | 87 | 85 | 86 | 0.91 | 0.85 | 0.14 | 0.75 | 5.02 | 0.72 |
| Adaboost | 80 | 80 | 80 | 80 | 0.89 | 0.91 | 0.2 | 0.66 | 6.9 | 0.60 |
| Catboost | 87 | 89 | 87 | 88 | 0.95 | 0.95 | 0.12 | 0.78 | 4.39 | 0.75 |
| Lightgbm | 87 | 89 | 89 | 89 | 0.96 | 0.96 | 0.12 | 0.78 | 4.39 | 0.77 |
| Xgboost | 89 | 91 | 90 | 90 | 0.95 | 0.95 | 0.10 | 0.81 | 3.76 | 0.80 |
| STACK | 88 | 89 | 87 | 88 | 0.95 | 0.95 | 0.10 | 0.75 | 3.02 | 0.74 |
| Grid search technique | ||||||||||
| Random forest | 85 | 86 | 86 | 85 | 0.94 | 0.93 | 0.14 | 0.75 | 5.02 | 0.71 |
| Logistic regression | 87 | 90 | 89 | 89 | 0.98 | 0.98 | 0.10 | 0.80 | 3.76 | 0.79 |
| KNN | 82 | 82 | 82 | 82 | 0.91 | 0.86 | 0.18 | 0.66 | 6.27 | 0.63 |
| Adaboost | 87 | 88 | 88 | 88 | 0.95 | 0.94 | 0.12 | 0.78 | 4.39 | 0.75 |
| Catboost | 87 | 91 | 89 | 89 | 0.95 | 0.95 | 0.12 | 0.81 | 3.76 | 0.81 |
| Lightgbm | 87 | 88 | 88 | 88 | 0.95 | 0.95 | 0.12 | 0.78 | 4.39 | 0.75 |
| Xgboost | 82 | 84 | 83 | 83 | 0.91 | 0.89 | 0.18 | 0.71 | 6.27 | 0.66 |
| STACK | 84 | 87 | 84 | 85 | 0.93 | 0.92 | 0.16 | 0.74 | 5.65 | 0.71 |
| Randomized search technique | ||||||||||
| Random forest | 84 | 84 | 84 | 84 | 0.93 | 0.92 | 0.16 | 0.71 | 5.65 | 0.67 |
| Logistic regression | 87 | 90 | 89 | 89 | 0.98 | 0.98 | 0.10 | 0.80 | 3.76 | 0.79 |
| KNN | 82 | 82 | 82 | 82 | 0.91 | 0.86 | 0.18 | 0.68 | 6.27 | 0.63 |
| Adaboost | 87 | 88 | 88 | 87 | 0.95 | 0.94 | 0.12 | 0.78 | 4.39 | 0.75 |
| Catboost | 85 | 86 | 85 | 85 | 0.96 | 0.96 | 0.14 | 0.75 | 5.02 | 0.71 |
| Lightgbm | 87 | 89 | 88 | 88 | 0.96 | 0.96 | 0.12 | 0.78 | 4.39 | 0.77 |
| Xgboost | 84 | 86 | 84 | 84 | 0.94 | 0.92 | 0.16 | 0.73 | 5.65 | 0.69 |
| STACK | 86 | 86 | 86 | 86 | 0.93 | 0.92 | 0.14 | 0.71 | 4.41 | 0.70 |
Hyperparameters chosen after utilizing various search techniques
| Algorithm | Bayesian optimization search | Grid search technique | Randomized search technique |
|---|---|---|---|
| Random forest | ([(“bootstrap,” True), (“max_depth”, 80), (“max_features”, 2), (“min_samples_leaf,” 3), (“min_samples_split,” 10), (“n_estimators,” 100)]) | {“bootstrap”: True, “max_depth”: 90, “max_features”: 3, “min_samples_leaf”: 5, “min_samples_split”: 12, ‘n_estimators’: 100} | {“n_estimators”: 200, “min_samples_split”: 8, “min_samples_leaf”: 3, “max_features”: 3, “max_depth”: 100, “bootstrap”: True} |
| Logistic regression | ([(‘C’, 100.0), (‘penalty’, ‘l2’)]) | {‘C’: 100, ‘penalty’: ‘l2’} | {‘penalty’: ‘l2’, ‘C’: 100} |
| KNN | ([(“n_neighbors”, 11)]) | {“n_neighbors”: 10} | {“n_neighbors”: 10} |
| Adaboost | ([(“learning_rate”, 1.0), (“n_estimators,” 100)]) | {“learning_rate”: 0.1, “n_estimators”: 200} | {“n_estimators”: 200, “learning_rate”: 0.1} |
| Catboost | ([(“border_count,” 5), (“depth,” 2), (“iterations,” 100), (“l2_leaf_reg,” 3), (“learning_rate,” 0.03)]) | {“border_count”: 32, “depth”: 2, “iterations”: 250, “l2_leaf_reg”: 5, “learning_rate”: 0.03} | {“learning_rate”: 0.03, “l2_leaf_reg”: 5, “iterations”: 100, “depth”: 2, “border_count”: 5} |
| Lightgbm | ([(“lambda_l1,” 1.0), (“lambda_l2,” 1), (“min_data_in_leaf,” 30), (“num_leaves”, 73), (“reg_alpha”, 0.17518207454693946)]) | {“lambda_l1”: 0, “lambda_l2”: 1, “min_data_in_leaf”: 30, “num_leaves”: 31, “reg_alpha”: 0.1} | {“reg_alpha”: 0.1, “num_leaves”: 127, “min_data_in_leaf”: 30, “lambda_l2”: 1, “lambda_l1”: 1} |
| Xgboost | ([(“colsample_bytree,” 0.3996609000006196), (“gamma,” 0.2), (“learning_rate,” 0.15), (“max_depth,” 8), (“min_child_weight,” 5)]) | {“colsample_bytree”: 0.4, “gamma”: 0.2, “learning_rate”: 0.05, “max_depth”: 6, “min_child_weight”: 1} | {“min_child_weight”: 3, “max_depth”: 6, “learning_rate”: 0.15, “gamma”: 0.0, “colsample_bytree”: 0.4} |
| STACK | use_probas = True, average_probas = False, meta_classifier = logistic regression | use_probas = True, average_probas = False, meta_classifier = logistic regression | use_probas = True, average_probas = False, meta_classifier = logistic regression |

AUC curves: (a) Bayesian optimization search, (b) grid search, and (c) randomized search.

Precision–recall curves: (a) Bayesian optimization search, (b) grid search, and (c) randomized search.

Confusion matrices: (a) Bayesian optimization search, (b) grid search, and (c) randomized search.
Two deep learning models (DNN and LSTM) were also tested. Figure 10 describes the architecture of the two models. The results and the hyperparameters used are tabulated in Table 8. Among the two, DNN performed better, with an accuracy of 80%. In this study, the ML classifiers outperformed deep learning networks. This is observed in many studies when the sample size is small. DNNs thrive when vast amounts of data are available to them. Further, the accuracy and loss curves for the predictors are described in Figure 11. Since the deviation in training and validation accuracy/loss was very less, it can be inferred that overfitting was minimal.
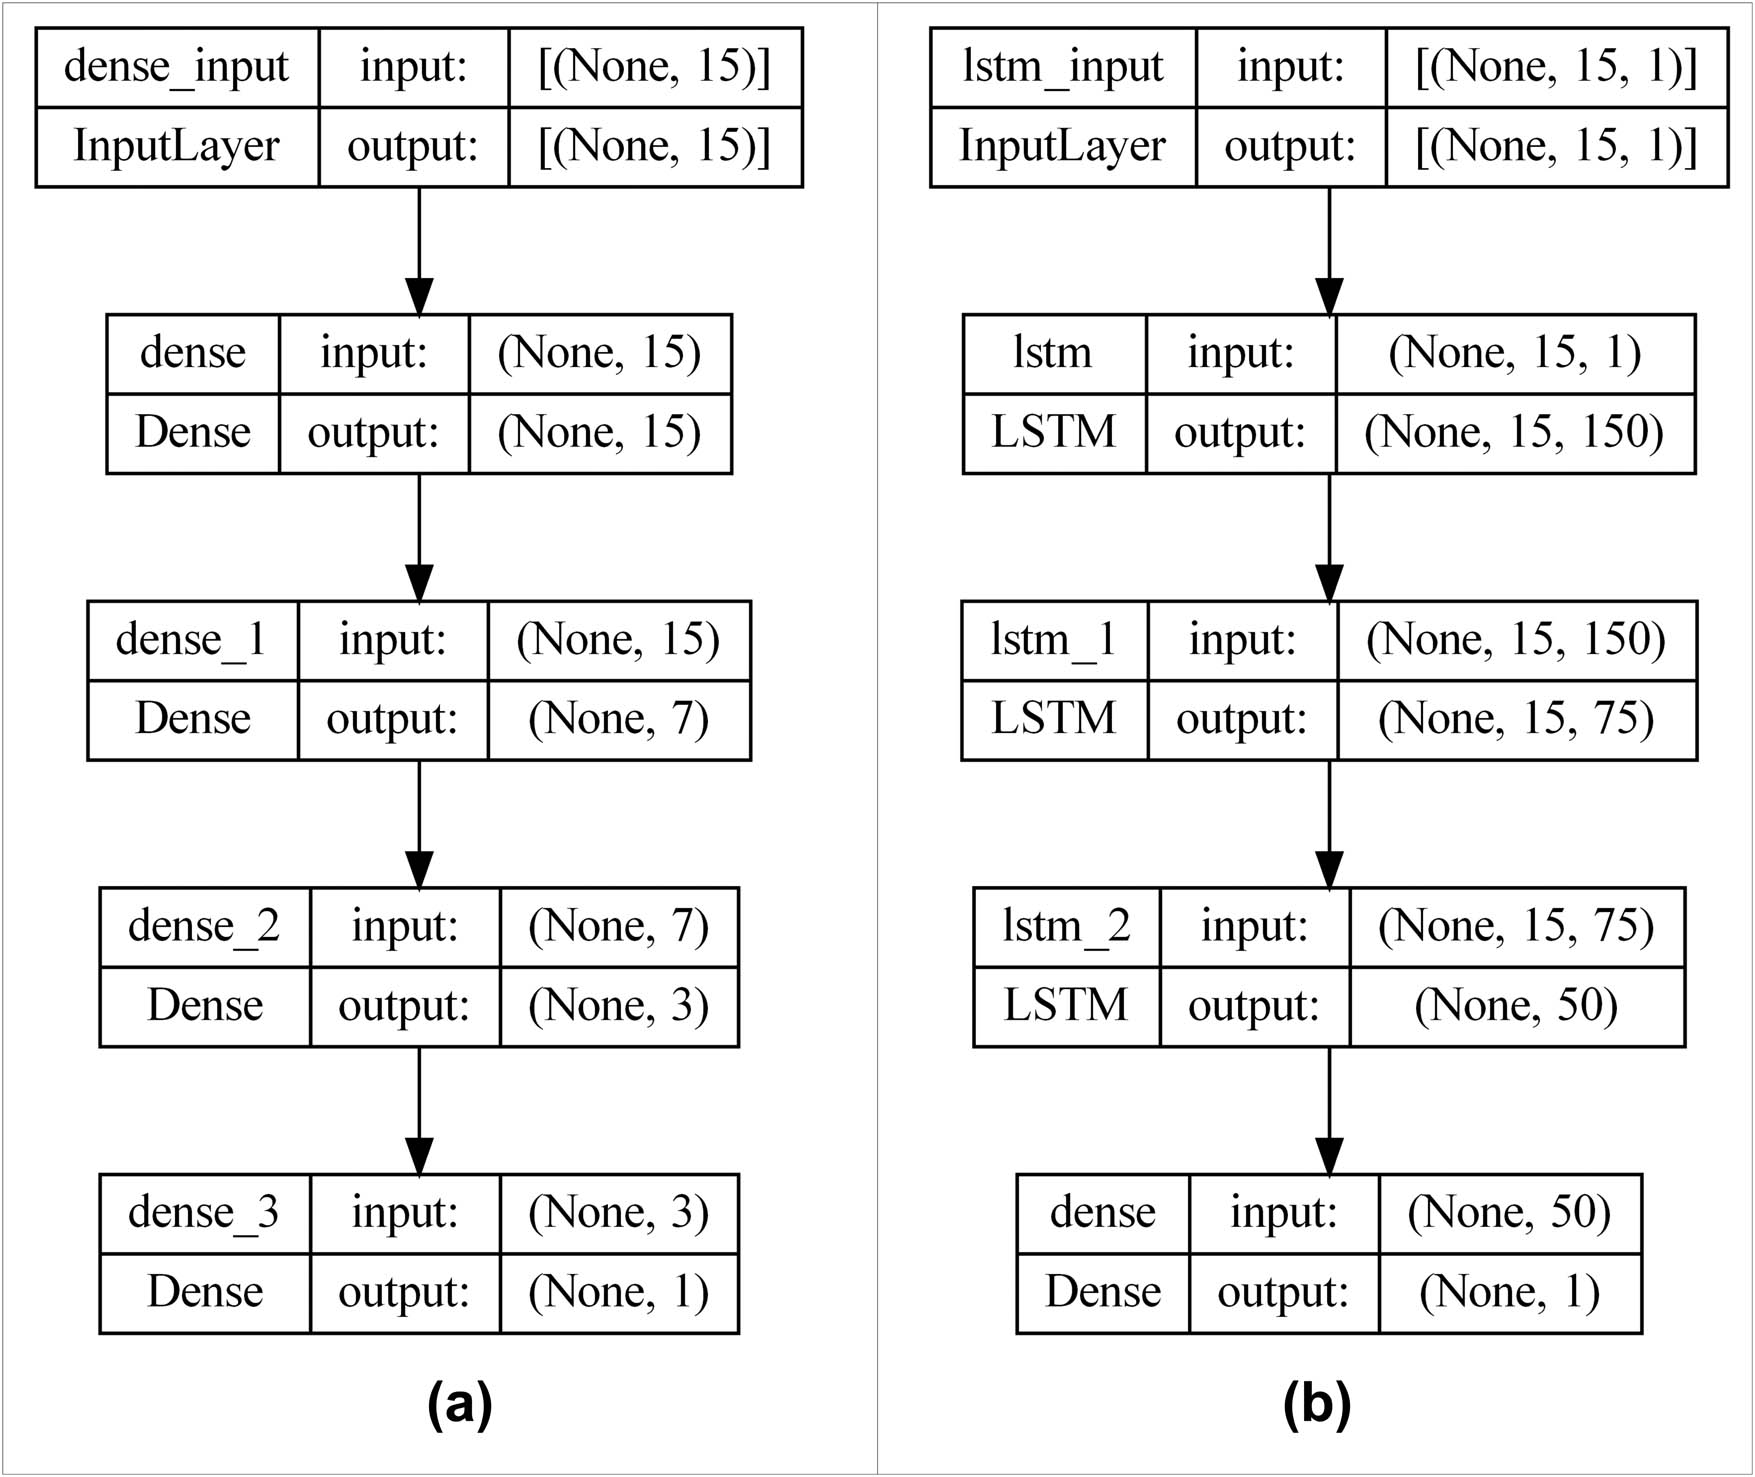
Architecture of deep learning models: (a) DNN and (b) LSTM.
Results obtained by deep learning classifiers
| Algorithm | Accuracy | Precision | Recall | F1-score | Hamming loss | Jaccard score | Log loss | Mathews correlation coefficient | Hyperparameters |
|---|---|---|---|---|---|---|---|---|---|
| DNN | 80 | 80 | 82 | 81 | 0.2 | 0.67 | 7.16 | 0.58 | Optimizer: Adam, loss function: binary cross-entropy, learning rate: 0.0001, batch size: 10, epochs:750, number of layers: 4, neurons:15, 7, 3, 1 |
| LSTM | 75 | 76 | 74 | 75 | 0.4 | 0.58 | 9.6 | 0.44 | Epochs: 200, batch size: 32, optimizer: Adam, loss function: binary cross-entropy, number of layers: 3, neurons: 150, 75, 50, 1 |
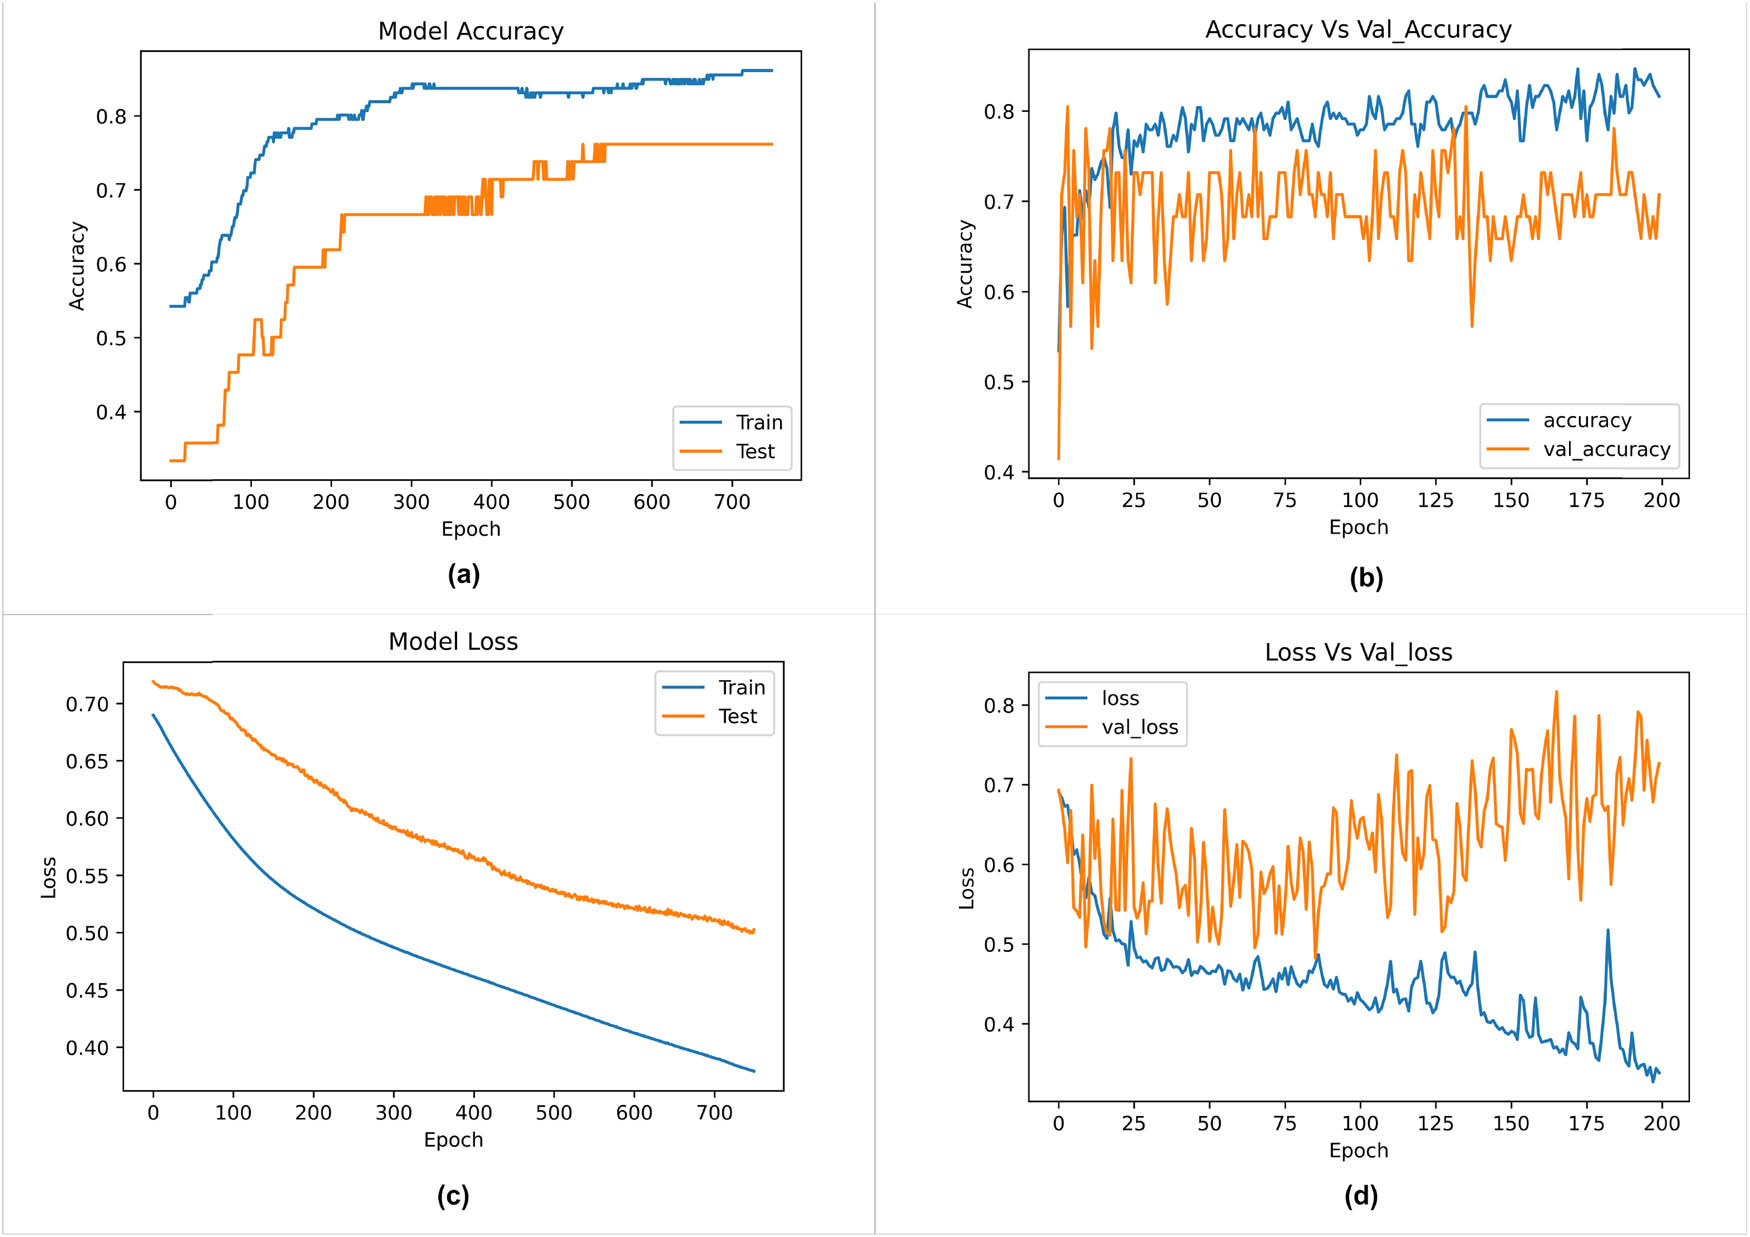
Accuracy/loss curves: (a) accuracy curve of DNN, (b) accuracy curve of LSTM, (c) loss curve of DNN, and (d) loss curve of LSTM.
The predictions made by the above models were deciphered using four explainers. The first explainer used was SHAP. Figure 12 describes the mean bar plots obtained by the SHAP explainer. The best features are at the top, and the least important are at the bottom. The graphs show that the critical markers are periventricular MRI, initial symptoms, oligoclonal bands, infratentorial MRI, and age. SHAP is also utilized to decrypt local interpretations. Figure 13 depicts the force plots for all positively predicted MS patients. It can be seen that markers such as infratentorial MRI, oligoclonal bands, varicella, and breastfeeding push the markers toward a positive diagnosis.
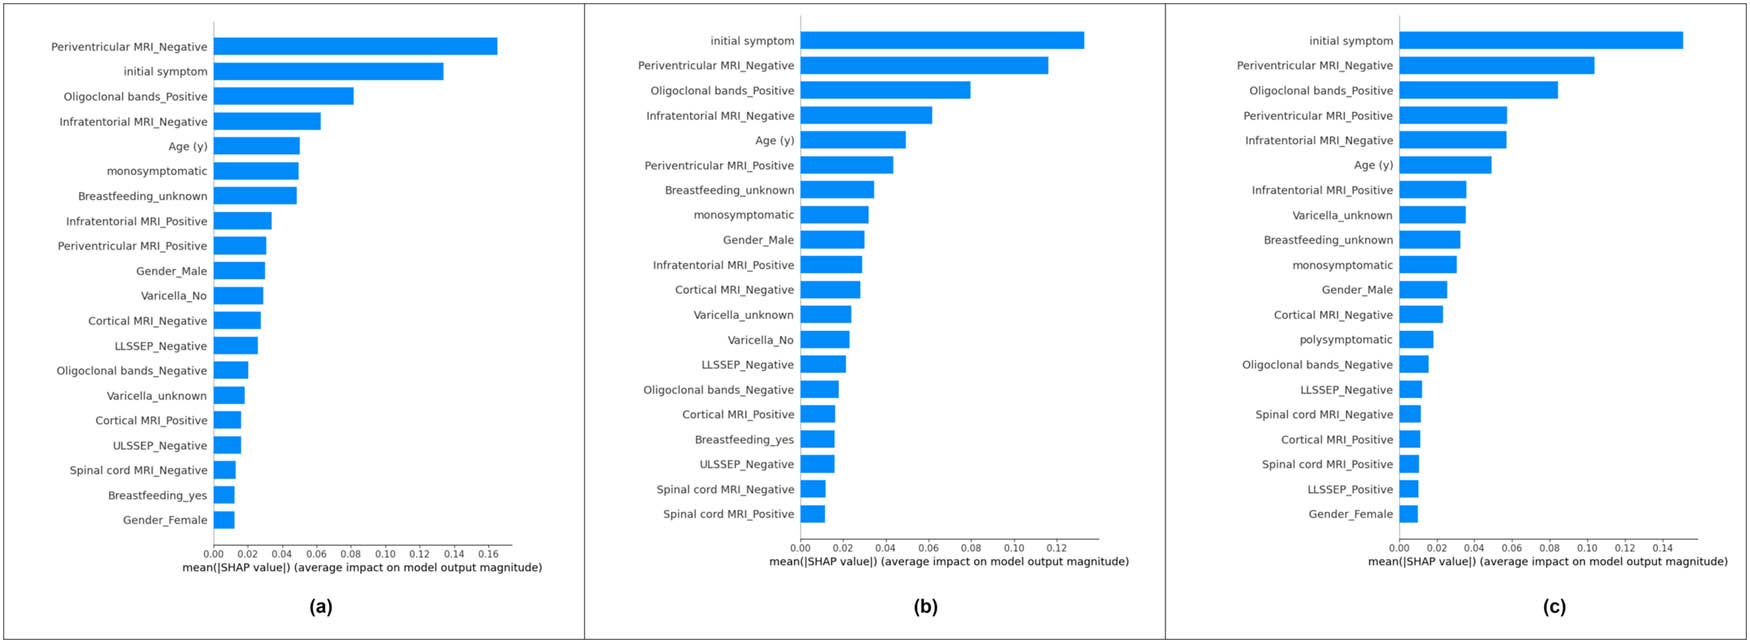
SHAP mean bar plots: (a) Bayesian optimization search, (b) grid search, and (c) randomized search.
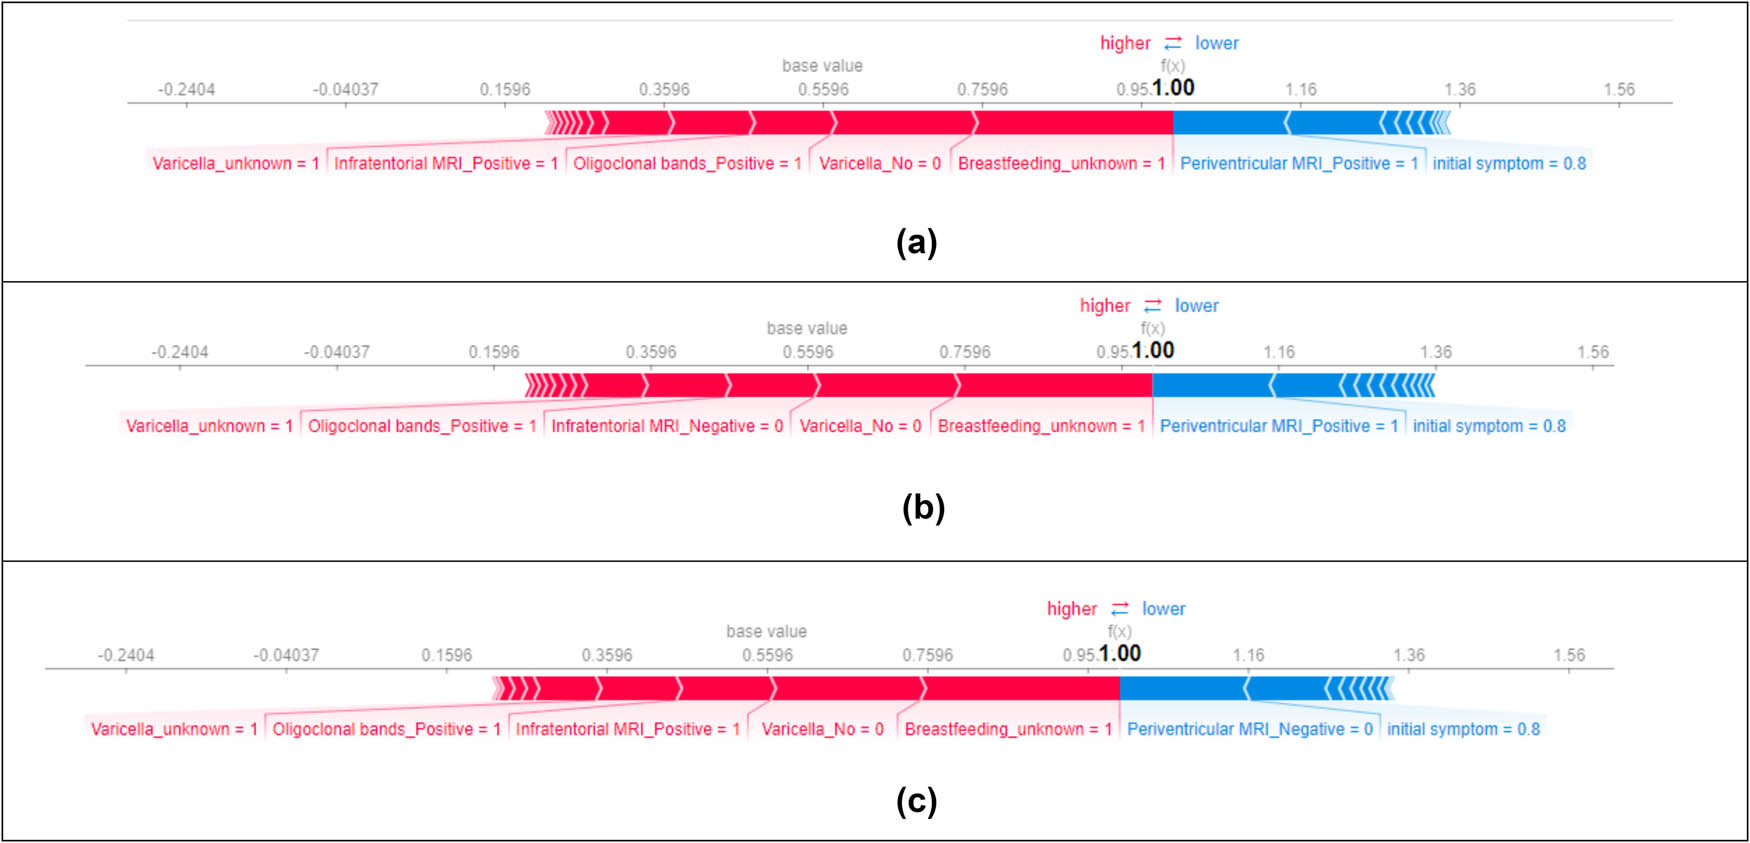
SHAP force plots: (a) Bayesian optimization search, (b) grid search, and (c) randomized search.
LIME was utilized to understand the marker variation. Figure 14 depicts the LIME plots for all three search techniques. Figure 12(a) indicates a negative diagnosis and Figure 12(b) and (c) indicates a positive diagnosis. Markers such as periventricular MRI, initial symptoms, oligoclonal bands, and infratentorial MRI were considered necessary by the LIME explainer.
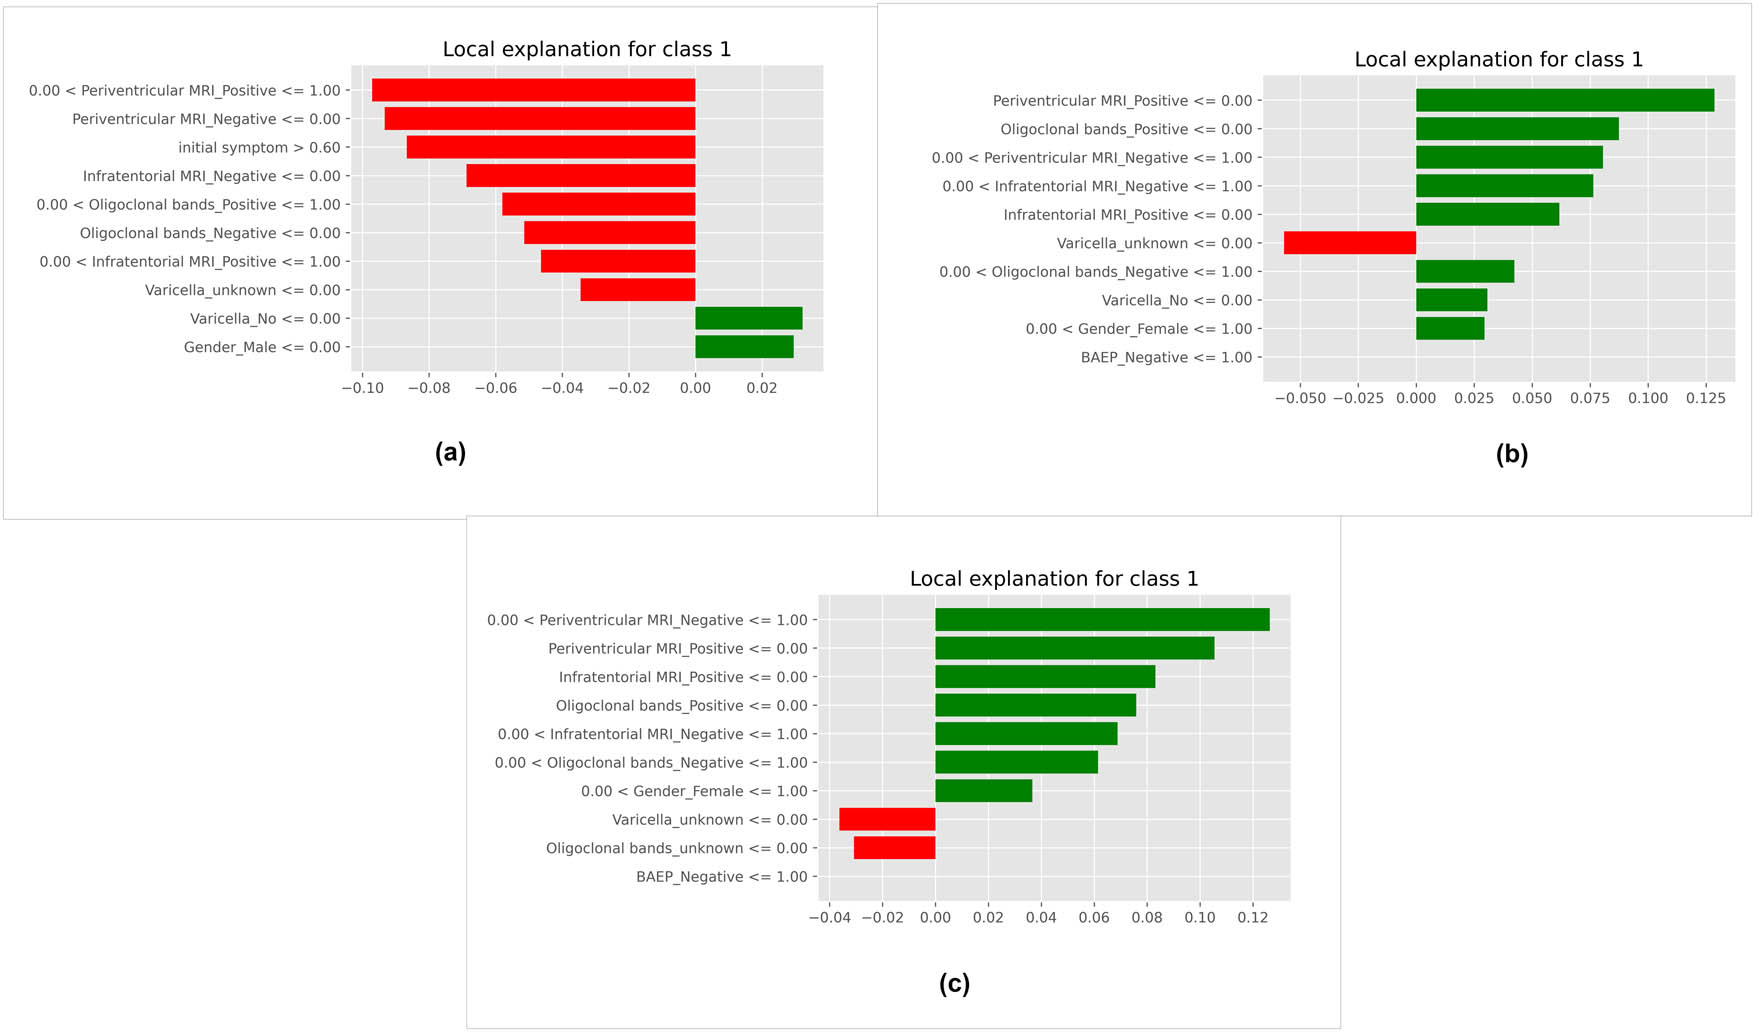
LIME interpretation: (a) Bayesian optimization search, (b) grid search, and (c) randomized search.
Eli5 was the third following explainer used, and its interpretations are described in Figure 15. According to Eli5, spinal cord MRI, breastfeeding, oligoclonal bands, and periventricular MRI were considered crucial.
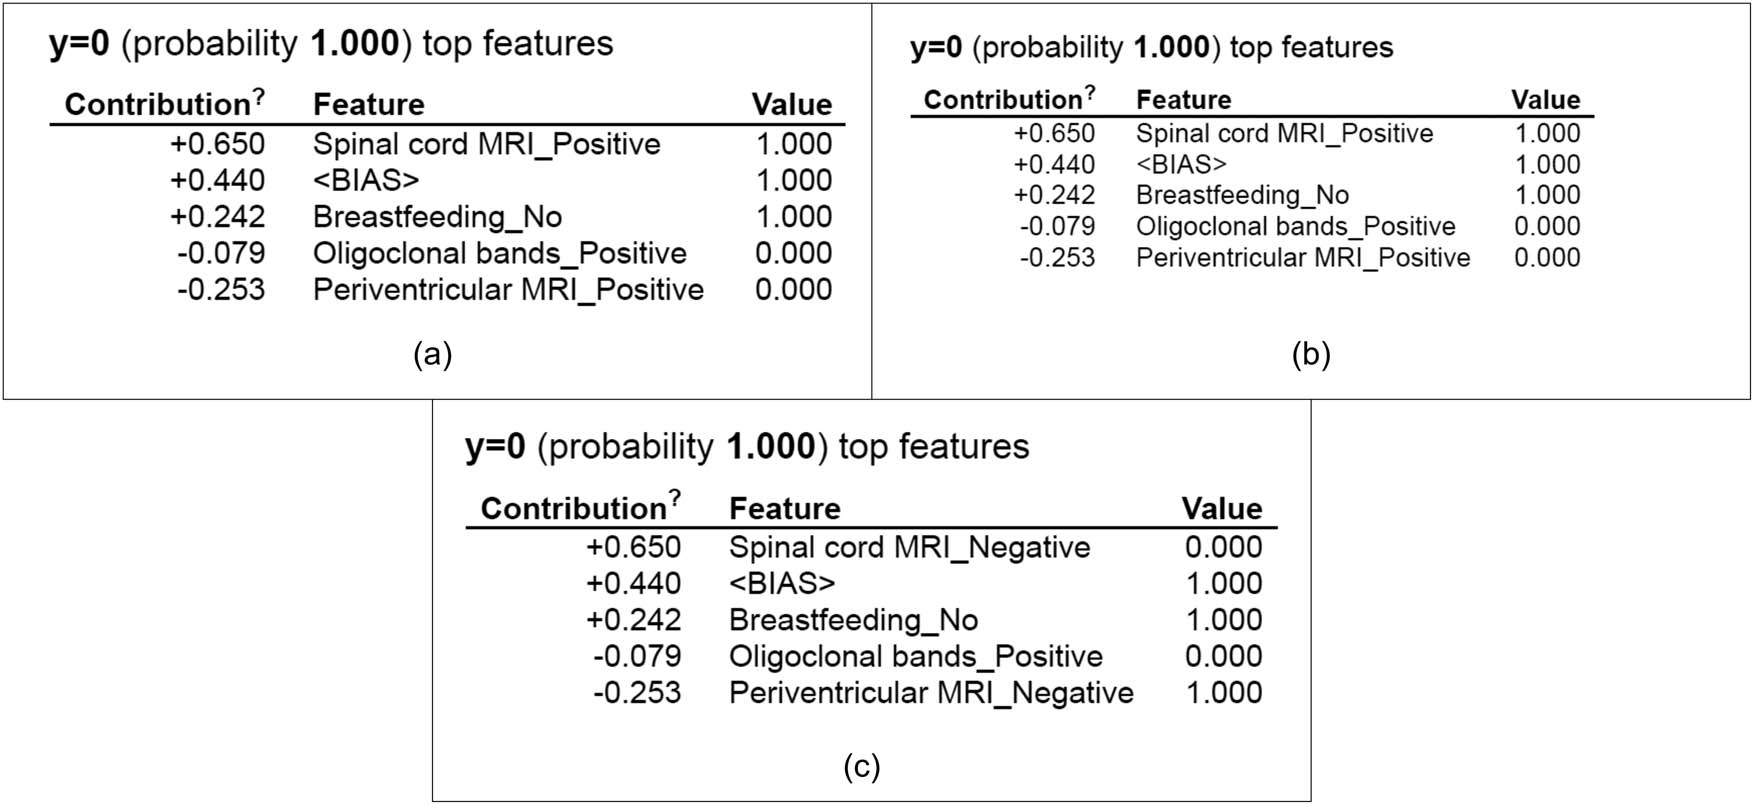
Eli5 interpretation: (a) Bayesian optimization search, (b) grid search, and (c) randomized search.
Finally, the quantum lattice model was utilized. The QGraphs generated by it are described in Figure 16. According to it, periventricular MRI, infratentorial MRI, and oligoclonal bands were considered as deciding factors. It also made use of addition and multiplication activation functions.
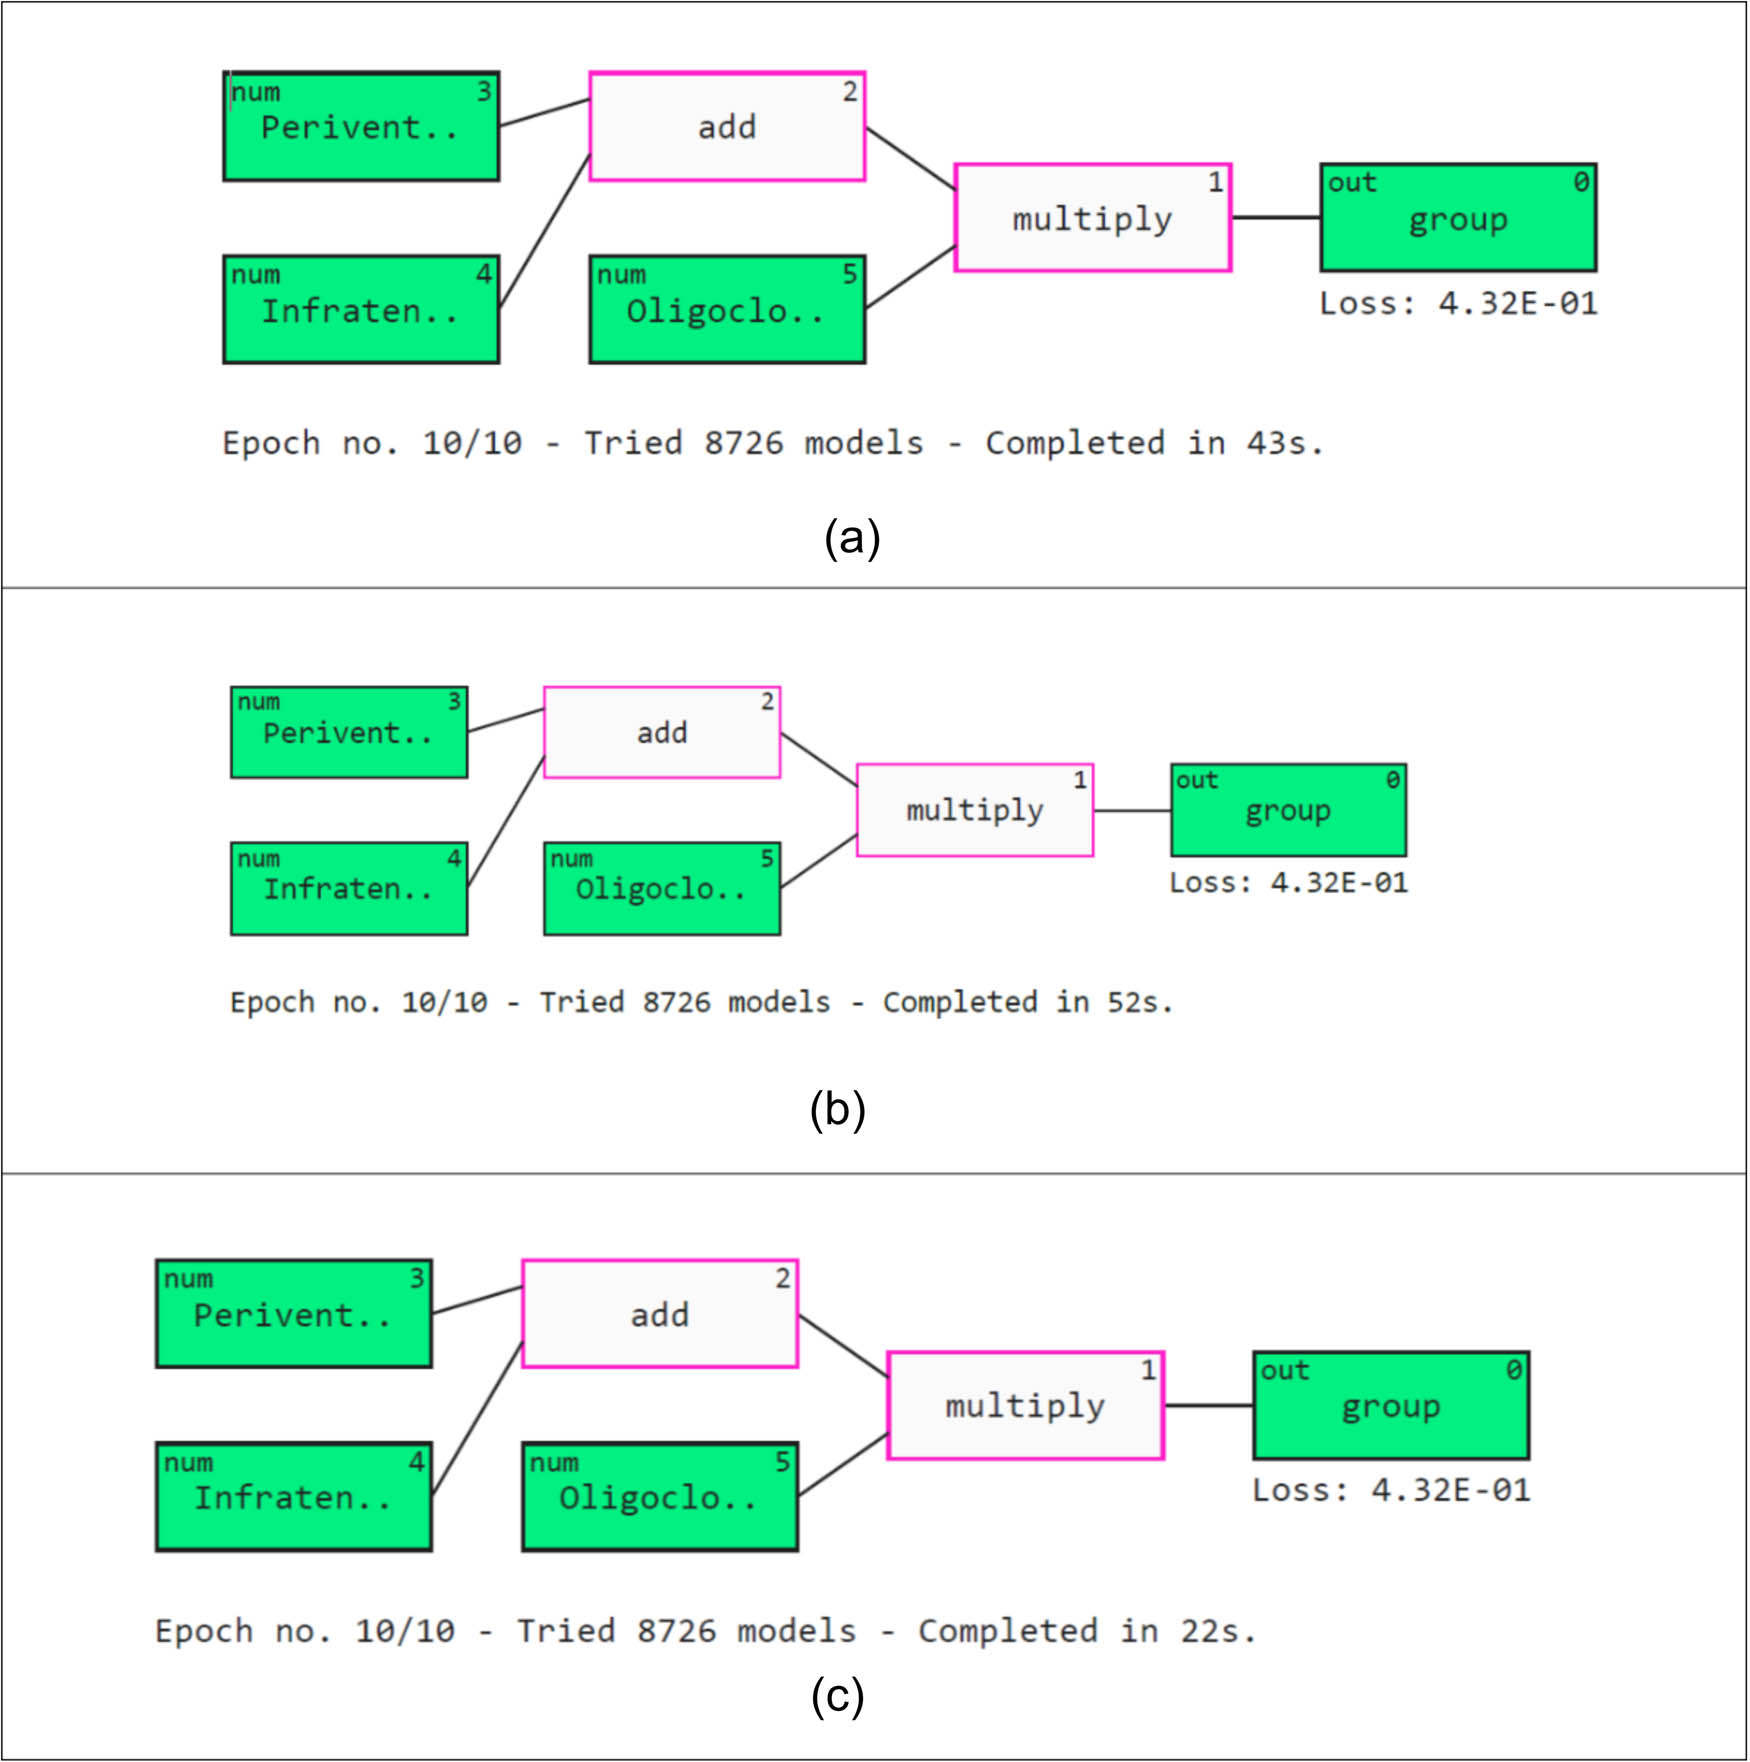
QLattice interpretation: (a) Bayesian optimization search, (b) grid search, and (c) randomized search.
Four explainers were used, and according to them, periventricular MRI, infratentorial MRI, oligoclonal bands, spinal cord MRI, breastfeeding, varicella, and initial symptoms were crucial in identifying MS. These markers can be used along with the ML classifiers to detect this disease accurately.
4 Discussion
This research made use of multiple ML techniques to predict MS in patients. The dataset was obtained from a public data repository called Mendeley. Initially, we performed statistical analysis, preprocessing, and feature selection. Further, several classifiers were utilized for prediction, including a customized STACK architecture. Three searching techniques were utilized to choose the best hyperparameters. The highest accuracy of 89% was achieved by the logistic regression and xgboost model when the Bayesian optimization search technique was used. The predictions made by the ML algorithms were also compared with two deep learning models. Since the dataset was small, deep learning classifiers could not perform better than ML models. The results were also interpreted using multiple XAI methods. According to them, periventricular MRI, infratentorial MRI, oligoclonal bands, spinal cord MRI, breastfeeding, varicella, and initial symptoms were critical in detecting MS. A description of the above markers concerning MS is described below.
Periventricular MRI is necessary when diagnosing MS [30]. Lesions of the periventricular region of the brain are often found in MS patients. Demyelinating lesions, which harm or eliminate the protective layer of myelin, may show up as bright spots during the MRI scan. The region below the tentorium cerebelli (cerebellum, brain stem) is scanned in infratentorial MRI [32]. In the case of MS, an infratentorial MRI is used to find lesions in the lower regions of the central nervous system. The brain produces oligoclonal bands in patients with MS and other neurological conditions [25]. This marker can be captured using a unique technique named isoelectric focusing. Lesions are also found in the spinal cord in MS patients. This can be detected using the spinal cord MRI. The extent and severity of MS can also be detected using this method. According to many studies, breastfeeding can lower the occurrence of MS in women [56]. Research suggests that hormonal changes during breastfeeding, particularly elevated prolactin levels, might enhance immune function and potentially reduce the risk of developing MS. Similarly, studies hint at a potential link between varicella infection and MS development. Varicella, also known as chickenpox, is known to trigger/contribute to MS in some patients [23]. Initial symptoms observed in MS patients include visual, sensor, and motor-based variations. According to many studies, the combination of the above markers can be instrumental in diagnosing MS.
Several studies have used ML for MS. However, most research has focused on disease progression, and diagnosis using clinical markers has yet to be explored. Further, most ML studies have yet to utilize XAI to interpret the results. Hu et al. [20] used gait markers to diagnose this condition. Eleven markers were obtained using various embedded sensors. The SVM acquired an accuracy of 81%. Seccia et al. [18] utilized a deep learning approach for MS diagnosis. Genomic data from 144 individuals were considered for this research. The artificial neural network obtained an accuracy of 79%. In another research, OCT images were used to diagnose this deadly disease [57]. The number of patients considered in this study was 212. The ensemble classifier obtained an accuracy of 87.7%. The comparison of our research with the above studies is presented in Table 9.
Comparison of our study in diagnosing MS with AI
| Reference | Dataset type | Best accuracy (%) | XAI models |
|---|---|---|---|
| [20] | Gait data | 81 | — |
| [18] | Genomic data | 79 | — |
| [57] | OCT data | 87.7 | — |
| Our study | Clinical markers and MRI results | 89 | SHAP, LIME, Eli5, and QLattice |
To enhance the quality of the research, it would have been beneficial to augment the pool of patient data samples. AI algorithms necessitate a substantial amount of data to produce accurate results, yet this study only utilized 273 samples. Moreover, the researchers did not incorporate unsupervised and reinforcement learning algorithms, which would have provided a basis for comparison with the supervised learning models mentioned earlier. Unsupervised and reinforcement learning algorithms were not utilized in this research. The above classifiers could be used and compared with the supervised learning models. A few clinical markers can vary because of other conditions, too. Hence, multiple modalities, such as gait, genomic, and OCT data, could be combined in the future. The doctors did not perform medical validation in this study. Medical validation is essential before deploying the models in real-time in healthcare facilities. In the future, to revolutionize MS research, it is crucial to establish a reliable, cloud-based data infrastructure that integrates a wide range of datasets from hospitals worldwide while prioritizing patient privacy through implementing strong data governance and anonymization measures.
5 Conclusion
This study diagnosed MS in patients using several machine-learning classifiers. In MS, the brain’s cognitive function is severely affected due to the damage caused to myelin (a protective layer that protects the nerves). MS is a complex disease to diagnose, and a series of tests such as medical history and physical examination, MRI scans, lumbar puncture, evoked potentials, blood tests, and clinical presentations are used for disease detection. Therefore, an alternative diagnosis method using AI is proposed in this research. Several classifiers, including a customized STACK model, were trained and tested, and most models performed well in differentiating MS from other conditions. The results were also demystified using various XAI techniques. According to them, important markers were periventricular MRI, infratentorial MRI, oligoclonal bands, spinal cord MRI, breastfeeding, varicella, and initial symptoms. The combination of these markers and ML could be used in identifying this deadly illness.
Acknowledgements
We would like to thank the Manipal Academy of Higher Education for giving us a platform to conduct this study.
-
Funding information: Authors state no funding was involved.
-
Author contributions: KC performed the experiments and wrote the first draft, VVK helped with the experiments and revised the manuscript, SP and NS conceptualized the idea and validated the experiments, RC performed the simulations, and AP helped in designing the experiments.
-
Conflict of interest: Authors state no conflicts of interests.
-
Ethical clearance: Not applicable.
-
Informed consent: Not applicable.
-
Data availability statement: The datasets analysed during the current study is available in Mendeley repository. https://data.mendeley.com/datasets/8wk5hjx7x2.
References
[1] Sospedra M, Martin R. Immunology of multiple sclerosis. SemNeurol. Apr. 2016;36(2):115–27. 10.1055/s-0036-1579739.Search in Google Scholar PubMed
[2] Yamout B. Diagnosis and treatment of multiple sclerosis: MENACTRIMS consensus guidelines. Multiple Scler Relat Disord. Nov. 2014;3(6):766. 10.1016/j.msard.2014.09.010.Search in Google Scholar
[3] Martinsen V, Kursula P. Multiple sclerosis and myelin basic protein: insights into protein disorder and disease. Amino Acids. Dec. 2021;54(1):99–109. 10.1007/s00726-021-03111-7.Search in Google Scholar PubMed PubMed Central
[4] Kyryliuk S. Autoantibodies to myelin basic protein and histone H1 as immune biomarkers of neuropsychological disorders in patients with multiple sclerosis. Ukr Biochem J. Dec. 2020;92(6):77–84. 10.15407/ubj92.06.077.Search in Google Scholar
[5] Makhani N, Tremlett H. The multiple sclerosis prodrome. Nat Rev Neurol. Jun. 2021;17(8):515–21. 10.1038/s41582-021-00519-3.Search in Google Scholar PubMed PubMed Central
[6] Soldan SS, Lieberman PM. Epstein–Barr virus and multiple sclerosis. Nat Rev Microbiol. Aug. 2022;21:1–14. 10.1038/s41579-022-00770-5.Search in Google Scholar PubMed PubMed Central
[7] Feige J, Moser T, Bieler L, Schwenker K, Hauer L, Sellner J. Vitamin D supplementation in multiple sclerosis: A critical analysis of potentials and threats. Nutrients. Mar. 2020;12(3):783. 10.3390/nu12030783.Search in Google Scholar PubMed PubMed Central
[8] Kołtuniuk A, Kazimierska-Zając M, Cisek K, Chojdak-Łukasiewicz J. The role of stress perception and coping with stress and the quality of life among multiple sclerosis patients. Psychol Res Behav Manag. Jun. 2021;14:805–15. 10.2147/prbm.s31066.Search in Google Scholar
[9] Hauser SL, Cree BAC. Treatment of multiple sclerosis: A review. Am J Med. Dec. 2020;133(12):1380–90. 10.1016/j.amjmed.2020.05.049.Search in Google Scholar PubMed PubMed Central
[10] Meca-Lallana V, Gascón-Giménez F, Ginestal-López RC, Higueras Y, Téllez-Lara N, Carreres-Polo J, et al. Cognitive impairment in multiple sclerosis: diagnosis and monitoring. Neurol Sci. Apr. 2021;42(12):5183–93. 10.1007/s10072-021-05165-7.Search in Google Scholar PubMed PubMed Central
[11] Rajpurkar P, Chen E, Banerjee O, Topol EJ. AI in health and medicine. Nat Med. Jan. 2022;28(1):31–8. 10.1038/s41591-021-01614-0.Search in Google Scholar PubMed
[12] Durán JM. Dissecting scientific explanation in AI (sXAI): A case for medicine and healthcare. Artif Intell. Aug. 2021;297:103498. 10.1016/j.artint.2021.103498.Search in Google Scholar
[13] Yagin FH, Alkhateeb A, Raza A, Samee NA, Mahmoud NF, Colak C, et al. An explainable artificial intelligence model proposed for the prediction of myalgic encephalomyelitis/chronic fatigue syndrome and the identification of distinctive metabolites. Diagnostics. 2023 Nov;13(23):3495. 10.3390/diagnostics13233495.Search in Google Scholar PubMed PubMed Central
[14] Law MT, Traboulsee AL, Li DK, Carruthers RL, Freedman MS, Kolind SH, et al. Machine learning in secondary progressive multiple sclerosis: an improved predictive model for short-term disability progression. Multiple Scler J – Exp Transl Clin. Oct. 2019;5(4):205521731988598. 10.1177/2055217319885983.Search in Google Scholar PubMed PubMed Central
[15] Yamin MA, Valsasina P, Tessadori J, Filippi M, Murino V, Rocca MA, et al. Discovering functional connectivity features characterizing multiple sclerosis phenotypes using explainable artificial intelligence. Hum Brain Mapp. Jan. 2023;44(6):2294–306. 10.1002/hbm.26210.Search in Google Scholar PubMed PubMed Central
[16] Zhao Y, Healy BC, Rotstein D, Guttmann CR, Bakshi R, Weiner HL, et al. Exploration of machine learning techniques in predicting multiple sclerosis disease course. PLOS ONE. Apr. 2017;12(4):e0174866. 10.1371/journal.pone.0174866.Search in Google Scholar PubMed PubMed Central
[17] Denissen S, Chén OY, De Mey J, De Vos M, Van Schependom J, Sima DM, et al. Towards multimodal machine learning prediction of individual cognitive evolution in multiple sclerosis. J Pers Med. Dec. 2021;11(12):1349. 10.3390/jpm11121349.Search in Google Scholar PubMed PubMed Central
[18] Seccia R, Romano S, Salvetti M, Crisanti A, Palagi L, Grassi F. Machine learning use for prognostic purposes in multiple sclerosis. Life. Feb. 2021;11(2):122. 10.3390/life11020122.Search in Google Scholar PubMed PubMed Central
[19] Tommasin S, Cocozza S, Taloni A, Giannì C, Petsas N, Pontillo G, et al. Machine learning classifier to identify clinical and radiological features relevant to disability progression in multiple sclerosis. J Neurol. Dec. 2021;268(12):4834–45. 10.1007/s00415-021-10605-7.Search in Google Scholar PubMed PubMed Central
[20] Hu W, Combden O, Jiang X, Buragadda S, Newell CJ, Williams MC, et al. Machine learning classification of multiple sclerosis patients based on raw data from an instrumented walkway. Biomed Eng Online. Mar. 2022;21(1):21. 10.1186/s12938-022-00992-x.Search in Google Scholar PubMed PubMed Central
[21] Pinto MF, Oliveira H, Batista S, Cruz L, Pinto M, Correia I, et al. Prediction of disease progression and outcomes in multiple sclerosis with machine learning. Sci Rep. Dec. 2020;10(1):21038. 10.1038/s41598-020-78212-6.Search in Google Scholar PubMed PubMed Central
[22] Benjamin P, et al. Conversion predictors of Clinically Isolated Syndrome to Multiple Sclerosis in Mexican patients: a prospective study. Mendeley Data, V1. 10.17632/8wk5hjx7x2.1.Search in Google Scholar
[23] Rice EM, Thakolwiboon S, Avila M. Geographic heterogeneity in the association of varicella-zoster virus seropositivity and multiple sclerosis: A systematic review and meta-analysis. Multiple Scler Relat Disord. Aug. 2021;53:103024. 10.1016/j.msard.2021.103024.Search in Google Scholar PubMed
[24] Hosny HS, Shehata HS, Ahmed S, Ramadan I, Abdo SS, Fouad AM. Predictors of severity and outcome of multiple sclerosis relapses. BMC Neurol. Feb. 2023;23(1):67. 10.1186/s12883-023-03109-6.Search in Google Scholar PubMed PubMed Central
[25] Peter W, George, Yu X. The elusive nature of the oligoclonal bands in multiple sclerosis. J Neurol. Nov. 2023;271:116–24. 10.1007/s00415-023-12081-7.Search in Google Scholar PubMed
[26] Zafeiropoulos P, Katsanos A, Kitsos G, Stefaniotou M, Asproudis I. The contribution of multifocal visual evoked potentials in patients with optic neuritis and multiple sclerosis: a review. Doc Ophthalmol. Dec. 2020;142(3):283–92. 10.1007/s10633-020-09799-4.Search in Google Scholar PubMed PubMed Central
[27] Pisa M, Chieffo R, Giordano A, Gelibter S, Comola M, Comi G, et al. Upper limb motor evoked potentials as outcome measure in progressive multiple sclerosis. Clin Neurophysiol. Feb. 2020;131(2):401–5. 10.1016/j.clinph.2019.11.024.Search in Google Scholar PubMed
[28] Barbosa DAN, Samelli AG, Patriota de Oliveira D, da Paz JA, Matas CG. Auditory evoked potentials in children and adolescents with multiple sclerosis and neuromyelitis optica spectrum disorders. Int J Pediatr Otorhinolaryngol. Feb. 2022;153:111013. 10.1016/j.ijporl.2021.111013.Search in Google Scholar PubMed
[29] Sangu Srinivasan V, Rangappan Munirathinam B, Singh NK, Rajalakshmi K. Usefulness of masseter vestibular evoked myogenic potentials in identifying brainstem dysfunction among individuals with multiple sclerosis. Int J Audiol. Apr. 2022;62(7):635–43. 10.1080/14992027.2022.2065548.Search in Google Scholar PubMed
[30] Weidauer S, Raab P, Hattingen E. Diagnostic approach in multiple sclerosis with MRI: an update. Clin Imaging. Oct. 2021;78:276–85. 10.1016/j.clinimag.2021.05.025.Search in Google Scholar PubMed
[31] Madsen MAJ, Wiggermann V, Bramow S, Christensen JR, Sellebjerg F, Siebner HR. Imaging cortical multiple sclerosis lesions with ultra-high field MRI. NeuroImage: Clin. 2021;32:102847. 10.1016/j.nicl.2021.102847.Search in Google Scholar PubMed PubMed Central
[32] Gaitán MI, Paday Formenti ME, Calandri I, Ysrraelit MC, Yañez P, Correale J. The central vein sign is present in most infratentorial multiple sclerosis plaques. Multiple Scler Relat Disord. Feb. 2022;58:103484. 10.1016/j.msard.2021.103484.Search in Google Scholar PubMed
[33] Rocca MA, Preziosa P, Filippi M. What role should spinal cord MRI take in the future of multiple sclerosis surveillance? Expert Rev Neurotherapeut. Mar. 2020;20(8):783–97. 10.1080/14737175.2020.1739524.Search in Google Scholar PubMed
[34] Romeo AR, Rowles WM, Schleimer ES, Barba P, Hsu WY, Gomez R, et al. An electronic, unsupervised patient-reported Expanded Disability Status Scale for multiple sclerosis. Multiple Scler J. Nov. 2020;27(9):1432–41. 10.1177/1352458520968814.Search in Google Scholar PubMed PubMed Central
[35] Andaur Navarro CL, Damen J, Takada T, Nijman S, Dhiman P, Ma J, et al. Risk of bias in studies on prediction models developed using supervised machine learning techniques: systematic review. BMJ. Oct. 2021;375:n2281. 10.1136/bmj.n2281.Search in Google Scholar PubMed PubMed Central
[36] Llorente F, Martino L, Delgado D, López-Santiago J. Marginal likelihood computation for model selection and hypothesis testing: An extensive review. SIAM Rev. Feb. 2023;65(1):3–58. 10.1137/20m1310849.Search in Google Scholar
[37] Dahouda MK, Joe I. A deep-learned embedding technique for categorical features encoding. IEEE Access. 2021;9:114381–91. 10.1109/ACCESS.2021.3104357.Search in Google Scholar
[38] Hancock JT, Khoshgoftaar TM. Survey on categorical data for neural networks. J Big Data. Apr. 2020;7(1):28. 10.1186/s40537-020-00305-w.Search in Google Scholar
[39] Schulz M-A, Yeo B, Vogelstein JT, Mourao-Miranada J, Kather JN, Kording K, et al. Different scaling of linear models and deep learning in UKBiobank brain images versus machine-learning datasets. Nat Commun. Aug. 2020;11(1):4238. 10.1038/s41467-020-18037-z.Search in Google Scholar PubMed PubMed Central
[40] Toğaçar M, Ergen B, Cömert Z. A deep feature learning model for Pneumonia detection applying a combination of mRMR feature selection and machine learning models. IRBM. Nov. 2019;41:212–22. 10.1016/j.irbm.2019.10.006.Search in Google Scholar
[41] Zhou H, Wang X, Zhu R. Feature selection based on mutual information with correlation coefficient. Appl Intell. Aug. 2021;52(5):5457–74. 10.1007/s10489-021-02524-x.Search in Google Scholar
[42] Jiang T, Gradus JL, Rosellini AJ. Supervised machine learning: A brief primer. Behav Ther. Sep. 2020;51(5):675–87. 10.1016/j.beth.2020.05.002.Search in Google Scholar PubMed PubMed Central
[43] Zhang T, Fu Q, Wang H, Liu F, Wang H, Han L. Bagging-based machine learning algorithms for landslide susceptibility modeling. Nat Hazards. Aug. 2021;110(2):823–46. 10.1007/s11069-021-04986-1.Search in Google Scholar
[44] González S, García S, Del Ser J, Rokach L, Herrera F. A practical tutorial on bagging and boosting based ensembles for machine learning: Algorithms, software tools, performance study, practical perspectives and opportunities. Inf Fusion. Dec. 2020;64:205–37. 10.1016/j.inffus.2020.07.007.Search in Google Scholar
[45] Rahman M, Chen N, Elbeltagi A, Islam MM, Alam M, Pourghasemi HR, et al. Application of stacking hybrid machine learning algorithms in delineating multi-type flooding in Bangladesh. J Environ Manag. Oct. 2021;295:113086. 10.1016/j.jenvman.2021.113086.Search in Google Scholar PubMed
[46] Yang L, Shami A. On hyperparameter optimization of machine learning algorithms: Theory and practice. Neurocomputing. Nov. 2020;415:295–316. 10.1016/j.neucom.2020.07.061.Search in Google Scholar
[47] Belete DM, Huchaiah MD. Grid search in hyperparameter optimization of machine learning models for prediction of HIV/AIDS test results. Int J Comput Appl. Sep. 2021;44:1–12. 10.1080/1206212x.2021.1974663.Search in Google Scholar
[48] Bracher-Smith M, Crawford K, Escott-Price V. Machine learning for genetic prediction of psychiatric disorders: a systematic review. Mol Psychiatry. Jan. 2021;26(1):70–9. 10.1038/s41380-020-0825-2.Search in Google Scholar PubMed PubMed Central
[49] Zhang Q, Hu W, Liu Z, Tan J. TBM performance prediction with Bayesian optimization and automated machine learning. Tunn Undergr Space Technol. Sep. 2020;103:103493. 10.1016/j.tust.2020.103493.Search in Google Scholar
[50] Dargan S, Kumar M, Ayyagari MR, Kumar G. A survey of deep learning and its applications: A new paradigm to machine learning. Arch Comput Methods Eng. Jun. 2019;27:1071–92. 10.1007/s11831-019-09344-w.Search in Google Scholar
[51] Farsi B, Amayri M, Bouguila N, Eicker U. On short-term load forecasting using machine learning techniques and a novel parallel deep LSTM-CNN approach. IEEE Access. 2021;9:31191–212. 10.1109/access.2021.3060290.Search in Google Scholar
[52] Li Z. Extracting spatial effects from machine learning model using local interpretation method: An example of SHAP and XGBoost. Comput Environ Urban Syst. Sep. 2022;96:101845. 10.1016/j.compenvurbsys.2022.101845.Search in Google Scholar
[53] Visani G, Bagli E, Chesani F, Poluzzi A, Capuzzo D. Statistical stability indices for LIME: Obtaining reliable explanations for machine learning models. J Oper Res Soc. Feb. 2021;73:1–11. 10.1080/01605682.2020.1865846.Search in Google Scholar
[54] Jammalamadaka KR, Itapu S. Responsible AI in automated credit scoring systems. AI Ethics. Jun. 2022;3:485–95. 10.1007/s43681-022-00175-3.Search in Google Scholar
[55] Wenninger S, Kaymakci C, Wiethe C. Explainable long-term building energy consumption prediction using QLattice. Appl Energy. Feb. 2022;308:118300. 10.1016/j.apenergy.2021.118300.Search in Google Scholar
[56] Krysko KM, Rutatangwa A, Graves J, Lazar A, Waubant E. Association between breastfeeding and postpartum multiple sclerosis relapses. JAMA Neurol. Dec. 2019;77:327–38. 10.1001/jamaneurol.2019.4173.Search in Google Scholar PubMed PubMed Central
[57] Montolío A, Martín-Gallego A, Cegoñino J, Orduna E, Vilades E, Garcia-Martin E, et al. Machine learning in diagnosis and disability prediction of multiple sclerosis using optical coherence tomography. Comput Biol Med. Jun. 2021;133:104416. 10.1016/j.compbiomed.2021.104416.Search in Google Scholar PubMed
© 2024 the author(s), published by De Gruyter
This work is licensed under the Creative Commons Attribution 4.0 International License.
Articles in the same Issue
- Research Articles
- A study on intelligent translation of English sentences by a semantic feature extractor
- Detecting surface defects of heritage buildings based on deep learning
- Combining bag of visual words-based features with CNN in image classification
- Online addiction analysis and identification of students by applying gd-LSTM algorithm to educational behaviour data
- Improving multilayer perceptron neural network using two enhanced moth-flame optimizers to forecast iron ore prices
- Sentiment analysis model for cryptocurrency tweets using different deep learning techniques
- Periodic analysis of scenic spot passenger flow based on combination neural network prediction model
- Analysis of short-term wind speed variation, trends and prediction: A case study of Tamil Nadu, India
- Cloud computing-based framework for heart disease classification using quantum machine learning approach
- Research on teaching quality evaluation of higher vocational architecture majors based on enterprise platform with spherical fuzzy MAGDM
- Detection of sickle cell disease using deep neural networks and explainable artificial intelligence
- Interval-valued T-spherical fuzzy extended power aggregation operators and their application in multi-criteria decision-making
- Characterization of neighborhood operators based on neighborhood relationships
- Real-time pose estimation and motion tracking for motion performance using deep learning models
- QoS prediction using EMD-BiLSTM for II-IoT-secure communication systems
- A novel framework for single-valued neutrosophic MADM and applications to English-blended teaching quality evaluation
- An intelligent error correction model for English grammar with hybrid attention mechanism and RNN algorithm
- Prediction mechanism of depression tendency among college students under computer intelligent systems
- Research on grammatical error correction algorithm in English translation via deep learning
- Microblog sentiment analysis method using BTCBMA model in Spark big data environment
- Application and research of English composition tangent model based on unsupervised semantic space
- 1D-CNN: Classification of normal delivery and cesarean section types using cardiotocography time-series signals
- Real-time segmentation of short videos under VR technology in dynamic scenes
- Application of emotion recognition technology in psychological counseling for college students
- Classical music recommendation algorithm on art market audience expansion under deep learning
- A robust segmentation method combined with classification algorithms for field-based diagnosis of maize plant phytosanitary state
- Integration effect of artificial intelligence and traditional animation creation technology
- Artificial intelligence-driven education evaluation and scoring: Comparative exploration of machine learning algorithms
- Intelligent multiple-attributes decision support for classroom teaching quality evaluation in dance aesthetic education based on the GRA and information entropy
- A study on the application of multidimensional feature fusion attention mechanism based on sight detection and emotion recognition in online teaching
- Blockchain-enabled intelligent toll management system
- A multi-weapon detection using ensembled learning
- Deep and hand-crafted features based on Weierstrass elliptic function for MRI brain tumor classification
- Design of geometric flower pattern for clothing based on deep learning and interactive genetic algorithm
- Mathematical media art protection and paper-cut animation design under blockchain technology
- Deep reinforcement learning enhances artistic creativity: The case study of program art students integrating computer deep learning
- Transition from machine intelligence to knowledge intelligence: A multi-agent simulation approach to technology transfer
- Research on the TF–IDF algorithm combined with semantics for automatic extraction of keywords from network news texts
- Enhanced Jaya optimization for improving multilayer perceptron neural network in urban air quality prediction
- Design of visual symbol-aided system based on wireless network sensor and embedded system
- Construction of a mental health risk model for college students with long and short-term memory networks and early warning indicators
- Personalized resource recommendation method of student online learning platform based on LSTM and collaborative filtering
- Employment management system for universities based on improved decision tree
- English grammar intelligent error correction technology based on the n-gram language model
- Speech recognition and intelligent translation under multimodal human–computer interaction system
- Enhancing data security using Laplacian of Gaussian and Chacha20 encryption algorithm
- Construction of GCNN-based intelligent recommendation model for answering teachers in online learning system
- Neural network big data fusion in remote sensing image processing technology
- Research on the construction and reform path of online and offline mixed English teaching model in the internet era
- Real-time semantic segmentation based on BiSeNetV2 for wild road
- Online English writing teaching method that enhances teacher–student interaction
- Construction of a painting image classification model based on AI stroke feature extraction
- Big data analysis technology in regional economic market planning and enterprise market value prediction
- Location strategy for logistics distribution centers utilizing improved whale optimization algorithm
- Research on agricultural environmental monitoring Internet of Things based on edge computing and deep learning
- The application of curriculum recommendation algorithm in the driving mechanism of industry–teaching integration in colleges and universities under the background of education reform
- Application of online teaching-based classroom behavior capture and analysis system in student management
- Evaluation of online teaching quality in colleges and universities based on digital monitoring technology
- Face detection method based on improved YOLO-v4 network and attention mechanism
- Study on the current situation and influencing factors of corn import trade in China – based on the trade gravity model
- Research on business English grammar detection system based on LSTM model
- Multi-source auxiliary information tourist attraction and route recommendation algorithm based on graph attention network
- Multi-attribute perceptual fuzzy information decision-making technology in investment risk assessment of green finance Projects
- Research on image compression technology based on improved SPIHT compression algorithm for power grid data
- Optimal design of linear and nonlinear PID controllers for speed control of an electric vehicle
- Traditional landscape painting and art image restoration methods based on structural information guidance
- Traceability and analysis method for measurement laboratory testing data based on intelligent Internet of Things and deep belief network
- A speech-based convolutional neural network for human body posture classification
- The role of the O2O blended teaching model in improving the teaching effectiveness of physical education classes
- Genetic algorithm-assisted fuzzy clustering framework to solve resource-constrained project problems
- Behavior recognition algorithm based on a dual-stream residual convolutional neural network
- Ensemble learning and deep learning-based defect detection in power generation plants
- Optimal design of neural network-based fuzzy predictive control model for recommending educational resources in the context of information technology
- An artificial intelligence-enabled consumables tracking system for medical laboratories
- Utilization of deep learning in ideological and political education
- Detection of abnormal tourist behavior in scenic spots based on optimized Gaussian model for background modeling
- RGB-to-hyperspectral conversion for accessible melanoma detection: A CNN-based approach
- Optimization of the road bump and pothole detection technology using convolutional neural network
- Comparative analysis of impact of classification algorithms on security and performance bug reports
- Cross-dataset micro-expression identification based on facial ROIs contribution quantification
- Demystifying multiple sclerosis diagnosis using interpretable and understandable artificial intelligence
- Unifying optimization forces: Harnessing the fine-structure constant in an electromagnetic-gravity optimization framework
- E-commerce big data processing based on an improved RBF model
- Analysis of youth sports physical health data based on cloud computing and gait awareness
- CCLCap-AE-AVSS: Cycle consistency loss based capsule autoencoders for audio–visual speech synthesis
- An efficient node selection algorithm in the context of IoT-based vehicular ad hoc network for emergency service
- Computer aided diagnoses for detecting the severity of Keratoconus
- Improved rapidly exploring random tree using salp swarm algorithm
- Network security framework for Internet of medical things applications: A survey
- Predicting DoS and DDoS attacks in network security scenarios using a hybrid deep learning model
- Enhancing 5G communication in business networks with an innovative secured narrowband IoT framework
- Quokka swarm optimization: A new nature-inspired metaheuristic optimization algorithm
- Digital forensics architecture for real-time automated evidence collection and centralization: Leveraging security lake and modern data architecture
- Image modeling algorithm for environment design based on augmented and virtual reality technologies
- Enhancing IoT device security: CNN-SVM hybrid approach for real-time detection of DoS and DDoS attacks
- High-resolution image processing and entity recognition algorithm based on artificial intelligence
- Review Articles
- Transformative insights: Image-based breast cancer detection and severity assessment through advanced AI techniques
- Network and cybersecurity applications of defense in adversarial attacks: A state-of-the-art using machine learning and deep learning methods
- Applications of integrating artificial intelligence and big data: A comprehensive analysis
- A systematic review of symbiotic organisms search algorithm for data clustering and predictive analysis
- Modelling Bitcoin networks in terms of anonymity and privacy in the metaverse application within Industry 5.0: Comprehensive taxonomy, unsolved issues and suggested solution
- Systematic literature review on intrusion detection systems: Research trends, algorithms, methods, datasets, and limitations

