Abstract
With the continuous advancement of agricultural Internet of Things (IoT) technologies, real-time monitoring of agricultural environments has become increasingly significant. This monitoring provides valuable information on pest and disease occurrences and corresponding ecological conditions. However, as the agricultural environments have extensive coverage, the number of monitoring IoT devices and the volume of information will rapidly increase. This leads to a surge in network traffic and computing demands. To address this issue, this article proposes an agricultural environmental monitoring IoT system that utilizes edge computing and deep learning technologies. It combines the Long-Range Wide Area Network (LoRaWAN) for long-range transmission with pest recognition and counting modules. By offloading workloads traditionally processed in the cloud to edge nodes, the proposed system effectively reduces transmission and cloud computing pressures for the agricultural monitoring IoT. Simulation experiments demonstrate stable LoRaWAN protocol-based data transmission at the edge, with an overall packet loss rate of less than 5%, meeting the transmission quality requirements. Moreover, this article investigates a pest recognition and counting method based on deep learning technology. Pest images, captured by monitoring nodes, are recognized and counted online using the TensorFlow framework. Experimental results indicate an accuracy of 89% in pest recognition. By digitally transmitting pest image recognition results to the cloud, the proposed system significantly alleviates transmission and cloud computing pressures for the monitoring IoT.
1 Introduction
Agricultural environmental monitoring plays a crucial role in modern agricultural practices [1]. With the continuous increase in global food demand and the growing awareness of environmental sustainability, monitoring the agricultural environment has become imperative. The monitoring process involves the systematic collection, analysis, and interpretation of data related to various environmental factors such as soil quality, water availability, air quality, and climatic conditions. By monitoring these parameters, farmers, policymakers, and researchers gain valuable insights into the health and productivity of agricultural ecosystems. This information enables the identification of potential risks, the optimization of resource allocation, and the implementation of targeted interventions for sustainable agricultural production. Furthermore, agricultural environmental monitoring serves as a scientific basis for evidence-based decision-making, policy formulation, and the implementation of effective agricultural practices. Ultimately, by promoting environmental stewardship and optimizing production processes, agricultural environmental monitoring contributes to the achievement of food security, environmental resilience, and the long-term viability of agricultural systems.
The Internet of Things (IoT) refers to the network of physical objects embedded with sensors, software, and other technologies to enable the objects to connect and exchange data over the internet. IoT has emerged as a transformative technology paradigm that connects billions of physical devices and objects to the internet, enabling real-time data collection, analysis, and decision-making in various domains. In recent years, IoT has been increasingly applied in the agricultural sector for smart farming and environmental monitoring [1]. It offers new opportunities and advantages for agricultural environmental monitoring. The integration of emerging technologies such as sensors and decision support systems has facilitated real-time monitoring of agricultural environments, providing essential information on water and fertilizer utilization efficiency, as well as pest and disease occurrence.
However, despite the advancements in IoT, the field of agricultural environmental monitoring still faces several challenges. First, due to the typically large cultivation areas of agricultural fields, there are demanding requirements placed on IoT systems concerning coverage, node density, transmission reliability, network deployment convenience, power consumption, and network lifespan [2]. Meeting these requirements remains a significant challenge.
Second, the widespread adoption of IoT in agricultural monitoring has led to an exponential growth in the number of monitoring endpoints and data volume. This, in turn, puts immense strain on traditional cloud server architectures, leading to increased network traffic and computational burdens [3,4].
Lastly, in the context of pest monitoring in agricultural fields, the transmission of pest image data consumes a considerable amount of network resources, thereby reducing the efficiency of pest early warning and overall effectiveness of the agricultural environmental monitoring IoT.
Therefore, this study aims to address practical situations and key issues in agricultural environmental monitoring. We propose an intelligent IoT system for agricultural environmental monitoring that incorporates technologies such as IoT, edge computing, and deep learning, while also providing wide coverage and low power consumption. The main contributions of this work are summarized as follows:
We thoroughly investigate the functional architecture of IoT based on edge computing technology. By integrating LoRa WAN networks, online pest recognition and counting algorithms, and other essential functionalities into embedded systems at the edge, we establish an integrated edge computing model specifically tailored for agricultural production sites.
We conduct simulations and experiments to evaluate IoT transmission protocols for monitoring purposes. Specifically, we validate the performance of a low-power and long-distance transmission protocol and explore the heterogeneous fusion of high-definition image transmission with low-power wide area networks. The NS3 software is employed for simulating data transmission among the monitoring nodes.
Furthermore, we delve into the study of AI algorithms for pest recognition in farmland. Through the application of automated image preprocessing techniques to the collected pest images, we propose an online pest recognition and counting method that leverages the TensorFlow framework. This approach enables real-time recognition and counting of pest images uploaded by monitoring nodes.
2 Related work
In the realm of agriculture, the implementation of an Agricultural IoT network enables the acquisition of information pertaining to agricultural systems. By facilitating efficient information transmission and intelligent data processing, this network realizes the scientific management of the agricultural production process.
The utilization of edge computing technology aims to enhance the overall efficacy and performance of IoT systems while minimizing the volume of data that requires transmission to the cloud for processing, analysis, and storage. In comparison to traditional cloud computing, the cloud-edge integration model of edge computing exhibits closer proximity to data sources, significantly reduces data processing latency, and effectively alleviates computational burdens on the cloud.
This article summarizes applications of the edge computing technology in recent years and analyzes their advantages as shown in Table 1.
Review of edge computing applications in literature
| Literature | Application scenarios | Advantage | ||
|---|---|---|---|---|
| Security | Low cost | Low latency | ||
| [5] | Leverage lightweight virtualization, Information-Centric Networking | √ | ||
| [6] | An edge computing platform that can coordinate with each computing resources of device, edge node, and cloud | √ | √ | |
| [7] | Detection of industrial thermal anomaly | √ | ||
| [8] | A solution that allows connecting local IoT end nodes to a LoRaWAN gateway without the need for internet access | √ | ||
| [9] | A provisioning mechanism to deploy a “smart warehouse” IoT application according to utility computing platforms | √ | ||
| [10] | Networked control of industrial robots | √ | ||
| [11] | An edge computing platform that can coordinate with each computing resources of device, edge node, and cloud | √ | √ | |
| [12] | Application of machine learning in industry | √ | √ | |
Numerous studies have demonstrated the enhanced utilization of computing resources through edge computing, resulting in improved efficiency of cloud resource allocation [13,14,15]. However, challenges persist in attaining an optimal equilibrium between low power consumption, minimal latency, cost-effectiveness, and security within edge computing technology. Merely employing edge computing in agricultural monitoring IoT encounters limitations, necessitating the integration of appropriate network transmission modes to achieve energy efficiency, affordability, and high efficacy in large-scale farmland monitoring.
Research on intelligent recognition through computer vision mainly adopts the following approaches: traditional digital image processing, support vector machines, and artificial intelligence neural networks. In recent years, the integration of image processing and artificial intelligence has achieved qualitative breakthroughs compared to traditional manual detection and recognition methods for pest recognition. Currently, many scholars have achieved results in agricultural pest recognition. Habib et al. used neural networks to classify pests in cotton planting. They extracted pest features and achieved over 90% accuracy except for one pest [16]. Solis et al. identified a single greenhouse pest using area, eccentricity and solidity. They proposed a loss algorithm and gave thresholds [17]. Ebrahimi et al. used SVM to identify trips using saturation, hue, and axis ratios as features. The error rate was less than 2.25% [18]. Yaakob et al. used neural networks to identify nearly 20 pests with over 90% accuracy [19]. With the advancement of artificial intelligence, the application of image deep learning technology has become increasingly widespread [20,21,22]. However, such applications require highly advanced hardware support.
In IoT applications, both deep learning and image processing technologies usually occur on high-performance cloud servers. This requires high image quality and requires transmitting these images back to the cloud for processing. This directly reduces the efficiency of real-time pest early warning and the overall effectiveness of IoT monitoring.
3 Agricultural environmental monitoring IoT architecture
3.1 Overall design of IoT
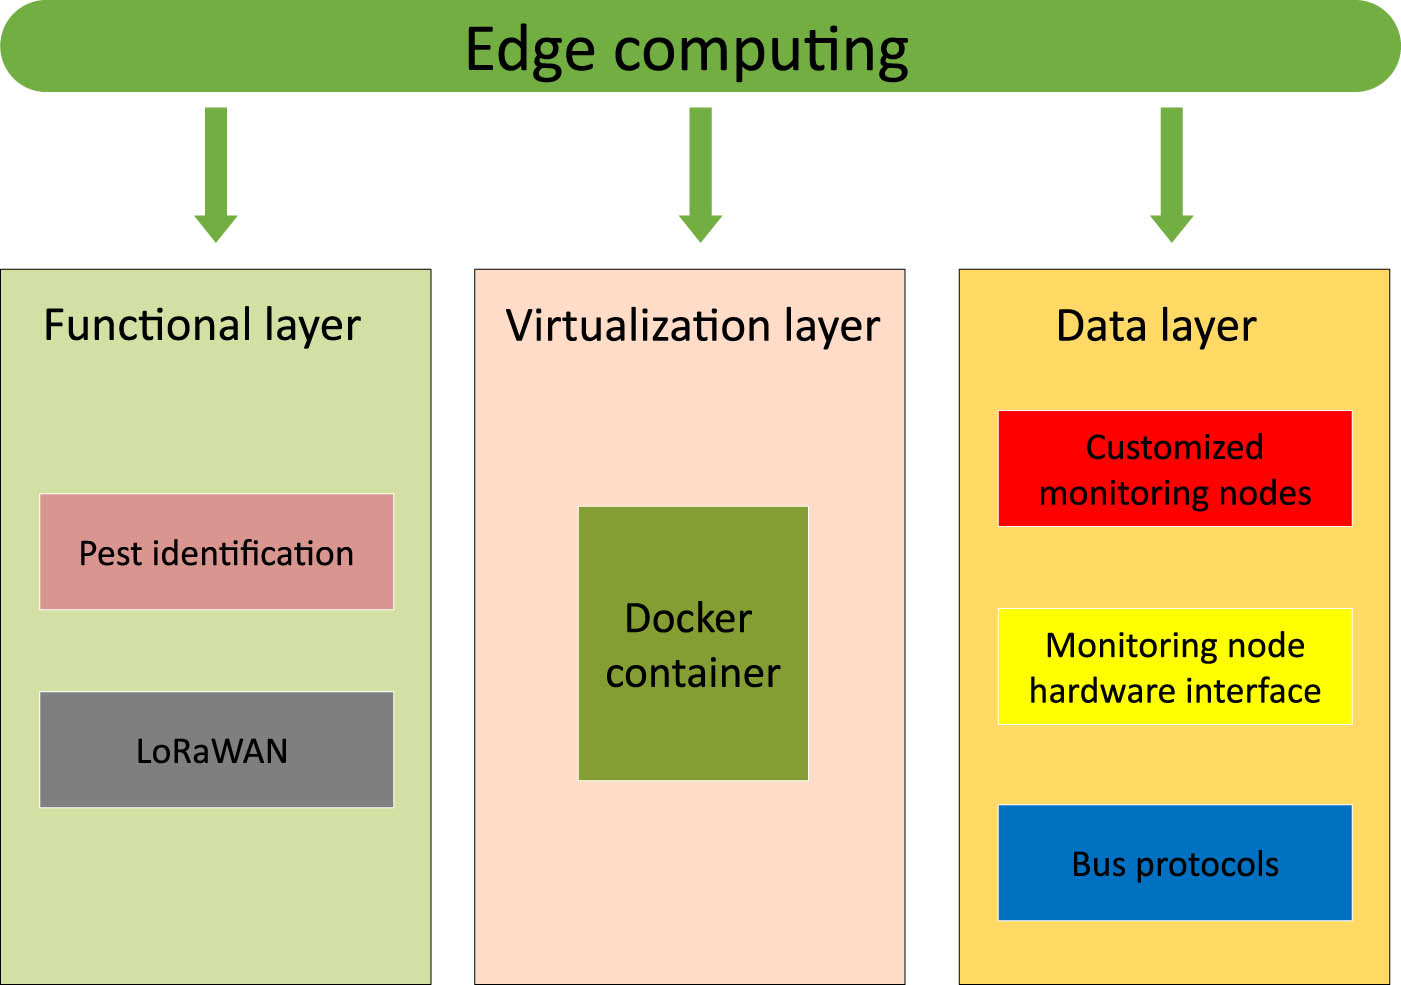
The agricultural environmental monitoring IoT architecture proposed in this study introduces an edge computing layer situated between the end devices and cloud servers. This layer plays a crucial role in enhancing system performance by offering communication and data processing capabilities. As depicted in Figure 1, this architecture showcases remarkable performance in terms of low latency and reliability. The edge computing layer is further divided into the data, virtualization, and functional layers, each serving specific purposes within the system.
Architecture of edge computing layer.
3.1.1 Data layer
The data layer of the proposed architecture provides support for multiple hardware interfaces and bus protocols. Specialized development has been undertaken to cater to the requirements of Long-Range Wide Area Network (LoRaWAN) protocols. Communication modules relevant to these communication protocols are installed within this layer. With the Linux system’s multi-threading mechanism ensuring its functionality, the underlying driver programs can be simultaneously invoked to receive data in real time. This capability enables the provision of data sources to support edge computing within the system.
3.1.2 Virtualization layer
By leveraging virtualization technology, resources are allocated in a separate manner to facilitate the independent operation of various services. In this article, Docker container functions under the Linux system are employed to achieve effective isolation between different functional services. Additionally, a virtual network is implemented to offer data access services for these containers, consequently enhancing both the resource utilization efficiency and compatibility of the edge computing end.
3.1.3 Functional layer
The management of each independent service enables the realization of certain cloud functions at the edge end. These functions encompass pest recognition using deep learning technology and the implementation of a LoRaWAN server. Simultaneously, the functional layer has the capability to retain interface services, allowing for the integration of user-customized development functions in the future.
3.2 IoT main functional modules
3.2.1 LoRaWAN server module
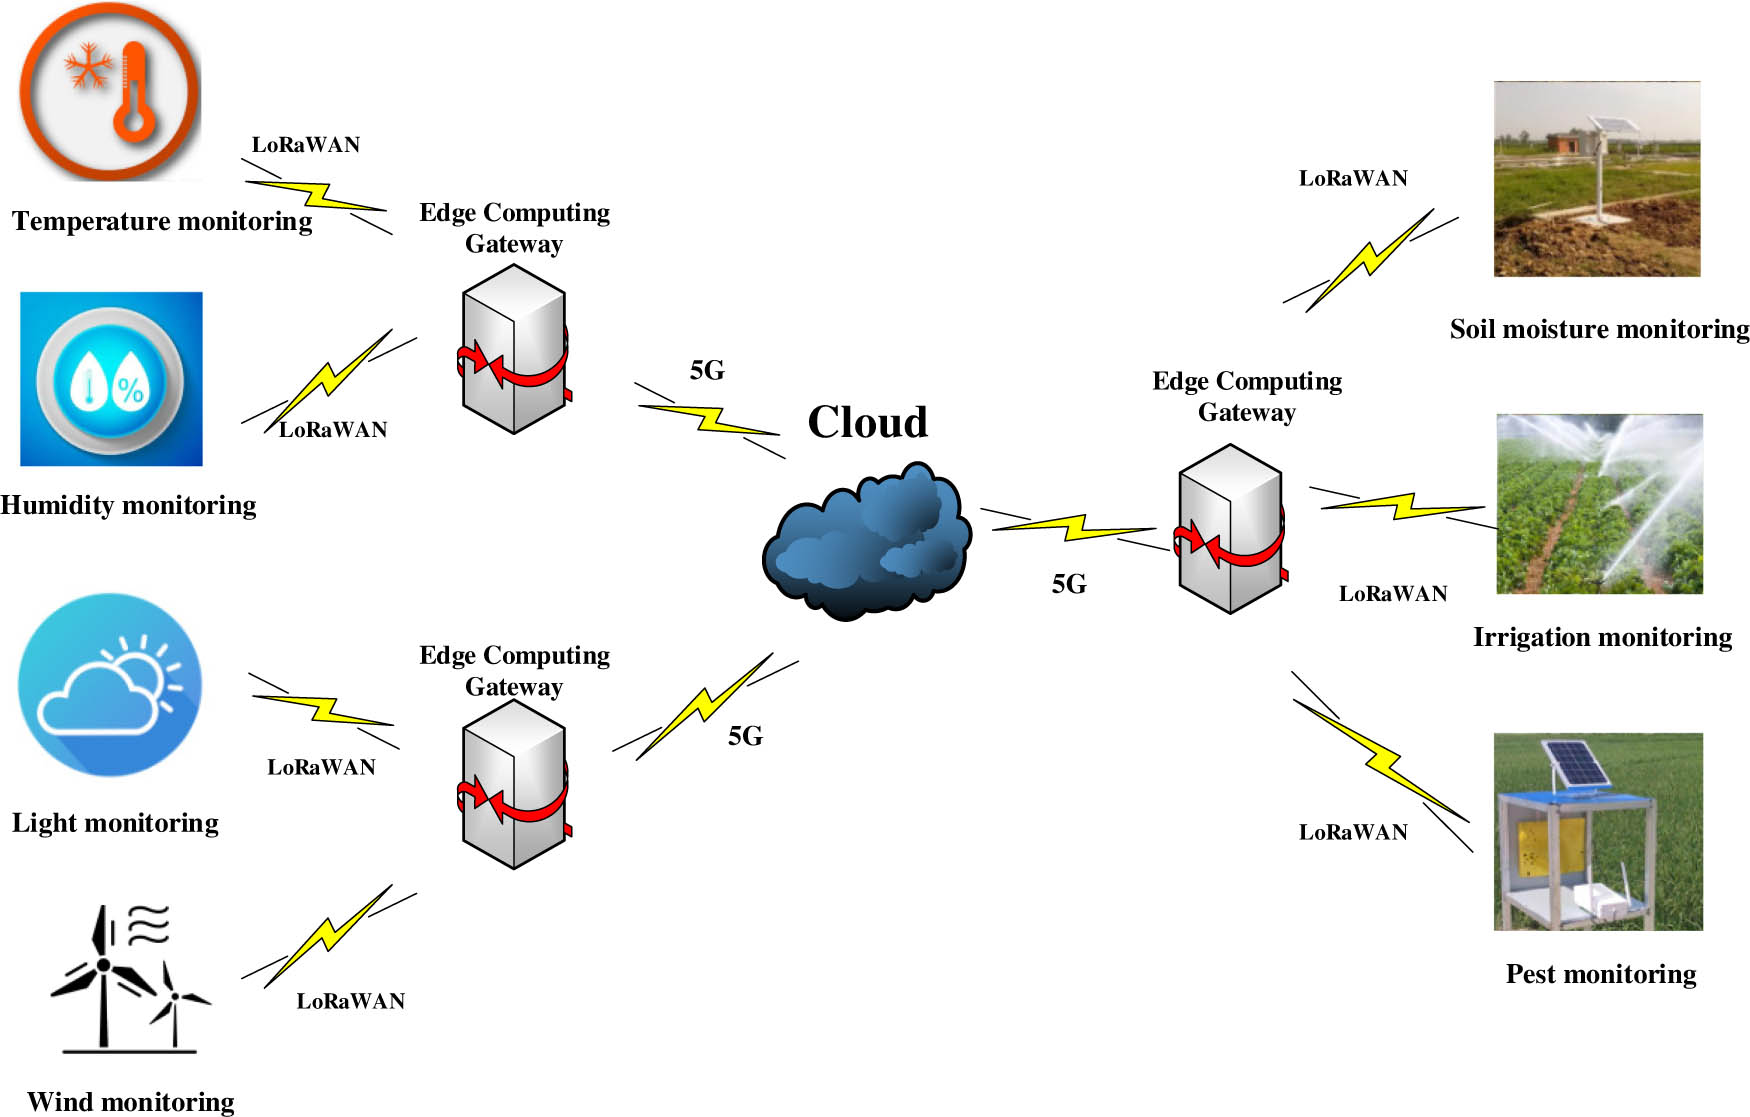
The IoT transport layer, as designed in this study, incorporates the utilization of the LoRaWAN protocol. The LoRa technology, with its distinctive advantage in transmission distance, enables terminal nodes equipped with the LoRaWAN protocol to directly transmit data to gateways without the need for intermediate links. This not only ensures the required transmission distance but also maintains the desired data transmission quality. Figure 2 depicts the topology diagram of the agricultural environmental monitoring IoT network.
Schematic diagram of agricultural environmental monitoring IoT network topology.
The LoRaWAN server is usually installed in the cloud. The cloud is connected to the site through wireless internet, so the communication process is greatly affected by the network quality of the site. And frequent communication between gateways and servers will also lead to excessive consumption of bandwidth resources, resulting in signal transmission and receiving delay at terminals. The IoT structure designed in this article installs the LoRaWAN server at the edge computing end, which has the following advantages:
(1) Reducing network load for data transmission to the cloud.
(2) Decreasing dependence on cloud computing.
(3) Improving data interaction speed.
In the agricultural field, the LoRaWAN server module is encapsulated into an independent container, allowing it to run completely on the embedded platform carried by the edge computing end. When the area of the agricultural field is large, multiple embedded platforms can be used to achieve multi-network collaboration and further increase the transmission range.
3.2.2 Pest recognition and counting module
The advancement of computer technology has greatly accelerated the development of image recognition technology. In the realm of agriculture, the process of pest image recognition involves multiple research steps, including pest image acquisition, preprocessing, feature extraction, and recognition/counting. To accomplish this, the module leverages the TensorFlow framework and the Python language to implement pest recognition and counting algorithms.
The images of pests used in our pest recognition module are obtained from the pest monitoring module. An RGB camera is employed to capture images at regular intervals of every half an hour. These images undergo various image processing techniques and recognition algorithms for further analysis and identification of pests. This information is crucial for real-time monitoring and transmission of pest situation data to the cloud.
4 Experimental results and performance evaluation
4.1 Stability experiment of IoT data transmission
Before deploying IoT on a large scale in agricultural fields, it is necessary to verify whether the data transmission quality and coverage range of the IoT can meet the actual requirements. NS3 is a discrete-event-driven open-source network simulation software used for simulating computer networks and wireless communication networks. It can simulate various types and scales of network structures in the real world on a single computer. The NS3 network simulation system allows for parameter settings of network nodes, network protocols, propagation loss models, gateways, and servers. By simulating and evaluating the agricultural environmental monitoring IoT system, it can be determined whether the system can meet the actual requirements.
In this simulation experiment, five common intervals for sending agricultural environmental monitoring data were selected for simulation (60, 120, 200, 400, and 600 s). In the field of communications, it is generally considered that the communication quality is good when the packet loss rate is less than 5%. Considering the possibility of a large agricultural field area, the simulation was performed for the following two scenarios:
Data monitoring with multiple monitoring nodes
A single gateway was used, and the range of data monitoring points was from 1 to 500.
Data monitoring with multiple LoRaWAN gateways.
1, 2, 4, and 8 gateways were used, with each gateway configured with a fixed number of 100 monitoring nodes.
The data transmission modes were categorized into unacknowledged (without ACK) and acknowledged modes (with ACK). The experimental results are as follows.
4.1.1 Data transmission of multiple monitoring nodes
Relationship between data transmission interval and packet loss rate
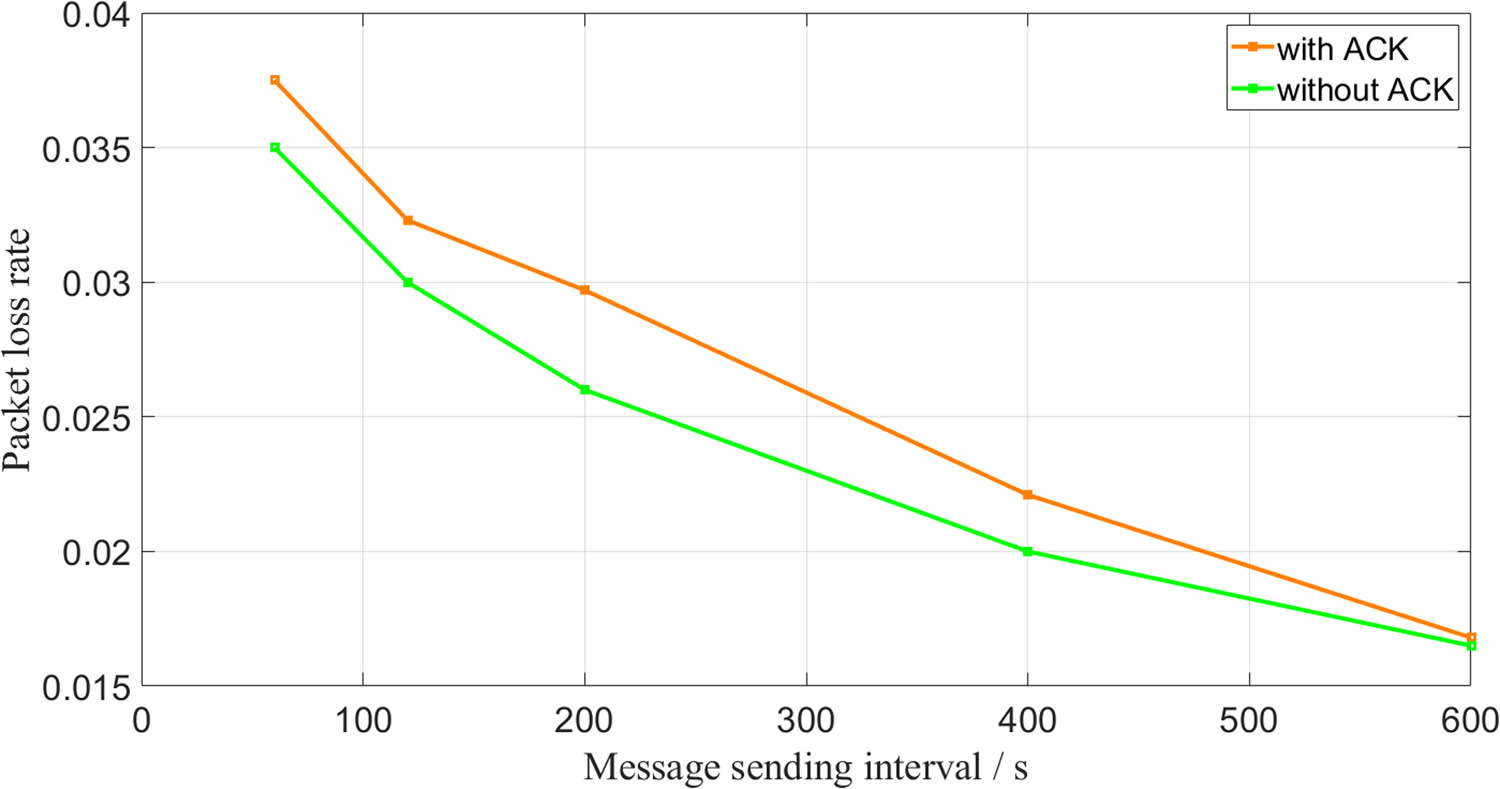
In this experiment, we selected a single gateway and fixed the number of monitoring nodes at 200. We chose the data transmission intervals to be 60, 120, 200, 400, and 600 s, respectively. Under the five conditions, we sent the data in unacknowledged and acknowledged modes, respectively. The relationship between data transmission interval and packet loss rate is shown in Figure 3.
Relationship between the number of monitoring nodes and packet loss rate
Relationship between data transmission interval and packet loss rate.
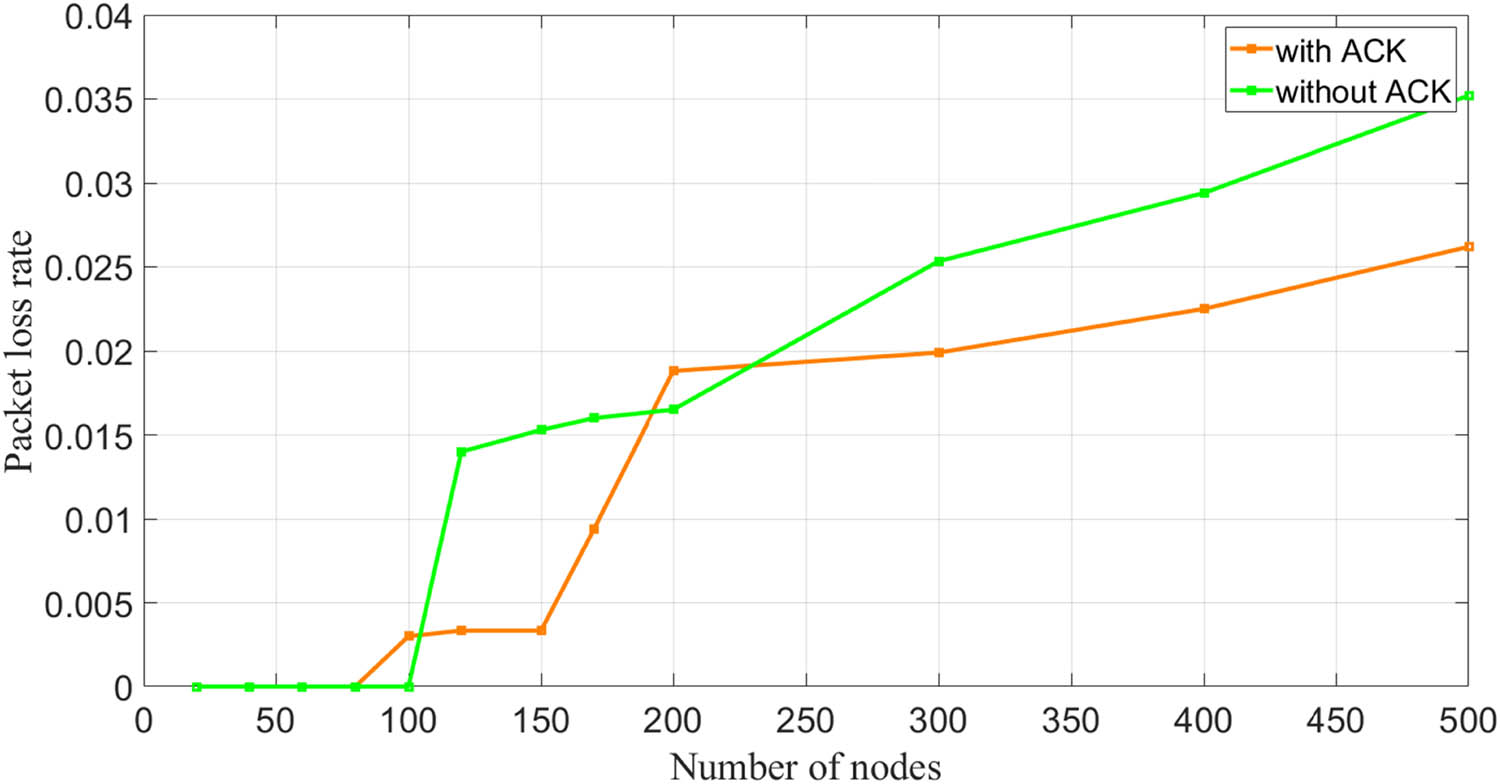
In this experiment, we selected a single gateway and fixed the data transmission interval at 200 s. Figure 4 shows the relationship between the number of monitoring nodes (1–500) and the packet loss rate of the transmitted data.
Relationship between the number of monitoring nodes and packet loss rate under a single gateway.
By establishing a three-dimensional model of the number of monitoring nodes, data transmission interval, and packet loss rate, it can be seen that as the number of detection nodes increases and the transmission interval decreases, the packet loss rate does show an upward trend. However, when the transmission interval is 60 seconds and the number of monitoring nodes is 1,000, the total packet loss rate is still less than 5%, as demonstrated in Figure 5.
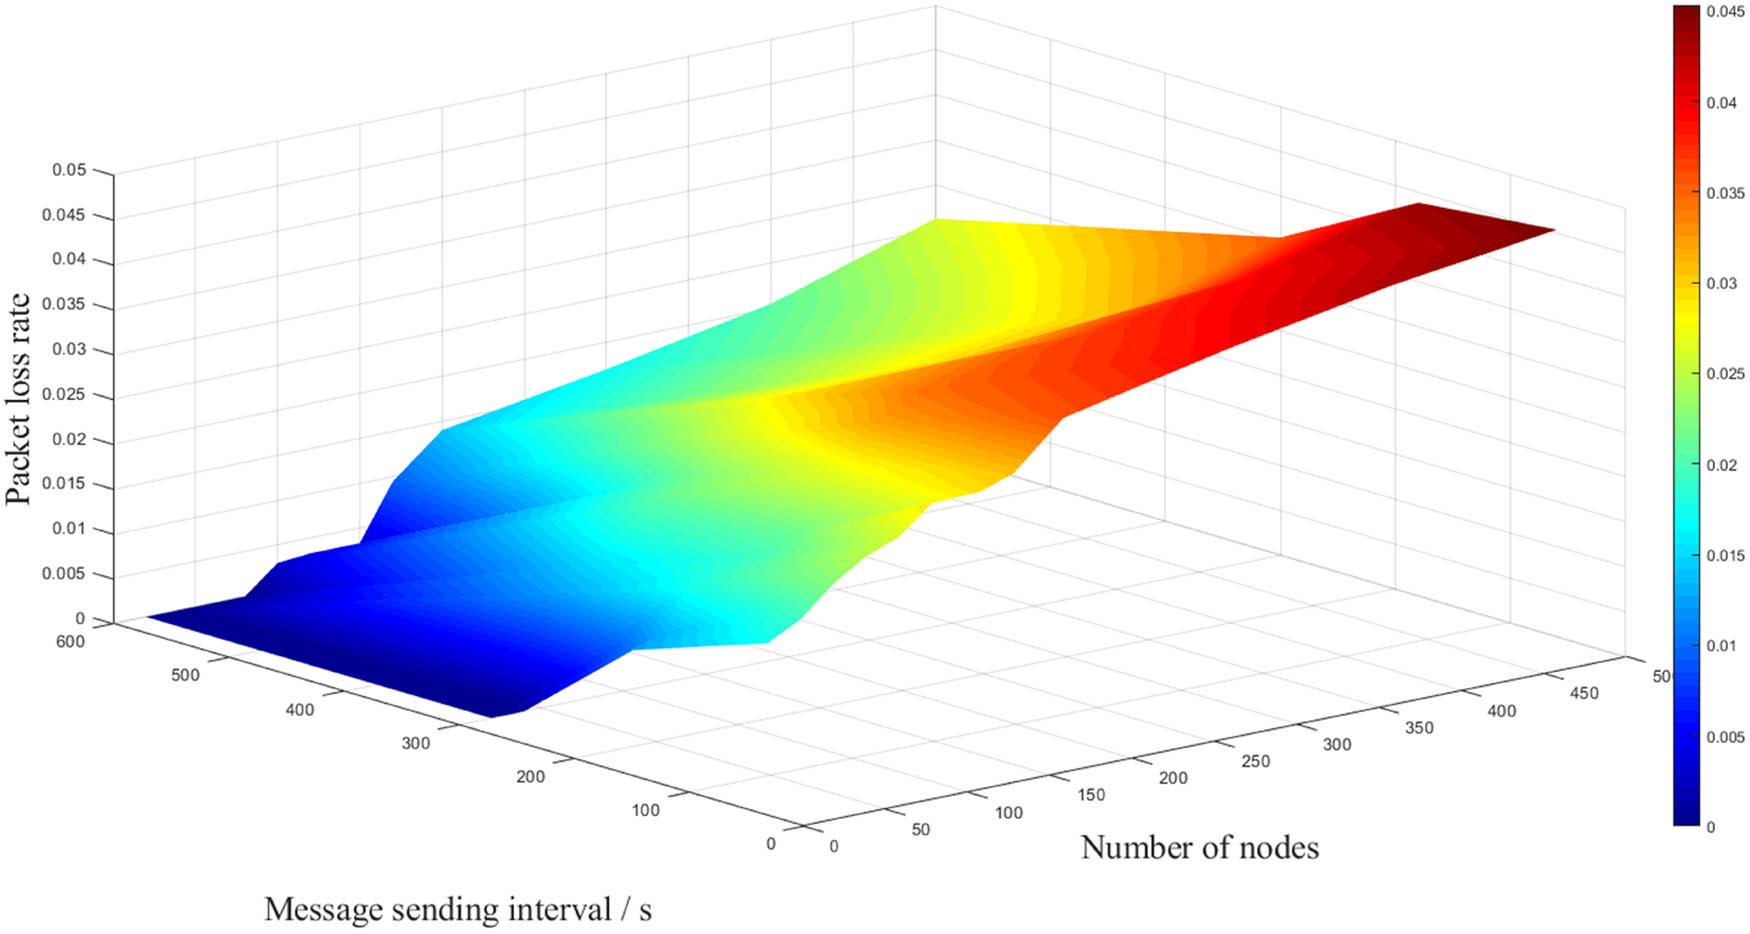
Relationship between the number of monitoring nodes, transmission interval, and packet loss rate under a single gateway.
4.1.2 Multi-gateway data monitoring
Relationship between the number of monitoring nodes and packet loss rate
In this experiment, we selected 1, 2, 4, and 8 gateways, with 1–500 monitoring nodes for each gateway. The data transmission interval was fixed at 200 s. The data transmission modes were with and without ACK, respectively. Figure 6 shows the relationship between data transmission interval and packet loss rate.
Data transmission pressure test of multiple gateways
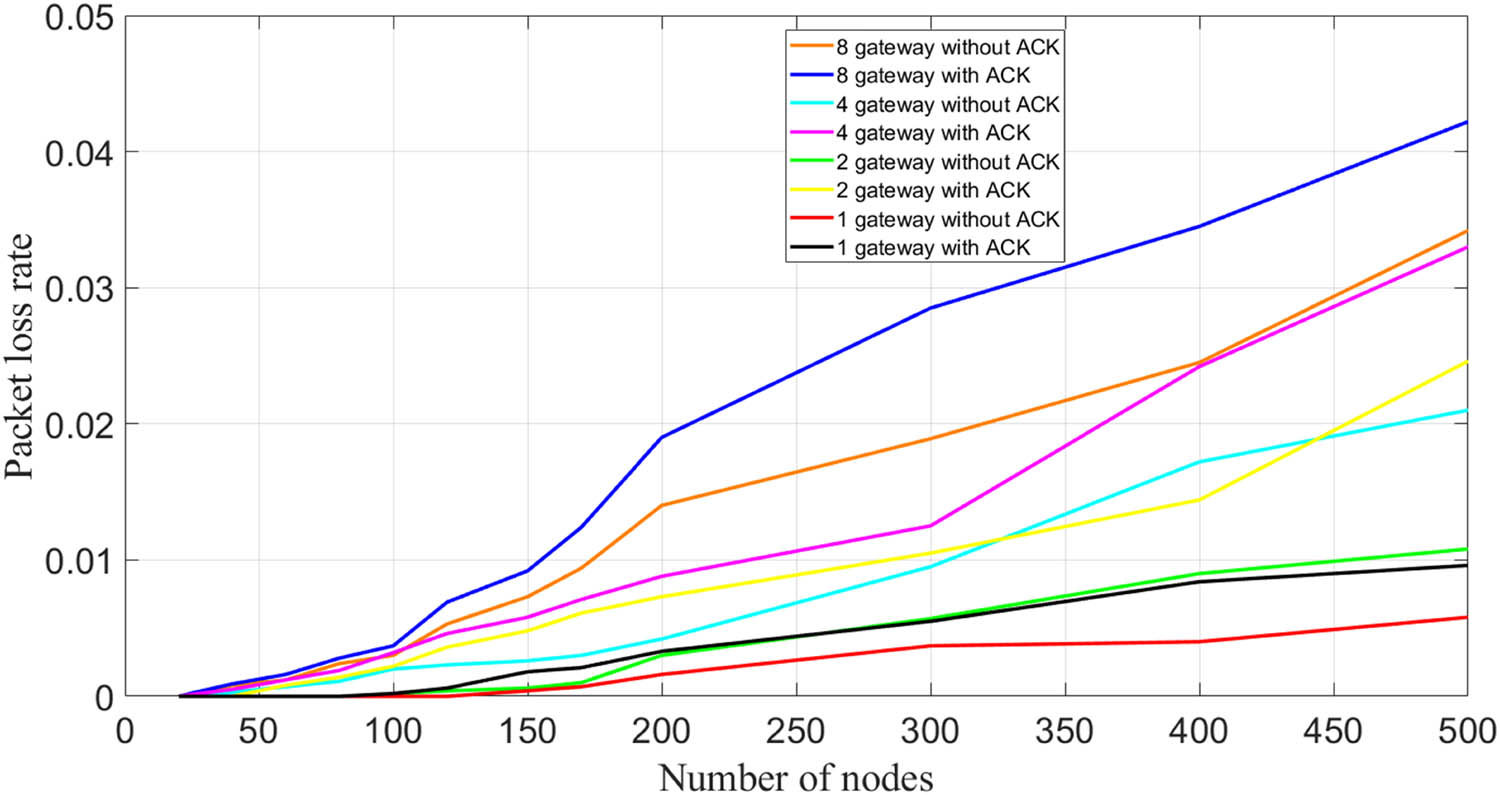
Relationship between the number of monitoring nodes and packet loss rate under multi-gateway.
As can be seen from Figure 7, the increase in the number of gateways does lead to a decrease in the stability of data transmission. However, the stability of data transmission remains at a very high level (packet loss rate <5%). To further verify the stability of data transmission using multiple gateways, we maintained eight gateways and continued to increase the number of monitoring nodes for each gateway, fixing the transmission interval of the experiment at 60 s. The results are shown in Figure 7.
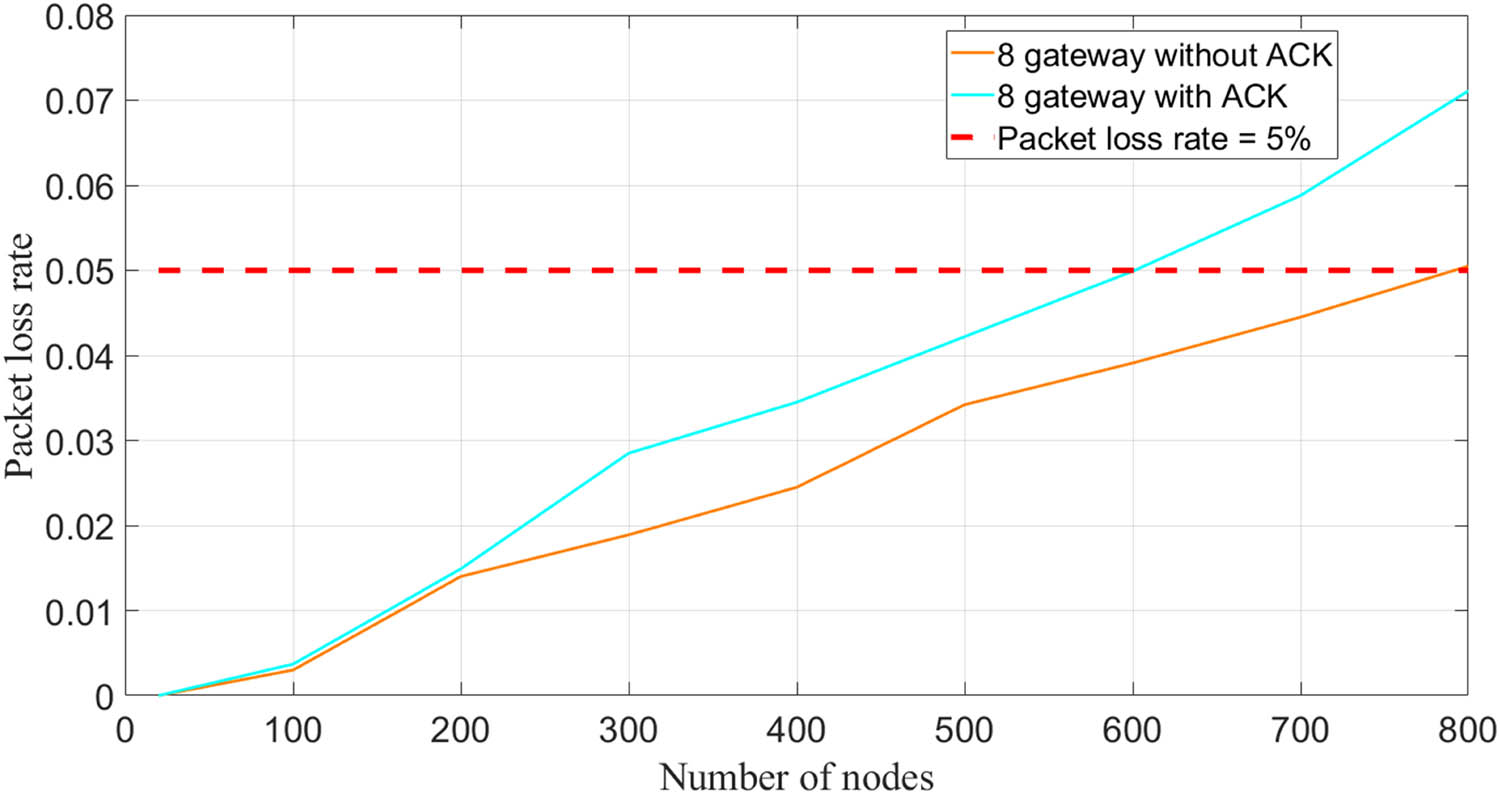
Relationship between the number of monitoring nodes and packet loss rate under eight gateways.
4.1.3 Discussion on the experimental results of IoT transmission
Based on the conducted LoRaWAN network simulation experiments, the following conclusions can be drawn.
When utilizing a single gateway, the packet loss rate gradually decreases as the data transmission interval increases, regardless of whether the transmission mode includes acknowledgment (ACK) or not. The packet loss rate remains below 5%, aligning with expectations. Therefore, for agricultural environmental monitoring tasks with a single gateway, the requirements can be adequately fulfilled as long as the number of monitoring nodes remains within 500, and the data transmission interval does not exceed 60 s.
When employing multiple gateways, as long as the number of monitoring nodes assigned to each gateway remains below 500, it does not impede transmission quality (overall packet loss rate <5%). Only when there are eight gateways and the number of monitoring nodes exceeds 600 for each gateway, the packet loss rate may slightly exceed 5%.
From the analysis above, it can be concluded that deploying the LoRaWAN server at the edge computing end effectively expands the monitoring area of agricultural environments while ensuring satisfactory data transmission quality. And there is limited research on utilizing edge computing technology with a LoRaWAN server in large-scale agricultural field monitoring. The results obtained from this simulation study provide empirical data support for the future implementation of multi-gateway systems for extensive environmental monitoring in agricultural fields.
4.2 Pest recognition and counting experiment
In this article, a combination of traditional image processing and deep learning methods is used for farmland pest monitoring. The specific steps and processes are shown in Figure 8.
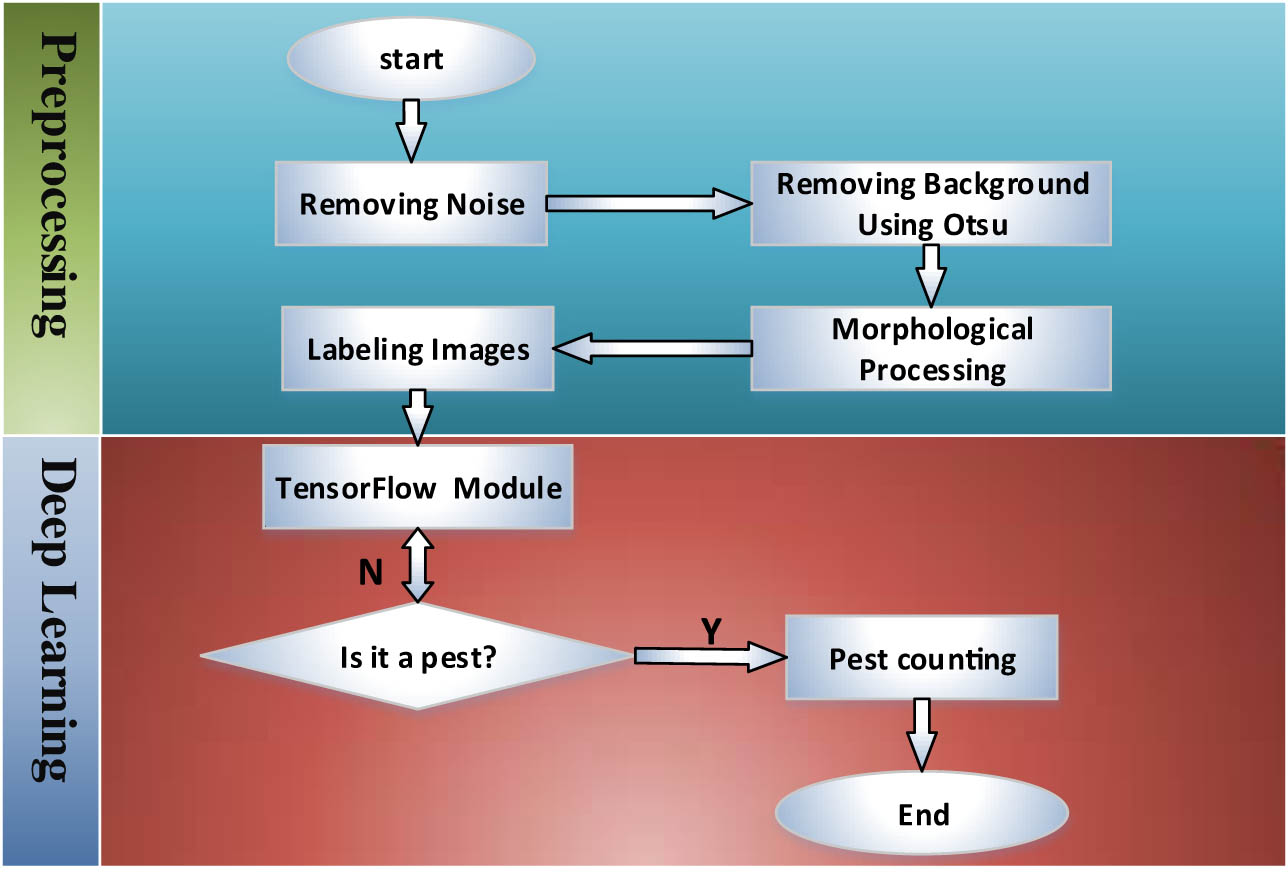
Basic flowchart of pest image recognition and counting.
This article mainly uses the following two image preprocessing methods: image enhancement and image segmentation. After the image enters the pest recognition module, it needs to go through three stages: image preprocessing, TensorFlow-based image recognition, and image counting, to realize all the functions of the pest recognition module.
4.2.1 Pest image acquisition
The pest images employed in this research were derived from the periodic automated capturing of RGB images at designated pest monitoring sites. These images belong to the category of controlled imagery acquired through trapping methodologies and were procured within a stable environmental context, as illustrated in Figure 9. The image files maintain the JPG format.
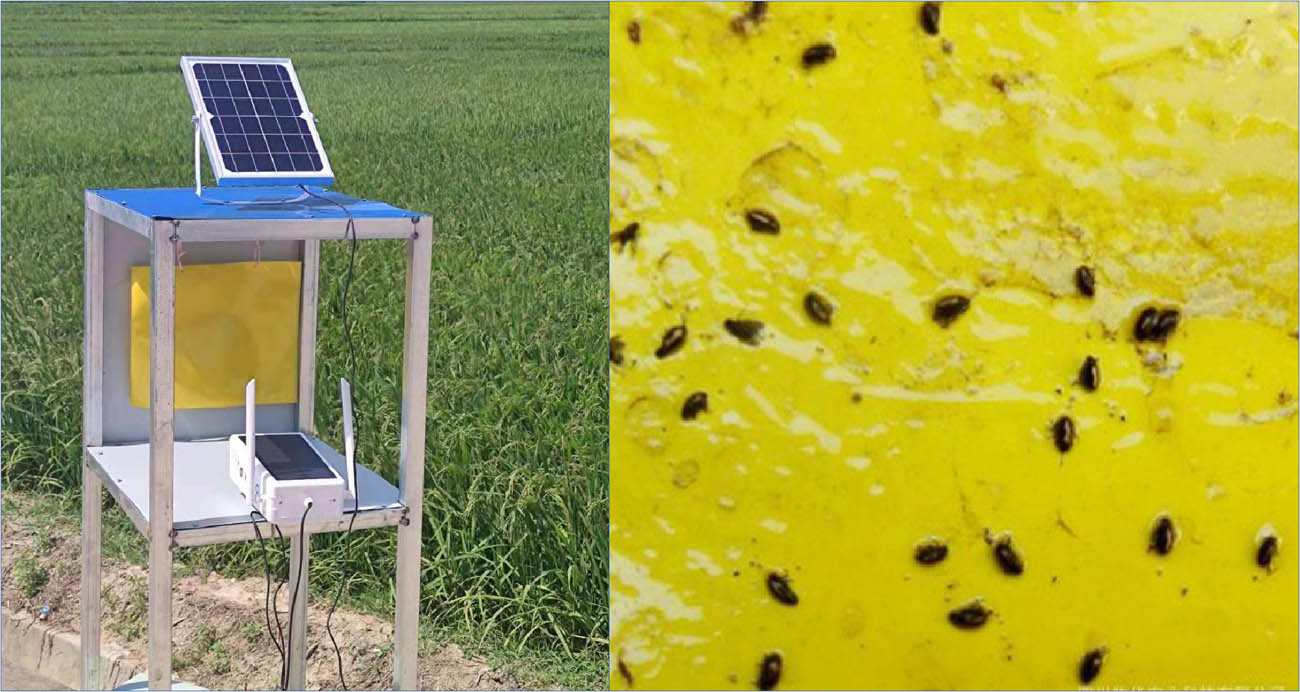
Pest monitoring device and captured images.
4.2.2 Pest image preprocessing methods
Images captured in farmland are often affected by various natural conditions, such as varying light intensity, adverse weather conditions (rain or snow), and high wind speed. These factors can significantly impact image quality, subsequently affecting pest counting and recognition accuracy. Therefore, it is crucial to apply basic image preprocessing techniques to mitigate the influence of these factors. The main preprocessing steps are as follows:
Image enhancement
To improve the quality of pest images, an image enhancement technique is employed. The grayscale histogram is a simple yet effective method for assessing image quality. In this study, the histogram equalization algorithm is utilized to process pest images, enhancing their overall contrast and improving visual clarity.
Image segmentation
After noise reduction, pest images should only contain relevant background and foreground information. Image segmentation is employed to separate these regions for further classification processing. Threshold segmentation is a widely used technique that leverages the grayscale differences between the target object and the background. The Otsu method, known for its automatic and unsupervised threshold selection capabilities, is employed in this study. By calculating the zeroth and first-order cumulative moments of the grayscale histogram, a threshold is determined to separate the target object and background effectively. Following segmentation, irrelevant information, such as background noise, is removed from the pest images.
Morphological processing
Residual branches, insect fragments, and other noise artifacts may still be present in the images even after the above processing steps. To mitigate their impact on pest counting and recognition, morphological processing techniques are applied in the designed pest recognition module of this study. Morphological operations can reduce the loss of information caused by image transformations and further refine the noise reduction after segmentation. Through experimentation with various combinations of erosion, dilation, opening, and closing operations, an optimized morphological processing method is selected. Specifically, an opening operation followed by a closing operation is performed. Morphological processing effectively eliminates remaining noise in the image and fills small holes, ensuring that the image quality meets the requirements for subsequent pest recognition and counting.
By implementing these image preprocessing methods, the presented approach aims to improve the quality of pest images captured in farmland, mitigating the impact of various natural factors. These preprocessing steps play a vital role in enhancing the accuracy and reliability of pest counting and recognition algorithms.
4.2.3 Pest image tagging and information extraction
After noise reduction, background information removal, and morphological processing, the image has met the conditions for image tagging. According to the principle of connected domain tagging, the original pest image information is tagged in order, and the tagged small image blocks are regenerated into new images. These images can be sent to the model established by TensorFlow in order for subsequent recognition processing in numerical order. The original pest image is shown in Figure 10a, and the tagged pest image is shown in Figure 10b.
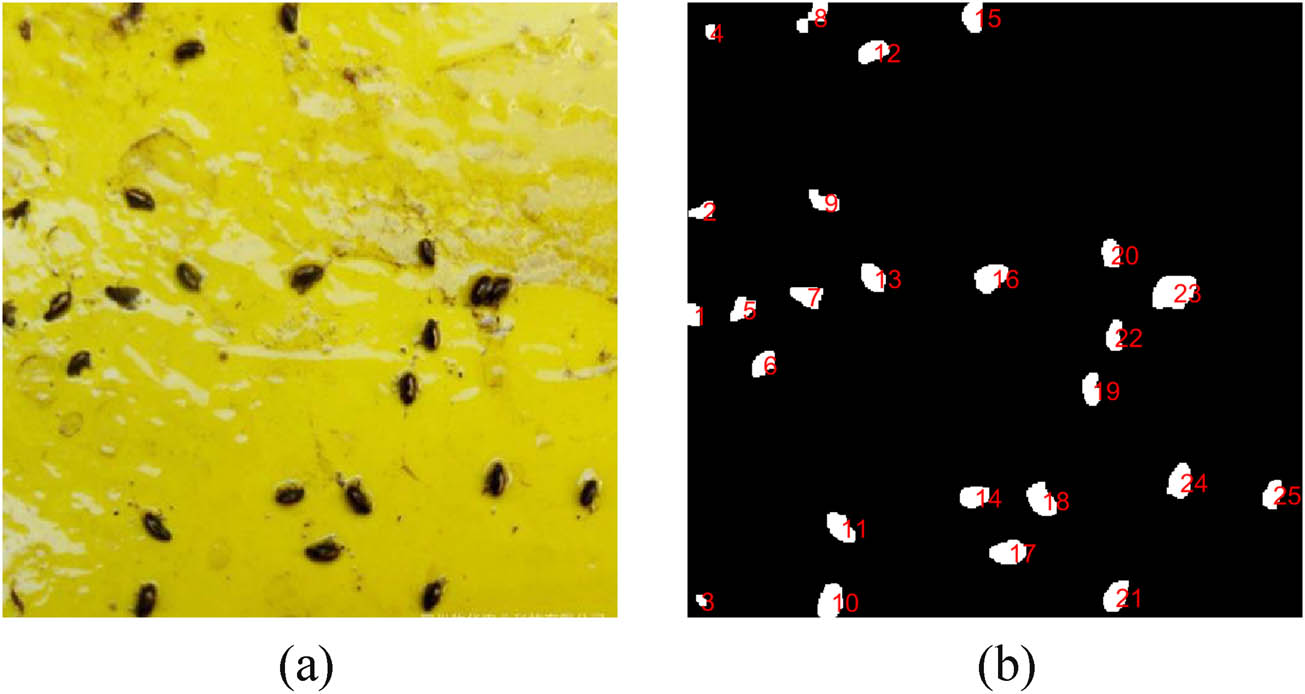
Labeling of pest image.
In the subsequent pest recognition processing under the TensorFlow framework, using the sticky board images taken by the original device directly will cause inconsistent image sizes, leading to lower recognition accuracy. After tagging, recognition information extraction, splitting, and synthesis, the images are uniformly auto-cropped to 500 × 500 pixels, which ensures improved recognition accuracy.
4.2.4 Pest image recognition and counting based on TensorFlow
TensorFlow is a powerful open-source software library for deep neural networks developed by the Google Brain team and first released in November 2015 under the Apache 2.x license. TensorFlow has good encapsulation of convolutional neural networks (CNN) mentioned in the previous section, so that developers can simply and quickly convert the designed neural network into programs for research and testing.
4.2.4.1 Pest image dataset
There are many common pests in farmland. For convenience of experiment, images of planthopper, the main pest in the growth process of crops (rice) in farmland, are selected as the dataset. Planthopper is temporarily selected as the recognition sample, but the corresponding algorithms are retained for other pests such as borer and nematode. More than 3,000 images are used for training and more than 1,000 images are used for testing in this paper. Irrelevant images are manually filtered out.
4.2.4.2 CNN
Establishing a CNN is the main process for image recognition. Since the pest image recognition module is executed at the edge computing device to further save resources while maintaining high recognition accuracy, an 11-layer small CNN is built for recognition in this experiment. The main structure of CNN model includes the input layer, convolutional layer, pooling layer, fully connected layer, and softmax layer.
The specific establishment methods of each layer of the network model are as follows:
Input layer: 500 × 500-pixel pest images after preprocessing
Convolutional layer: A total of eight layers, mainly pooling layers
Fully connected layer: Fully connected 4,096 outputs.
Output layer: Two output nodes, with brown planthopper pest and other as recognition objects. The output results here are only used in the experiment, and other pest recognition functions will be added in subsequent development.
4.2.4.3 Model parameters and model training
In the model testing phase, the number of iterations is set to 3, the number of batches read is set to 20. The learning rates are selected as 0.1, 0.05, and 0.01, respectively. The results are shown in Figure 11a. To further verify the impact of four activation functions, including ReLU, ELU, tanh, and sigmoid, on the recognition accuracy of the established neural network, we conducted actual tests on the aforementioned activation functions and obtained the results as shown in Figure 11b.
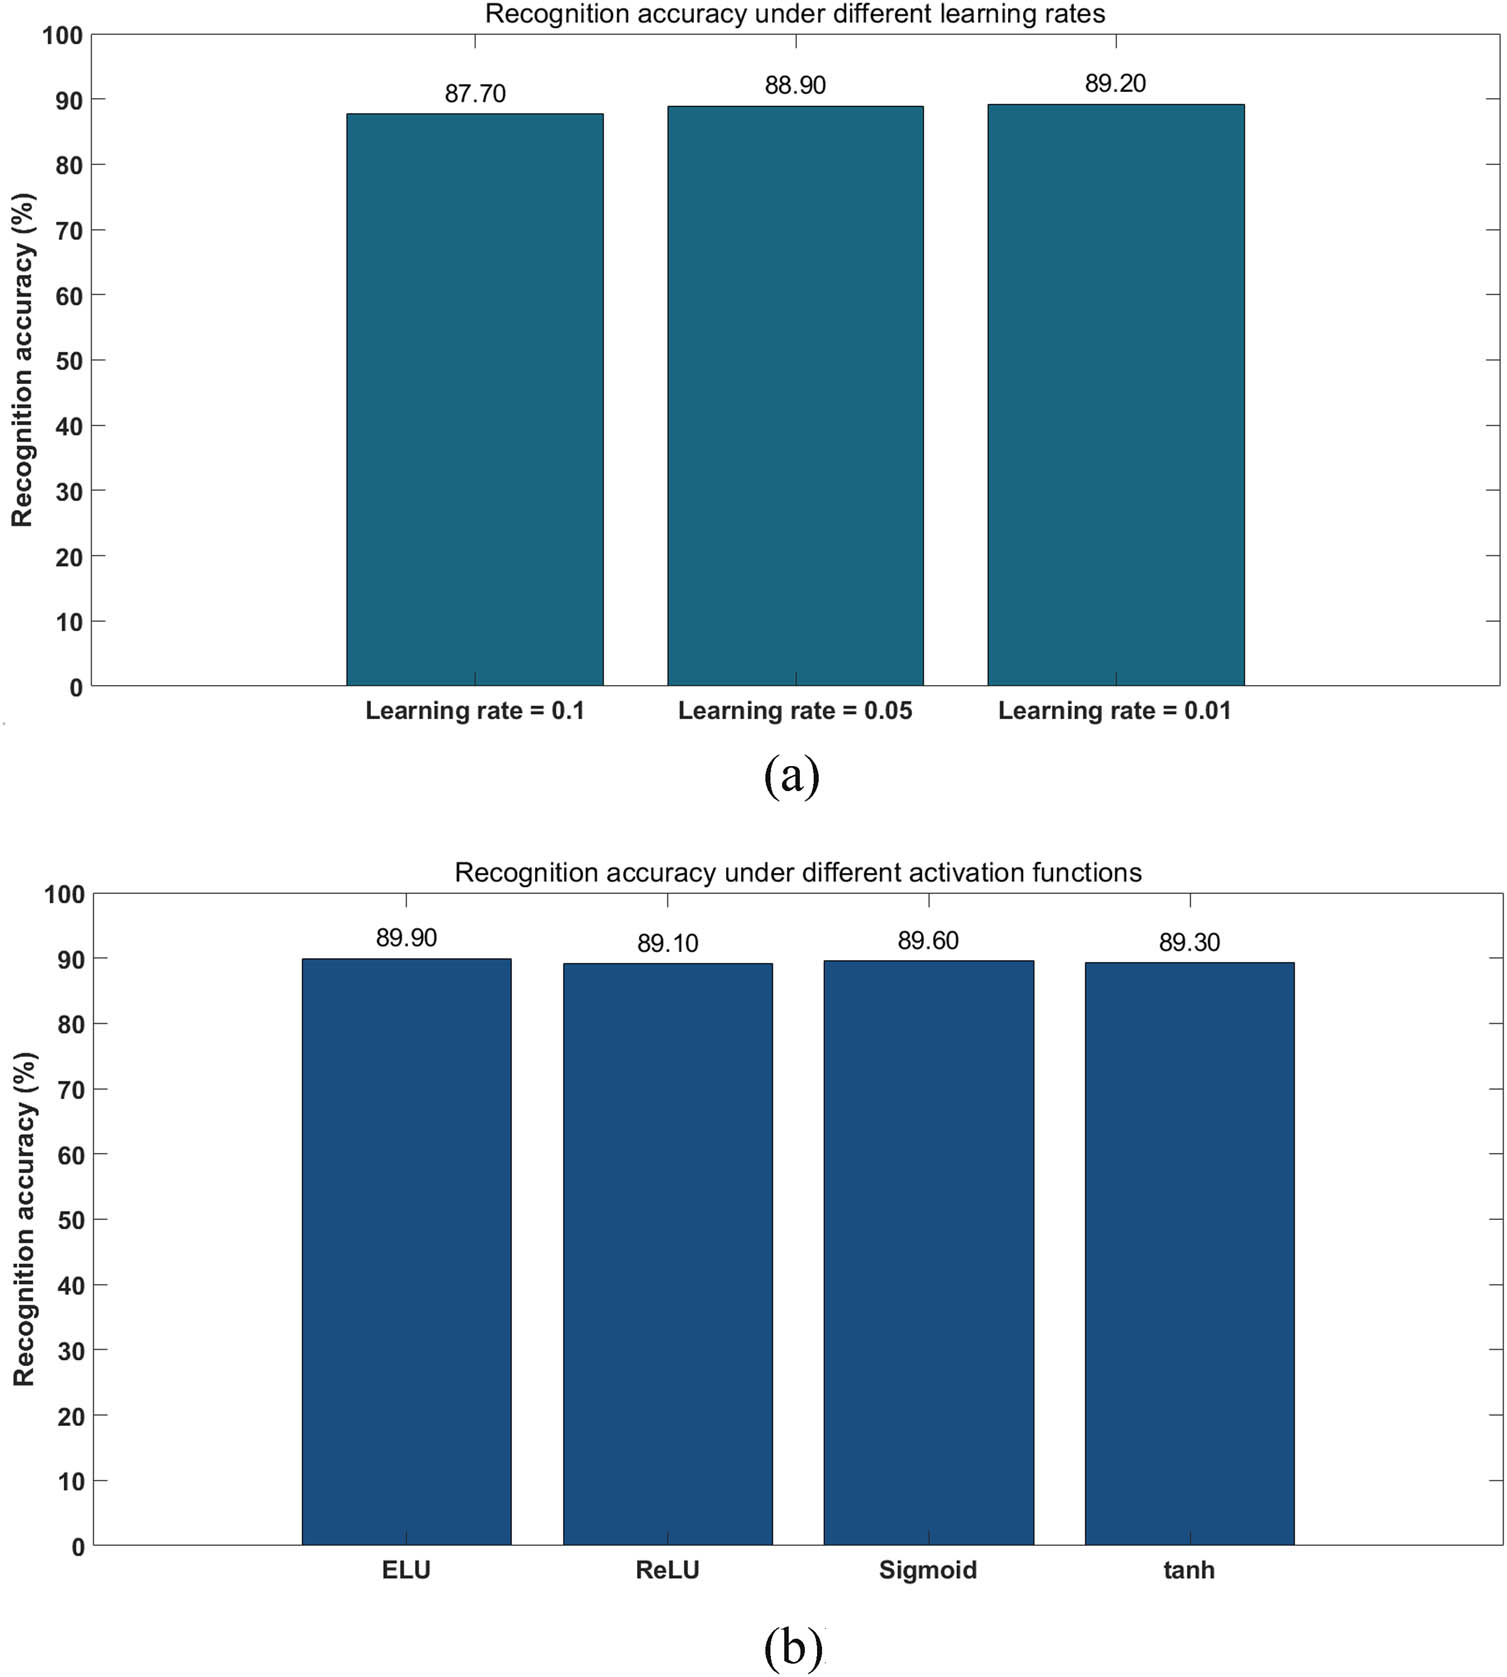
Recognition accuracy. (a) Recognition accuracy under different learning rates. (b) Recognition accuracy under different activation functions.
4.2.4.4 Evaluation of model accuracy and experimental results
To assess the performance of our model, various accuracy metrics were utilized. These metrics include confusion matrix, precision, recall, F1-score, area under the curve (AUC), and overall accuracy.
In our experiments, to demonstrate the effectiveness of the CNN EvtestNet established in this study, we conducted a comparative analysis with commonly used typical models. Our model achieved the following results: precision of 0.9059, recall of 0.9844, F1-score of 0.9436, AUC of 0.9601, and overall accuracy of 0.8940. As shown in Figure 12.
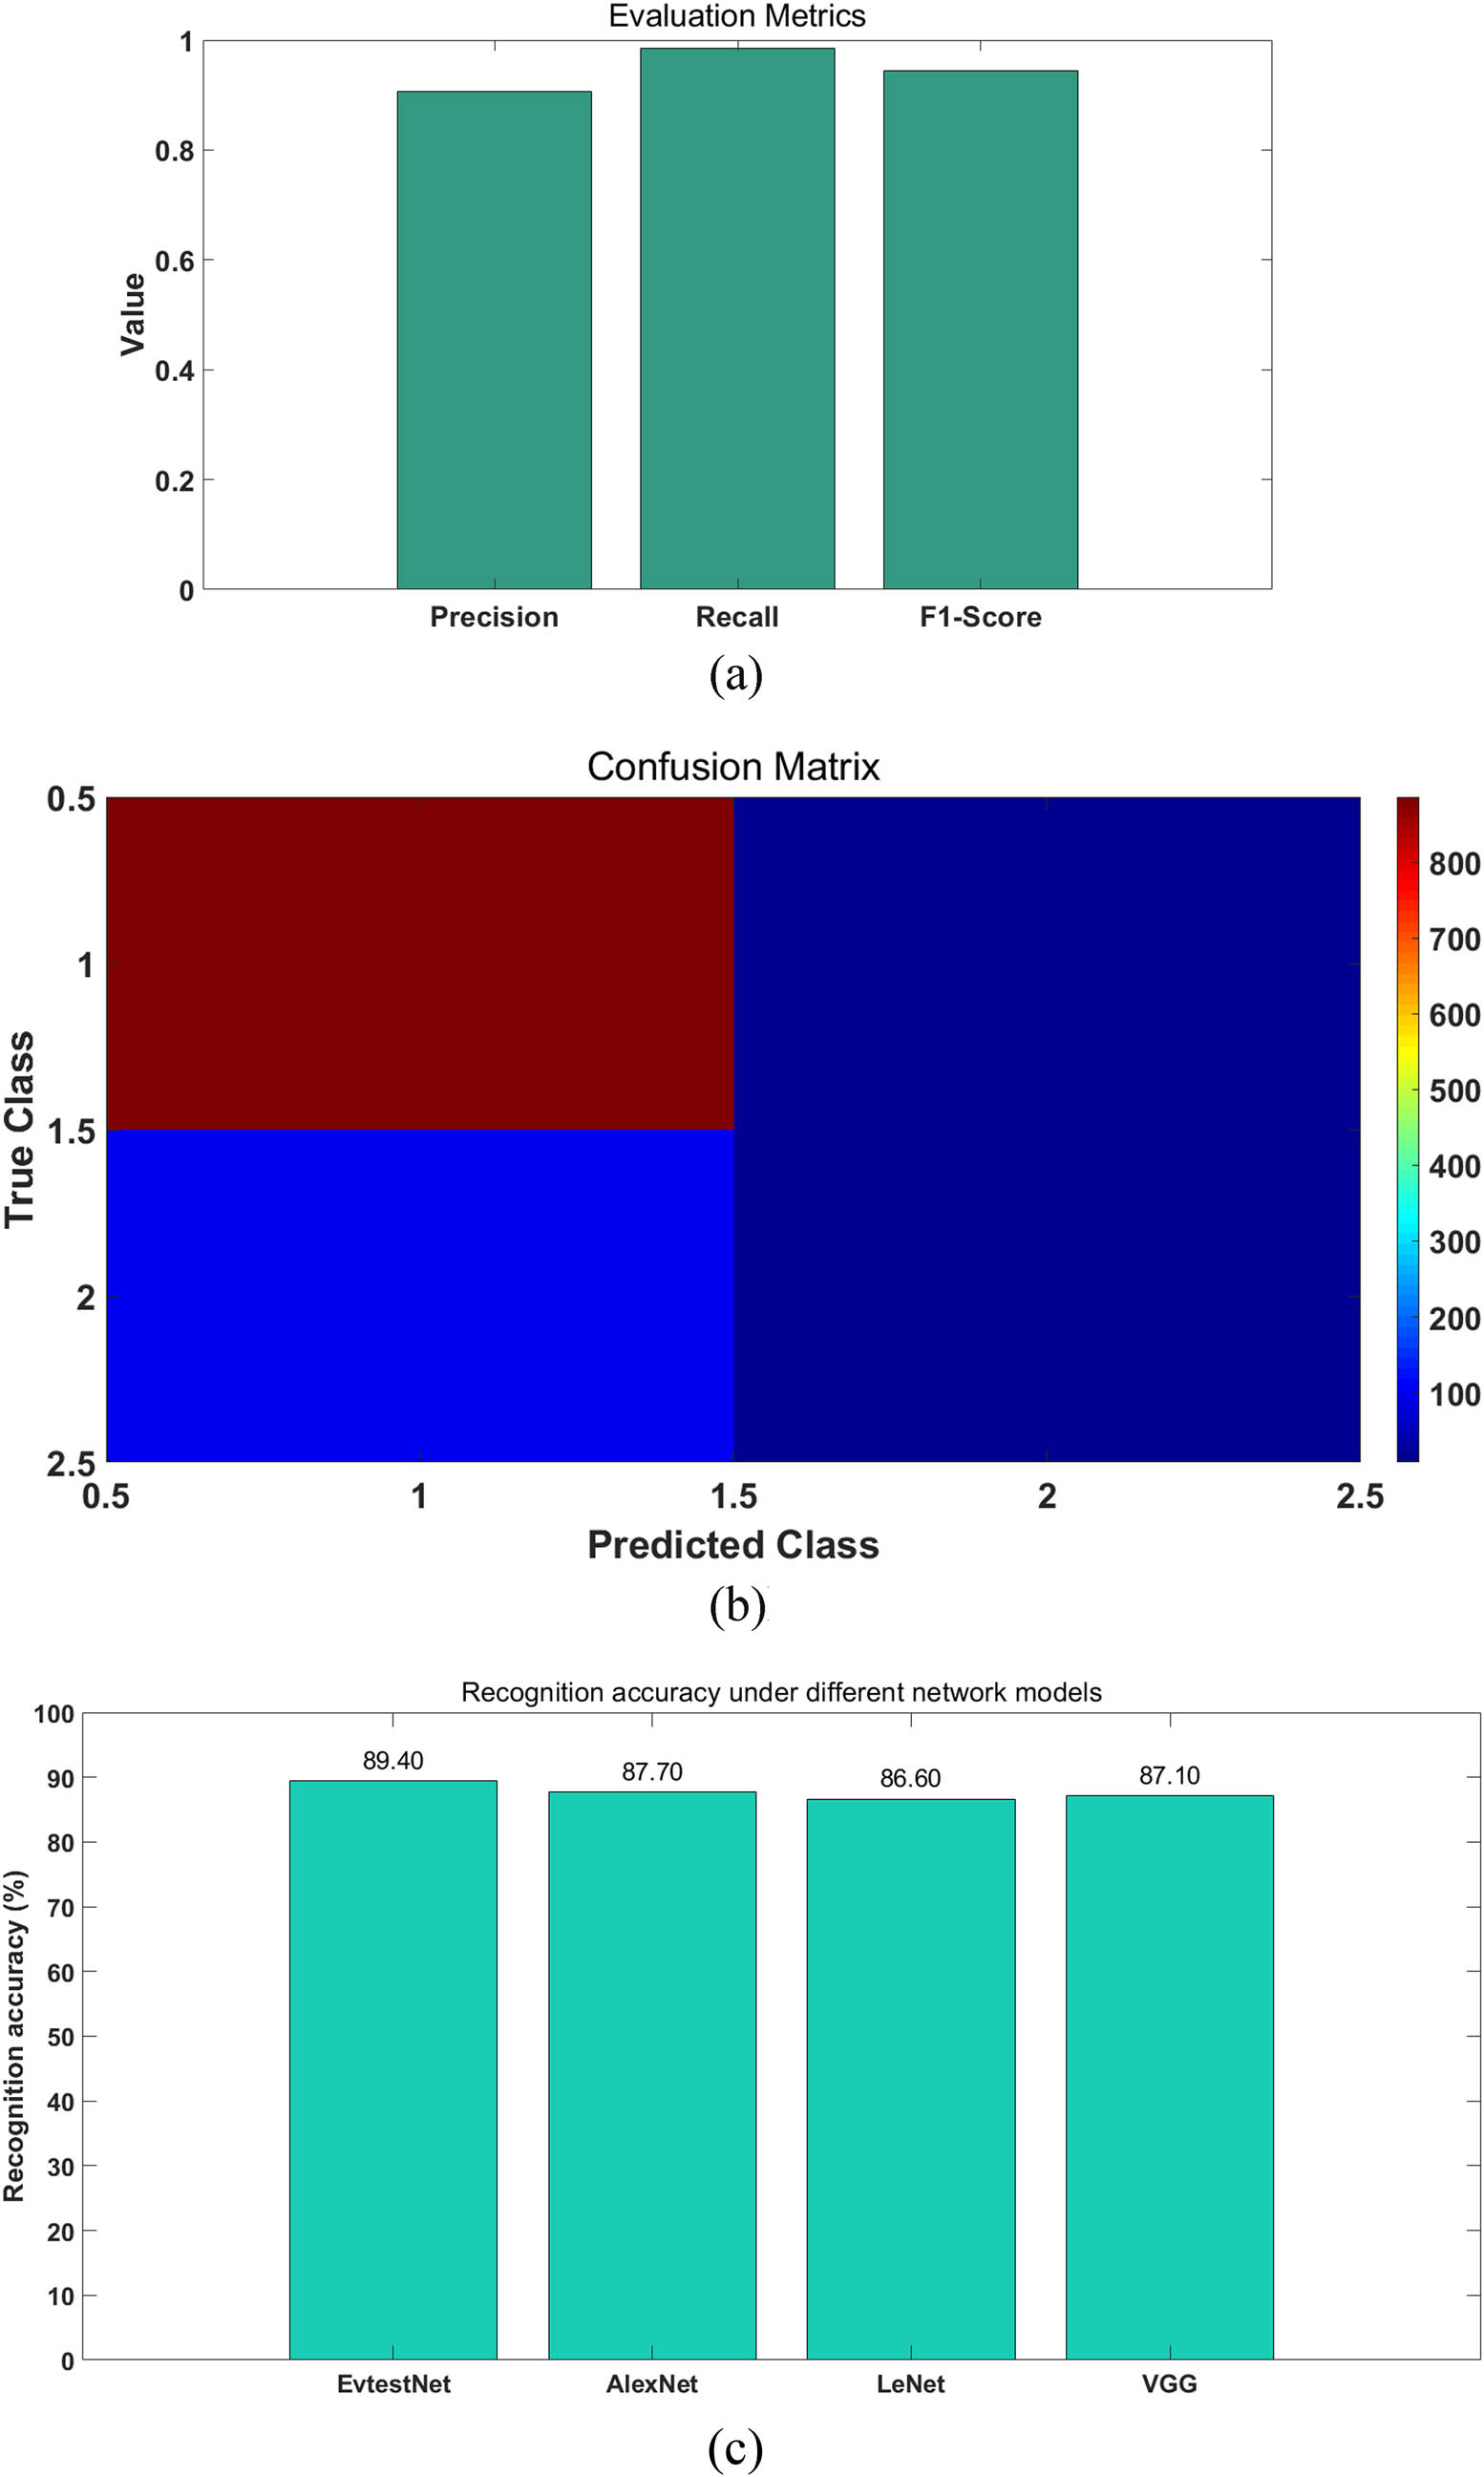
Evaluation metrics of EvtestNet. (a) Results of precision, recall and F1-score. (b) Result of Confusion matrix. (c) Recognition accuracy under different network models.
4.2.4.5 Pest image-counting experimental results
According to the pest-counting process designed in this article, we conducted actual pest-counting experiments and compared with manual counting (10 pest images randomly selected). The results are shown in Table 2, indicating a high counting accuracy.
Accuracy between automatic counting and manual counting
| Number | Automatic recognition module counting results | Manual counting results | Accuracy (%) |
|---|---|---|---|
| 1 | 28 | 30 | 93.3 |
| 2 | 29 | 32 | 90.6 |
| 3 | 16 | 16 | 100 |
| 4 | 21 | 22 | 95.5 |
| 5 | 11 | 11 | 100 |
| 6 | 18 | 20 | 90.0 |
| 7 | 26 | 29 | 89.7 |
| 8 | 16 | 16 | 100.0 |
| 9 | 30 | 33 | 90.9 |
| 10 | 20 | 22 | 90.9 |
4.2.5 Discussion on the experimental results of pest image recognition and counting
The experimental results obtained from the pest image recognition and counting experiments indicate an accuracy rate of approximately 90% for pest identification and an accuracy exceeding 90% for pest counting. From a purely data-driven perspective, the accuracy of pest identification may not be remarkable, given the current rapid advancements in neural network technology. However, the small-scale CNN developed in this study significantly conserves resources on edge devices compared to complex deep neural networks and resource-intensive image recognition techniques. This provides ample assurance for large-scale agricultural field monitoring. Moreover, by leveraging edge computing, which processes high-quality images locally without the need for transmitting large image data back to the cloud, valuable resources are conserved, effectively meeting the requirements for dynamic pest monitoring in agricultural fields.
5 Conclusion and prospects
5.1 Conclusion
This article introduces a proposed design for an IoT architecture specifically tailored for agricultural environmental monitoring. The architecture seamlessly integrates the LoRaWAN module with the pest recognition and counting module, establishing a framework at the edge computing end. By optimizing computing resources, this architecture enables real-time processing of data uploaded by online terminals. To assess the overall network transmission quality, the NS3 software is employed to simulate the deployment of monitoring nodes in agricultural environments. The experimental results demonstrate the stability of data transmission from environmental monitoring nodes using the LoRaWAN transmission protocol, regardless of the utilization of multiple gateways or monitoring nodes. The observed overall packet loss rate remains below 5%, meeting the required standard for transmission quality. As a result, this architecture effectively meets the demands of large-scale monitoring IoT applications in agricultural fields.
Additionally, this article establishes an 11-layer small CNN model on the TensorFlow platform framework. The pest sample images are trained through the image recognition process to conduct comprehensive model testing. Different learning rates, activation functions, and network models are tested to evaluate the recognition accuracy. The final results indicate that the designed model achieves 89.4% accuracy in recognizing agricultural pests, adequately fulfilling the requirements for pest warnings in agricultural environments.
5.2 Limitations and future prospects
This article has conducted research on the key technologies of agricultural environmental monitoring IoT and has achieved preliminary research results. However, there are still some areas that require further improvement.
In terms of pest recognition, the research in this article focuses on a limited number of pest species. It explores the transplantation of lightweight image neural networks to the edge and successfully achieves pest recognition.
The designed edge computing IoT system in this article only simulates the transmission data using simulation software. Therefore, it is crucial to conduct stability testing of IoT transmission in real agricultural environments.
In the future, the following areas will be further investigated:
Continuation of research on the impact of low power wide area network protocols on network transmission quality. This includes exploring the relationship between other LoRaWAN protocol parameters, such as adaptive data rate-related algorithms, and network transmission quality. It will be necessary to conduct practical testing in actual agricultural environments.
Conducting research on grid monitoring of pest conditions in large agricultural areas. This involves expanding the range of identifiable targets based on existing pest recognition equipment and algorithms. Additionally, studying the grid monitoring system for large-scale regional pest conditions will be explored. For pest conditions in different regions, the application of technologies such as artificial intelligence to predict the occurrence path of agricultural pests can provide advance warning to relevant areas.
-
Funding information: This research was funded by the Key R&D Program of the Department of Science and Technology in Jilin Province (Grant No. 20200504004YY) and the National Key Research and Development Program Subproject of China (Grant No. 2022YFD2002305-2).
-
Author contributions: Conceptualization and methodology: Mo Dong, Zhipeng Sun; validation and formal analysis: Haiye Yu, Zhipeng Sun; investigation: Lei Zhang, Yuanyuan Sui; writing—original draft preparation: Mo Dong; writing—review and editing: Haiye Yu, Lei Zhang, Yuanyuan Sui; project administration and funding acquisition: Ruohan Zhao.
-
Conflict of interest: The authors declare that they have no conflicts of interest to report regarding the present study.
-
Data availability statement: The pest monitoring device image included in this article is original and was created by the authors. The data used to support the findings of the research are included within the article.
References
[1] Muangprathub JJMP. IoT and agriculture data analysis for smart farm. Comput Electron Agric. 2019;156:467–74.10.1016/j.compag.2018.12.011Search in Google Scholar
[2] Lavanya G, Rani C, Ganeshkumar P. An automated low cost iot based fertilizer intimation system for smart agriculture. Sustain Comput: Inform Syst. 2019;28:100300.10.1016/j.suscom.2019.01.002Search in Google Scholar
[3] Shi W, Cao J, Zhang Q, Li Y, Xu L. Edge computing: Vision and challenges. Internet Things J IEEE. 2016;3(5):637–46.10.1109/JIOT.2016.2579198Search in Google Scholar
[4] Pan J, Mcelhannon J. Future edge cloud and edge computing for internet of things applications. IEEE Internet Things J. 2018;5(5):439–49.10.1109/JIOT.2017.2767608Search in Google Scholar
[5] Selimi M, Lertsinsrubtavee A, Sathiaseelan A, Cerdà-Alabern L, Navarro L. PiCasso: Enabling information-centric multi-tenancy at the edge of community mesh networks. Comput Netw. 2019;164:106897.10.1016/j.comnet.2019.106897Search in Google Scholar
[6] Kondo T, Watanabe H, Ohigashi T. Development of the edge computing platform based on functional modulation architecture. IEEE 41st Annual Computer Software and Applications Conference (COMPSAC); 2017.Search in Google Scholar
[7] Ghazal M, Basmaji T, Yaghi M, Alkhedher M, Mahmoud M, El-Baz AS. Cloud-based monitoring of thermal anomalies in industrial environments using AI and the internet of robotic things. Sensors. 2020;20(21):6348.10.3390/s20216348Search in Google Scholar PubMed PubMed Central
[8] Barro PA, Zennaro M, Pietrosemoli E. TLTN-The local things network: On the design of a LoRaWAN gateway with autonomous servers for disconnected communities. Wirel Days; 2019.10.1109/WD.2019.8734239Search in Google Scholar
[9] Gomes M, Pardal ML. Cloud vs Fog: assessment of alternative deployments for a latency-sensitive IoT application. Procedia Comput Sci. 2018;130:488–95.Search in Google Scholar
[10] Yang Y, Ge Y, Guo L, Wu Q, Peng L, Zhang E, et al. Artificial-intelligence-driven fog radio access networks: Recent advances and future trends. IEEE Wirel Commun. 2020;27(2):12–3.10.1109/MWC.2020.9085257Search in Google Scholar
[11] Kondo T, Watanabe H, Ohigashi T. Development of the edge computing platform based on functional modulation architecture 2017. IEEE 41st Annual Computer Software and Applications Conference (COMPSAC). IEEE; 2017.10.1109/COMPSAC.2017.108Search in Google Scholar
[12] Skarlat O, Nardelli M, Schulte S, Borkowski M, Leitner P. Optimized IoT service placement in the fog. Serv Oriented Comput Appl. 2017;11(4):427–43.10.1007/s11761-017-0219-8Search in Google Scholar
[13] Gomes M, Pardal ML. Cloud vs Fog: Assessment of alternative deployments for a latency-sensitive IoT application. Procedia Comput Sci. 2018;130:488–95.10.1016/j.procs.2018.04.059Search in Google Scholar
[14] O’Donovan P, Gallagher C, Leahy K, O’Sullivan DTJ. A comparison of fog and cloud computing cyber-physical interfaces for industry 4.0 real-time embedded machine learning engineering applications. Comput Ind. 2019;110:12–35.10.1016/j.compind.2019.04.016Search in Google Scholar
[15] Musa Z, Vidyasankar K. A Fog computing framework for blackberry supply chain management. Procedia Comput Sci. 2017;113:178–185.10.1016/j.procs.2017.08.338Search in Google Scholar
[16] Habib G, Nadipuram RP, John JE, Hung TN. A neuro-fuzzy approach for insect classification. World Automation Congress, Third International Symposium on Soft Computing for Industry, Maui, Hawaii; 2000.Search in Google Scholar
[17] Solis-Sanchez LO, Garcia-Escalante R, Castafieda-Miranda JJ. Machinevision algorithm for shiteflies (Bemisia tabaciGenn.) scouting under greenhouse environment. J Appl Entomol. 2009;133(7):546–52.10.1111/j.1439-0418.2009.01400.xSearch in Google Scholar
[18] Ebrahimi MA, Khoshtaghaza MH, Minaei S, Jamshidi B. Vision-based pest detection based on SVM classification method. Comput Electron Agric. 2017;137:52–8.10.1016/j.compag.2017.03.016Search in Google Scholar
[19] Shahrul NY, Lakhmi J. An insect classification analysis based on shape features using quality threshold ARTMAP and moment invariant. Appl Intell. 2012;37(1):12–30.10.1007/s10489-011-0310-3Search in Google Scholar
[20] Michael M, Anna TW. Automatic species identification of live moths. Knowl Syst. 2006;20(2):195–202.10.1016/j.knosys.2006.11.012Search in Google Scholar
[21] Zhong Y, Gao J, Lei Q, Zhou Y. A vision-based counting and recognition system for flying insects in intelligent agriculture. Sensors. 2018;18(5):1489.10.3390/s18051489Search in Google Scholar PubMed PubMed Central
[22] Liu L, Wang R, Xie C, Yang P, Wang F, Sudirman S, et al. PestNet: An end-to-end deep learning approach for large-scale multi-class pest detection and classification. IEEE Access. 2019;7:45301–12.10.1109/ACCESS.2019.2909522Search in Google Scholar
© 2024 the author(s), published by De Gruyter
This work is licensed under the Creative Commons Attribution 4.0 International License.
Articles in the same Issue
- Research Articles
- A study on intelligent translation of English sentences by a semantic feature extractor
- Detecting surface defects of heritage buildings based on deep learning
- Combining bag of visual words-based features with CNN in image classification
- Online addiction analysis and identification of students by applying gd-LSTM algorithm to educational behaviour data
- Improving multilayer perceptron neural network using two enhanced moth-flame optimizers to forecast iron ore prices
- Sentiment analysis model for cryptocurrency tweets using different deep learning techniques
- Periodic analysis of scenic spot passenger flow based on combination neural network prediction model
- Analysis of short-term wind speed variation, trends and prediction: A case study of Tamil Nadu, India
- Cloud computing-based framework for heart disease classification using quantum machine learning approach
- Research on teaching quality evaluation of higher vocational architecture majors based on enterprise platform with spherical fuzzy MAGDM
- Detection of sickle cell disease using deep neural networks and explainable artificial intelligence
- Interval-valued T-spherical fuzzy extended power aggregation operators and their application in multi-criteria decision-making
- Characterization of neighborhood operators based on neighborhood relationships
- Real-time pose estimation and motion tracking for motion performance using deep learning models
- QoS prediction using EMD-BiLSTM for II-IoT-secure communication systems
- A novel framework for single-valued neutrosophic MADM and applications to English-blended teaching quality evaluation
- An intelligent error correction model for English grammar with hybrid attention mechanism and RNN algorithm
- Prediction mechanism of depression tendency among college students under computer intelligent systems
- Research on grammatical error correction algorithm in English translation via deep learning
- Microblog sentiment analysis method using BTCBMA model in Spark big data environment
- Application and research of English composition tangent model based on unsupervised semantic space
- 1D-CNN: Classification of normal delivery and cesarean section types using cardiotocography time-series signals
- Real-time segmentation of short videos under VR technology in dynamic scenes
- Application of emotion recognition technology in psychological counseling for college students
- Classical music recommendation algorithm on art market audience expansion under deep learning
- A robust segmentation method combined with classification algorithms for field-based diagnosis of maize plant phytosanitary state
- Integration effect of artificial intelligence and traditional animation creation technology
- Artificial intelligence-driven education evaluation and scoring: Comparative exploration of machine learning algorithms
- Intelligent multiple-attributes decision support for classroom teaching quality evaluation in dance aesthetic education based on the GRA and information entropy
- A study on the application of multidimensional feature fusion attention mechanism based on sight detection and emotion recognition in online teaching
- Blockchain-enabled intelligent toll management system
- A multi-weapon detection using ensembled learning
- Deep and hand-crafted features based on Weierstrass elliptic function for MRI brain tumor classification
- Design of geometric flower pattern for clothing based on deep learning and interactive genetic algorithm
- Mathematical media art protection and paper-cut animation design under blockchain technology
- Deep reinforcement learning enhances artistic creativity: The case study of program art students integrating computer deep learning
- Transition from machine intelligence to knowledge intelligence: A multi-agent simulation approach to technology transfer
- Research on the TF–IDF algorithm combined with semantics for automatic extraction of keywords from network news texts
- Enhanced Jaya optimization for improving multilayer perceptron neural network in urban air quality prediction
- Design of visual symbol-aided system based on wireless network sensor and embedded system
- Construction of a mental health risk model for college students with long and short-term memory networks and early warning indicators
- Personalized resource recommendation method of student online learning platform based on LSTM and collaborative filtering
- Employment management system for universities based on improved decision tree
- English grammar intelligent error correction technology based on the n-gram language model
- Speech recognition and intelligent translation under multimodal human–computer interaction system
- Enhancing data security using Laplacian of Gaussian and Chacha20 encryption algorithm
- Construction of GCNN-based intelligent recommendation model for answering teachers in online learning system
- Neural network big data fusion in remote sensing image processing technology
- Research on the construction and reform path of online and offline mixed English teaching model in the internet era
- Real-time semantic segmentation based on BiSeNetV2 for wild road
- Online English writing teaching method that enhances teacher–student interaction
- Construction of a painting image classification model based on AI stroke feature extraction
- Big data analysis technology in regional economic market planning and enterprise market value prediction
- Location strategy for logistics distribution centers utilizing improved whale optimization algorithm
- Research on agricultural environmental monitoring Internet of Things based on edge computing and deep learning
- The application of curriculum recommendation algorithm in the driving mechanism of industry–teaching integration in colleges and universities under the background of education reform
- Application of online teaching-based classroom behavior capture and analysis system in student management
- Evaluation of online teaching quality in colleges and universities based on digital monitoring technology
- Face detection method based on improved YOLO-v4 network and attention mechanism
- Study on the current situation and influencing factors of corn import trade in China – based on the trade gravity model
- Research on business English grammar detection system based on LSTM model
- Multi-source auxiliary information tourist attraction and route recommendation algorithm based on graph attention network
- Multi-attribute perceptual fuzzy information decision-making technology in investment risk assessment of green finance Projects
- Research on image compression technology based on improved SPIHT compression algorithm for power grid data
- Optimal design of linear and nonlinear PID controllers for speed control of an electric vehicle
- Traditional landscape painting and art image restoration methods based on structural information guidance
- Traceability and analysis method for measurement laboratory testing data based on intelligent Internet of Things and deep belief network
- A speech-based convolutional neural network for human body posture classification
- The role of the O2O blended teaching model in improving the teaching effectiveness of physical education classes
- Genetic algorithm-assisted fuzzy clustering framework to solve resource-constrained project problems
- Behavior recognition algorithm based on a dual-stream residual convolutional neural network
- Ensemble learning and deep learning-based defect detection in power generation plants
- Optimal design of neural network-based fuzzy predictive control model for recommending educational resources in the context of information technology
- An artificial intelligence-enabled consumables tracking system for medical laboratories
- Utilization of deep learning in ideological and political education
- Detection of abnormal tourist behavior in scenic spots based on optimized Gaussian model for background modeling
- RGB-to-hyperspectral conversion for accessible melanoma detection: A CNN-based approach
- Optimization of the road bump and pothole detection technology using convolutional neural network
- Comparative analysis of impact of classification algorithms on security and performance bug reports
- Cross-dataset micro-expression identification based on facial ROIs contribution quantification
- Demystifying multiple sclerosis diagnosis using interpretable and understandable artificial intelligence
- Unifying optimization forces: Harnessing the fine-structure constant in an electromagnetic-gravity optimization framework
- E-commerce big data processing based on an improved RBF model
- Analysis of youth sports physical health data based on cloud computing and gait awareness
- CCLCap-AE-AVSS: Cycle consistency loss based capsule autoencoders for audio–visual speech synthesis
- An efficient node selection algorithm in the context of IoT-based vehicular ad hoc network for emergency service
- Computer aided diagnoses for detecting the severity of Keratoconus
- Improved rapidly exploring random tree using salp swarm algorithm
- Network security framework for Internet of medical things applications: A survey
- Predicting DoS and DDoS attacks in network security scenarios using a hybrid deep learning model
- Enhancing 5G communication in business networks with an innovative secured narrowband IoT framework
- Quokka swarm optimization: A new nature-inspired metaheuristic optimization algorithm
- Digital forensics architecture for real-time automated evidence collection and centralization: Leveraging security lake and modern data architecture
- Image modeling algorithm for environment design based on augmented and virtual reality technologies
- Enhancing IoT device security: CNN-SVM hybrid approach for real-time detection of DoS and DDoS attacks
- High-resolution image processing and entity recognition algorithm based on artificial intelligence
- Review Articles
- Transformative insights: Image-based breast cancer detection and severity assessment through advanced AI techniques
- Network and cybersecurity applications of defense in adversarial attacks: A state-of-the-art using machine learning and deep learning methods
- Applications of integrating artificial intelligence and big data: A comprehensive analysis
- A systematic review of symbiotic organisms search algorithm for data clustering and predictive analysis
- Modelling Bitcoin networks in terms of anonymity and privacy in the metaverse application within Industry 5.0: Comprehensive taxonomy, unsolved issues and suggested solution
- Systematic literature review on intrusion detection systems: Research trends, algorithms, methods, datasets, and limitations

