The role of the O2O blended teaching model in improving the teaching effectiveness of physical education classes
-
Honghui Qiao


Abstract
The deep fusion of Internet technology and education is constantly pushing forward the reform of university education. Traditional educational ideas, concepts, and models cannot keep pace with the times, and hybrid teaching has become a new way of education in colleges and universities. To improve the teaching effect of physical education classes, the study used a blended teaching model and designed a teaching evaluation and performance prediction model under the blended teaching model based on an improved cluster analysis method and attention mechanism. The lab results indicated that under the blended teaching model, students’ performance increased by 12.89 points, and the level of skill mastery and proficiency increased by 26.52 and 28.55%, respectively, with grades more inclined to high score distribution. “Excellent” grade clustering increased by 77.71%, and “Good” grade clustering increased by 19.01%. The minimum error sum of squares of the improved clustering algorithm was 58.18 and 36.25% lower than the other two algorithms, and the clustering results were more relevant. The two-way attention mechanism algorithm predicted higher accuracy results and performed best on all four evaluation metrics, with a prediction accuracy of 98.23%, an accuracy of 98.42%, and an F1 value of 91.78%. This hybrid teaching model is more in line with the characteristics of the physical education teaching discipline, successfully cultivates students’ independent learning ability, stimulates students’ love for physical education courses, and achieves better teaching results.
1 Introduction
The traditional teaching model is one in which the teacher dominates the teaching, imparting knowledge and skills to students in the form of blackboard teaching and hands-on demonstrations, which are less interactive. Because of the limited time and space, teachers often neglect the development of students’ practical skills and do not engage much with information technology. However, in modern society, where information technology is highly developed, education has become more “easy” and “efficient” [1]. Information technology such as the Internet and new media has changed the traditional teaching model, and the online and offline hybrid teaching model has become a future trend in higher education and has been widely used in recent years in the education work of universities worldwide. The hybrid teaching model allows teachers to provide students with a digital teaching environment where they can vividly present teaching content in the classroom and understand student learning dynamics afterwards. The hybrid teaching mode integrates online teaching resources, which are rich in teaching resources; it improves the traditional teaching environment and enhances the teaching effect, realizing the integration of traditional teaching and online teaching, which complement each other [2]. The concept of O2O (online to offline) is extended from the organic integration of the e-commerce model to the education field, forming a new hybrid teaching mode of O2O. Although the O2O blended teaching model has been used in many disciplines, it is less practiced in physical education, and there is no corresponding teaching effectiveness evaluation model. Therefore, it is necessary to apply O2O to the teaching practice of physical education and to evaluate and predict the teaching effectiveness. On the one hand, the study constructs a teaching evaluation model based on the K-modes cluster analysis technique and improves the selection of cluster centres and the traditional distance measure of cluster centres; on the other hand, the study designs an improved two-way attention mechanism based on the attention mechanism to fully explore the association between features and grades and predict students’ final grades. The model is applied to evaluate and predict the teaching effectiveness and performance of physical education classes, which is expected to form timely teaching feedback and learning warning, and further improve the quality of teaching in the blended teaching mode in physical education courses.
2 Related works
With the wave of the information age driving the growth of the Internet+, the education sector has also entered a new era of online technological innovation, with blended learning models playing an important role in the teaching of various courses. More and more educational experts and researchers are becoming aware of the far-reaching implications of blended learning for teaching reform, and many studies have been worked out on this topic. To improve the quality of medical English teaching and students’ motivation to learn medical English, Pan used the theme-based approach and the blended teaching model in the teaching of medical English and conducted an empirical analysis using the teaching of medical English at a medical university as an example. The results of the study showed that the theme-based teaching method combined with the hybrid teaching model of online and offline teaching made a significant contribution to the development of effective medical English teaching [3]. To improve the quality of learning in human parasitology courses, Fan et al. developed a hybrid teaching model for human parasitology based on a small private online course, including pre-course pre-reading, in-class learning, post-course consolidation, and teaching assessment modules. The blended teaching model was successfully used in a 2019 clinical medicine course at a university, and results showed that students’ independent learning ability as well as their understanding of knowledge were enhanced [4]. In the context of the New Coronary Pneumonia epidemic, where subjects are mostly taught in a blended model, Chai et al. examined students’ learning satisfaction and well-being to verify the effectiveness of a blended model of leading subject education under the principles of positive youth development. The results denoted that students expressed higher satisfaction with the design of the mixed-model design of the curriculum and students were significantly more positive about the principles of adolescent development [5]. Du and Yang introduced the mixed-model teaching model into the teaching of engineering applied mathematics based on project-based construction measures. The mixed-model teaching model can provide convenient teaching tests at the post-class review stage, helping students to accurately identify various problems and communicate with the teacher timely communication, which enhances the communication of teachers and students. The blended teaching mode maximizes students’ motivation and initiative and urges teachers to strive to improve their own knowledge and adapt to the blended teaching mode of the Internet+ project [6].
To promote the growth of intelligent teaching evaluation and avoid the problem of low accuracy of intelligent evaluation systems due to the subjectivity of teaching evaluation, Lin et al. constructed a teaching evaluation model using data mining techniques and classification algorithms of machine learning. The results of controlled experiments showed that the model further improved the scientific rationality of teaching evaluation, and the model score was close to the standard manual score [7]. To solve the fuzziness and complexity of the current teaching evaluation model, Sun et al. proposed a method for evaluating the teaching effectiveness of university teachers based on a two-class fuzzy set. Evaluation indicators include teaching attitudes, content expertise, and educational methods and effectiveness, using two-class fuzzy sets and perception theory to model subjective judgments and capture evaluation uncertainty. A linguistic weighted average operator is applied to aggregate the evaluation index score weights and integrate the uncertain information with the evaluation results, which improves the evaluation accuracy and is more accurate and reliable than the one-class fuzzy set method [8]. Multi-expert teaching performance assessment is a multi-attribute group decision problem. In order to assess teaching effectiveness, Wang et al. applied a proportional hesitant fuzzy linguistic term set to express decision makers’ preferences for evaluation indicators, proposed a proportional hesitant fuzzy linguistic operator, and applied the method to practical teaching performance assessment. The results showed that the method was more scientific, objective, and accurate [9]. Qin et al. established a more discipline-specific evaluation method based on interval hierarchical analysis to reduce uncertainty in assessing the quality of higher mathematics education and developed details of the criteria and assessors’ weights. The feasibility of the evaluation method was verified through practical cases, and the proposed method has the ability to handle large uncertainties [10].
Although the blended teaching model has been developed and researched for a period of time, proving the unique advantages and pedagogical advancement of the blended teaching model in various disciplines, there are still some problems with the blended teaching model, as well as relatively little research on teaching evaluation and learning effect prediction models related to the blended teaching model, and the reasonable use of teaching data to form teaching evaluation is of more profound practical significance for maintaining the orderly operation of the education system.
3 Design of teaching evaluation and achievement prediction models based on K-modes and self-attention
3.1 Design of a hybrid teaching condition evaluation model based on an improved K-modes algorithm
O2O teaching mode refers to a teaching mode that combines online education and offline physical education. O2O provides course content, teaching resources, and learning support through online platforms while combining with offline physical education venues for practical teaching and tutoring services. O2O teaching mode makes full use of the advantages of Internet technology to make up for the limitations of traditional offline education and, at the same time, provides a more flexible and personalized learning mode. O2O teaching mode makes full use of the advantages of Internet technology to make up for the limitations of traditional offline education and, at the same time, provides a more flexible and personalized learning mode.
In view of the advantages of the O2O teaching mode, the study integrates the O2O teaching mode into physical education teaching. Although physical education belongs to a discipline with strong practicality, physical education still involves the teaching of certain theoretical knowledge, and the online teaching part of the program can provide sports-related video lectures, online reading materials, and so on. In the post-epidemic era, facing some special circumstances, such as during the epidemic or when students are physically unable to come to school, online teaching can be used as a way of distance learning to ensure that students do not interrupt their learning due to external factors.
In the O2O blended teaching model, the interaction between teachers and students leaves a large amount of data on online teaching activities, and valid teaching data can provide reliable support for teaching evaluation. Assessment mechanisms occupy an important position in the design of the blended teaching model, which requires more scientific and quantitative evaluation methods, and the teaching quality and teaching evaluation system needs to be improved in parallel [11]. Therefore, the study introduces clustering algorithms and attention mechanisms into the hybrid teaching model to build a more scientific and reasonable teaching evaluation and learning prediction model and improves the hybrid teaching model in the reverse direction based on the evaluation feedback.
The study constructs a teaching evaluation model for the O2O blended teaching model based on the K-modes clustering analysis technique. The K-modes clustering algorithm is a typical division-based clustering algorithm, an unsupervised learning algorithm that uses simple matching distance (SMD) to classify variables [12,13].
In the K-modes algorithm,
The K-modes algorithm uses the Hamming distance as the basis for sample classification. The distance of any sample point
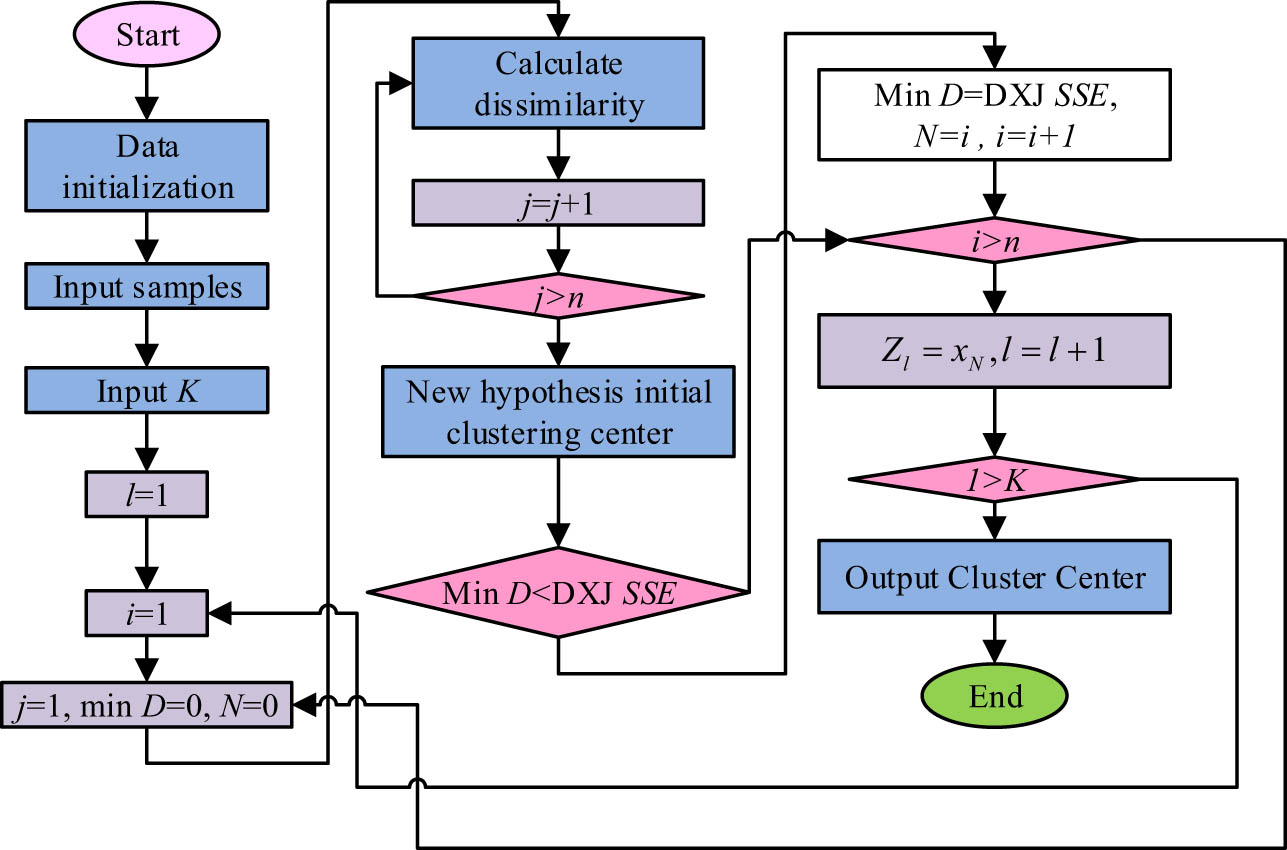
For a given initial number of clusters and an initial cluster centre, the sample set is assigned to different data classes based on the Hamming distance size. Then, the average distance from each sample data point to its corresponding centre is calculated, and the position of the cluster centre is continuously updated. If each cluster centre and sample agree with the last clustering result, the clustering is completed; if there are differences in the results, the steps are repeated until the end of the iteration, and a schematic illustration of the K-modes clustering analysis process is shown in Figure 1.
K-modes cluster analysis process diagram.
Most of the traditional K-mode algorithms are clustering for the known number of clusters
The number of occurrences of each value in the sample data is calculated in equation (4). In equation (4),
Traditional K-modes use a frequency-based anomaly detection algorithm for similarity calculation in equation (5), where
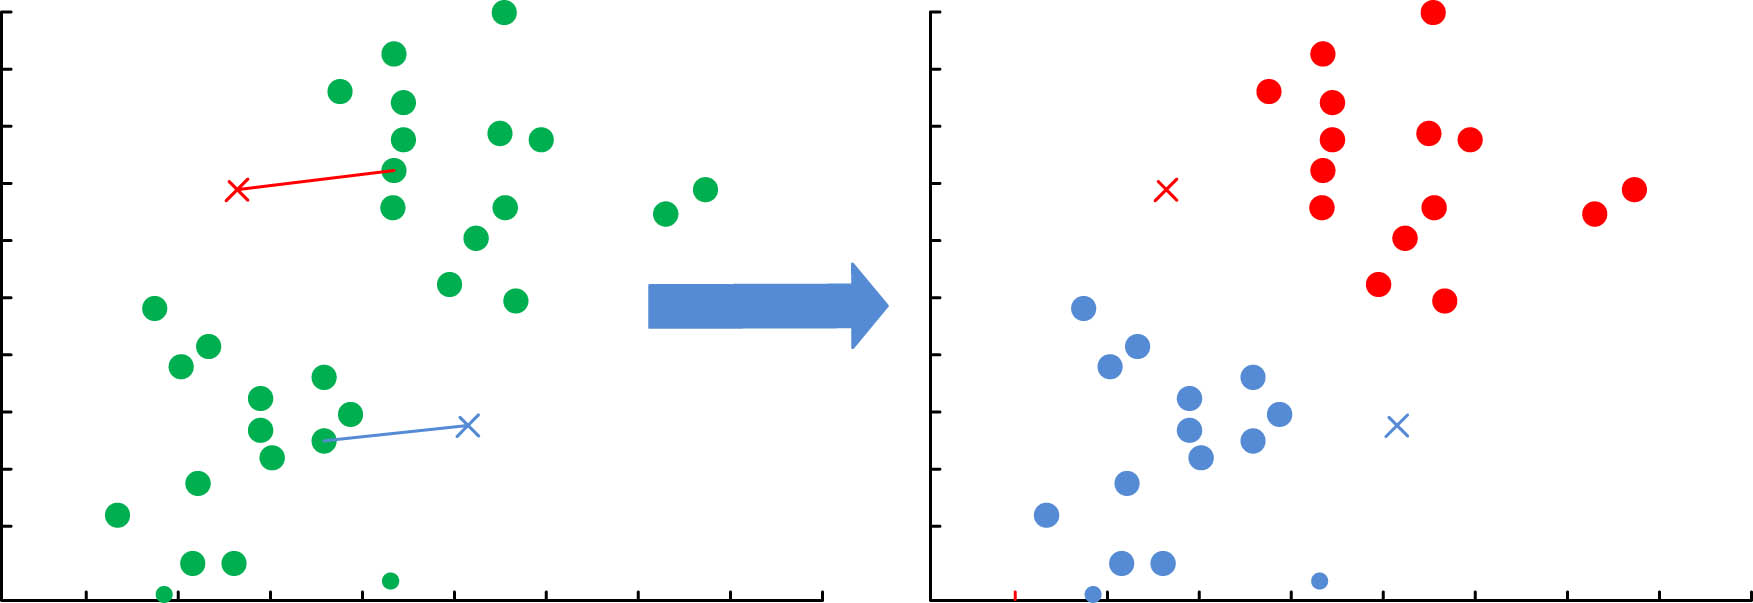
The traditional K-modes clustering algorithm usually selects the cluster centres randomly, but this increases the probability of isolated points being selected and also increases the probability of different cluster centres being close together, making the clustering results less stable and accurate. The study improves on this by assuming that all data points are likely to be cluster centres and calculating the SSE value, with the minimum point taken as the initial cluster centre for
Small error squared algorithm for solving initial cluster centres.
The clustering centres are calculated in equation (6). In equation (6),
The K-modes clustering algorithm measures the clustering distance by the similarity between samples
The distance between two different samples of data under the attribute
The distance metric between two sample data is defined in equation (8).
3.2 Design of a model for predicting achievement in a blended teaching model based on improved self-attention
O2O is a hybrid teaching model that combines online and offline teaching and learning and is guided by computer-based Internet technology that allows for the integration of multiple teaching resources for innovative teaching and learning. Various online learning behaviour data can be used to predict learning outcomes, provide timely feedback to teachers, and monitor student learning [16].
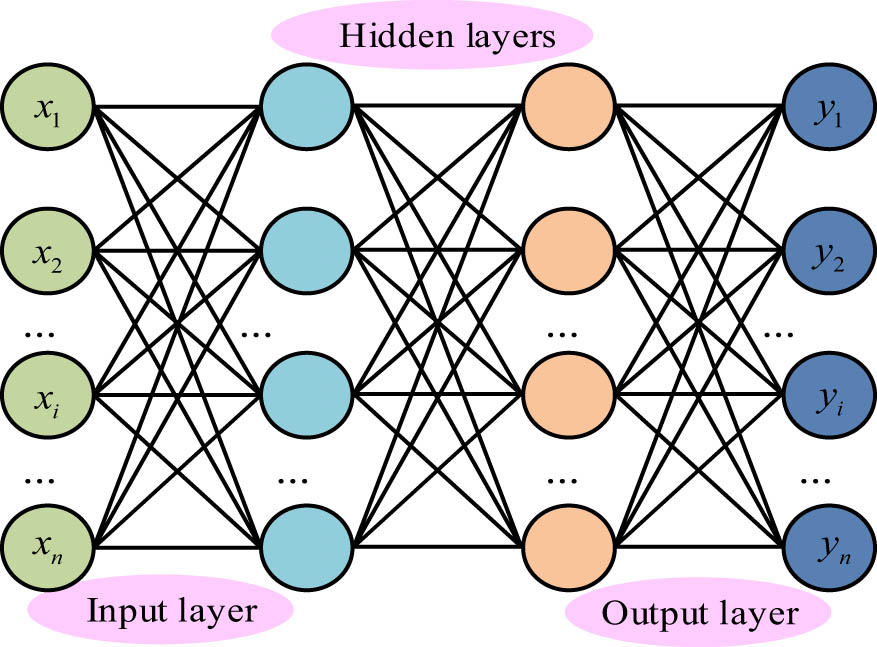
Learning behaviours include online teaching attendance, online assignment completion rate, online learning hours, number of questions and posts, and platform visits. A Self-Attention-based performance prediction model was constructed. Each feature that affects learning performance is modelled, and feature weights are calculated by the Self-Attention mechanism to improve the accuracy of the algorithm. The attention mechanism is a form of deep learning. With limited computer power, the attention mechanism allocates computational resources to more important tasks, reduces the attention of non-critical information to solve the algorithm information overload, and improves the processing efficiency and accuracy of the algorithm, which is widely used in image processing, language processing, and speech recognition. The network schematic of the attention mechanism is shown in Figure 3 [17,18].
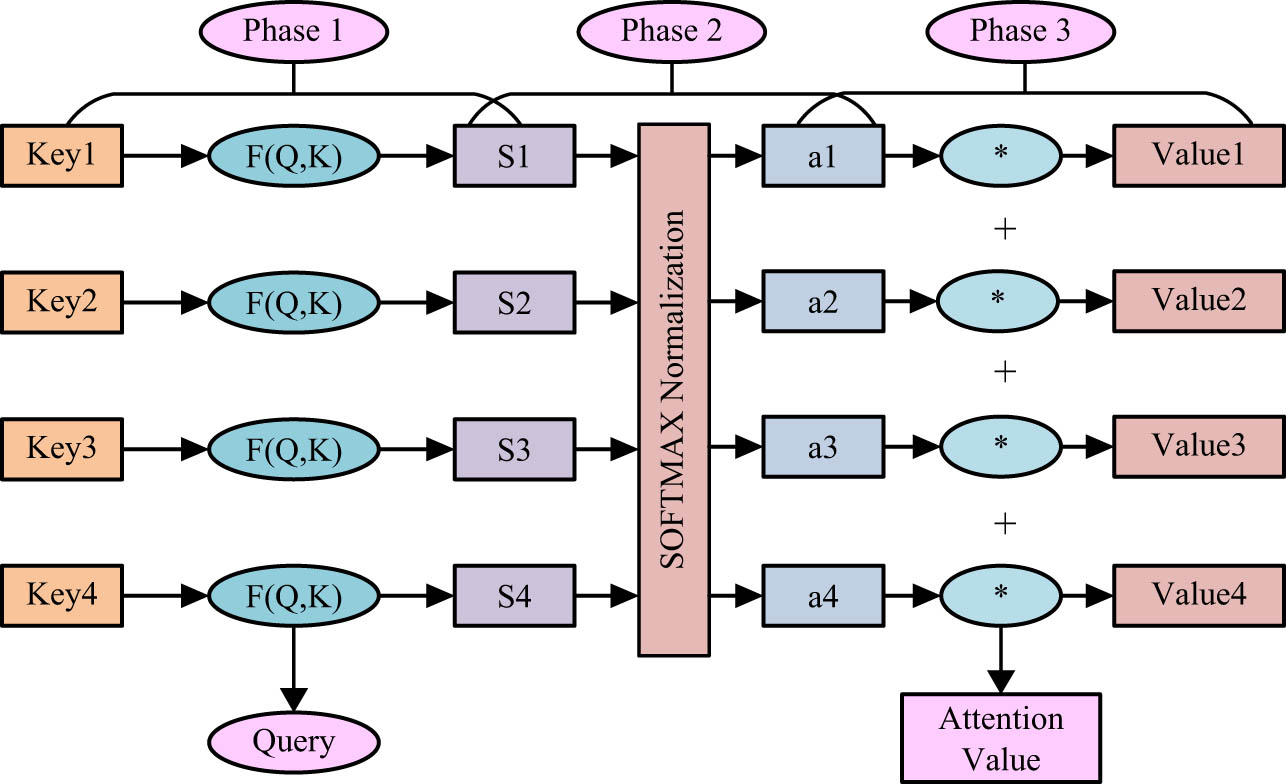
Schematic diagram of attention mechanism network.
The calculation process of the attention mechanism is shown in equation (9), where
The input coding layer of the model needs to be preceded by pre-processing of the raw data for a uniform data coding transformation. Data with large values of attributes are normalized using the min–max normalization method. The coding layer first performs discrete-value vectorization, which will linearly vary the input feature vectors, as shown in equation (10), where
The self-attentive mechanism mines the degree of influence of different generic features with greater accuracy, and the weights are calculated in equation (11).
Following this, a vector of attribute features of student behaviour can be obtained from
However, students’ historical grades are also critical to the prediction of grades. Students’ final grades are strongly correlated with their historical grades in the first two stages. The study designs an improved two-way attention (TWA) mechanism to further explore the correlation information between each feature data and grades, calculate the attention scores of the two-stage grades using two attentions, and predict grades after further feature fusion. The TWA model framework is shown in Figure 4 [19,20].
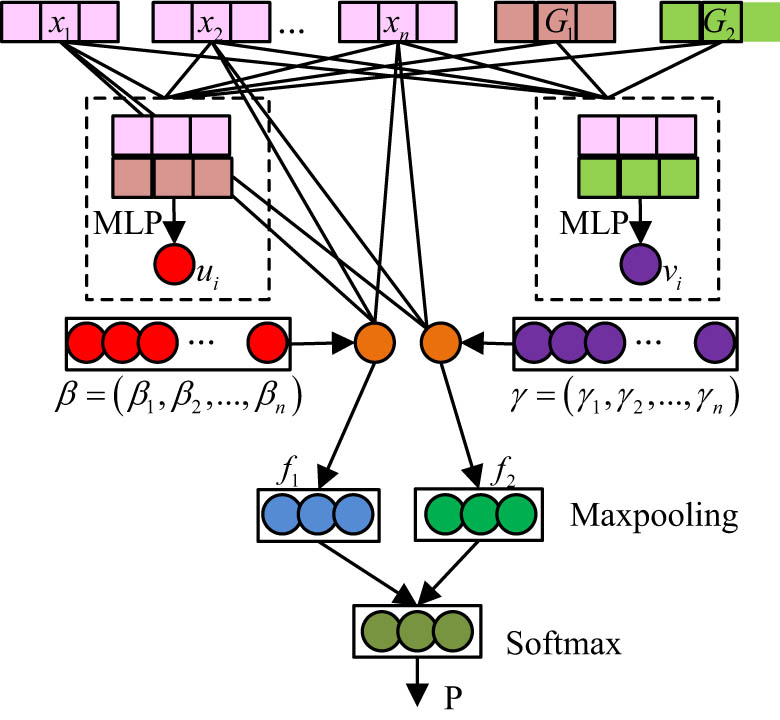
Two-way attention model framework.
The coding layer of TWA is similar to the single attention mechanism, using a high-dimensional parameter matrix to transform discrete attribute values and historical grades into a feature matrix
A multi-layer perceptron (MLP) with two fully connected layers is used for attention weighting, and the MLP structure is shown in Figure 5.
Structure diagram of multi-layer perceptron.
The weight calculation process is shown in equation (14), where
The attention scores for each of the two historical stages were obtained by renormalizing ownership to
The two attention scores are weighted and summed with
Finally, the features of
Ultimately, the label prediction layer predicts student achievement categories based on attribute features and calculates scores for each category using the
The model was trained using a backpropagation algorithm with a classification loss of cross entropy [21]. The L2 regular term is used to constrain the function to avoid overfitting, and the loss function is given in equation (19). In equation (19),
4 Performance testing of the O2O hybrid teaching model for teaching evaluation and performance prediction
4.1 Performance analysis of the teaching evaluation model of the O2O blended teaching model
The evaluation data came from the real data in the academic affairs management system of a university, and the specific teaching evaluation indicators included teaching quality, teaching attitude, teaching skills, and extra-curricular links. The trend of clusters 1, 2, and 3 is shown in Figure 6. From Figure 6, most of the teaching evaluations are distributed in three grades: “excellent,” “good,” and “moderate.” With the use of the blended teaching mode, the first and second clusters show an increasing trend over the semester, while the third cluster shows a decreasing trend, with the percentage of “excellent” rating increasing from 15.7 to 27.9% and the percentage of “good” rating increasing from 24.2% to 28.8. The blended teaching mode has achieved better teaching results, and the teaching evaluation has gradually increased.
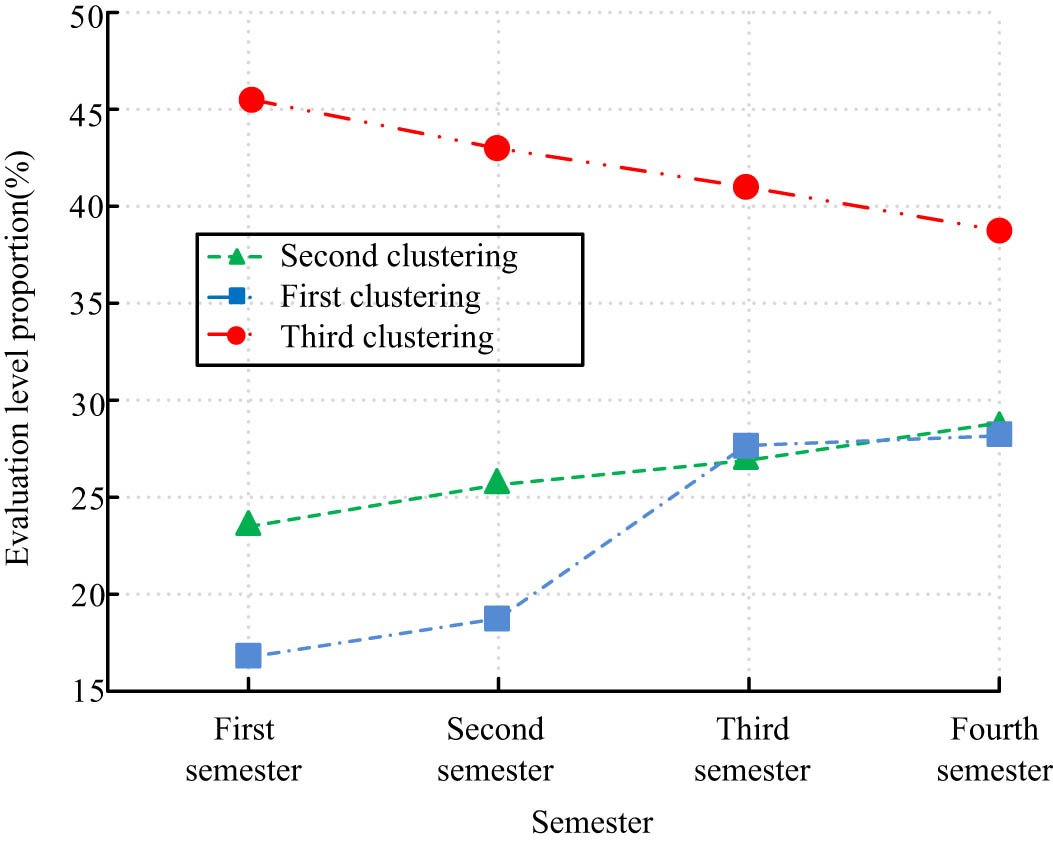
Proportion of different cluster evaluation indicators.
Publicly available datasets from different domains, including Iris flower dataset (Iris), Wine Quality Dataset (Wine Quality Dataset), Anomalous Network Traffic Dataset, Twitter user dataset, and Facial Expression Recognition Dataset, are used to divide the datasets required for the experiments into the training set and the testing set at a ratio of 9:1. The clustering centre, number of clustered samples, minimum error sum of squares, accuracy, and recall were introduced as evaluation metrics. The research constructed model was compared with the algorithms of random determination of clustering centres + simple ratio distance and SSE method to determine clustering centres + AVF, and the outcomes are denoted in Table 1.
Comparison of three different clustering algorithms and their respective indicators
| Algorithm | Cluster centre | Samples | Result samples | SSEmin | Accuracy | Recall |
|---|---|---|---|---|---|---|
| Random + SMD | (4, 4, 3, 5) | 1,167 | 394 | 1,669 | 0.845 | 0.846 |
| (5, 4, 3, 3) | 386 | |||||
| (3, 5, 5, 3) | 387 | |||||
| SSE + AVF | (5, 4, 3, 5) | 1,167 | 429 | 951 | 0.912 | 0.873 |
| (3, 4, 3, 5) | 297 | |||||
| (3, 4, 2, 3) | 441 | |||||
| SSE + Co-occurrence | (5, 5, 4, 5) | 1,167 | 347 | 698 | 0.974 | 0.961 |
| (4, 4, 3, 3) | 486 | |||||
| (3, 3, 3, 2) | 334 |
As seen in Table 1, the improved K-modes performed optimally in all metrics. The minimum sum of squared errors of the improved K-modes algorithm is 58.18 and 36.25% lower than the other two algorithms, respectively. The SSE is smaller when the samples within each type of cluster are more similar, and the clusters are tighter. Therefore, the improved K-modes algorithm clustering is optimal, with the data points within each cluster being closest to the centre of mass.
The core idea of the K-modes algorithm is to make the clusters themselves as compact as possible and the different clusters as separated as possible; thus, the optimal goal of clustering is to make the average intra-class distance small and the average inter-class distance large. However, the three algorithms do not agree on the measure of distance, so the proportion of the average intra-class distance to the average inter-class distance is used as the rating index, and the experimental results are expressed in Table 2. In Table 2, the improved K-modes clustering algorithm has the smallest distance, and the smaller ratio indicates better clustering and the stronger the relevance of the clustering results, and the algorithm proves the effectiveness of the blended teaching model.
Average intraclass distance and average interclass distance of different clustering algorithms
| Random + SMD | SSE + AVF | SSE + Co-occurrence | |||||||
|---|---|---|---|---|---|---|---|---|---|
| Z1 | Z2 | Z3 | Z1 | Z2 | Z3 | Z1 | Z2 | Z3 | |
| Z1 | 0.7156 | 0.8346 | 0.8697 | 0.3479 | 0.7485 | 0.7948 | 0.2134 | 0.6475 | 0.7102 |
| Z2 | — | 0.5497 | 0.8102 | — | 0.3587 | 0.7435 | — | 0.2354 | 0.6539 |
| Z3 | — | — | 0.4375 | — | — | 0.3459 | — | — | 0.2107 |
The statistical results of the Jaccard coefficient (JC) and Fowlkes and Mallows Indicator (FMI) are shown in Figure 7. As can be seen from Figure 7(a), the JC value of the research design model is the highest on all datasets, and the clustering results are similar to the real situation. As can be seen from Figure 7(b), the FMI value of the research design model is higher than the other two models, and the results take values above 0.75, which comprehensively evaluates that the SSE + Co-occurrence model clustering has a high accuracy rate.
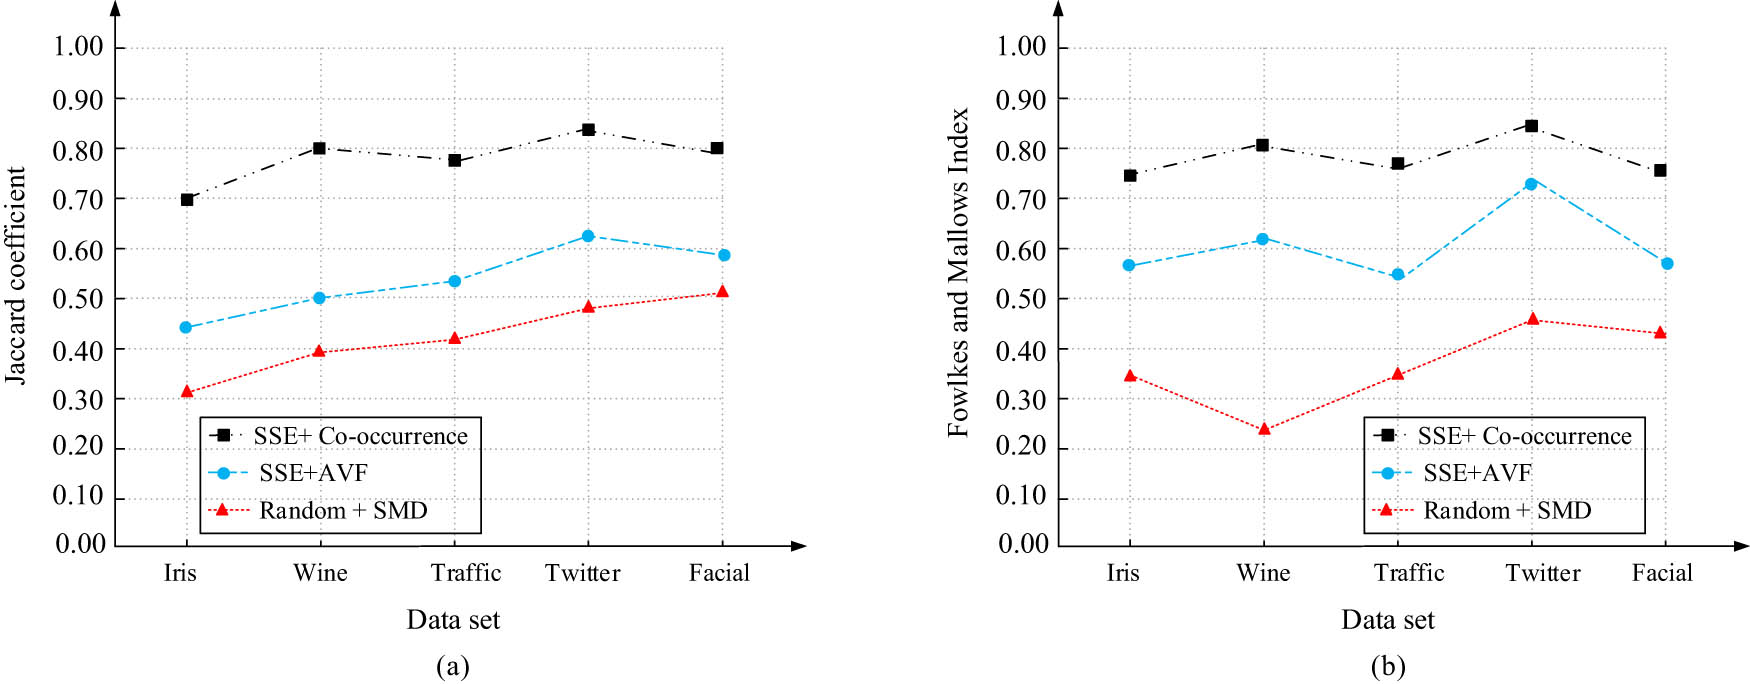
Comparison of clustering performance of different models. (a) JC and (b) FMI.
4.2 Performance testing of the O2O blended learning model performance prediction model
The study conducted performance tests on the TWA algorithm. The dataset contained 1,784 valid data, including 30 feature attributes such as students’ basic information, learning behaviour information, and students’ historical grades in the previous two stages. The rate of the training set to the test set was 7:3, and the prediction results of the TWA algorithm for the final grades are shown in Figure 8. The results predicted by the model are basically the same as the actual grades, with only minor differences, which can be considered to be within the normal error range. The model predicts with high accuracy and is able to make accurate predictions about the teaching performance of the blended teaching mode of PE. The model can be used in conjunction with the blended teaching approach to provide timely feedback and early warning of learning, prompting teachers to change their teaching strategies and urge students to adjust their learning styles and attitudes.
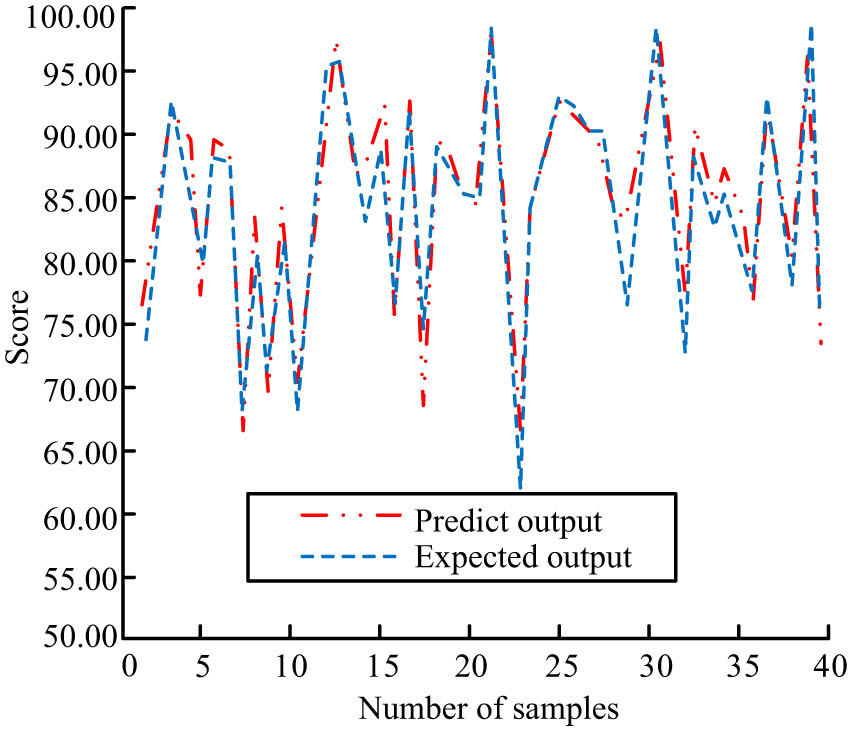
Comparison between predicted values and actual values of predicted data.
Both historical and final predicted scores were divided into four grades, A for “excellent,” B for “good,” C for “moderate,” and D for “fail.” The attention weighting results for all attributes are shown in Figure 9. The TWA model visualises the weighting of factors and allows teachers to develop more precise and detailed blended personalized instruction for different students.
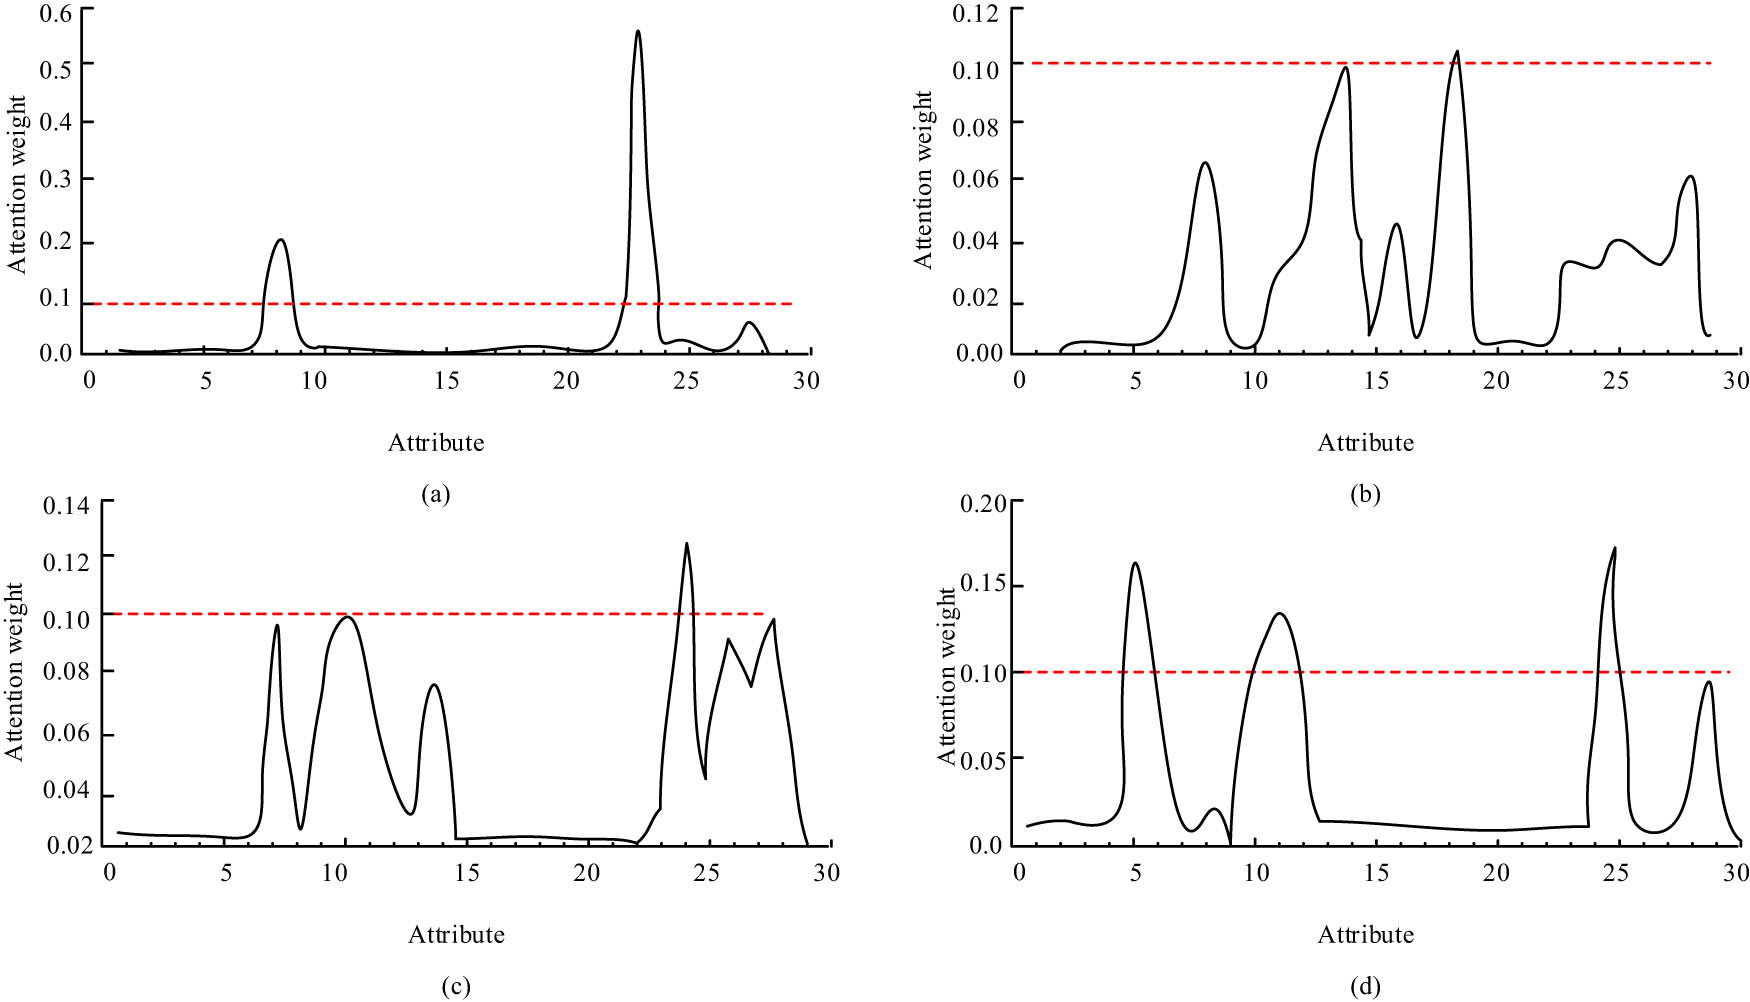
Attribute probability distribution. (a) Level A, (b) level B, (c) level C, and (d) level D.
TWA was compared with five common prediction methods, namely Self-Attention, support vector machine, parsimonious Bayes, decision tree, and logistic regression. The model training results are expressed in Figure 10, in which the TWA algorithm performed best in all four evaluation metrics, accuracy, precision, recall, and F1-value, with 98.23% prediction accuracy and 98.42% precision, which were 57.45 and 135.57% better than the worst-performing plain Bayes, respectively, and better than the Self-Attention algorithm which did not consider 6.62% improvement in accuracy and 4.45% improvement in precision compared to the Self-Attention algorithm which did not consider the fusion of historical performance features. For the contradictory indicator of accuracy, recall, the TWA algorithm still showed the highest value of 92.45%, and the algorithm had a low miss rate; the overall evaluation indicator F1 was 91.78%, which was a good balance between accuracy and recall, and the algorithm had the best overall learning performance.
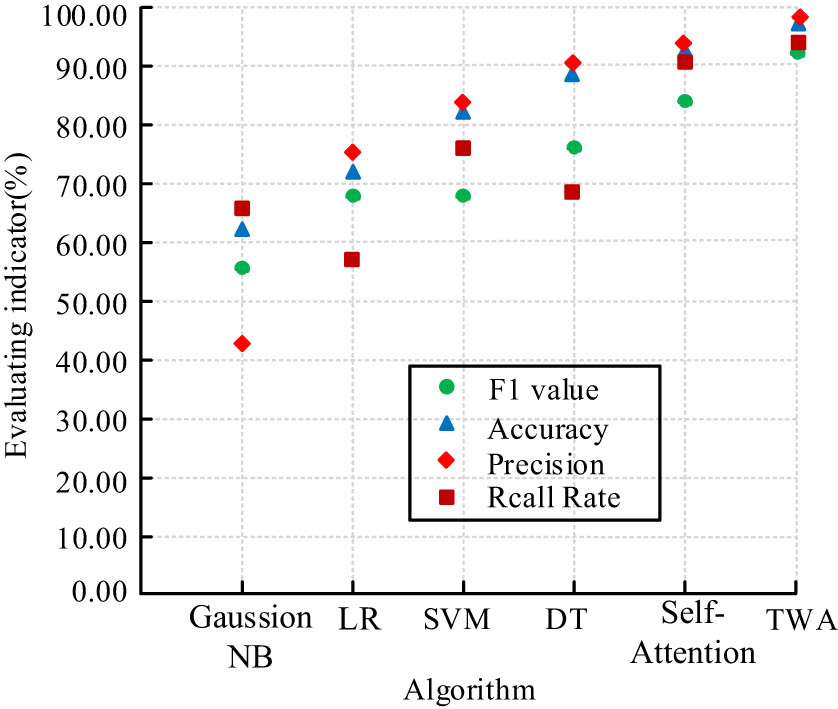
Performance indicators of different algorithms.
5 Conclusion
In response to the dilemmas faced by the current traditional physical education teaching model, the study used a hybrid teaching model based on O2O and designed an improved teaching evaluation and performance prediction model based on the K-modes clustering method and attention mechanism. The lab outcomes denoted that students in the experimental group using the blended teaching model received an overall improvement in PE, with an average score increase of 12.89 points and an increase in skill mastery level and skill proficiency of 26.52 and 28.55%, respectively. There was an increase in the distribution of high grades and no failures. The clustering of “excellent” and “good” grades increased, and the “medium” clustering decreased. The TWA algorithm is a good example of the effectiveness of the blended teaching model, as the minimum error sum of squares is 58.18 and 36.25% lower than the other two algorithms, and the higher the similarity of the samples, the tighter the clusters and the stronger the correlation between the clusters. The TWA algorithm performed best in four evaluation indicators, namely accuracy, precision, recall, and F1-value, with a prediction accuracy of 98.23% and precision of 98.42%, an increase of 6.62% in accuracy and 4.45% in precision compared to the Self-Attention algorithm; the comprehensive The F1 value of the evaluation index is 91.78%, which is a good balance between accuracy and recall, and the algorithm has the best overall learning performance. The study validates the results of the O2O blended teaching model for physical education, which offers a guideline for the growth of active student autonomy in physical education and helps to further optimize the O2O blended teaching model. However, there is still a need to collect more comprehensive behavioural data to promote the learning structure of the model and enhance the learning efficiency of the algorithm.
-
Funding information: The author states no funding involved.
-
Author contributions: The author has accepted responsibility for the entire content of this manuscript and consented to its submission to the journal, reviewed all the results, and approved the final version of the manuscript. QHH designed the experiments, carried them out, and prepared the manuscript.
-
Conflict of interest: The author states no conflict of interest.
-
Data availability statement: Data sharing is not applicable to this article as no datasets were generated or analysed during the current study.
References
[1] Yan Z. Research on the current situation and improvement strategy of curriculum teaching mode reform in Colleges and Universities. Front Educ Res. 2021;4(14):28–30.10.25236/FER.2021.041405Search in Google Scholar
[2] Xueli Y, Xiaohua W. The design and teaching practice of college SPOc mixed teaching mode--based on the macroeconomics course. Adv Educ Technol Psychol. 2022;6(9):39–44.Search in Google Scholar
[3] Pan G. Application of theme-based approach and blended teaching model in college medical english teaching. Pac Int J. 2022;5(3):52–6.10.55014/pij.v5i3.197Search in Google Scholar
[4] Fan YT, Liu YQ, Yang Y. Application of the small private online course-based blended teaching model in Human Parasitology teaching. Chin J Schistosomiasis Control. 2022;34(4):417–9.Search in Google Scholar
[5] Chai W, Li X, Shek DTL. The effectiveness of a leadership subject using a hybrid teaching mode during the pandemic: objective outcome and subjective outcome evaluation. Int J Environ Res Public Health. 2022;19(16):9809–22.10.3390/ijerph19169809Search in Google Scholar PubMed PubMed Central
[6] Du W, Yang N. The construction of “Internet Plus Project” mixed teaching mode in the course of engineering applied mathematics. Curric Teach Methodol. 2022;5(5):109–14.Search in Google Scholar
[7] Lin L, Yuan X, Elhoseny M. Smart teaching evaluation model using weighted naive bayes algorithm. J Intell Fuzzy Syst. 2021;40(2):2791–801.10.3233/JIFS-189320Search in Google Scholar
[8] Sun X, Cai C, Pan S, Bao N, Liu N. A university teachers’ teaching performance evaluation method based on type-II fuzzy. Mathematics. 2021;9(17):2126–41.10.3390/math9172126Search in Google Scholar
[9] Wang L, Rong L, Teng F, Liu P. Teaching performance evaluation based on the proportional hesitant fuzzy linguistic prioritized choquet. Int J Comput Intell Syst. 2021;14(1):635–50.10.2991/ijcis.d.210112.001Search in Google Scholar
[10] Qin Y, Hashim SRM, Sulaiman J. An interval AHP technique for classroom teaching quality evaluation. Educ Sci. 2022;12(11):736–48.10.3390/educsci12110736Search in Google Scholar
[11] Huang W. Simulation of English teaching quality evaluation model based on gaussian process machine learning. J Intell Fuzzy Syst. 2021;40(2):2373–83.10.3233/JIFS-189233Search in Google Scholar
[12] Zhang C, Gao R, Wang J, Chen S, Liu F, Ren J, Feng X. MD-SPKM: A set pair k-modes clustering algorithm for incomplete categorical matrix data. Intell Data Anal. 2021;25(6):1507–24.10.3233/IDA-205340Search in Google Scholar
[13] Tang MJ, Li T, Zhu R. A cluster analysis method of software development activities based on event log. Recent Adv Comput Sci Commun. 2021;14(6):1843–51.10.2174/2666255813666191204144931Search in Google Scholar
[14] Raheem S, Shehabi SA, Nassief AM. MIGR: a categorical data clustering algorithm based on information gain in rough set theory. Int J Uncertainty Fuzziness Knowl Syst. 2022;30(5):757–71.10.1142/S0218488522500210Search in Google Scholar
[15] Jiang Z, Liu X, Zang W. A kernel-based intuitionistic weight fuzzy k-modes algorithm using coupled chained P system combines DNA genetic rules for categorical data. Neurocomputing. 2023;528(1):84–96.10.1016/j.neucom.2023.01.020Search in Google Scholar
[16] Zhang M, Zhang L. Cross-cultural O2O English teaching based on AI emotion recognition and neural network algorithm. J Intell Fuzzy Syst Appl Eng Technol. 2021;40(4):7183–94.10.3233/JIFS-189546Search in Google Scholar
[17] Wang M, Chen H, Li Y, You YH, Zhu JL. Multi-scale pedestrian detection based on self-attention and adaptively spatial feature fusion. IET Intell Transp Syst. 2021;15(6):837–49.10.1049/itr2.12066Search in Google Scholar
[18] Li S, Cao J, Yao J, Zhu JH, He XX, Jiang QR. Adaptive aggregation with self-attention network for gastrointestinal image classification. IET Image Process. 2022;16(9):2384–97.10.1049/ipr2.12495Search in Google Scholar
[19] Zhang R, Zhao N, Fu L, Pan LH, Bai XL, Song RW. Ultrasonic diagnosis method for stainless steel weld defects based on multi-domain feature fusion. Sens Rev. 2022;42(2):214–29.10.1108/SR-08-2021-0272Search in Google Scholar
[20] Nimrah S, Saifullah S. Context-free word importance scores for attacking neural networks. J Comput Cognit Eng. 2022;1(4):187–92.10.47852/bonviewJCCE2202406Search in Google Scholar
[21] Sun C, Li K, Zhang J, Huang C. Prediction of phthalates concentration in household dust based on back propagation neural network. Indoor Built Environ. 2022;31(1):230–44.10.1177/1420326X211010212Search in Google Scholar
© 2024 the author(s), published by De Gruyter
This work is licensed under the Creative Commons Attribution 4.0 International License.
Articles in the same Issue
- Research Articles
- A study on intelligent translation of English sentences by a semantic feature extractor
- Detecting surface defects of heritage buildings based on deep learning
- Combining bag of visual words-based features with CNN in image classification
- Online addiction analysis and identification of students by applying gd-LSTM algorithm to educational behaviour data
- Improving multilayer perceptron neural network using two enhanced moth-flame optimizers to forecast iron ore prices
- Sentiment analysis model for cryptocurrency tweets using different deep learning techniques
- Periodic analysis of scenic spot passenger flow based on combination neural network prediction model
- Analysis of short-term wind speed variation, trends and prediction: A case study of Tamil Nadu, India
- Cloud computing-based framework for heart disease classification using quantum machine learning approach
- Research on teaching quality evaluation of higher vocational architecture majors based on enterprise platform with spherical fuzzy MAGDM
- Detection of sickle cell disease using deep neural networks and explainable artificial intelligence
- Interval-valued T-spherical fuzzy extended power aggregation operators and their application in multi-criteria decision-making
- Characterization of neighborhood operators based on neighborhood relationships
- Real-time pose estimation and motion tracking for motion performance using deep learning models
- QoS prediction using EMD-BiLSTM for II-IoT-secure communication systems
- A novel framework for single-valued neutrosophic MADM and applications to English-blended teaching quality evaluation
- An intelligent error correction model for English grammar with hybrid attention mechanism and RNN algorithm
- Prediction mechanism of depression tendency among college students under computer intelligent systems
- Research on grammatical error correction algorithm in English translation via deep learning
- Microblog sentiment analysis method using BTCBMA model in Spark big data environment
- Application and research of English composition tangent model based on unsupervised semantic space
- 1D-CNN: Classification of normal delivery and cesarean section types using cardiotocography time-series signals
- Real-time segmentation of short videos under VR technology in dynamic scenes
- Application of emotion recognition technology in psychological counseling for college students
- Classical music recommendation algorithm on art market audience expansion under deep learning
- A robust segmentation method combined with classification algorithms for field-based diagnosis of maize plant phytosanitary state
- Integration effect of artificial intelligence and traditional animation creation technology
- Artificial intelligence-driven education evaluation and scoring: Comparative exploration of machine learning algorithms
- Intelligent multiple-attributes decision support for classroom teaching quality evaluation in dance aesthetic education based on the GRA and information entropy
- A study on the application of multidimensional feature fusion attention mechanism based on sight detection and emotion recognition in online teaching
- Blockchain-enabled intelligent toll management system
- A multi-weapon detection using ensembled learning
- Deep and hand-crafted features based on Weierstrass elliptic function for MRI brain tumor classification
- Design of geometric flower pattern for clothing based on deep learning and interactive genetic algorithm
- Mathematical media art protection and paper-cut animation design under blockchain technology
- Deep reinforcement learning enhances artistic creativity: The case study of program art students integrating computer deep learning
- Transition from machine intelligence to knowledge intelligence: A multi-agent simulation approach to technology transfer
- Research on the TF–IDF algorithm combined with semantics for automatic extraction of keywords from network news texts
- Enhanced Jaya optimization for improving multilayer perceptron neural network in urban air quality prediction
- Design of visual symbol-aided system based on wireless network sensor and embedded system
- Construction of a mental health risk model for college students with long and short-term memory networks and early warning indicators
- Personalized resource recommendation method of student online learning platform based on LSTM and collaborative filtering
- Employment management system for universities based on improved decision tree
- English grammar intelligent error correction technology based on the n-gram language model
- Speech recognition and intelligent translation under multimodal human–computer interaction system
- Enhancing data security using Laplacian of Gaussian and Chacha20 encryption algorithm
- Construction of GCNN-based intelligent recommendation model for answering teachers in online learning system
- Neural network big data fusion in remote sensing image processing technology
- Research on the construction and reform path of online and offline mixed English teaching model in the internet era
- Real-time semantic segmentation based on BiSeNetV2 for wild road
- Online English writing teaching method that enhances teacher–student interaction
- Construction of a painting image classification model based on AI stroke feature extraction
- Big data analysis technology in regional economic market planning and enterprise market value prediction
- Location strategy for logistics distribution centers utilizing improved whale optimization algorithm
- Research on agricultural environmental monitoring Internet of Things based on edge computing and deep learning
- The application of curriculum recommendation algorithm in the driving mechanism of industry–teaching integration in colleges and universities under the background of education reform
- Application of online teaching-based classroom behavior capture and analysis system in student management
- Evaluation of online teaching quality in colleges and universities based on digital monitoring technology
- Face detection method based on improved YOLO-v4 network and attention mechanism
- Study on the current situation and influencing factors of corn import trade in China – based on the trade gravity model
- Research on business English grammar detection system based on LSTM model
- Multi-source auxiliary information tourist attraction and route recommendation algorithm based on graph attention network
- Multi-attribute perceptual fuzzy information decision-making technology in investment risk assessment of green finance Projects
- Research on image compression technology based on improved SPIHT compression algorithm for power grid data
- Optimal design of linear and nonlinear PID controllers for speed control of an electric vehicle
- Traditional landscape painting and art image restoration methods based on structural information guidance
- Traceability and analysis method for measurement laboratory testing data based on intelligent Internet of Things and deep belief network
- A speech-based convolutional neural network for human body posture classification
- The role of the O2O blended teaching model in improving the teaching effectiveness of physical education classes
- Genetic algorithm-assisted fuzzy clustering framework to solve resource-constrained project problems
- Behavior recognition algorithm based on a dual-stream residual convolutional neural network
- Ensemble learning and deep learning-based defect detection in power generation plants
- Optimal design of neural network-based fuzzy predictive control model for recommending educational resources in the context of information technology
- An artificial intelligence-enabled consumables tracking system for medical laboratories
- Utilization of deep learning in ideological and political education
- Detection of abnormal tourist behavior in scenic spots based on optimized Gaussian model for background modeling
- RGB-to-hyperspectral conversion for accessible melanoma detection: A CNN-based approach
- Optimization of the road bump and pothole detection technology using convolutional neural network
- Comparative analysis of impact of classification algorithms on security and performance bug reports
- Cross-dataset micro-expression identification based on facial ROIs contribution quantification
- Demystifying multiple sclerosis diagnosis using interpretable and understandable artificial intelligence
- Unifying optimization forces: Harnessing the fine-structure constant in an electromagnetic-gravity optimization framework
- E-commerce big data processing based on an improved RBF model
- Analysis of youth sports physical health data based on cloud computing and gait awareness
- CCLCap-AE-AVSS: Cycle consistency loss based capsule autoencoders for audio–visual speech synthesis
- An efficient node selection algorithm in the context of IoT-based vehicular ad hoc network for emergency service
- Computer aided diagnoses for detecting the severity of Keratoconus
- Improved rapidly exploring random tree using salp swarm algorithm
- Network security framework for Internet of medical things applications: A survey
- Predicting DoS and DDoS attacks in network security scenarios using a hybrid deep learning model
- Enhancing 5G communication in business networks with an innovative secured narrowband IoT framework
- Quokka swarm optimization: A new nature-inspired metaheuristic optimization algorithm
- Digital forensics architecture for real-time automated evidence collection and centralization: Leveraging security lake and modern data architecture
- Image modeling algorithm for environment design based on augmented and virtual reality technologies
- Enhancing IoT device security: CNN-SVM hybrid approach for real-time detection of DoS and DDoS attacks
- High-resolution image processing and entity recognition algorithm based on artificial intelligence
- Review Articles
- Transformative insights: Image-based breast cancer detection and severity assessment through advanced AI techniques
- Network and cybersecurity applications of defense in adversarial attacks: A state-of-the-art using machine learning and deep learning methods
- Applications of integrating artificial intelligence and big data: A comprehensive analysis
- A systematic review of symbiotic organisms search algorithm for data clustering and predictive analysis
- Modelling Bitcoin networks in terms of anonymity and privacy in the metaverse application within Industry 5.0: Comprehensive taxonomy, unsolved issues and suggested solution
- Systematic literature review on intrusion detection systems: Research trends, algorithms, methods, datasets, and limitations