A robust segmentation method combined with classification algorithms for field-based diagnosis of maize plant phytosanitary state
-
Thierry Tchokogoué
 ,
Michèle Flore Yimga Fonkou
,
Michèle Flore Yimga Fonkou

Abstract
Early diagnosis of maize-plant phytosanitary state in the field is crucial to prevent crop damage and optimize yield. However, this field diagnosis presents a challenge due to the variable background of the field environment, which can hinder the performance of classification algorithms. In this article, we introduced a novel segmentation technique using a combined normalized difference vegetation index that effectively isolates the features of interest, such as the leaves, from the surrounding image, which includes the diverse field background. To assess the effectiveness of our segmentation approach, we conducted early diagnosis of maize plants in the field using supervised classification algorithms. We generated a dataset that incorporated four essential texture features: energy, entropy, contrast, and inverse. These features were extracted from each of the segmented images using grayscale co-occurrence matrices. We employed four different classification methods, namely Adaboost, Random Forest, K-Nearest Neighbors, and support vector machine. When combined with the proposed segmentation technique, the support vector machine outperformed the other models, achieving an accuracy rate of 97%.
1 Introduction
The rapid growth of the world population, leading to a significant increase in food requirements, coupled with a reduction in cultivable areas due to urbanization and residential development, underscores the need to develop techniques ensuring both the quality and quantity of agricultural production on available arable land. These techniques should also safeguard crops against various pests and diseases, as highlighted in the study by Hanssen and Lapidot [1]. The conventional approach involves the use of fertilizers to improve soil quality and pesticides to manage pests and diseases, which are significant contributors to decreasing agricultural yields [2]. However, it is essential to acknowledge that the excessive or routine application of these pesticides and fertilizers has its limitations. It leads to environmental pollution, poses health risks to those handling it, and strains the national economy.
A recent approach aims at early, automatic, and robust disease detection using artificial intelligence in cultivated fields to promote sustainable agriculture with enhanced yields. Artificial intelligence has emerged as a transformative force with vast potential across various fields of application. Its impact extends far beyond traditional boundaries, with notable contributions observed in the medical [3,4], transportation [5], ecological [6,7], and agricultural sectors [8,9], among others. Using artificial intelligence to automate plant disease detection can significantly reduce the reliance on fertilizers and pesticides, making it environmentally friendly, and optimize the use of available human resources in plantations. Modern monitoring methods necessitate the development of automatic recognition systems based on spectral image sensor data combined with algorithms to identify infected areas of a crop [10]. This challenge gives rise to the ambition to create more robust and accurate automatic recognition algorithms capable of running on promising fully embedded processing units. The results are expected to be employed in designing a digital model for the automatic diagnosis of the phytosanitary (indicate whether the leaves of the plant are healthy or infected) condition of food crop plots. This model will be carried on board a drone or an agricultural vehicle, flying over known areas to detect infected plants. Machine learning and deep learning methods are increasingly essential in the advancement of precision agriculture, enabling farmers to forgo the need for expert diagnosis and expediting the detection of infected areas in the field, significantly accelerating interventions.
In this context, we propose an automated diagnostic system for corn plant diseases in the fields and in Cameroon. Corn, one of the primary cereals consumed in Cameroon and the fourth staple crop after cassava, plantains, and taro [11], is regularly targeted by pests, with the most common being Spodoptera frugiperda [1]. More precisely, this system is designed for the automatic classification of real-world images of corn plants captured in multiple fields, involving a five-step process: image acquisition, preprocessing, segmentation, feature extraction, and classification. It is worth noting that, due to the absence of a database on diseased corn plants, the initial step of this work was to collect the data in the field. Image segmentation, a critical phase in the image processing pipeline, focuses on distinguishing the leaves from the rest of the image (which can be highly diverse) using a novel approach, namely, the combined normalized difference vegetation index (CNDVI) technique applied to color images.
The remainder of this article is organized as follows: Section 2 discusses related work; Section 3 presents the methodology with emphasis on image acquisition and preprocessing, the new proposed segmentation method, features extraction, and the four classification methods; Section 4 discusses the results; and Section 5 gives concluding remarks.
2 Related work and purpose of the article
In recent years, many researchers have been interested in remote sensing to perform phytosanitary diagnostics of plants using colorimetric and texture parameters combined with artificial intelligence. Let us summarize some of the obtained results. Salathé et al. [12] trained a neural network to identify plant diseases. They worked on 14 plant species and 26 diseases, and the system was able to identify diseases in plant images extracted from a dataset containing images photographed under lighting conditions, color, background, etc. Their methods have a limitation in that the images are not captured directly in the field. Instead, the leaves are first collected and taken to a different environment, where pictures are taken against a white background. Wäldchen et al. [13] presented a new convolutional neural network (CNN)-based rice disease identification method using a dataset of 500 natural images of healthy and diseased rice leaves achieving
Related works
| Authors | Year | Classifier deep – machine learning | Application | Types of images | Accuracy | Limit |
|---|---|---|---|---|---|---|
| Salathé et al. [12] | 2016 | CNN (deep learning) | Detection of 26 diseases on 14 species of plants | 54,306 Scans images | 99.35% | Images taken on a plain background and under controlled lighting |
| Wäldchen et al. [13] | 2017 | CNN (deep learning) | Identification of rice diseases | 500 Natural images | 90% | Image taken zoom only on the parts of the sheet (low image definition) |
| Ferentinos [15] | 2018 | CNN (deep learning) | Detection of 58 diseases on 25 species of plants | 87,848 Scans | 99.53% | Images taken on a plain background and under controlled lighting |
| Aït et al. [14] | 2020 | CNN (deep learning) | Early detection of eight tomato diseases | 2,000 Scans | 94% | Images taken on a plain background and under controlled lighting |
| Sumita et al. [22] | 2020 | CNN avec ajustement des hyper paramètres (deep learning) | Maize disease detection | 4,382 Natural and scanned images of plant village | 88.66% with natural images | Image taken zoom only on the parts of the sheet (low image definition) |
| Yu et al. [17] | 2021 | K-means associated with a CNN (deep learning) | Diagnosis of three maize diseases | 900 scanned images selected from Crop disease | 93% | Images taken on a plain background and under controlled lighting |
| Deng et al. [21] | 2021 | CNN (deep learning) | Detection of 06 types of rice diseases | 33,026 Naturals | 91% | Image taken zoom only on the parts of the sheet (low image definition) |
| Pan et al. [23] | 2022 | CNN (deep learning) | Detection of northern corn leaf blight | 985 Natural images increase to 30,655 images | 99.94% | Natural but extensive image base |
| Prajapati et al. [25] | 2017 | SVM (machine learning) | Detection and classification of rice plant diseases | 120 Semi-natural images | 88.57% | Images taken on a white background |
| Mousavi et al. [18] | 2018 | Expert system using bayes theorem method (machine learning) | Maize disease detection | Scans images | 90.04% | Images taken on a plain background and under controlled lighting |
| Goel and Nagpal [16] | 2022 | SVM (machine learning) | Classification of plant diseases | Scans images | 99.98% | Images taken on a plain background and under controlled lighting |
| Pawan et al. [19] | 2022 | Expert system developed using the forward chaining method, which is a forward trace (machine learning) | Early detection of maize diseases | Database of scanned images | 84% | Images taken on a plain background and under controlled lighting and low precision |
| Seyed et al. [20] | 2022 | SVM (machine learning) | Grape leaf disease detection and classification | 3,885 Scanned images of plant village | 98.71% | Images taken on a plain background and under controlled lighting |
In this article, we propose a system trained with natural photographs for deployment in real fields, with a segmentation approach based on a CNDVI. This approach, which applies to color images, makes it possible to better separate the regions of interest in the photographed images despite the variations in light and the diversified background.
3 Methodology
We proposed a process to diagnose maize diseases in the field. The methodology is twofold: (1) the first phase consists of the acquisition of images in the field, followed by data pre-processing, segmentation of the images, and extraction of the relevant features; (2) The second phase applies four machine learning methods to classify the different states of maize diseases. This methodology is summarized in two phases and presented in Figure 1.
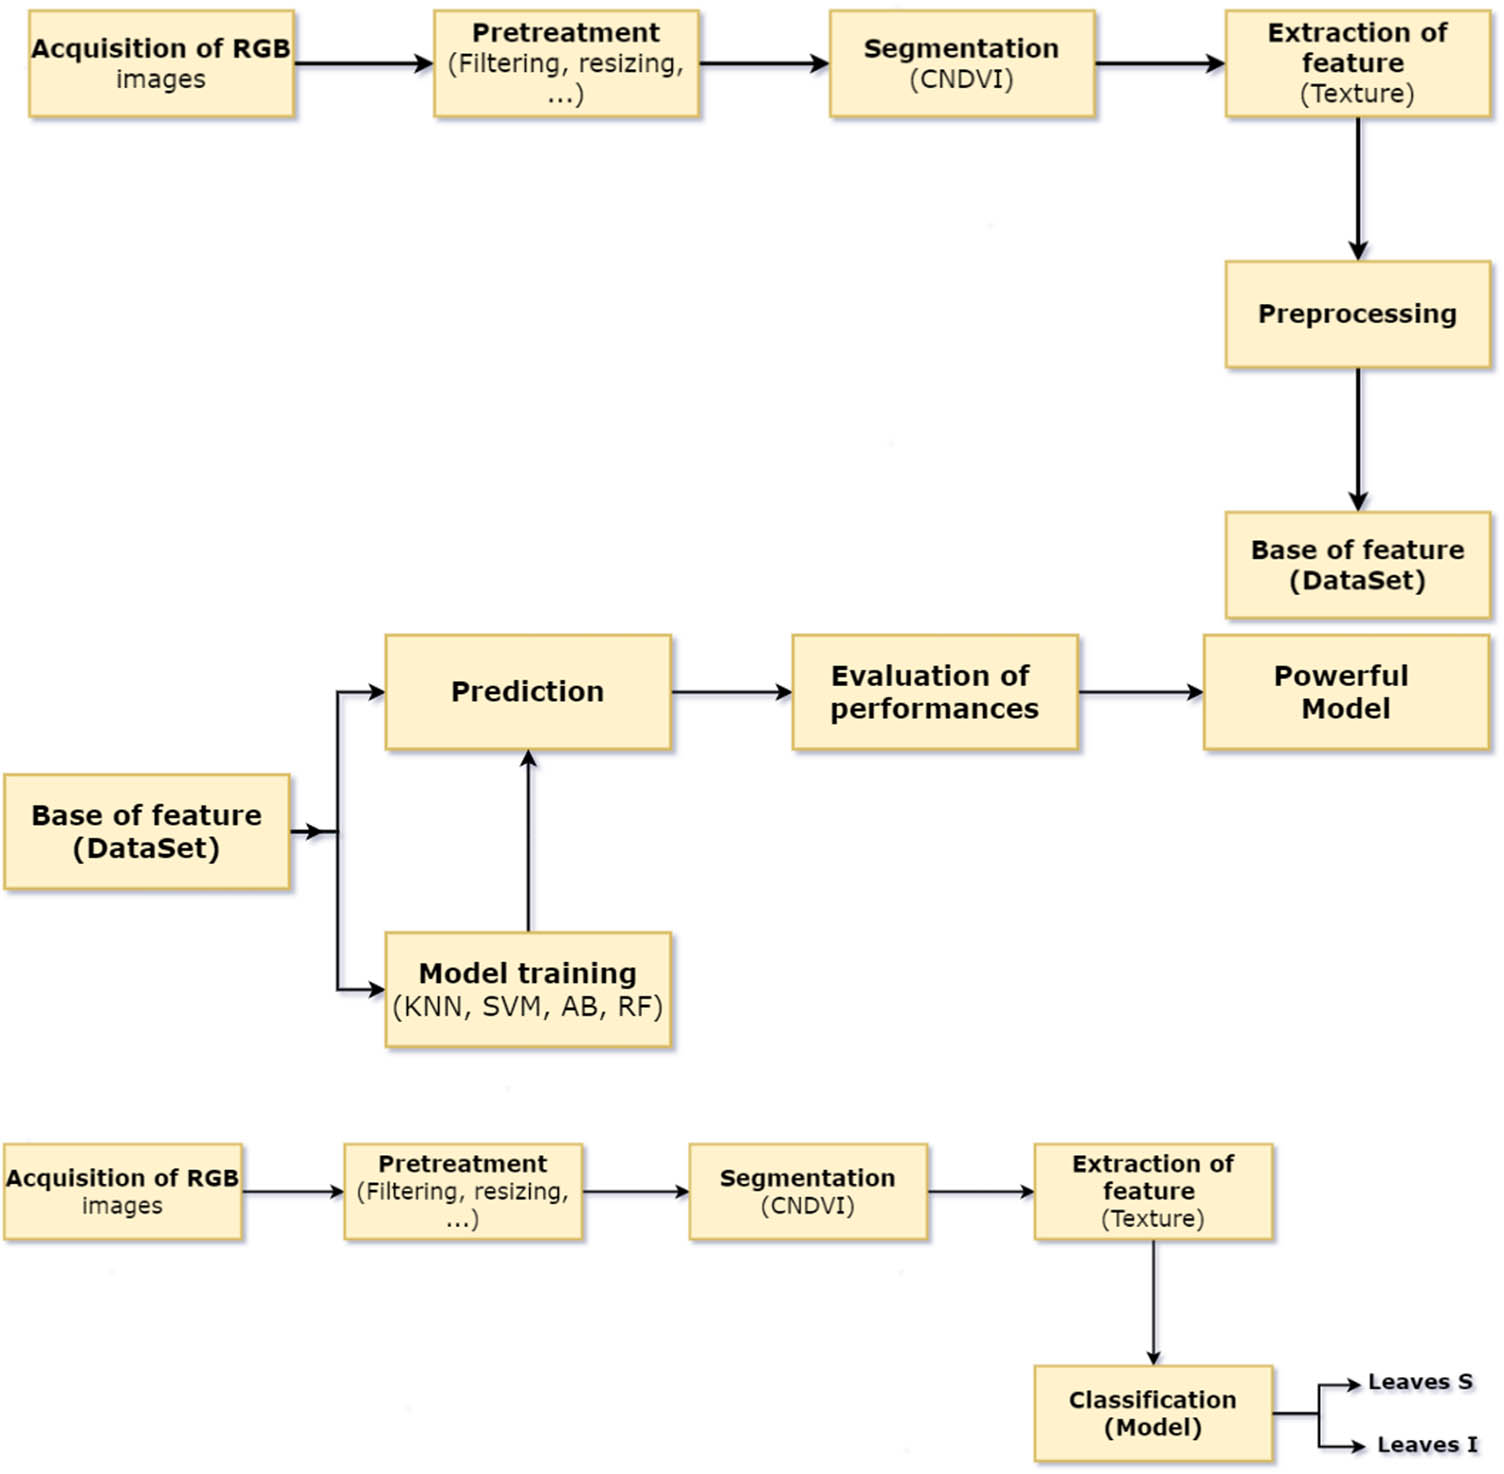
Image processing process: Constitution of dataset (top panel), determination of the best model (middle panel), and image diagnosis process after deployment of the model in the field (bottom panel).
3.1 Dataset: data collection in the field and preprocessing
The first step of the automatic diagnostic process is to acquire images of corn plants. Wäldchen and Mäder [24] suggested that the image could be of the whole plant, leaf, flower, stem, or even fruit. They also suggested that there are three categories of images based on the mode of image acquisition, namely “Scan,” “Pseudo-scan,” and “Photos.” In the scanning and pseudo-scanning categories, leaf images are captured through the scanning and photography process, respectively, meaning that images are taken in front of a uniform color background and under fixed lighting conditions. For the third category, images are plants captured in their natural environment (with variable backgrounds and lighting conditions). For this phase, we collected 130 photos of maize leaves photographed in their natural environment in two fields. In the first field located in the Douala 5 district (referred to as field A with GPS coordinates 4.100501–9.802453), we collected 44 images of leaves attacked by Spodoptera frugiperda and 31 images of healthy leaves. In the second field located in the Douala 3 district (referred to as field B with GPS coordinates 4.059465–9.817352), we collected 25 images of leaves attacked by Spodoptera frugiperda and 30 images of healthy leaves. In total, there are 69 images of leaves infected by Spodoptera frugiperda and 61 images of healthy leaves. These images, with an average size of 6 MB per image, were taken using a Samsung SM-A750FN camera with an aperture of F1.7, a focal length of 3.93 mm, and the flash disabled. Figure 2 shows one of the coauthors of this work in one of the fields taking the images.
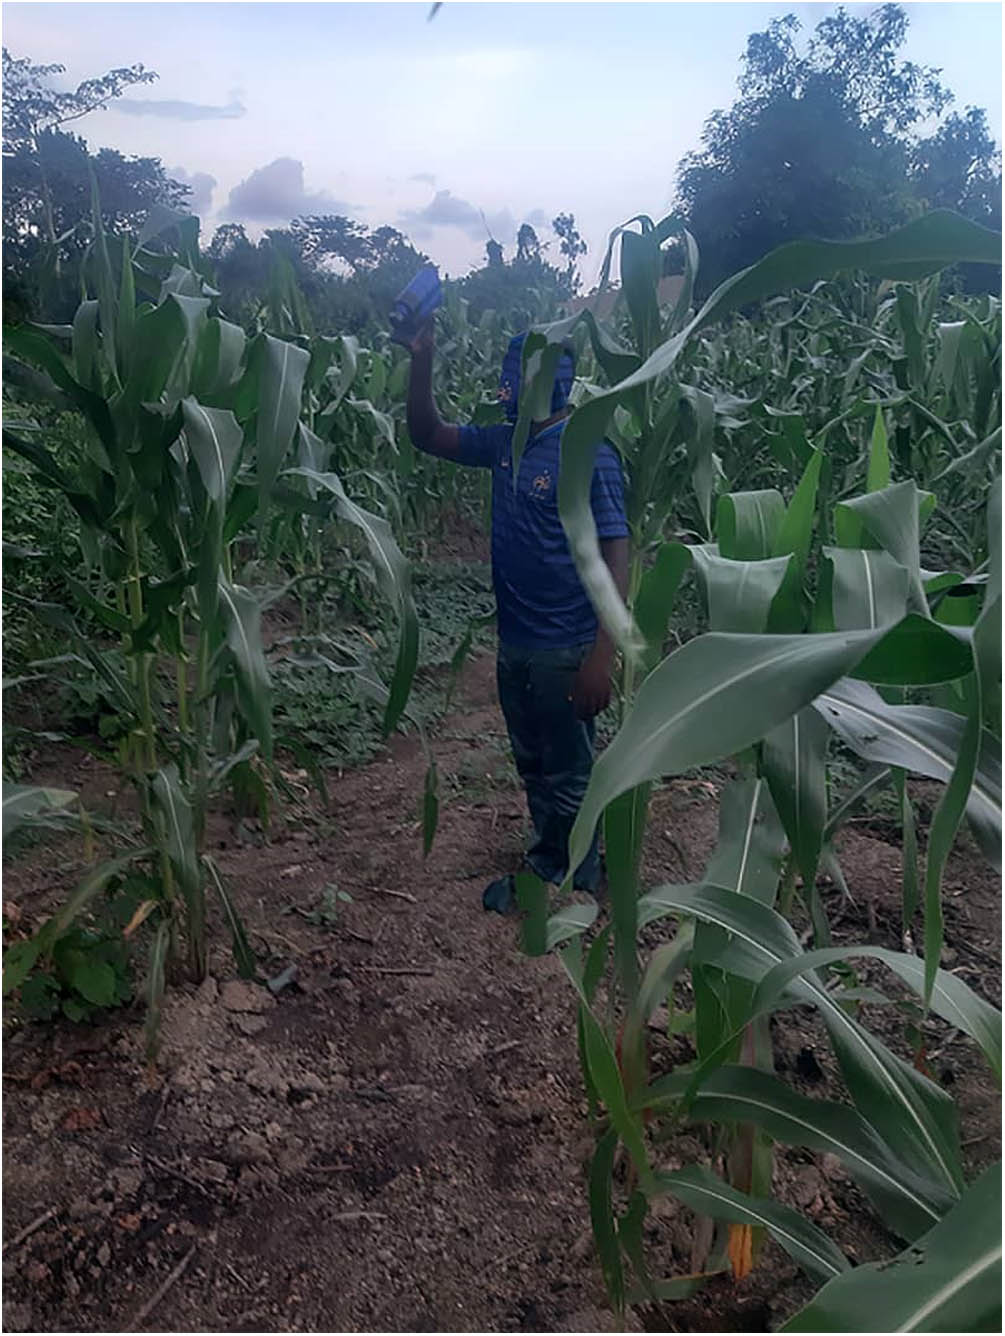
Field work for data collection.
To facilitate the identification or location of each image in the image database, an encoding format was defined and applied to all images in the database. Table 2 provides a description of the different attributes of the coding format. For example, the code S-S2-CA-11.04.21-1 means the photo of a healthy corn leaf (S) at its second week of growth (S2) taken in field A (CA) on April 11, 2021 (11.04.21), and numbered 1.
Description of each element contained in the image encoding format
| Format components | Descriptions | Component codes |
|---|---|---|
| State | Indicates the condition of the leaves | S (healthy) M1 (Spodoptera frugiperda) |
| Maturity | Indicates the age of the plant |
|
| Field | Indicates the image collection field | CA (Field A) CB, … |
| PickupDate | Indicates the date and month of the image capture | 10.05.21 (May, 10, 2021) |
| Number | Indicates the order number of the image | 1, 2, 3, … |
Wäldchen and Mäder [24] and Wäldchen et al. [26] justified that various factors (such as visibility, brightness and contrast of gray-level pixels, and amount of noise) impact the quality of the image captured in natural environments under various lighting conditions. To obtain suitable images for processing from those in our database, we performed pre-processing to highlight certain interesting features of an image. To preprocess our images from our database captured in natural environments, we applied the Gaussian filter (a classic example of preprocessing that increases contrast and removes noise from the image for improvement). The principle of this preprocessing method involves convolving the raw input image I with a Gaussian kernel G to obtain a preprocessed or filtered image: Figure 3 shows two original images taken randomly from our image database, as well as the result obtained after applying the Gaussian filter to both images.
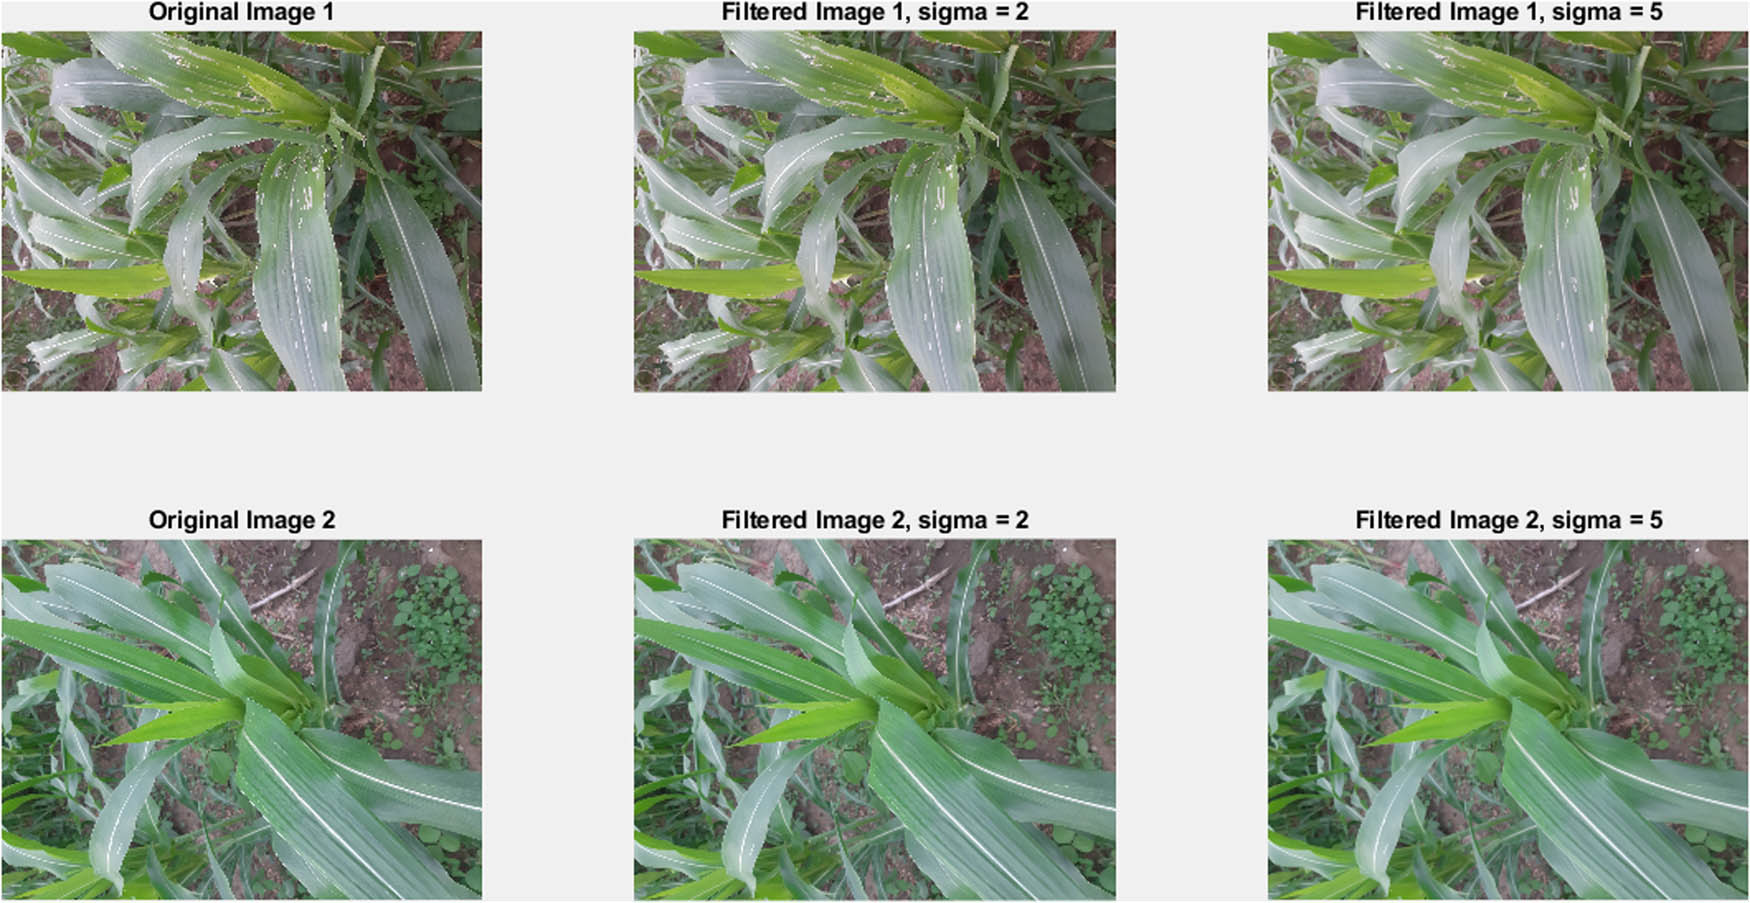
Original and filtered pictures with
The images in our database, even after preprocessing, contain a diverse and random background. In order to better identify their contents using computer vision techniques, it is important to take into account the interaction between light and matter (green leaf for healthy plants or spotted green for infected leaves) to propose a new method of segmentation for pre-processed leaves. This segmentation principle is based on the theories of radiative transfer, which state that when a surface is illuminated by light, four reactions (reflection, refraction, absorption or transmission) dependent on the wavelength of the light and the composition of the surface can occur. The following section provides a detailed description of this new segmentation method.
3.2 Segmentation
3.2.1 Description of the method
To highlight the area of interest (healthy or diseased leaves) in each of the images taken in the natural environment, we propose a new segmentation method in this section called CNDVI.
The intuition behind CNDVI is based on the fact that any object illuminated by a natural or artificial light source has a particular way of reflecting light. The camera captures the light reflected by the object to create its image. More precisely, when applied to leaves, this intuition is based on the following hypothesis: “Vegetation strongly absorbs the blue and red wavelengths of visible light and reflects the green wavelength of that light.”

Segmentation algorithm using a combination of two vegetation indices I1 and I2 calculated from the RGB components of visible light.
It is worth noting that compared to CNDVI, the segmentation method, normalized difference vegetation index (NDVI), uses near-infrared and red wavelengths to assess a single vegetation index.
where NIR is the grayscale level of the near-infrared wavelength, and
a normalized difference between the red and green bands. The second index,
A combination of these two indices (
C1: if
(4)In other words,
(5)so the image point corresponds to healthy vegetation.
C2: if
(6)when
(7)then the image point corresponds to a leaf that is beginning to turn yellow or red due to infection. These two criteria suggest that an image point will be considered either healthy or infected when
(8)
This criterion is introduced into the algorithm to separate the green foliage from the rest of the image, as shown in Figure 4. This CNDVI segmentation algorithm masks (sets to black) all the noise in the image (any object that is not foliage) and keeps the foliage pixels unchanged. To evaluate the performance of this new CNDVI segmentation method, manual segmentation was performed using Photoshop on four randomly selected images from the image database, which is used as the ground truth. Figure 5 shows a comparison between CNDVI and ground truth. The Vinet dissimilarity measure was used to show that the segmentation obtained from CNDVI is similar to the ground truth, thus confirming the effectiveness of the new method.

Columns 1 to 4 respectively present four natural images, then the renderings of their manual segmentations (ground truth), then the segmentation by CNDVI and finally the residuals between the two segmentations.

Infected plant showing a different texture from healthy plants.
3.2.2 Evaluation of CNDVI segmentation
The performance of the CNDVI segmentation algorithm is evaluated using the Vinet distance, which involves comparing the image segmented by CNDVI with the ground truth. This comparison counts the number of matching pixel pairs in both images. The Vinet distance is a measure of dissimilarity between two images segmented using different approaches, and it is computed as follows: Let
and
The dissimilarity between segmentations
where
The dissimilarity was calculated for four images from our dataset, and the results for each image, as well as the average of the four results, are recorded in Table 3.
Results of dissimilarity between the two segmentations from each of the four images
| Performance | M1S4CA2404-28 | M1S5CA0205-15 | M1S5CA0205-12 | SS5CA0205-11 | Average |
|---|---|---|---|---|---|
| Dvinet | 0.0654 | 0.0492 | 0.0387 | 0.0789 | 0.05805 |
3.3 Features extraction
After the preprocessing and the segmentation of the image in the desired region of interest, the next stage of the work consists in extracting the characteristics of the segmented images, thus making it possible to reduce the complexity of the image to avoid the use of a large amount of computing power and memory. Therefore, feature extraction is a very important step in the image processing process because it helps to reduce the number of variables for further image processing (this is a dimension-reduction process). The extracted features can be, color, texture, grayscale, spectrum, or a combination of several elementary features. Careful observation of corn diseases (Figure 6) reveals a change in leaf texture when infected. Based on this observation, we chose second-order statistics that construct the GLCM and calculate 13 texture features. Of these features, we select four features (energy, entropy, contrast, and inverse moment of difference) as the most relevant to facilitate decision-making about the health status of corn plants.
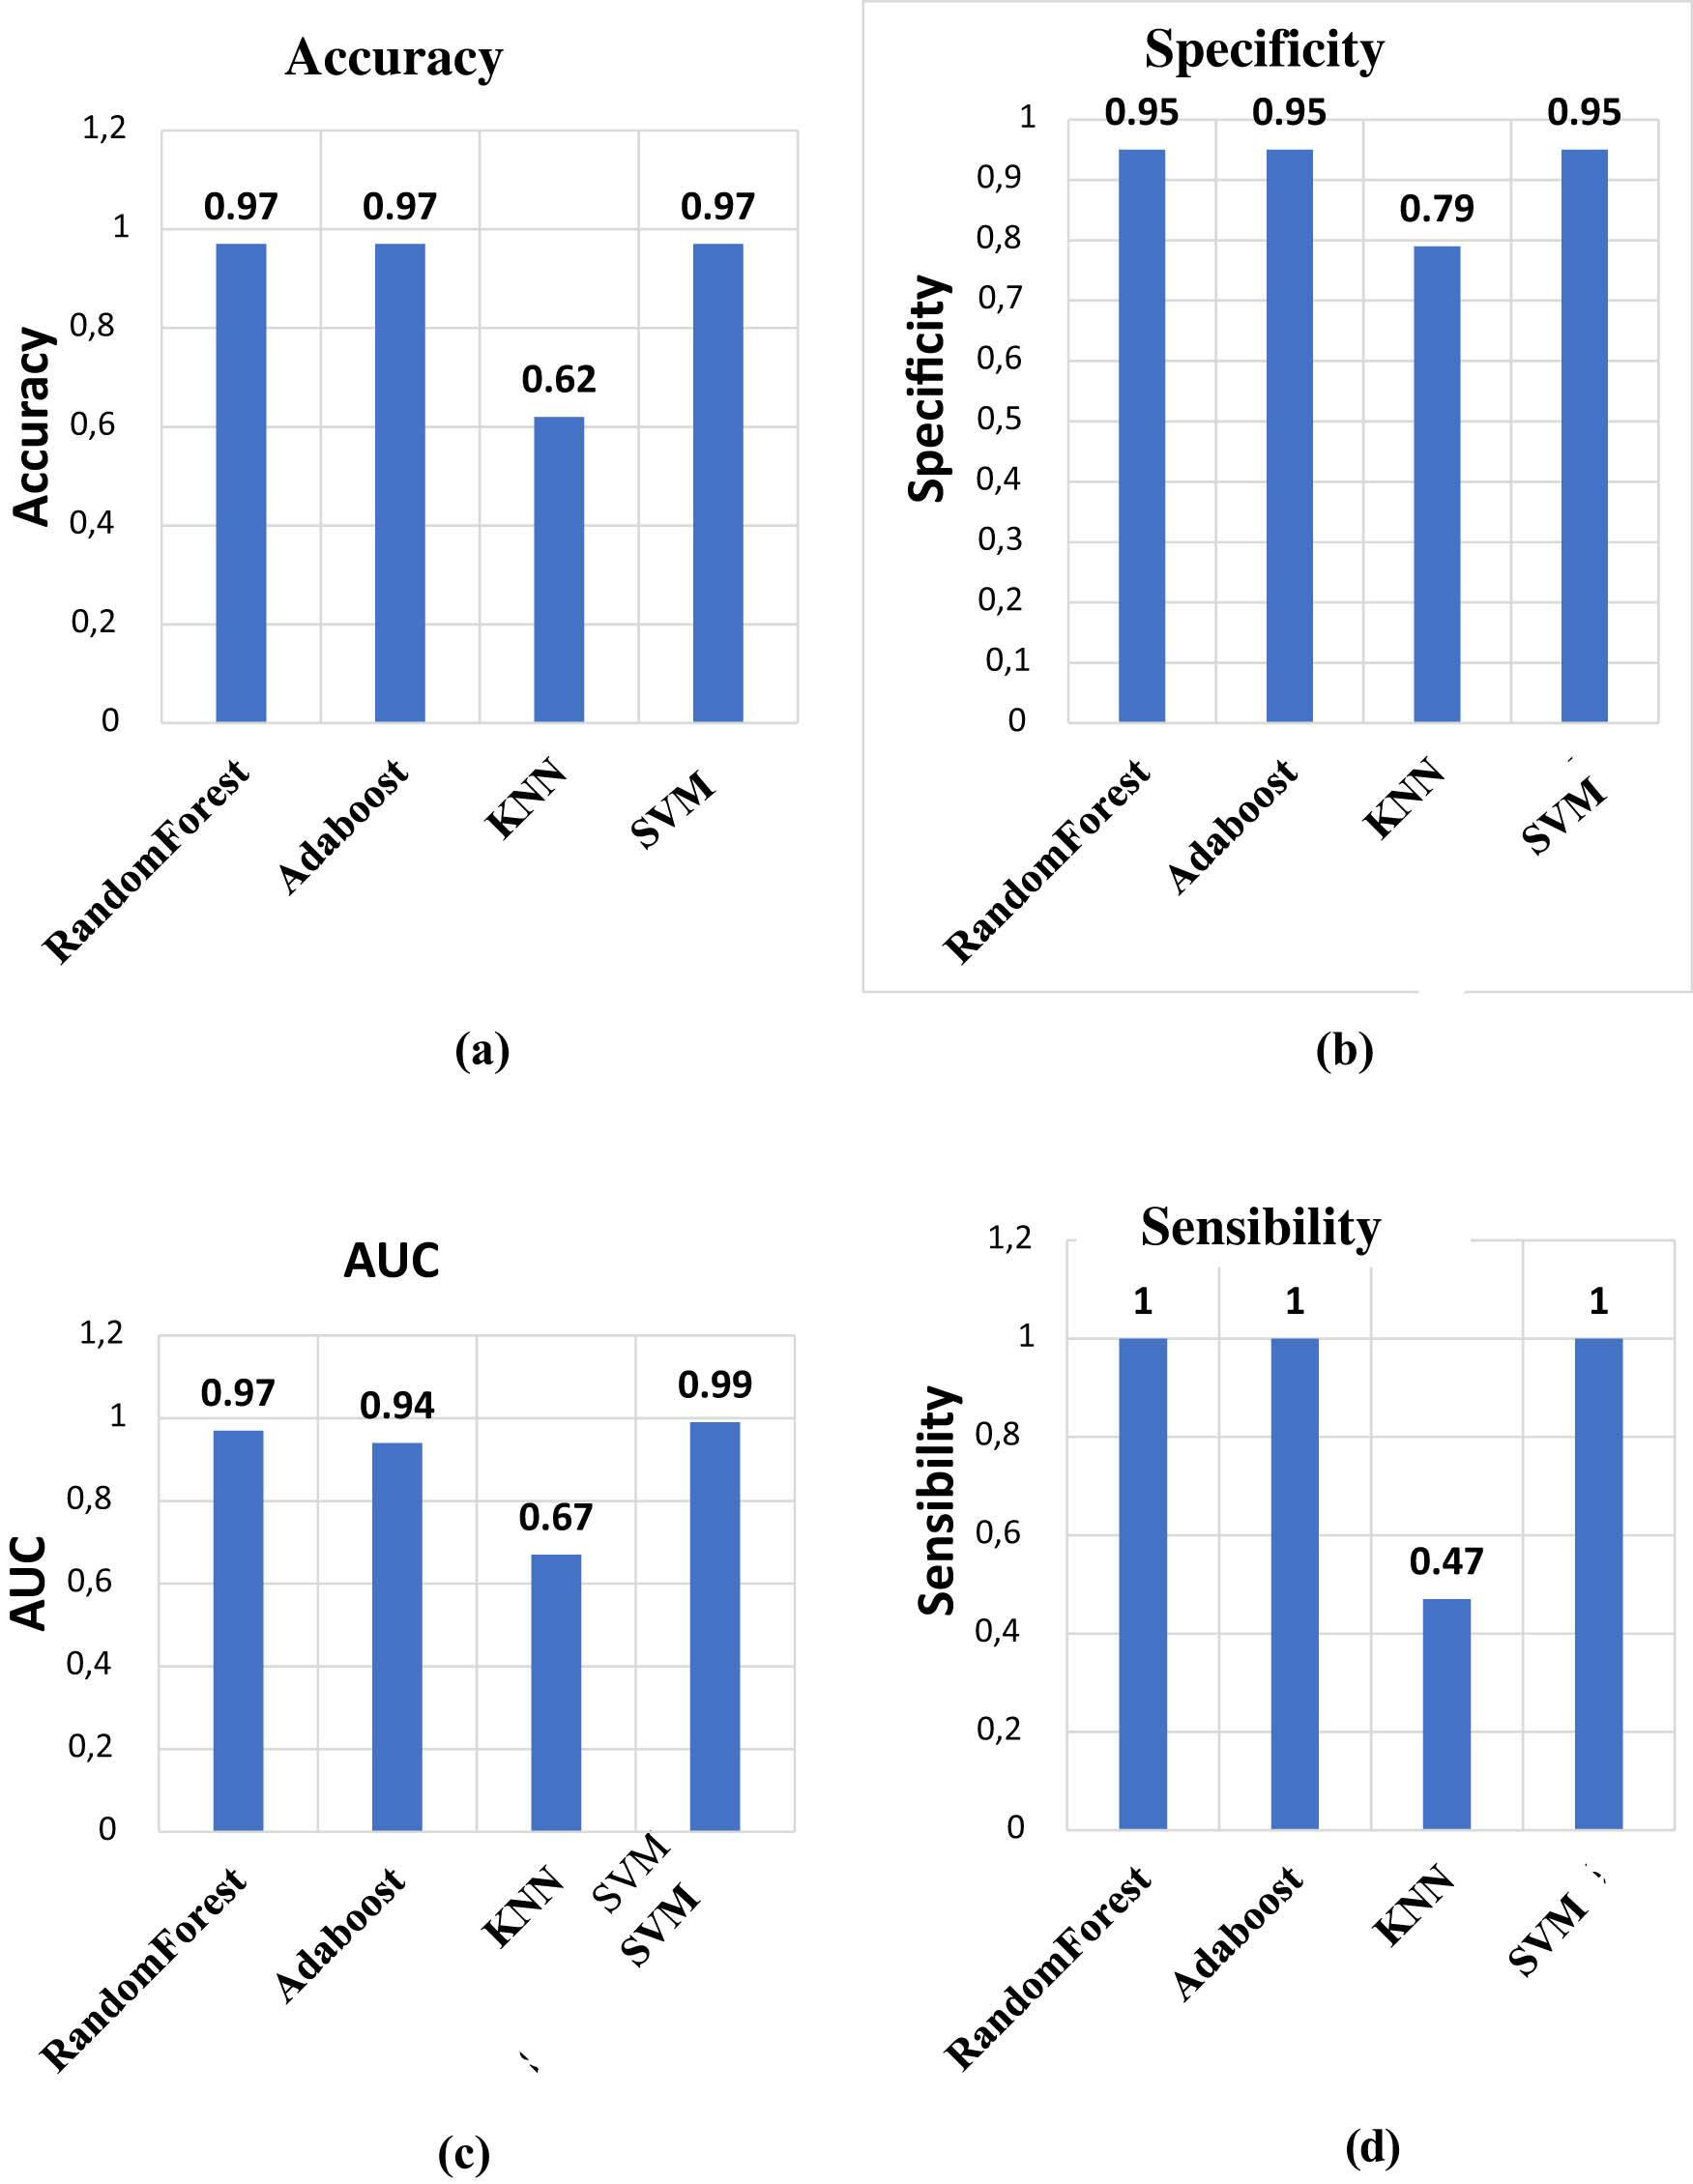
Performance histogram for each classifier. (a) Precision of the four models. (b) Specificity of the four models. (c) AUC of the four models. (d) Sensibility of the four models.
3.4 Used classification methods
In this article, classification generally involves deciding whether a query image contains healthy or infected corn leaves based on the extracted feature set. The primary objective of this work was to introduce a novel segmentation approach for feature extraction. The features extracted through this segmentation process are employed to train traditional machine learning models. In contrast, deep learning models are trained directly on the data without the need for any preprocessing for feature extraction. This explains why we did not use deep learning models in this article. To achieve this, we opted for four classifiers, namely SVM, AdaBoost, k-nearest neighbor (KNN), and random forest, and applied them to our dataset. The performance of each model was assessed, and the best-performing model was selected. The performance of each algorithm is evaluated by the following four measures: accuracy (overall rate of good classification), specificity (rate of classification of healthy plants), sensitivity (rate of classification of infected plants), and area under the curve (AUC). All these measures are estimated from the confusion matrix generated by the model after the prediction phase. Note that, the most efficient model is the one whose AUC is closer to 1, and thus, specificity, sensitivity, and accuracy should be higher. However, since it is riskier for a model to predict that an infected plant is healthy than to predict that a healthy plant is infected, we require the model to have specificity greater than sensitivity in addition to large values of AUC and accuracy. For each of the classifiers trained on our dataset, the performance measures were estimated and plotted on the histograms in Figure 7 after computing the AUC from the receiver operating characteristic (ROC) curves in Figure 8. In the following sections, we describe the four classifiers.
3.4.1 KNN
KNN classifier makes the categorization of unidentified instances based on a similarity measure or distance function. It is a supervised machine learning, lazy learning, and nonparametric model. It is based on the principle of nearest-neighbor rule. For model generation, this classifier does not require any training pattern. All training patterns are used in the testing phase to classify the test pattern dependent on a similarity function. It behaves as a kind of instance-based learning where the functions are locally estimated and all the calculations have varied until the completion of the classification method.
3.4.2 RF
It is an ensemble model of randomized decision tree classifiers. During training, multiple decision trees are constructed. Test dataset class labels are determined by voting of all classification trees, which becomes the result of this classifier. While building each individual tree, this classifier model uses bagging and random features. This model endeavors to make an unrelated forest of trees. The prediction of the performance of a forest of trees is more accurate than an individual tree since the result is an aggregation that reduces the variance in the result.
3.4.3 SVM
SVM is a supervised machine learning classifier model. This model finds the best hyperplane, which maximizes the distance among the nearest data points. This distance is referred to as a margin. SVM is of two types: linear and nonlinear. In a linear SVM classifier, the uniform distributions of data are allowed to draw a straight hyperplane among the classes. Whereas, in nonlinear SVM classifiers, data are spread in different directions and also have high dimensions. Most of the real-world applications are solved by nonlinear SVM classifiers. Kernel tricks are the property of SVM, which is helpful for nonlinear classification. SVM operates by transforming features with the help of several general functions, such as radial basis, polynomial, and linear functions. The training time of the classification process increases due to the transformation of features.
3.4.4 Adaptive boosting (AdaBoost or AB)
AB is an iterative selection of weak classifiers based on a distribution of training examples. Each example is weighted according to its difficulty with the current classifier. The outputs of these weak classifiers are combined into a weighted sum that represents the final output of the boosted classifier. AdaBoost is adaptive in the sense that subsequent weak classifiers are adjusted in favor of samples misclassified by previous classifiers. AdaBoost is notably sensitive to noisy or poorly correlated data. However, in some problems, it may be less prone to overfitting than other algorithms. The subclassifiers used can be weak as long as they perform at least slightly better than a random classifier, in which case the final model can be proven to converge to a strong classifier. AdaBoost (with decision trees as weak classifiers) is often referred to as the best turnkey workbook. The hyperparameters actually used for each of the four models are clearly provided in Section 4.2.1.
4 Results
4.1 Results on pretreatment and segmentation
By implementing the Gaussian filter on the original images from our database using Python, we obtain a new database of filtered images. Figure 9 shows an example of a filtered image generated from the coded image M1S4CA2404-11.

ROC curves for evaluating the performance of the different models on which the dataset was tested. (a) ROC of the RF model, (b) ROC of the AdaBoost model, (c) ROC of the SVM model optimized by a four-block cross-validation and a polynomial kernel of degree 4, and (d) ROC of the KNN model.
Once the database of filtered images is obtained, the next task is the segmentation of these images using the CNDVI algorithm applied to the visible light spectrum. The implementation of this new technique on the dataset allows us to have a third dataset of filtered and segmented images. The CNDVI is applied to all the pixels of the image and automatically masks out all the background pixels or those that do not correspond to the foliage. It retains, without alteration, all the pixels that correspond to the foliage. Figure 10 presents an example of a filtered and segmented image generated from the original image SS5CB1804-13.

The original image M1S4CA2404-11 (on the left side) and the filtered image by the Gaussian filter (on the right side).
4.2 Results on characteristic extraction and implementation of machine learning technical on characteristic database
From each of the harvested, preprocessed and segmented images, a quartet of features (entropy, contrast, energy, and inverse moment of difference) was extracted, and a label was assigned to each quartet of features in the images. All these features obtained on the 130 images are recorded in a table with five columns (one column for each of the four features and one column for the label). The feature set was divided into two: a training database containing 78% of the dataset and the rest for the test database. To identify infected leaves in a plantation, we applied four machine learning techniques, following a four-step approach.
Training each technique using the training database to generate a model for each algorithm,
Using the models obtained to evaluate the predictive ability of each algorithm on the test database,
Assessing the performance of each model, and
Selecting the best-performing model.
4.2.1 Models training
Given that there is no way to know the best values for hyperparameters in advance, ideally, we should try all possible values to determine the optimal values. GridSearchCV is the process of automatically tuning hyperparameters to find optimal values for a given model. It is a function provided in the model-selection package of Scikit-learn (or SK-learn) that helps select the best parameters from the listed and tested hyperparameters. The “cv” parameter in this GridSearchCV function allows training k-folds to try the selected hyperparameters in cross-validation. For each of the classifiers, the hyperparameters that provided the best accuracy were:
SVM: Kernel = RBF (radial basis function), accuracy regularization C= 1 and influence of the example
KNN: Number of neighbors
RF: among about 20 hyperparameters used by this classifier, the one that best optimizes the model is the number of features used by the trees. In this case,
AdaBoost:
4.2.2 Evaluation of model performance
After the test phase, a confusion matrix is generated to calculate the values of the following four performance measures of each classifier: specificity, sensitivity, precision, and AUC (Area Under the ROC Curve). Figures 7 and 8 present the results of these metrics, and Table 4 presents a comparison between the performances calculated on each classifier.

Original image SS5CB1804-13 (left side) and filtered and segmented image (right side) by CNDVI.
Performance results for each of the four classifiers on which the data was tested
| Performance
|
Accuracy | Sensitivities | Specificities | AUC of ROC | Dominance rate |
|---|---|---|---|---|---|
| RF | 0.97 | 1 | 0.95 | 0.9789473684210526 | 3/4 |
| AD | 0.97 | 1 | 0.95 | 0.9473684210526316 | 3/4 |
| KNN | 0.62 | 0.47 | 0.79 | 0.6710526315789473 | 0/4 |
| SVM | 0.97 | 1 | 0.95 | 0.9947368421052633 | 4/4 |
The analysis of the performance results of the four machine learning methods, summarized in Table 4, justifies that SVM is the most efficient classifier for our database as it has the largest values on the performance measures. The confusion matrix of the SVM model along with the accuracy results are shown in Tables 5 and 6, respectively.
SVM model confusion matrix
| Confusion matrix | Negative: 0 | Positive: 1 |
|---|---|---|
| Negative: 0 | True negative = 19 | False negative = 0 |
| Positive: 1 | False positive = 1 | True positive = 9 |
SVM model accuracy
| Measure | Precision | Recall | f1-score | Support |
|---|---|---|---|---|
| Negative: 0 | 0.95 | 1.00 | 0.97 | 9 |
| Positive: 1 | 1.00 | 0.90 | 0.95 | 10 |
| Accuracy | 0.97 | 29 |
5 Concluding remarks
Recent machine and deep learning techniques have demonstrated their capacity to address computer vision problems that were traditionally challenging for conventional methods. In this article, we present a model for the early detection of certain maize diseases from RGB leaf images captured in the field under natural lighting and environmental conditions. One of the major challenges when processing images taken in natural environments is separating the region of interest from the complex background of the image. Our novel approach involves a segmentation technique based on a CNDVI applied to the light spectrum. This new segmentation approach efficiently separates the corn leaves from the rest of the image, enabling feature extraction and classification. These techniques can be integrated into low-resource embedded systems.
The model proposed for identifying corn-plant diseases is based entirely on traditional machine learning methods. This choice is made because deep learning methods do not necessitate a preprocessing step for feature identification. In the proposed approach, the proposed segmentation method extracts features, which are then forwarded to a traditional machine learning method for classification. However, in our future work, we intend to collect a larger dataset comprising various types of corn-plant diseases, which can be used to train a deep-learning model for disease detection without requiring segmentation.
Acknowledgments
We appreciate the reviewers for their valuable comments, which have significantly improved the quality of our paper. All images included in this paper are originally produced by the authors.
-
Funding information: This work was carried out under the research grant FR 21-333 RG/MATHS/AF/AC_G-FR 3240319514 offered by UNESCO-TWAS and the Swedish International Development Cooperation Agency to the Laboratory of Mathematics of the University of Douala-Cameroon. The authors of the University of Douala sincerely thank TWAS. M.A. thanks the National Research Foundation of South Africa for support through project number CSRP23040990793.
-
Author contributions: Conceptualization: Thierry Tchokogoué, Auguste Vigny Noumsi, and Louis Aimé Fono; methodology: Thierry Tchokogoué, Auguste Vigny Noumsi, Marcellin Atemkeng, Michèle Flore Yimga Fonkou, and Louis Aimé Fono; software: Thierry Tchokogoué, Auguste Vigny Noumsi, and Marcellin Atemkeng; validation: Thierry Tchokogoué, Auguste Vigny Noumsi, Marcellin Atemkeng, Michèle Flore Yimga Fonkou, and Louis Aimé Fono; writing – original draft preparation: Thierry Tchokogoué and Michèle Flore Yimga Fonkou; writing – review and editing: Auguste Vigny Noumsi, Marcellin Atemkeng, and Louis Aimé Fono; supervision: Auguste Vigny Noumsi, and Louis Aimé Fono; funding: Marcellin Atemkeng and Louis Aimé Fono.
-
Conflict of interest: The authors have no conflicts of interest to declare. All coauthors have read and agree with the contents of the manuscript, and there is no financial interest to report.
-
Ethical approval: Not applicable, as the study did not involve the use of identifiable humans or animals, and thus did not require ethical clearance.
-
Data availability statement: The datasets generated during and/or analysed during the current study are available from the corresponding author on reasonable request.
References
[1] Hanssen IM, Lapidot M. Major Tomato viruses in the Mediterranean basin. Adv Virus Res. 2012;84:31–66. 10.1016/B978-0-12-394314-9.00002-6Search in Google Scholar PubMed
[2] Tagne A, Tankou C, Ghoghomou TR, Ngoko Z, Tekeu H, Ngonkeu EM, et al. Fusarium diseases of maize (Fusarium verticilloides ex Fusarium moniliforme). Biol Biochem Sci. 2021;29(2):88–99. Search in Google Scholar
[3] Haleem A, Javaid M, Khan IH. Current status and applications of Artificial Intelligence (AI) in medical field: An overview. Current Med Res Practice. 2019;9(6):231–7. 10.1016/j.cmrp.2019.11.005Search in Google Scholar
[4] Becker A. Artificial intelligence in medicine: What is it doing for us today?. Health Policy Technology. 2019;8(2):198–205. 10.1016/j.hlpt.2019.03.004Search in Google Scholar
[5] Abduljabbar R, Dia H, Liyanage S, Bagloee SA. Applications of artificial intelligence in transport: An overview. Sustainability. 2019;11(1):189. 10.3390/su11010189Search in Google Scholar
[6] Rykiel Jr EJ. Artificial intelligence and expert systems in ecology and natural resource management. Ecologic Model. 1989;46(1–2):3–8. 10.1016/0304-3800(89)90066-5Search in Google Scholar
[7] Nandutu I, Atemkeng M, Okouma P. Intelligent systems using sensors and/or machine learning to mitigate wildlife-vehicle collisions: A review, challenges, and new perspectives. Sensors. 2022;22(7):2478. 10.3390/s22072478Search in Google Scholar PubMed PubMed Central
[8] Dharmaraj V, Vijayanand C. Artificial intelligence (AI) in agriculture. Int J Current Microbiol Appl Sci. 2018;7(12):2122–8. 10.20546/ijcmas.2018.712.241Search in Google Scholar
[9] Jha K, Doshi A, Patel P, Shah M. A comprehensive review on automation in agriculture using artificial intelligence. Artif Intell Agriculture 2019;2:1–12. 10.1016/j.aiia.2019.05.004Search in Google Scholar
[10] de la Cruz AJL. Potential of multispectral images acquired by drone in the detection of areas infected by the Golden Flavescence of the vine. Ph.D. thesis. France: University of Toulouse, 3 Paul Sabatier; 2018. Search in Google Scholar
[11] Fusellier JL. The corn sector in Cameroon (The corn sector in Cameroon, What prospects production development corn). Department of Annual Crops. 1993. Search in Google Scholar
[12] Salathé M, Mohanty SP, Hughes DP. Using deep learning for image-based plant disease detection. Front Plant Sci. 2016;7:14–9. 10.3389/fpls.2016.01419Search in Google Scholar PubMed PubMed Central
[13] Wäldchen J, Rzanny M, Seeland M, Mäder P. Identification of rice diseases using deep convolutional neural networks. Neurocomputing. 2017;267(4):378–84. 10.1016/j.neucom.2017.06.023Search in Google Scholar
[14] Aït EK, Boukouri S, Belbrick M, Hajji H, Chtaina N. Experimentation with a model for early detection of tomato diseases by deep learning. Crop Production 2020;14:19–30. Search in Google Scholar
[15] Ferentinos KP. Deep learning models for plant disease detection and diagnosis. Comput Electron Agric. 2018;145:311–8. 10.1016/j.compag.2018.01.009Search in Google Scholar
[16] Goel L, Nagpal A. A systematic review of recent machine learning techniques for plant disease identification and classification. IETE Tech Rev. 2022;40:423–39. 10.1080/02564602.2022.2121772. Search in Google Scholar
[17] Yu H, Liu J, Chen C, Heidari A, Zhang Q, Chen H, et al. Corn leaf diseases diagnosis based on K-means clustering and deep learning. Digital Object Identifier. 2021;9:143824–35. 10.1109/ACCESS.2021.3120379. Search in Google Scholar
[18] Mousavi SA, Hanifeloo Z, Sumari P, Arshad S. Enhancing the diagnosis of corn pests using Gabor wavelet features and SVM classification. J Scientific Industrial Res. 2016;75:349–54. Search in Google Scholar
[19] Pawan E, Thamrin R, Widodo W, Bei S, Luanmasa J. Implementation of forward chaining method in expert system to detect diseases in corn plants in Muara Tami district. Int J Comput Inform Syst (IJCIS). 2022;75:349–54. 10.29040/ijcis.v3i1.59Search in Google Scholar
[20] Seyed M, Ahmad B, Keyvan A, Yiannis A. Diagnosis of grape leaf diseases using automatic K-means clustering and machine learning. Smart Agricultural Technology. 2022;3:1000815. 10.1016/j.atech.2022.100081Search in Google Scholar
[21] Deng R, Tao1 M, Xing H, Yang X, Liu C, Liu C, et al. Automatic diagnosis of rice diseases using deep learning. Frontiers Plant Sci. 2021;12:701–38. 10.3389/fpls.2021.701038Search in Google Scholar PubMed PubMed Central
[22] Sumita M, Rishabh S, Diksha R. Deep convolutional neural network based detection system for real-time corn-plant recognition. Proc Comput Sci. 2020;167:2003–10. 10.1016/j.procs.2020.03.236Search in Google Scholar
[23] Pan S, Qiao J, Wang R, Yu H, Wang C, Taylor K, et al. Intelligent diagnosis of Northern corn leaf blight with deep learning model. J Integrative Agriculture. 2022;21(4):1094–105. 10.1016/S2095-3119(21)63707-3Search in Google Scholar
[24] Wäldchen J, Mäder P. Using deep learning for image-based plant disease detection. Archives Comput Methods Eng. 2018;25(2):507–43. 10.1007/s11831-016-9206-zSearch in Google Scholar PubMed PubMed Central
[25] Prajapati HB, Shah JP, Dabhi VK. Detection and classification of rice plant diseases. Intelligent Decision Technologies. 2017;11(3):357–73. 10.3233/IDT-170301Search in Google Scholar
[26] Wäldchen J, Rzanny M, Seeland M, Mäder P. Automated plant species identification-trends and future directions. PLoS Comput Biol. 2018;14(4):1–19. 10.1371/journal.pcbi.1005993Search in Google Scholar PubMed PubMed Central
[27] Kosal K. Contribution de l’imagerie dronique pour la caractérisation des paramètres biophysiques des cultures agricoles. PhD thesis. Canada: University of Montreal; 2020. Search in Google Scholar
© 2024 the author(s), published by De Gruyter
This work is licensed under the Creative Commons Attribution 4.0 International License.
Articles in the same Issue
- Research Articles
- A study on intelligent translation of English sentences by a semantic feature extractor
- Detecting surface defects of heritage buildings based on deep learning
- Combining bag of visual words-based features with CNN in image classification
- Online addiction analysis and identification of students by applying gd-LSTM algorithm to educational behaviour data
- Improving multilayer perceptron neural network using two enhanced moth-flame optimizers to forecast iron ore prices
- Sentiment analysis model for cryptocurrency tweets using different deep learning techniques
- Periodic analysis of scenic spot passenger flow based on combination neural network prediction model
- Analysis of short-term wind speed variation, trends and prediction: A case study of Tamil Nadu, India
- Cloud computing-based framework for heart disease classification using quantum machine learning approach
- Research on teaching quality evaluation of higher vocational architecture majors based on enterprise platform with spherical fuzzy MAGDM
- Detection of sickle cell disease using deep neural networks and explainable artificial intelligence
- Interval-valued T-spherical fuzzy extended power aggregation operators and their application in multi-criteria decision-making
- Characterization of neighborhood operators based on neighborhood relationships
- Real-time pose estimation and motion tracking for motion performance using deep learning models
- QoS prediction using EMD-BiLSTM for II-IoT-secure communication systems
- A novel framework for single-valued neutrosophic MADM and applications to English-blended teaching quality evaluation
- An intelligent error correction model for English grammar with hybrid attention mechanism and RNN algorithm
- Prediction mechanism of depression tendency among college students under computer intelligent systems
- Research on grammatical error correction algorithm in English translation via deep learning
- Microblog sentiment analysis method using BTCBMA model in Spark big data environment
- Application and research of English composition tangent model based on unsupervised semantic space
- 1D-CNN: Classification of normal delivery and cesarean section types using cardiotocography time-series signals
- Real-time segmentation of short videos under VR technology in dynamic scenes
- Application of emotion recognition technology in psychological counseling for college students
- Classical music recommendation algorithm on art market audience expansion under deep learning
- A robust segmentation method combined with classification algorithms for field-based diagnosis of maize plant phytosanitary state
- Integration effect of artificial intelligence and traditional animation creation technology
- Artificial intelligence-driven education evaluation and scoring: Comparative exploration of machine learning algorithms
- Intelligent multiple-attributes decision support for classroom teaching quality evaluation in dance aesthetic education based on the GRA and information entropy
- A study on the application of multidimensional feature fusion attention mechanism based on sight detection and emotion recognition in online teaching
- Blockchain-enabled intelligent toll management system
- A multi-weapon detection using ensembled learning
- Deep and hand-crafted features based on Weierstrass elliptic function for MRI brain tumor classification
- Design of geometric flower pattern for clothing based on deep learning and interactive genetic algorithm
- Mathematical media art protection and paper-cut animation design under blockchain technology
- Deep reinforcement learning enhances artistic creativity: The case study of program art students integrating computer deep learning
- Transition from machine intelligence to knowledge intelligence: A multi-agent simulation approach to technology transfer
- Research on the TF–IDF algorithm combined with semantics for automatic extraction of keywords from network news texts
- Enhanced Jaya optimization for improving multilayer perceptron neural network in urban air quality prediction
- Design of visual symbol-aided system based on wireless network sensor and embedded system
- Construction of a mental health risk model for college students with long and short-term memory networks and early warning indicators
- Personalized resource recommendation method of student online learning platform based on LSTM and collaborative filtering
- Employment management system for universities based on improved decision tree
- English grammar intelligent error correction technology based on the n-gram language model
- Speech recognition and intelligent translation under multimodal human–computer interaction system
- Enhancing data security using Laplacian of Gaussian and Chacha20 encryption algorithm
- Construction of GCNN-based intelligent recommendation model for answering teachers in online learning system
- Neural network big data fusion in remote sensing image processing technology
- Research on the construction and reform path of online and offline mixed English teaching model in the internet era
- Real-time semantic segmentation based on BiSeNetV2 for wild road
- Online English writing teaching method that enhances teacher–student interaction
- Construction of a painting image classification model based on AI stroke feature extraction
- Big data analysis technology in regional economic market planning and enterprise market value prediction
- Location strategy for logistics distribution centers utilizing improved whale optimization algorithm
- Research on agricultural environmental monitoring Internet of Things based on edge computing and deep learning
- The application of curriculum recommendation algorithm in the driving mechanism of industry–teaching integration in colleges and universities under the background of education reform
- Application of online teaching-based classroom behavior capture and analysis system in student management
- Evaluation of online teaching quality in colleges and universities based on digital monitoring technology
- Face detection method based on improved YOLO-v4 network and attention mechanism
- Study on the current situation and influencing factors of corn import trade in China – based on the trade gravity model
- Research on business English grammar detection system based on LSTM model
- Multi-source auxiliary information tourist attraction and route recommendation algorithm based on graph attention network
- Multi-attribute perceptual fuzzy information decision-making technology in investment risk assessment of green finance Projects
- Research on image compression technology based on improved SPIHT compression algorithm for power grid data
- Optimal design of linear and nonlinear PID controllers for speed control of an electric vehicle
- Traditional landscape painting and art image restoration methods based on structural information guidance
- Traceability and analysis method for measurement laboratory testing data based on intelligent Internet of Things and deep belief network
- A speech-based convolutional neural network for human body posture classification
- The role of the O2O blended teaching model in improving the teaching effectiveness of physical education classes
- Genetic algorithm-assisted fuzzy clustering framework to solve resource-constrained project problems
- Behavior recognition algorithm based on a dual-stream residual convolutional neural network
- Ensemble learning and deep learning-based defect detection in power generation plants
- Optimal design of neural network-based fuzzy predictive control model for recommending educational resources in the context of information technology
- An artificial intelligence-enabled consumables tracking system for medical laboratories
- Utilization of deep learning in ideological and political education
- Detection of abnormal tourist behavior in scenic spots based on optimized Gaussian model for background modeling
- RGB-to-hyperspectral conversion for accessible melanoma detection: A CNN-based approach
- Optimization of the road bump and pothole detection technology using convolutional neural network
- Comparative analysis of impact of classification algorithms on security and performance bug reports
- Cross-dataset micro-expression identification based on facial ROIs contribution quantification
- Demystifying multiple sclerosis diagnosis using interpretable and understandable artificial intelligence
- Unifying optimization forces: Harnessing the fine-structure constant in an electromagnetic-gravity optimization framework
- E-commerce big data processing based on an improved RBF model
- Analysis of youth sports physical health data based on cloud computing and gait awareness
- CCLCap-AE-AVSS: Cycle consistency loss based capsule autoencoders for audio–visual speech synthesis
- An efficient node selection algorithm in the context of IoT-based vehicular ad hoc network for emergency service
- Computer aided diagnoses for detecting the severity of Keratoconus
- Improved rapidly exploring random tree using salp swarm algorithm
- Network security framework for Internet of medical things applications: A survey
- Predicting DoS and DDoS attacks in network security scenarios using a hybrid deep learning model
- Enhancing 5G communication in business networks with an innovative secured narrowband IoT framework
- Quokka swarm optimization: A new nature-inspired metaheuristic optimization algorithm
- Digital forensics architecture for real-time automated evidence collection and centralization: Leveraging security lake and modern data architecture
- Image modeling algorithm for environment design based on augmented and virtual reality technologies
- Enhancing IoT device security: CNN-SVM hybrid approach for real-time detection of DoS and DDoS attacks
- High-resolution image processing and entity recognition algorithm based on artificial intelligence
- Review Articles
- Transformative insights: Image-based breast cancer detection and severity assessment through advanced AI techniques
- Network and cybersecurity applications of defense in adversarial attacks: A state-of-the-art using machine learning and deep learning methods
- Applications of integrating artificial intelligence and big data: A comprehensive analysis
- A systematic review of symbiotic organisms search algorithm for data clustering and predictive analysis
- Modelling Bitcoin networks in terms of anonymity and privacy in the metaverse application within Industry 5.0: Comprehensive taxonomy, unsolved issues and suggested solution
- Systematic literature review on intrusion detection systems: Research trends, algorithms, methods, datasets, and limitations