Traceability and analysis method for measurement laboratory testing data based on intelligent Internet of Things and deep belief network
-
PeiDong He
 ,
WenQi Shen
,
WenQi Shen

Abstract
A traceability and analysis method for measurement laboratory testing data based on the intelligent Internet of Things (IoT) and deep belief network (DBN) is proposed to address the issue of low accuracy in identifying anomalies in measurement testing data and difficulty in identifying the causes of anomalies. First, a data analysis system for the metrology laboratory is designed based on an intelligent IoT architecture of “cloud-management-edge-end.” Then, the Gaussian Bernoulli-Restricted Boltzmann machine is introduced to improve the DBN model, which is deployed on the edge side for learning the ledger data sample library to determine the anomaly detection data of the metrology device. Finally, a stacked denoising autoencoder model is used in the cloud center to extract historical electricity consumption curve features, and the cause of anomalies is determined by calculating the cosine similarity between it and the target device feature curve to complete traceability analysis. Based on the selected dataset, the proposed method is experimentally demonstrated, and the results show that its traceability accuracy and time consumption are 88.72% and 3.949 s, respectively, which can meet the detection requirements of the metrology laboratory.
1 Introduction
The power system generates massive amounts of data during actual operation, and its efficient collection and use is an important issue that urgently needs to be solved for smart grid big data [1]. State Grid Corporation of China’s smart meter and power consumption information collection have covered 99% of power users within its business scope, and the time series data collected by the smart meter contain rich power consumption behavior information and characteristics of power users, which can provide a scientific data basis and guidance basis for the modeling and prediction of various works of the power system [2,3]. Therefore, the accuracy and reliability of smart meters and other metering devices are crucial to the scientific operation of power grid enterprises.
At present, the country is increasing the construction of power measurement laboratories, utilizing laboratory platforms to carry out standard measurement transmission, quality inspection of measurement devices, and on-site inspection to comprehensively improve the reliability of the devices. The existing professional laboratories at all levels carry out company inspection, testing, verification, calibration, and other businesses, providing quality supervision services for the measurement center and society. However, with the improvement of measurement capabilities and technology, some problems have gradually emerged in the measurement laboratory [4,5]: (1) The equipment in the laboratory comes from multiple different manufacturers, and the interaction logic and operation methods of the testing software interfaces of different manufacturers are different. Moreover, due to the large number of imported equipment and the English interface of the software, the learning cost is high, and the technical level of the testing personnel is high. (2) The automation level of the detection software varies, and the digitization level of the detection data varies, making it difficult to upload to the management system and lacking the ability to automatically issue certificates. (3) In high-precision measurement, quality traceability is difficult. Due to the lack of mastery of experimental process data and the complexity and variability of influencing factors, finding and reproducing problems when anomalies occur require significant time costs and difficulty. (4) The standard transmission laboratory has been renovated to have the ability to monitor and collect environmental data, but these data cannot be matched with the detection, making it difficult to utilize the data.
With the rapid development of new-generation information and communication technologies such as cloud computing, Internet of Things (IoT), edge computing, mobile communication, and artificial intelligence, more innovative ideas have been provided for the construction of measurement laboratories, and edge computing technology and deep learning algorithms have been used to realize the intellectualization of laboratories [6]. For the detection and traceability analysis of abnormal data, most methods are based on models such as artificial neural networks and support vector machines. However, the objective function that artificial neural networks need to optimize is complex, and there are efficiency issues in processing power grid big data [7]. Traditional machine learning methods such as support vectors take a long time to train data, and processing massive data samples also faces serious challenges, especially for high-dimensional feature data, which can lead to dimensional disasters [8]. As an extension and extension of machine learning neural network algorithms, deep learning can effectively handle high-dimensional scene problems in massive data classification and regression processing [9].
Aiming at the problems of weak model detection ability and low efficiency in most existing anomaly detection methods, as well as poor universality of most existing traceability methods, a measurement laboratory detection data traceability and analysis method based on intelligent IoT and deep belief networks (DBN) is proposed, which utilizes intelligent IoT architecture and deep learning algorithms to achieve deep data analysis. The innovation of the proposed method lies in the following:
Unlike traditional DBN models, which have difficulty handling continuous data, the proposed method introduces the Gaussian Bernoulli-Restricted Boltzmann Machine (GBRBM) to improve the DBN model and uses it for learning the ledger data sample library to achieve the judgment of normal and abnormal operation status of measuring devices, thereby ensuring the accuracy of subsequent traceability results.
Compared to the problem of poor traceability performance in most methods, the proposed method uses a stacked denoising autoencoder model to extract historical electricity consumption curve features of metering devices in order to construct a sample library of electricity consumption curve fault features and further analyze abnormal devices through this sample library to obtain more accurate tracing results of metering device faults.
In addition, the formula variables used in the text are shown in Table 1.
Annotations for full-text variables
| Variable | Definition |
|---|---|
|
|
The biases of visible unit |
|
|
The biases of hidden unit |
|
|
The connection weight between visible and hidden units |
|
|
Standard deviation of Gaussian noise for visible units |
|
|
Mean value of Gaussian noise for visible units |
|
|
Gaussian function |
|
|
Learning rate |
|
|
The expected values of real data |
|
|
The network output values |
|
|
The activation function,
|
|
|
Encoding parameters |
|
|
Decoding parameters |
|
|
The offset between the hidden layer and the input layer |
|
|
The mapping function from the input layer to the hidden layer |
|
|
The noise reduction factor |
2 Related researches
At present, the commonly used methods for anomaly data detection and analysis mainly include statistical-based detection algorithms, distance or density-based detection algorithms, as well as later developed neural network detection methods, support vector methods, and clustering analysis methods. Wu et al. [10] proposed a data anomaly detection method based on improved kernel density estimation. On the basis of the traditional kernel density estimation theory, the adaptive diffusion equation theory was introduced, and the best window width value was selected to achieve a high fitting of data distribution, ensuring the detection effect. However, this method is based on density expansion detection and has significant limitations. Dai et al. [11] proposed a density-based clustering algorithm DBSCAN for data anomaly detection. By mining the correlation between datasets and combining it with the DBSCAN algorithm for detection, the model was updated in real-time using a parameter self-selection mechanism. However, this model only detects anomalies in correlation, and its analytical ability is not strong. Xu et al. [12] proposed a novel and robust data anomaly detection method using learning active learning (LAL) and the AdaBoost algorithm. LAL solved the biased classification problem caused by unbalanced data and extracted data features using wavelet packet transform. This method can ensure good detection performance, but the LAL model has a strong greed for data and uncertainty. Mao et al. [13] proposed a data anomaly detection method that combined generative adversarial networks with autoencoders, in which time series data were converted into Graeme angle domain images, and advanced computer vision methods were incorporated into the network for analysis. Most existing anomaly detection methods have problems such as weak model detection ability and low efficiency.
In addition, the traceability study of abnormal data points is beneficial for the operation and monitoring center’s work and has engineering application value. Caiyun et al. [14] proposed a distributed traceability model based on digital watermarking and blockchain in edge computing, which improved the security of the traditional traceability model by dividing internal and external regions and electing master nodes. However, the model focuses on security and has a poor ability to analyze anomalies. Fu et al. [15] proposed a traceability and interaction mechanism for spatial image data to achieve traceability and traceability during data processing. It utilized grid code partitioning and indexing techniques to preprocess spatial image data to improve data retrieval efficiency. The core algorithm of this mechanism is a fast and practical Byzantine fault-tolerant algorithm based on an alliance chain. Li et al. [16] proposed a continuous commutation fault tracing method for multi-infeed direct current systems, in which the influence of contact impedance on the probability of continuous CF occurrence was quantitatively calculated, and the fault cause was analyzed by comparing weight factors. However, this method only traces the source from a physical implementation perspective and lacks universality. Wang et al. [17] proposed a fault traceability model based on the fusion of historical production cases and process data information. The model determined the defect cause tag through text similarity calculation, used the L1 regularization method for feature selection, and used the XGBoost integration method to train the correlation model between process data and defected to determine the contribution of each feature in the data source. Based on the D-S evidence theory, different rules were set to determine the source of the fault. However, this method lacks an effective feature extraction model, which directly affects the traceability effect. Li et al. [18] proposed a composite welding quality traceability model, which included a quality early warning method based on a long short-term memory network (LSTM) and an optimization algorithm for quality data backtracking query. Through training the early warning model and query optimization algorithm, quality traceability was achieved. The LSTM model can distinguish between good and bad quality, but the query optimization algorithm lacks an effective analysis strategy, resulting in unsatisfactory traceability results. At present, there is relatively little research on the traceability of data anomalies, and the traceability of anomalies in metrology laboratories is still in its infancy. Most existing traceability methods have poor universality.
3 Architecture of measurement laboratory based on intelligent IoT
The intelligent IoT system consists of a cloud platform, edge IoT agent with edge computing framework and edge side application, perception layer terminal, and the thing model running through it, forming a four-level system hierarchy of “cloud-management-edge-end” [19,20]. The Smart IoT has achieved significant results in the analysis of remote sensing images. Based on this, a metrological experimental data analysis mechanism based on the Smart IoT has been designed, as shown in Figure 1 [21]. In terms of overall architecture, it can be divided into an on-site perception layer and edge autonomy layer, as well as a remote supervision layer for headquarters.

Architecture of measurement laboratory based on intelligent IoT.
Cloud refers to the IoT management platform and various professional upper-level applications deployed in the cloud, such as training and improving DBN models, abnormal data traceability analysis, etc. Management refers to all kinds of remote communication networks connected to the edge side and cloud side. Edge refers to the software and hardware systems deployed on the regional scene with edge computing and cloud edge interaction capabilities, which process system data nearby, such as data anomaly analysis. End refers to all kinds of terminals and sensors deployed inside or near the collection object.
The perception layer mainly deploys various sensing devices for data collection, utilizing wired, wireless fidelity, long-distance radio, radio frequency identification, Bluetooth, and other components to form the IoTs for local communication. The edge autonomous layer mainly deploys various types of edge IoT agents equipped with the edge computing framework and implements edge-in-place analysis, smart site management, and cloud edge collaborative interaction in three functional forms, namely, edge-to-end separation, edge-to-end integration, and edge nodes, facing different management needs on the site. The remote supervision layer mainly deploys platform application functions such as real-time alarm, comprehensive query, advanced analysis, and interface service.
4 Data anomaly analysis method based on improved DBN
4.1 Constructing a sample library for measuring laboratory testing ledger
Before conducting an abnormal analysis of measurement laboratory testing data, it is necessary to analyze the influencing factors of the normal operation of measurement devices and determine the dimensions of data mining. Mainly considering five aspects: electricity consumption environment, meteorological factors, different types of metering devices, operating hours, engineering quality, and historical electricity consumption curve data. The first four aspects belong to ledger data, and the historical electricity consumption curve data belong to real-time data of the electricity consumption information collection system. In order to have sufficient samples for the model to learn, the curve length is taken as 1 month, with 96 points per day.
The electrical environment and meteorological factors can have a significant impact on the reliability of metering devices and even cause meter failures, such as abnormal energy meters caused by atmospheric corrosion of chloride salts in the operating environment, external force damage during operation, lightning strikes, etc. Due to the large number of suppliers of measuring devices and the differences in internal design and components among different measuring devices, the failures of measuring devices often exhibit familial defects. There is a high possibility of the same type of failure occurring in the same batch of measuring devices from the same manufacturer. An increase in operating time will lead to a decrease in the operational reliability of the metering device, which has a certain expected lifespan. As the operating time increases, the aging of its components and battery loss will both make the meter more prone to failure. For example, hardware damage include error tolerance, capacitor damage, battery damage, etc. Engineering quality issues can also affect the operation status of electricity meters. Engineering quality issues can be divided into meter quality and installation quality issues, including false soldering, foreign objects in the meter, short circuits of solder joints, incorrect parameter settings, reverse connection of incoming and outgoing lines, or phase errors.
Based on the analysis of the influencing factors of metering device failures mentioned above, multiple ledger attributes were selected as feature vectors, and the data consist of two categories: (1) Components of electricity consumption environment and meteorological factors. Dimensions such as usage region and industry category can be selected for electricity consumption environment and meteorological factors. (2) Different types of measuring device components. Select three dimensions for the components of the measuring device, namely category, manufacturer, and rated current. Select 8,000 pieces of measurement device data from the marketing business system and electricity information collection system as samples, and after screening, the remaining 6,498 pieces of data are used as samples to construct a sample library of measurement laboratory testing accounts. The sample data include various attribute values of normal and faulty devices, and data collection and organization of account attributes such as usage area, category, manufacturer, industry category, and calibration current are carried out.
4.2 GBRBM
The restricted Boltzmann machine (RBM) is an undirected probability graph model with a bipartite graph structure, including a visible layer v composed of m neurons and a hidden layer h composed of n neurons. Each node in the layer is not connected to each other and is independent of each other [22]. Due to the fact that both the visible and hidden layers of traditional RBM are binary units, the values are both 0 and 1. The vibration signal is a set of continuous time series data, and the binary unit model is not conducive to the operation of continuous data. Therefore, the proposed method introduces continuous values of independent Gaussian distribution in traditional RBM models to process continuous data, limiting the output value of RBM’s structural units to continuous values between 0 and 1.
GBRBM is jointly proposed by Krizhevsky and Hinton and is used to model the Boltzmann machine model of nonbinomial distribution data [23]. GBRBM assumes that the variable of the visible layer is the Gaussian distribution and the variable of the hidden layer is the Bernoulli distribution. Its energy function is defined as
The conditional probability of visible and hidden layers are
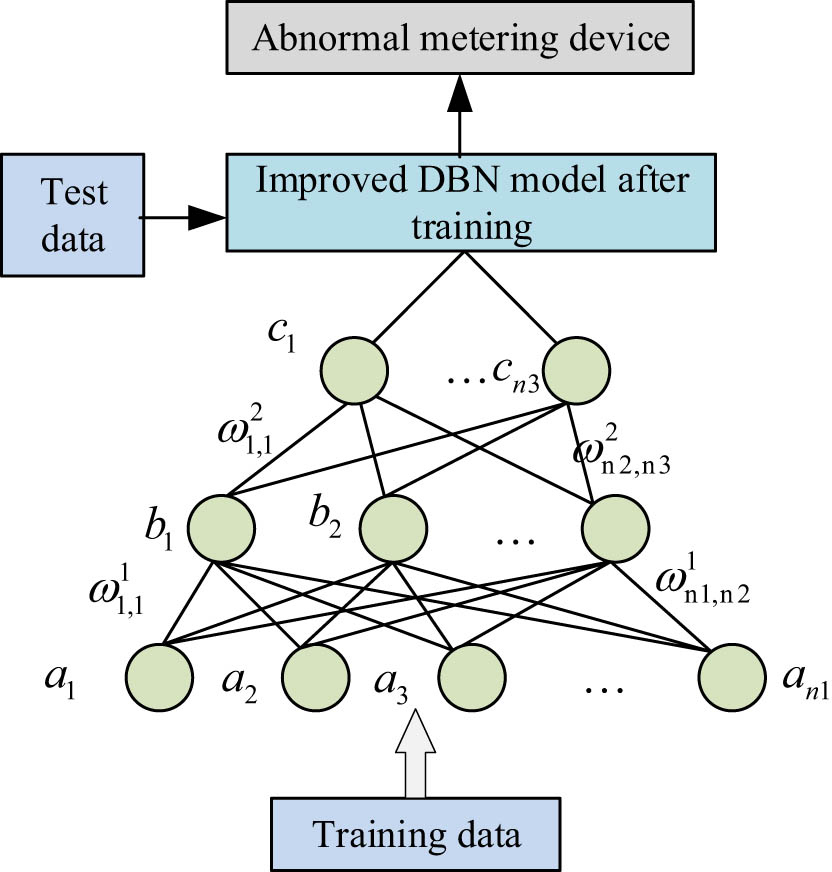
4.3 Improved DBN model
In order to solve the problem of the poor fitting effect of traditional RBM for data reconstruction of non-binomial distribution, a GBRBM-DBN model is proposed, which consists of a GBRBM, several RBMs, and a Softmax classifier, as shown in Figure 2.

Structure of an improved DBN.
The input training data are used as the input
Among them, GBRBM, like traditional RBM, uses the CD algorithm for pre-training. The CD algorithm uses the K-L distance between the estimated probability distribution and the true probability distribution as a metric criterion and performs g-step Gibbs sampling on each batch of training samples to generate samples with maximum probability.
The maximum value of the likelihood function is obtained by using the random gradient rise method, and the network parameter update rules are as follows:
4.4 Analysis process for abnormal detection data in metrology laboratory
Due to its ability to capture high-level abstract features in data, strong representation ability for complex data structures, and more stable model training, the DBN model is used to analyze complex metrology device data. Meanwhile, the DBN model utilizes RBM to generate distribution factors for training data, resulting in higher learning efficiency. Additionally, the improved DBN model based on GBRBM can quickly and accurately process massive amounts of data. Therefore, the GBRBM-DBN model is used for the analysis of massive detection data in metrology laboratories. Specifically, the detection ledger sample library data are input into the improved DBN model for learning to obtain abnormal detection data. The overall process is shown in Figure 3.
Data anomaly analysis process based on improved DBN.
First, divide 6,498 samples into a training set and a testing set in a 5:1 ratio. In the process of using the training set for model training, the training data are input to the underlying nodes of GBRBM-DBN, and the weights
Then, during the model testing process, the test data are input into the trained GBRBM-DBN model, and the Softmax classifier is used to output the abnormal analysis results of the detection data to determine whether the measuring device is abnormal. Finally, trace and analyze the abnormal measuring devices to identify the cause of the abnormality and improve maintenance efficiency.
5 A method for traceability of measurement laboratory testing data based on stacked denoised autoencoder (SDAE)
5.1 SDAE
The autoencoder includes encoding and decoding processes, which can convert input data X to hidden layer data Y and then decode it to Z [24]. The automatic encoder directly analyzes the complete input data, and once the input dataset changes, the adaptability of the model will also be significantly reduced. Therefore, in order to improve the adaptability of the model, a denoising automatic encoder (DAE) is proposed, which can set the values of certain positions in the input data to 0 with a certain probability distribution, equivalent to involving “bad” data
Due to the limited ability of a single DAE to mine hidden data information, it is usually necessary to stack multiple DAEs, resulting in an SDAE model composed of multiple DAE models. SDAE can learn deeper features in input data than a single DAE, and its network structure is shown in Figure 4.

Structure of SDAE network.
The training process of SDAE includes unsupervised layer-by-layer pre-training and supervised fine-tuning. After randomly mapping the hidden layers of each individual DAE, set the data at certain positions to 0 and then use it as input for the next DAE, and so on, to form a complete SDAE network.
5.2 Proposed traceability method for measurement laboratory testing data
The historical operation data of the metering device reflect the operating health of the electricity meter. For the smart meter in normal operation, the metering and detection organization can normally collect its current, voltage, active power, reactive power, meter reading electricity, and other data, which reflects the operating status of the device. Devices with a high potential for failure often operate in a hidden and abnormal state, and their operating data differ from the original normal operating data, but the difference is small and cannot meet the fault diagnosis standards of measuring and testing institutions. Therefore, the extraction of abnormal indicators from real-time operational data can be used as an evaluation of the health status of measuring devices.
In order to provide sufficient samples for the model to learn, the curve length is taken as 1 month, with 96 points per day, and the curve categories are current, voltage, and power. Due to the large amount of current and power data collected by measuring devices, directly using curve data as model attributes can lead to excessive dimensionality, directly affecting the calculation time and traceability accuracy of the model [27,28,29,30,31]. Meanwhile, short-term curve data cannot reflect the operating status of the device over a longer period of time and commonly used neural networks such as LSTM are difficult to handle long time series, and the model is more complex. SDAE has good deep-level feature extraction and adaptive capabilities. In order to obtain the overall situation of real-time electricity consumption curve data as much as possible and facilitate deep feature extraction of the model, SDAE is used to extract features of current and power, and a fault feature sample library of the electricity consumption curve is constructed.
The input curve fault feature sample library of the measuring device that is determined to have abnormalities through the ledger sample library will be used to calculate the similarity between the operating curve characteristics of the testing measuring device and the fault curve characteristics. Based on the results, it will be determined whether the measuring device has malfunctioned, achieving abnormal traceability of the measuring device. The abnormal traceability process of measuring devices based on SDAE is shown in Figure 5.
Set up 96 input nodes in the SDAE input layer and receive a current or power sequence of 1 96 point input. Among them, the GBRBM-DBN model determines the existence of abnormal metering devices, and the input current or power is the sequence from the day before the abnormality occurs.
The input layer maps abnormal data to the hidden layer through random mapping and learns key feature information from the abnormal data
(8)where
Reconstruct abnormal data
(9)After the training of the SDAE network is completed, the reconstruction error is small, and it is considered that the extracted features at this time are typical. The features extracted from the hidden layer, namely the historical current curve and power curve, are condensed into two 24 point feature sequences. Classify the current characteristics and power characteristics of faulty meters into two categories and construct a fault feature sample library for electricity consumption curves.
Due to the time correlation of the data collected by the measuring device, its distribution will change over time. Therefore, a sliding window model is used to place the newly collected data and the latest time data in the same window, and the output is compared and analyzed with the fault curve characteristics. In the sliding window model, k represents the size of the sliding window, with windows 1 and 2 at time t − 1 and t, respectively. When new data are collected at the next moment, the window slides to the right, sliding the samples to be analyzed into the window, and sliding some of the analyzed samples out of the window. Finally, output the sample data in the new window.
When comparing the power consumption curve features of the target metering device output through the sliding window model with the fault features, cosine similarity is used to evaluate the similarity between the two features. The cosine similarity
where Q is the length of the characteristic vector of the electricity consumption curve, with a value of 24;

The abnormal traceability process of measuring devices based on SDAE.
6 Experiments and analysis
The experiment was implemented on the MATLAB R2017a platform and ran on a dedicated server with a 1.9 GHz dual-core CPU and 32 GB of memory. The experimental environment configuration is shown in Table 2.
Experimental environment settings
| Experimental environment | Configuration |
|---|---|
| Programming Language | Python 3.8 |
| Deep learning framework | Pytorch 1.10 |
| Operating system | Ubuntu1.04 |
| GPU | NVIDIA Tesla A100 80GB |
At the same time, 2,000 electricity meters are randomly selected from the distribution area of a certain city for testing. The model, operating time, and environment of the electricity meters are all inconsistent, with a total of 98,416 testing points. Model parameter settings: The number of iterations is 500, the learning rate is 0.001, the batch size is 100, and
6.1 Evaluation index
The experiment measures the performance of the algorithm from two aspects: accuracy and computational time. The algorithm accuracy includes the accuracy, false positive rate (FPR), and recall rate (Recall) of anomaly detection analysis, which are calculated as follows:
where Y represents the true abnormal state in the original data,
In addition, the time indicator is chosen as the average execution time of different methods executing the same number of times.
6.2 Determination of model structure
The number of hidden layers of the model has a certain impact on the experimental results. If the number of layers is too large, it will not only increase the operation time, but also cause overfitting, affecting the accuracy of analysis. The selection of layers is too small to deeply learn feature phasors and cannot extract abnormal features well, resulting in insufficient accuracy. Therefore, 200 samples were selected for training and 50 samples for testing. The relationship between the number of hidden layers and analysis accuracy is shown in Figure 6.

The relationship between accuracy and the number of hidden layers: (a) improved DBN model and (b) SDAE model.
From Figure 6, it can be seen that when the hidden layer of the improved DBN model is three layers, the analysis accuracy reaches the highest 95%. Increasing the number of hidden layers does not increase the accuracy but may actually decrease it. When the number of hidden layers reaches the seventh layer, the accuracy is even lower than 93%. Therefore, the hidden layer of the improved DBN model is set to three layers. Similarly, when the hidden layer of the SDAE model is four layers, the analysis accuracy reaches the highest 94.6%. The increase in the number of hidden layers does not improve the analysis accuracy, but rather decreases. When the hidden layer is eight layers, the accuracy of the SDAE model decreases to 92.5%, and an increase in the number of hidden layers greatly increases the learning time of the model. Therefore, considering all factors, the hidden layer of the SDAE model is set to four layers.
6.3 Comparison of abnormal analysis results between different models
The improved DBN model processes continuous data by introducing an independent Gaussian distribution. In order to demonstrate the performance difference between it and traditional DBN models, the two were compared and trained, and the results are shown in Figure 7.

Performance comparison of the DBN model before and after improvement.
From Figure 7, it can be seen that after 350 iterations, the improved GBRBM-DBN model tends to stabilize with an accuracy rate of over 95%. The DBN model tends to converge after 420 iterations, and the accuracy decreases by 2% compared to the improved DBN model. This indicates that introducing the GBRBM layer into the DBN model can improve the model’s anomaly analysis ability and accelerate convergence.
In order to verify the data anomaly analysis performance of the improved DBN model, it was compared and analyzed by Wu et al. [10] and Xu et al. [12]. Among them, Wu et al. [10] use traditional detection models, while Xu et al. [12] use deep learning models, which are comparable to the proposed improved DBN model. Input the sample database of the ledger into four models, and the evaluation indicators (accuracy, FPR, and recall rate) of the analysis results are shown in Table 3.
Data anomaly analysis results for different models
| Model | Accuracy (%) | FPR (%) | Recall (%) |
|---|---|---|---|
| Ref. [10] | 87.19 | 12.81 | 85.24 |
| Ref. [12] | 92.25 | 7.75 | 90.31 |
| GBRBM-DBN | 95.51 | 4.49 | 93.08 |
From Table 3, the proposed GBRBM-DBN model has the best performance, with accuracy, FPR, and recall rate reaching 95.51, 4.49, and 93.08%, respectively. This is because the improved DBN model adopts a layer of GBRBM, which can better handle continuous sample library data. At the same time, compared to other models, the model has stronger deep learning ability, so the anomaly analysis effect is the most ideal. Wu et al. [10] use the improved kernel density estimation method to detect data anomalies, but this method has greater limitations, and the detection accuracy is 8.32% lower than the proposed method. The combination of LAL and AdaBoost algorithms in Xu et al. [12] for data anomaly detection can ensure a good detection accuracy of 92.25%. However, the uncertainty of the LAL model leads to unstable analysis results of this method. Therefore, overall, the proposed method has significant advantages in analyzing abnormal metering devices.
6.4 Analysis of traceability results
The accuracy of traceability analysis results is crucial. Compare the proposed SDAE + GBRBM-DBN method with SDAE, SDAE + DBN, and select 200 electricity consumption curves as samples for training. The FPR under different iteration times is shown in Figure 8.

Analysis error under different iterations.
From Figure 8, it can be seen that when the number of iterations reaches 150, the error detection rate of the SDAE + GBRBM-DBN model reaches a stable state, approaching 8%. However, the SDAE + DBN model has some fluctuations in the entire training process due to not considering the time continuity of the data, and the error detection rate has improved. The learning and analysis ability of a single SDAE model is poor, resulting in a false detection rate of nearly 20%. From this, it can be argued that the proposed SDAE + GBRBM-DBN method has the best effect on the traceability analysis of anomalies in measuring devices.
Select 20 non-abnormal electricity meters and 20 abnormal electricity meter ledger data as the test set and use the proposed method to test the electricity meters in this test set. Extract the electricity consumption curve data judged as abnormal electricity meters and input it into the electricity consumption curve fault feature sample library for anomaly tracing. The electricity consumption curve attributes are the current and power sequences extracted through feature extraction. Using cosine similarity for similarity calculation, determine a faulty meter as one that has a similarity of more than 0.8 between the electricity consumption characteristic curve and the fault characteristic curve. The ID and fault tracing results of some test meters are shown in Table 4.
Electricity meter traceability test results
| Meter ID | Actual state | Traceability judgment results |
|---|---|---|
| 2649931 | Faulted | Fault |
| 3029048 | Faulted | Fault |
| 3073675 | Faulted | Fault |
| 1466522 | Faulted | Fault |
| 4105960 | Faulted | Normal |
| 5685007 | Faulted | Fault |
| 4115663 | Faulted | Fault |
| 2745001 | Faulted | Fault |
| 3029083 | Faulted | Fault |
| 4105962 | Faulted | Normal |
| 5685007 | Faulted | Fault |
| 2445835 | Faulted | Fault |
| 2553740 | Faulted | Fault |
| 0405580 | Faulted | Fault |
| 1110705 | Faulted | Fault |
| 1006581 | No failure | Fault |
| 3073653 | No failure | Normal |
| 2573449 | No failure | Normal |
| 8959276 | No failure | Normal |
| 9315640 | No failure | Normal |
According to the test results in Table 4, for the smart meter with abnormal points, the accuracy of the fault traceability test is 86.7%. However, for the smart meter without abnormality, there is also some judgment deviation in fault traceability. For example, for the normal meter with ID 1006581, the traceability result is fault. Overall, the proposed method has a traceability accuracy of over 85% and has high detection accuracy.
6.5 Comparative analysis of different traceability methods
To demonstrate the performance of the proposed method, it was compared with the studies by Fu et al. [15] and Wang et al. [17]. Select 120 measuring devices to be analyzed and divide them into six groups. Use four methods to perform traceability analysis on the six groups of devices. The accuracy of the actual status and judgment results calculated is shown in Figure 9.

Traceability analysis results of different methods.
From Figure 9, it can be seen that the proposed method has the highest overall traceability analysis accuracy, and the data in each group has little fluctuation and good stability. The Byzantine fault-tolerant algorithm for the alliance chain proposed by Fu et al. [15] has certain requirements for system settings, resulting in poor analysis performance, low accuracy, and significant fluctuations. Both Wang et al. [17] and Li et al. [18] involve reasonable traceability strategies, ensuring the reliability of traceability results with an accuracy rate of approximately 80%. However, compared to the proposed method, its analysis results are unstable, and accuracy still needs to be improved.
Based on the above analysis, the analysis accuracy and traceability time of different traceability methods are shown in Table 5.
Result indicator values for different traceability
| Method | Accuracy (%) | Time (s) |
|---|---|---|
| Ref. [15] | 64.13 | 2.196 |
| Ref. [17] | 75.95 | 4.207 |
| Ref. [18] | 82.67 | 2.571 |
| Proposed method | 88.72 | 3.949 |
From Table 5, it can be seen that the accuracy and time consumption of the proposed method’s traceability results are 88.72% and 3.949 s, respectively. Compared with other methods, the traceability accuracy has a significant advantage. This is because it combines SDAE and GBRBM-DBN models, ensures the accuracy of the measurement device’s detection of data anomalies through the GBRBM-DBN model, and extracts high-precision features in combination with SDAE to ensure the reliability of the traceability results at multiple levels. However, this method combines two deep learning algorithms, which take a long learning time and therefore increase the time consumption compared to some methods. Fu et al. [15] use the Byzantine fault-tolerant algorithm based on the alliance chain for traceability, which is simple and easy to implement. Therefore, the traceability time is short, only 2.196 s, but the accuracy is less than 70%. Wang et al. [17] determined the defect cause tag through text similarity calculation, extracted defect features using L1 regularization and XGBoost integration methods, and determined the fault source based on D-S evidence theory. Although this method improves the traceability accuracy compared to Fu et al. [15], the lack of defect identification methods directly affects the traceability effect, reducing the accuracy by 12.77% compared to the proposed method. Li et al. [18] proposed the LSTM-based quality early warning method and the quality data backtracking query optimization algorithm and identified defects through the LSTM model. However, compared with the SDAE model of the proposed method, the query optimization algorithm has poor learning performance, so the traceability accuracy is reduced by 6.05%. Due to the short time consumption of the query optimization algorithm, the traceability time of this method is reduced to 2.571 s.
7 Conclusion
The construction of an intelligent measurement laboratory is crucial for the high-quality development of the power grid. In order to improve the laboratory’s testing capabilities, a measurement laboratory testing data traceability and analysis method based on intelligent IoT and DBNs has been proposed. Under the system architecture of the Intelligent IoT, the edge side utilizes an improved DBN model to learn and analyze the ledger data sample library and completes the identification of abnormal measurement device data. Deploy SDAE in the cloud center to extract historical electricity consumption curve features and build a sample library, and send abnormal measurement devices to the sample library for traceability analysis to clarify the cause of the abnormality. Based on the selected dataset, experimental verification was conducted on the proposed method, and the results showed that
The GBRBM–DBN model can quickly analyze abnormal data and has the best learning performance, with accuracy, FPR, and recall rate reaching 95.51, 4.49, and 93.08%, respectively.
The combination of SDAE and GBRBM–DBN models can quickly and accurately trace the source of abnormal electricity meters. The accuracy and time consumption of the tracing results are 88.72% and 3.949 s, respectively. Moreover, the stability of the tracing analysis is good, and the overall effect is better than other comparative methods.
At present, the application of blockchain technology in the field of traceability analysis is increasing. By saving traceability information in the blockchain ledger, traceability information can be quickly traced and not tampered with. In the following research, the focus will be on combining blockchain technology for traceability analysis and improving this technology to improve traceability accuracy while ensuring data security.
-
Funding information: This work was supported by the State Grid Sichuan Electric Power Corporation (52199722000 A), “Research on digital confirmation method technology of standard equipment traceability result.”
-
Author contributions: PeiDong He performed the data analysis; Li Xiao and Yang fan Zhang performed the formal analysis; WenQi Shen and ShuYu Deng performed the validation; XiaoJun Li wrote the manuscript.
-
Conflict of interest: The authors declare no conflicts of interest.
-
Data availability statement: The original data can be obtained by contacting the author.
References
[1] Zhang T, Zhang Y, Zhang G, Xue L, Wang J. De privacy encryption and extraction model of smart grid data based on spark streaming. J Intell Fuzzy Syst. 2022;[cited 2024 Jul. 31] 43(5):6821–30. 10.3233/JIFS-221185.Search in Google Scholar
[2] Saeed MA, Eladl AA, Alhasnawi BN, Motahhir S, Nayyar A, Shah MA, et al. Energy management system in smart buildings based coalition game theory with fog platform and smart meter infrastructure. Sci Rep. 2023;13(1):2023–3, [cited 20 24 Jul. 31]. https://www.nature.com/articles/s41598-023-29209-4.10.1038/s41598-023-29209-4Search in Google Scholar PubMed PubMed Central
[3] Dewangan F, Abdelaziz AY, Biswal M. Load forecasting models in smart grid using smart meter information: a review. Energies. 2023;16(3):1404. 10.3390/en16031404, [cited 2024 Jul. 31].Search in Google Scholar
[4] Dong Z, Wang H, Dong Y. Research on energy consumption quota of metrology laboratory. MATEC Wed Conferneces. vol. 356, 2022. p. 1. [cited 20 24 Jul. 31]. 10.1051/matecconf/202235601005 Search in Google Scholar
[5] Sardjono RH. Simplification of null method measurement system to build a standalone DC voltage standard traceability system in the SNSU – BSN electrical metrology laboratory. J Phys: Conf Ser. 2021;1816(1):012011–23. 10.1088/1742-6596/1816/1/012011, [cited 20 24 Jul. 31].Search in Google Scholar
[6] Amin F, Asghar I, Hwang SO. Recent advances in internet of things and emerging social internet of things: vision, challenges and trends. Electronics. 2022;11(13):2033. 10.3390/electronics11132033, [cited 20 24 Jul. 31].Search in Google Scholar
[7] Zakharov A, Shenkman R, Ofrikhter I, Ponomaryov A. Estimation of soil properties by an artificial neural network. Mag Civ Eng. 2022;110:11011, [cited 20 24 Jul. 31]. https://engstroy.spbstu.ru/en/article/2022.110.11.Search in Google Scholar
[8] Xue S, Zhang L, Zhu Z. Design of semi-tensor product-based kernel function for SVM nonlinear classification. Control Theory Technol. 2022;20(4):456–64. 10.1007/s11768-022-00120-z, [cited 20 24 Jul. 31].Search in Google Scholar
[9] Cioca M, Schuszter IC. A system for sustainable usage of computing resources leveraging deep learning predictions. Appl Sci. 2022;12(17):8411. 10.3390/app12178411, [cited 20 24 Jul. 31].Search in Google Scholar
[10] Wu Q, Qiao J, Wang J. Data anomaly detection based on improved kernel density estimation. J Phys: Conf Ser. 2022;2290(1):1. 10.1088/1742-6596/2290/1/012111, [cited 20 24 Jul. 31].Search in Google Scholar
[11] Dai Y, Sun S, Che L. Improved DBSCAN-based data anomaly detection approach for battery energy storage stations. J Phys: Conf Ser. 2022;2351(1):1. 10.1088/1742-6596/2351/1/012025, [cited 20 24 Jul. 31].Search in Google Scholar
[12] Xu J, Dang D, Ma Q, Liu X, Han Q. A novel and robust data anomaly detection framework using LAL-AdaBoost for structural health monitoring. J Civ Struct Health Monit. 2022;12:1–17. 10.1007/s13349-021-00544-2, [cited 20 24 Jul. 31]; Issue prepublish.Search in Google Scholar
[13] Mao J, Wang H, Spencer BF. Toward data anomaly detection for automated structural health monitoring: Exploiting generative adversarial nets and autoencoders. Struct Health Monit. 2020;20(4):147592172092460. 10.1177/1475921720924601, [cited 20 24 Jul. 31].Search in Google Scholar
[14] Caiyun L, Liu C, Chen X, et al. A novel data traceability model based on blockchain and digital watermarking in edge computing. J Phys: Conf Ser. 2020;1682(1):012041–52. 10.1088/1742-6596/1682/1/012041, [cited 20 24 Jul. 31].Search in Google Scholar
[15] Fu W, Shi H, Huang J, et al. Spatial image data traceability and interaction mechanism based on alliance chain. ICSESS. 2019. 10.1109/ICSESS47205.2019.9040778, [cited 2024 Jul. 31].Search in Google Scholar
[16] Li J, Zhai H, Zhang L, Luo A, Zhang C, Yang X. A fault tracing method of successive commutation failure for multi-infeed DC system. APPEEC. 2020;1–5. 10.1109/APPEEC48164.2020.9220679. Search in Google Scholar
[17] Wang Z, Wang J, Chen S. Fault location of strip steel surface quality defects on hot-rolling production line based on information fusion of historical cases and process data. IEEE Access. 2020;8:171240–51. 10.1109/ACCESS.2020.3024582, [cited 20 24 Jul. 31].Search in Google Scholar
[18] Li J, Yin W, Yang B, et al. Research on welding quality traceability model of offshore platform block construction process. Comput Model Eng Sci. 2023;2023:1. 10.32604/cmes.2022.020811, [cited 20 24 Jul. 31].Search in Google Scholar
[19] Deng L, Li D, Cai Z, Hong L. Retraction Note: Smart IoT information transmission and security optimization model based on chaotic neural computing. Neural Comput Appl. 2022;35(5):4197. 10.1007/s00521-019-04162-4, [cited 20 24 Jul. 31].Search in Google Scholar
[20] Alimisis V, Gennis G, Dimas C, Gourdouparis M, Sotiriadis PP. An ultra low power analog integrated radial basis function classifier for smart IoT systems. Analog Integr Circuits Signal Process. 2022;112(2):225–36. 10.1007/s10470-022-02038-7, [cited 20 24 Jul. 31].Search in Google Scholar
[21] Shen H, Zhou W, Li X. A fast globally optimal seamline detection method for high-resolution remote sensing image. IEEE Geosci Remote Sens Lett. 2023;20:1. 10.1109/LGRS.2023.3250519, [cited 20 24 Jul. 31].Search in Google Scholar
[22] Li J, Xu F, Gao N, Zhu Y, Hao Y, Qiao C. Sparse non-convex regularization based explainable DBN in the analysis of brain abnormalities in schizophrenia. Comput Biol Med. 2023;155:106664. 10.1016/j.compbiomed.2023.106664, [cited 20 24 Jul. 31].Search in Google Scholar PubMed
[23] Li J, Li X, He D, Qu Y. A novel method for early gear pitting fault diagnosis using stacked SAE and GBRBM. Sensors. 2019;19(4):758–8. 10.3390/s19040758, [cited 20 24 Jul. 31].Search in Google Scholar PubMed PubMed Central
[24] Priya S, Ponmagal RS. Network intrusion detection system based security system for cloud services using novel recurrent neural network - autoencoder (NRNN-AE) and genetic. Adv Sci Technol. 2023;6630:729–37. 10.4028/p-076960, [cited 20 24 Jul. 31].Search in Google Scholar
[25] Li G, Wang X, Bi D, Hou J. Risk measurement of the financial credit industry driven by data: based on DAE-LSTM deep learning algorithm. J Glob Inf Manag (JGIM). 2022;30(11):1–20. 10.4018/JGIM.308806, [cited 20 24 Jul. 31].Search in Google Scholar
[26] Panahi M, Khosravi K, Golkarian A, Roostaei M, Barzegar R, Omidvar E, et al. A country-wide assessment of Iran’s land subsidence susceptibility using satellite-based InSAR and machine learning. Geocarto Int. 2022;37(26):14065–87. 10.1080/10106049.2022.2086631, [cited 20 24 Jul. 31].Search in Google Scholar
[27] Li Z, Liu X, Guo L, Sui J, Xiao Y. Design and research of automatic error correction algorithm for electric energy metering device. J Phys: Conf Ser. 2022;2409(1):1. 10.1088/1742-6596/2409/1/012023, [cited 20 24 Jul. 31].Search in Google Scholar
[28] Marzvan S, Moravej K, Felegari S, Sharifi A, Askari MS. Risk assessment of alien azolla filiculoides lam in anzali lagoon using remote sensing imagery. J Indian Soc Remote Sens. 2021;49:1801–9. 10.1007/s12524-021-01362-1, [cited 20 24 Jul. 31].Search in Google Scholar
[29] Panahi M, Yariyan P, Rezaie F, Kim SW, Sharifi A, Alesheikh AA, et al. Spatial modeling of radon potential mapping using deep learning algorithms. Geocarto Int. 2022;37:9560–82. 10.1080/10106049.2021.2022011, [cited 20 24 Jul. 31].Search in Google Scholar
[30] Farmonov N, Amankulova K, Szatmári J, Sharifi A. Crop type classification by desis hyperspectral imagery and machine learning algorithms. IEEE J Sel Top Appl Earth Obs Remote Sens. 2023;16:1576–88. 10.1109/JSTARS.2023.3239756, [cited 20 24 Jul. 31].Search in Google Scholar
[31] Li J, Xu Z, Li Z, Zhang Z, Zhang B, Wu Y. An unsupervised CNN-based multichannel interferometric phase denoising method applied to TomoSAR imaging. IEEE J Sel Top Appl Earth Obs Remote Sens. 2023[cited 2024 Jul. 31];16:3784–96. 10.1109/JSTARS.2023.3263964.Search in Google Scholar
© 2024 the author(s), published by De Gruyter
This work is licensed under the Creative Commons Attribution 4.0 International License.
Articles in the same Issue
- Research Articles
- A study on intelligent translation of English sentences by a semantic feature extractor
- Detecting surface defects of heritage buildings based on deep learning
- Combining bag of visual words-based features with CNN in image classification
- Online addiction analysis and identification of students by applying gd-LSTM algorithm to educational behaviour data
- Improving multilayer perceptron neural network using two enhanced moth-flame optimizers to forecast iron ore prices
- Sentiment analysis model for cryptocurrency tweets using different deep learning techniques
- Periodic analysis of scenic spot passenger flow based on combination neural network prediction model
- Analysis of short-term wind speed variation, trends and prediction: A case study of Tamil Nadu, India
- Cloud computing-based framework for heart disease classification using quantum machine learning approach
- Research on teaching quality evaluation of higher vocational architecture majors based on enterprise platform with spherical fuzzy MAGDM
- Detection of sickle cell disease using deep neural networks and explainable artificial intelligence
- Interval-valued T-spherical fuzzy extended power aggregation operators and their application in multi-criteria decision-making
- Characterization of neighborhood operators based on neighborhood relationships
- Real-time pose estimation and motion tracking for motion performance using deep learning models
- QoS prediction using EMD-BiLSTM for II-IoT-secure communication systems
- A novel framework for single-valued neutrosophic MADM and applications to English-blended teaching quality evaluation
- An intelligent error correction model for English grammar with hybrid attention mechanism and RNN algorithm
- Prediction mechanism of depression tendency among college students under computer intelligent systems
- Research on grammatical error correction algorithm in English translation via deep learning
- Microblog sentiment analysis method using BTCBMA model in Spark big data environment
- Application and research of English composition tangent model based on unsupervised semantic space
- 1D-CNN: Classification of normal delivery and cesarean section types using cardiotocography time-series signals
- Real-time segmentation of short videos under VR technology in dynamic scenes
- Application of emotion recognition technology in psychological counseling for college students
- Classical music recommendation algorithm on art market audience expansion under deep learning
- A robust segmentation method combined with classification algorithms for field-based diagnosis of maize plant phytosanitary state
- Integration effect of artificial intelligence and traditional animation creation technology
- Artificial intelligence-driven education evaluation and scoring: Comparative exploration of machine learning algorithms
- Intelligent multiple-attributes decision support for classroom teaching quality evaluation in dance aesthetic education based on the GRA and information entropy
- A study on the application of multidimensional feature fusion attention mechanism based on sight detection and emotion recognition in online teaching
- Blockchain-enabled intelligent toll management system
- A multi-weapon detection using ensembled learning
- Deep and hand-crafted features based on Weierstrass elliptic function for MRI brain tumor classification
- Design of geometric flower pattern for clothing based on deep learning and interactive genetic algorithm
- Mathematical media art protection and paper-cut animation design under blockchain technology
- Deep reinforcement learning enhances artistic creativity: The case study of program art students integrating computer deep learning
- Transition from machine intelligence to knowledge intelligence: A multi-agent simulation approach to technology transfer
- Research on the TF–IDF algorithm combined with semantics for automatic extraction of keywords from network news texts
- Enhanced Jaya optimization for improving multilayer perceptron neural network in urban air quality prediction
- Design of visual symbol-aided system based on wireless network sensor and embedded system
- Construction of a mental health risk model for college students with long and short-term memory networks and early warning indicators
- Personalized resource recommendation method of student online learning platform based on LSTM and collaborative filtering
- Employment management system for universities based on improved decision tree
- English grammar intelligent error correction technology based on the n-gram language model
- Speech recognition and intelligent translation under multimodal human–computer interaction system
- Enhancing data security using Laplacian of Gaussian and Chacha20 encryption algorithm
- Construction of GCNN-based intelligent recommendation model for answering teachers in online learning system
- Neural network big data fusion in remote sensing image processing technology
- Research on the construction and reform path of online and offline mixed English teaching model in the internet era
- Real-time semantic segmentation based on BiSeNetV2 for wild road
- Online English writing teaching method that enhances teacher–student interaction
- Construction of a painting image classification model based on AI stroke feature extraction
- Big data analysis technology in regional economic market planning and enterprise market value prediction
- Location strategy for logistics distribution centers utilizing improved whale optimization algorithm
- Research on agricultural environmental monitoring Internet of Things based on edge computing and deep learning
- The application of curriculum recommendation algorithm in the driving mechanism of industry–teaching integration in colleges and universities under the background of education reform
- Application of online teaching-based classroom behavior capture and analysis system in student management
- Evaluation of online teaching quality in colleges and universities based on digital monitoring technology
- Face detection method based on improved YOLO-v4 network and attention mechanism
- Study on the current situation and influencing factors of corn import trade in China – based on the trade gravity model
- Research on business English grammar detection system based on LSTM model
- Multi-source auxiliary information tourist attraction and route recommendation algorithm based on graph attention network
- Multi-attribute perceptual fuzzy information decision-making technology in investment risk assessment of green finance Projects
- Research on image compression technology based on improved SPIHT compression algorithm for power grid data
- Optimal design of linear and nonlinear PID controllers for speed control of an electric vehicle
- Traditional landscape painting and art image restoration methods based on structural information guidance
- Traceability and analysis method for measurement laboratory testing data based on intelligent Internet of Things and deep belief network
- A speech-based convolutional neural network for human body posture classification
- The role of the O2O blended teaching model in improving the teaching effectiveness of physical education classes
- Genetic algorithm-assisted fuzzy clustering framework to solve resource-constrained project problems
- Behavior recognition algorithm based on a dual-stream residual convolutional neural network
- Ensemble learning and deep learning-based defect detection in power generation plants
- Optimal design of neural network-based fuzzy predictive control model for recommending educational resources in the context of information technology
- An artificial intelligence-enabled consumables tracking system for medical laboratories
- Utilization of deep learning in ideological and political education
- Detection of abnormal tourist behavior in scenic spots based on optimized Gaussian model for background modeling
- RGB-to-hyperspectral conversion for accessible melanoma detection: A CNN-based approach
- Optimization of the road bump and pothole detection technology using convolutional neural network
- Comparative analysis of impact of classification algorithms on security and performance bug reports
- Cross-dataset micro-expression identification based on facial ROIs contribution quantification
- Demystifying multiple sclerosis diagnosis using interpretable and understandable artificial intelligence
- Unifying optimization forces: Harnessing the fine-structure constant in an electromagnetic-gravity optimization framework
- E-commerce big data processing based on an improved RBF model
- Analysis of youth sports physical health data based on cloud computing and gait awareness
- CCLCap-AE-AVSS: Cycle consistency loss based capsule autoencoders for audio–visual speech synthesis
- An efficient node selection algorithm in the context of IoT-based vehicular ad hoc network for emergency service
- Computer aided diagnoses for detecting the severity of Keratoconus
- Improved rapidly exploring random tree using salp swarm algorithm
- Network security framework for Internet of medical things applications: A survey
- Predicting DoS and DDoS attacks in network security scenarios using a hybrid deep learning model
- Enhancing 5G communication in business networks with an innovative secured narrowband IoT framework
- Quokka swarm optimization: A new nature-inspired metaheuristic optimization algorithm
- Digital forensics architecture for real-time automated evidence collection and centralization: Leveraging security lake and modern data architecture
- Image modeling algorithm for environment design based on augmented and virtual reality technologies
- Enhancing IoT device security: CNN-SVM hybrid approach for real-time detection of DoS and DDoS attacks
- High-resolution image processing and entity recognition algorithm based on artificial intelligence
- Review Articles
- Transformative insights: Image-based breast cancer detection and severity assessment through advanced AI techniques
- Network and cybersecurity applications of defense in adversarial attacks: A state-of-the-art using machine learning and deep learning methods
- Applications of integrating artificial intelligence and big data: A comprehensive analysis
- A systematic review of symbiotic organisms search algorithm for data clustering and predictive analysis
- Modelling Bitcoin networks in terms of anonymity and privacy in the metaverse application within Industry 5.0: Comprehensive taxonomy, unsolved issues and suggested solution
- Systematic literature review on intrusion detection systems: Research trends, algorithms, methods, datasets, and limitations