Big data analysis technology in regional economic market planning and enterprise market value prediction
-
Xin Lin


Abstract
Market planning for regional economic development is a crucial task connected to stability and systematicness and influences the unique outcomes of regional economic growth. As a result, market planning for regional economic development must be given more weight. There are several issues with regional economies currently developing in many parts of our country. Lack of focus on market planning for regional economic growth results in several flaws in market planning, making it challenging to support sustainable development. The accurate analysis of diverse massive economic datasets has significant research value. The aim of this study is to provide an overview of market planning and regional economic and industrial development, analyze the effects of market planning on regional economic and industrial development, identify issues with market planning and regional economic and industrial development, and suggest solutions. This article employs big data analysis technology to forecast corporate market value and develop regional economic markets. The system is employed to conduct experimental big data analysis within a specific field for an extended period. According to test analysis results, the system’s data analysis accuracy can reach up to 95.8%, which has a promising future for use.
1 Introduction
Planning the long-term, significant, and essential aspects of regional economic and social development from a strategic height is referred to as regional economic development market planning. Simply put, to enhance the scientific nature of regional economic development over an extended period, based on the evaluation of regional economic and social development, and to examine the objectives and guiding ideology. The comprehensive process of making decisions and planning essential countermeasures, including their stages and key components.
Planning for the regional economy should adhere to specific guidelines. Think about the overarching principle first. Since improving the scientific nature and efficacy of regional economic development is the primary goal of regional economic market planning, we must consider all relevant factors and concentrate on the broader context. Only in doing so will we be able to unite all facets of development, encourage collaboration between development strategies and plans, and more effectively accomplish strategic objectives. Second, emphasize the advantage principle. The relatively big size of my country means that different regions have various topographical and climatic features, natural resources, environmental circumstances, cultural customs, etc. As a result, while creating regional economic plans and market strategies, regional characteristics must be considered appropriately to maximize benefits. The third is the benefit principle. Regional economic development market planning aims to maximize benefits while minimizing costs. Regional economic development should be planned and distributed equitably to achieve this goal. In order to ensure that the regional economy engages in sustainable development for a considerable amount of time, we must make effective use of the benefit principle when developing market planning and insist on the unity of ecological and social benefits. Decision-making emphasizes a process-oriented, co-evolutionary approach. Criteria include efficiency, often derived from potential Pareto improvements. Considerations extend to environmental and social systems’ equity, stability, and resilience. The production process theory guides the allocation of fixed resources.
Even though different parts of our nation have been giving regional economic development market planning more and more thought and taking numerous steps to advance the science of market planning, issues nevertheless inevitably arise. As a result, we can provide focused solutions and offer sound advice for the continued growth of the local economy [1]. However, at the moment, many regions in our nation cannot consider the actual circumstances of regional economic development while establishing market plans for regional economic development. Due to analysis and other factors, the market planning does not adequately account for the area context. Creating regional economic market planning is a methodical process that requires attention to numerous details. Several regions in my country are developing market strategies at the moment. A marketing plan serves as a roadmap for gaining new clients, fostering more robust bonds with existing ones, boosting sales, enhancing client retention, and raising brand awareness. It has not always been precise and thorough, and market planning science has to be improved.
Internet has emerged as the fastest-growing, most inventive, and fiercely competitive industry in human civilization due to the advancement and reform of communication technology. In 1994, China made a connection to the internet. As a result of industrial strategies like the “Internet + Action Plan” and the transformation of my country’s economic structure, internet has grown swiftly and permeated every part of daily life [2].
My nation successively built the Growth Enterprise Market and the Science and Technology Innovation Market to encourage the growth of high-tech businesses. These markets offer more extensive funding options for high-tech startups, and the businesses have proliferated. Many businesses have imitated the early enterprises, which raised enormous capital by going public. Corporate capital operations are shared in order to grow bigger and stronger. The A-share market in my country had 296 internet-listed companies as of the end of 2019, with a market value of about 3385.6 billion yuan [3]. In the 5 years from 2015 to 2019, as seen in Figure 1, there were 3,006 mergers and acquisitions in the internet software and service sector, totaling 1274.5 billion yuan [4]. However, due to incidents like Baidu’s high-priced acquisition of 91 Wireless, blind mergers and acquisitions are becoming increasingly common, detrimental to the growth of the internet industry, investor interests, and even the orderly development of the capital market. Therefore, it is crucial to understand how to fairly and effectively assess an enterprise’s value.
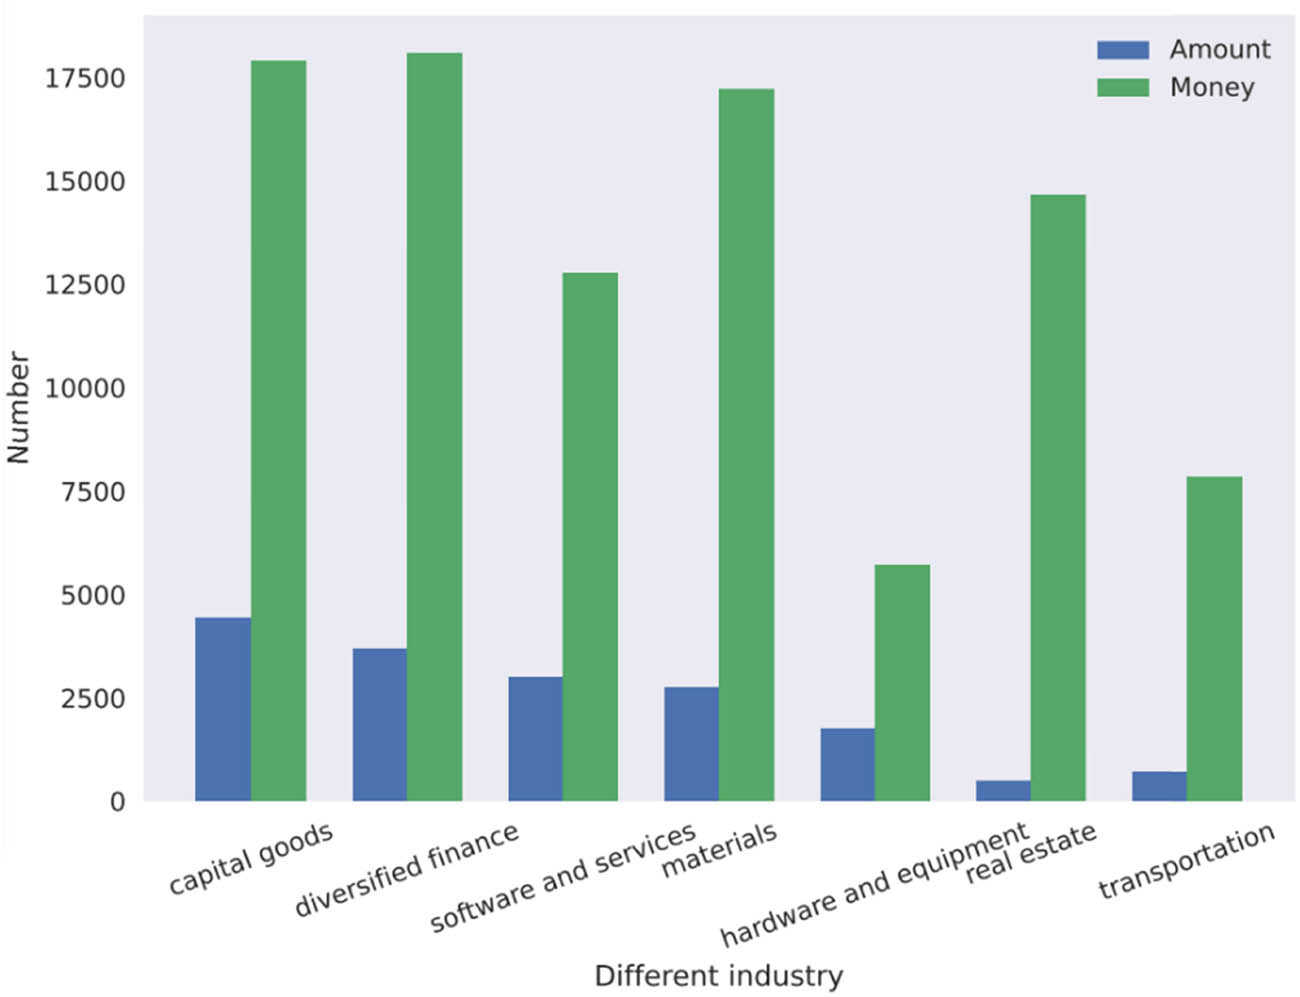
Statistics by industry of the number and amount of mergers and acquisitions from 2015 to 2019.
Even though the company is still in the early stages of development, substantial R&D spending is one of its distinguishing features, which increases its prospective value. There are numerous options for development methods when operating startup businesses. Managers decide to expand investment when a project has potential for development in order to boost corporate income; when investment encounters severe competition or risks, managers can decide to cut or give up. Investment is a versatile and adaptable management tactic.
Currently, three classic evaluation methods and other methodologies can be used to determine the market worth of domestic and international businesses. However, the conventional evaluation methods have certain drawbacks since locating comparable businesses is challenging, and future business development is highly unknown. In navigating unpredictable conditions influenced by dynamic external factors, market volatility, and technological progress, relying solely on historical data and linear projections is unreliable. To enhance decision-making resilience, adopting a flexible, scenario-based approach that considers unforeseen variables is crucial. The economic value-added approach and the natural option method are further evaluation techniques. The latter simply takes into account financial indicators and does not take into account non-financial aspects like the corporate management model.
In contrast, the former necessitates several subjective reclassification adjustments to report items. The key financial metrics for assessing a company’s profitability are net profit and return on assets. The primary performance indicators include profitability, leverage, valuation, liquidity, and efficiency KPIs. Additionally, a metric for measuring customer acquisition cost is essential. In recent years, the natural option approach has become a prominent option for determining the market value of businesses. It analyses the present option characteristics of the firm to determine the possible option value; however, it is simple to overlook the current asset value.
2 Related works
2.1 Development status abroad
Along with the growth of regional economic market planning, the regional economic market planning approach also evolves continuously. Planning for foreign regional economic markets has a lengthy history [5]. The lengthy study procedure has consistently improved and enhanced the planning method, which is currently quite sophisticated.
The design of the Custer coal mine in England from 1922 to 1923 and the urban regional planning of New York in the United States in 1929 are two examples of how foreign regional economic market planning is based on urban planning and industrial and mining location planning [6]. The planning scope, however, is modest and straightforward for this time frame. Most regional economic market planning techniques until the 1940s were relatively straightforward, primarily utilizing industrial location and geography methods [7]. The importance of cities’ function and position in the local economy grew by the 1940s due to the growth of capitalism, increased industrialization, and urbanization. The planning process meets numerous challenges [8]. Greater London Regional Plan was first created by the United Kingdom in 1944, after which industrialized nations, the former Soviet Union, and Eastern European nations generally implemented a large-scale regional economic market plan [9]. The input-output method and linear programming have become quite popular, and the regional economic market planning method has advanced rapidly. The input-output method application offers a potent tool for interregional trade and research of regional industrial structure; linear programming offers convenience for resource allocation and sensible use.
Regional economic market planning has advanced to a new level since the 1960s, with the study of people, society, environment, and resources caused by capitalist industrialization and urbanization [10]. A simple economy gives way to a complete planning of five factors in the regional economy: the economy, people, society, environment, and resources. During this time, the regional economic market planning approach has advanced to a new stage of development to respond to the complexity of regional economic comprehensive planning. Regional economic market planning techniques have gradually evolved in the West away from conventional techniques like qualitative description, zoning, and analysis and toward techniques like systems engineering, grey control system, AHP method, system dynamics model, and multi-objective decision planning [11]. Another significant turning point in the innovation of planning methods and tools occurred around 1990 when several regions began using decision support system technology in their regional economic market planning efforts [12]. With these new technologies, planners and decision-makers can more effectively address various planning-related issues, increase job productivity, lessen the subjective influence of human variables, and focus on planning’s quantitative issues [13]. Regional economic market planning is now a multi-disciplinary, all-encompassing process rather than a straightforward approach, including a few disciplines. For instance, countries use computers as the primary tool for regional planning and fully utilize remote sensing, geographic information systems (GIS), global positioning system, and other high-tech and mathematical modeling technologies.
On the one hand, this makes it convenient for the public to quickly and easily participate in planning and understand the planning results, but on the other hand, it alters the planning process. In the past, the planning process was primarily based on qualitative research, and the area was the subject of quantitative study. Fuzzy science techniques for uncertain factor analysis and mathematical models and model systems are frequently employed in mathematical applications. Western regional economic market planning techniques are progressing towards an all-encompassing model of quantification and modeling.
2.2 Domestic development status
The application research for the regional economy planning approach is still in its infancy in my country. My nation once used regional planning based on joint processing plants from 1953 to 1957 to assist with developing new industrial zones and cities. Only straightforward geographic, mathematical, and locational techniques were applied [14]. The central government decided to develop land planning as we entered the 1980s. Most provinces, cities, and districts have planned land in succession and obtained specific results [15]. Input-output tables were first collected by Shanxi Province in 1982. Subsequently, many other provinces, municipalities, and districts followed Shanxi’s lead. Since then, Xinjiang has created strategies for its social and economic development [16]. In order to create development market plans in the Simo area of Yunnan and Jining County of Kunming City, Sun et al. [17] established a complete set of basic index model systems and a dynamic rolling model system of induced indexes in 1990. As a result, the designated strategic goals and plans have a comparatively high level of performance, high adaptability, and precision. In 1997, Wang et al. [18] proposed a Pareto optimum algorithm for identifying answers by fusing the positive eigenvector approach with network technology, providing a regional economic network model. The theory, guiding principles, scope, and regional economic market planning techniques were studied and elaborated upon by Lin et al. [19] in 2020. They talked about the concepts, modeling procedures, and principles of applying multi-objective optimization techniques to challenges in regional economic market planning and incorporated some of their ideas into examples of specific applications that were examined. In 2020, Hung et al. [20] reviewed the use of GIS in county urban system planning and discussed how it might be used in regional planning research to manage data, analyze data, support decision-making, and articulate planning conclusions. In the study by You and Wu [21], it is suggested that the use of remote sensing and GIS technology be made more common in regional planning in the new era, resulting in the digitization of the entire regional planning process, from field research, data collection, processing, and computational simulation to planning and mapping, implementation, and supervision. In 2007, Radwan et al. [22] developed a comprehensive index evaluation method appropriate for the western region using fuzzy comprehensive evaluation for the region’s planning. The same year, regional economic market planning used a hybrid analytical hierarchy process and grey relational decision-making.
3 Methods
To some extent, the local economy reflects the standard of living of the populace. A critical measure of the standard of living that reflects the financial health of the neighborhood is the local economy. It includes things like work prospects, income levels, and general economic activity, all of which greatly influence the standard of living for locals. Electronic maps, transportation data, census data, and other sources are all combined in a multidimensional analysis based on massive data, standard selection, and feature modeling. Electronic maps enhance the representation of economic data, facilitating the recognition of patterns and distinctions in regional economic activities. Integrated visuals simplify intricate data, assisting decision-makers in comprehending regional trends. It can act as the foundation for regional economic decision-making. A specific approach framework is shown in Figure 2. The process consists of data cleaning, particular time and place selection in the determination criteria, accurate space-time range narrowing, and space-time correlation and analysis. The data analysis comprises five essential stages: defining business queries, gathering and storing data, cleaning and preparing data, conducting analysis, and visualizing findings. It aims to reveal patterns, explore temporal trends, and evaluate relationships among spatial and temporal variables to derive actionable insights. Analyzing the socioeconomic life, economic development, and geographical characteristics of the population can be done with accurate data support from the visualization of results, graphical representation and analysis of data, and evaluation of data using econometric models. Visualizations enhance comprehension of data trends, patterns, and relationships, making complex economic information more accessible. Line charts, bar graphs, and scatter plots are standard tools that effectively convey insights to policymakers, researchers, and the public. This section establishes a specific space-time region to create a framework for regional economic research using the night market as an example.

Framework of regional economic analysis method of big data.
3.1 Analysis of regional economic market planning
The recursive convolutional neural network (RCNN) model is chosen in this study to analyze the direction of market planning in regional economic time series (RETS-RCNN). It is introduced as economic news articles and technical indicators.
As shown in Figure 3,
where

TS-RNN.
To introduce nonlinearity into the model, the rectifier linear unit is used as the activation function,
Since this layer involves many parameters, the model is prone to overfitting, so a Dropout regularization technique with probability p = 0.5 is used.
3.2 Setting and estimation of a regional econometric model
The spatial dependency of economic growth between regions must serve as the foundation for measuring diffusion backflow and market area effect between regions. Spatial economics studies commonly utilize binary matrices consisting of zeros and ones to examine spatial effects. A weight matrix is employed to gauge the spatial interdependence or connectivity among countries, indicating proximity and influencing the extent of spatial spillovers between them. To evaluate whether there is spatial correlation across regions and to establish the properties of spatial correlation, we first build a spatial econometric model. At the same time, we thoroughly chose the model using the fixed-effect LR test. The spatial lag model is used in this study for the test results, to examine the geographic relationship between the economics of a province and a county. The comparison model used in this study is
where
Through the spatial weight matrix, the spatial correlation between areas primarily affects each region. Unique patterns, clusters, and the influence of adjacent regions can be identified by breaking down spatial relationships into discrete elements. This method improves understanding of how spatial factors lead to differences between various places. As a result, the spatial weight matrix is primarily decomposed for the spatial decomposition. Because a given province’s regional economic development has created a center-secondary-periphery, the interaction of the same level area, the diffusion and return of the central area to the secondary area, the diffusion and return of the central area to the peripheral area, the diffusion and return of the secondary area to the peripheral area, and the secondary area are the primary divisions of the spatial effect between the center and the periphery. Encouraging regional development can foster economic growth in surrounding areas. However, it may also result in a return of economic activities to the central area, impacting the overall regional economic landscape. The dynamic interplay between diffusion and return shapes regional economic development. Primary and peripheral regions on central regions and peripheral regions on secondary regions are the effects of market area. Therefore, this study divides three different levels of regions into L, M, and S, and the economic output of the corresponding region is
Then, the total effect of spatial spillover between regions of different levels can be expressed as
At the same time, the dummy variables representing the three types of areas affected by the spillover effect are multiplied by the above formula to determine the measure of the source and receiver of the spillover effect. If the L-type region is the receptor, it should be
Including dummy variables in the model makes it easier to identify and quantify spillover effects and distinguish various groups or areas. This method improves the assessment of the interactions between adjacent units and considers the data’s heterogeneity, which makes the SAR framework better.
Therefore,
3.3 Enterprise market value forecast
According to the above study, an enterprise’s market value comprises its current and potential value. Enterprise value represents a company’s overall value, similar to a balance sheet, while market value reflects its stock value. Both are used in business valuation, with enterprise value indicating current worth and market value showing both current and potential future value. As a result, this essay will also assess the two components of value independently. The potential value V2 is evaluated using actual options, whereas the current value V1 is evaluated using the conventional income technique. The assessment approach is displayed in Figure 4.
Building a discounted cash flow model investment in project R&D, acquisition, reorganization, and scale-up activities, as well as a fast increase in operating income. The company’s growth potential will stabilize at a mostly fixed level, and at this point, the company will enter a stable period due to the internet industry’s “first dominance” and the Matthew effect.
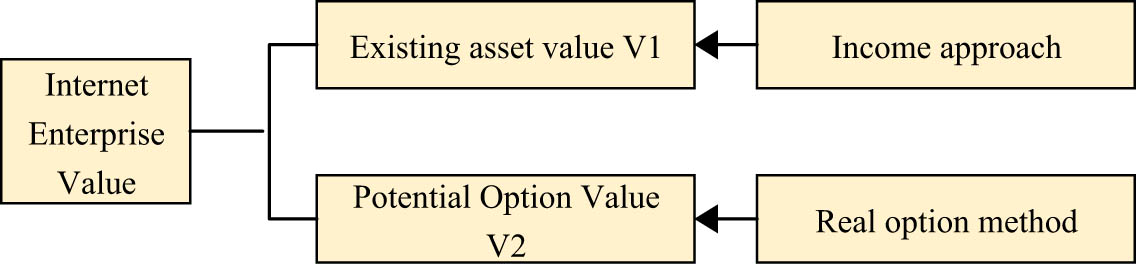
Composition of the basic model for enterprise market value assessment.
The binary tree model is based on a discrete process, and it uses dynamic programming to handle the interaction between options, underlying assets, and decision-making. The binary tree model, a discrete option valuation method, breaks time into intervals to simulate asset price changes. Unlike continuous models such as Black–Scholes, it is adept at handling complexities like American-style options and variable volatility. Its flexibility suits various option types and market conditions. This method more accurately simulates the calculation of option value. Although the binary tree model simplifies the B-S pricing model, it is more appropriate for evaluating and pricing particular investment projects since its calculation involves a substantial number of information sets, such as the projected value of options at each time node. It supports discrete time intervals and adapts well to diverse asset price changes, making it ideal for intricate investment projects like American-style options or those with irregular cash flows. This flexibility enables accurate valuation by considering various scenarios at each step. Although the B-S model’s derivation procedure is rather complex, acquiring its fundamental parameters does not necessitate a significant amount of data collecting and processing,
where
In calculating an enterprise’s potential value, the most crucial step is to determine the value of each parameter, such as
Since it has been established that the big data analysis portfolio evaluation model is used to assess the market value of businesses, the fundamental model needs to be upgraded. As a result, the improved grey prediction approach forms the foundation for further model optimization. This method is appropriate for predicting “poor information, few samples” systems because it can distinguish differences in the development trends of different system components through correlation analysis, system law mining, and the establishment of differential equations. On the one hand, the macro environment that businesses operate in is unstable, and the future revenue of businesses has a high level of uncertainty. On the other hand, the grey forecasting approach may use known data to anticipate the future revenue of businesses with a high level of uncertainty. We enhance prediction accuracy by integrating sophisticated algorithms, utilizing historical data with a focus on recent trends, and adjusting dynamically to evolving conditions.
On the other hand, most businesses are still in the startup or development phase, and there is a need for more publicly available data, making it challenging to use techniques like time series forecasting. However, the grey forecasting method has fewer requirements for historical data, which can help businesses overcome their lack of historical data; prepare for the future by analyzing market trends, customer preferences, and competitor actions; seek advice from industry experts, stay updated on emerging trends, and gather customer feedback; and monitor competitors for strategic insights, address risks, and use internal data for performance evaluation and predictive modeling.
In terms of volatility forecasting, this study uses forecasted volatility to replace actual volatility, and the grey forecasting method also applies to forecasting corporate volatility.
The following takes the GM(1,1) model to predict the operating income as an example to illustrate the steps of using the model.
3.3.1 Original data inspection
Before using the model, it is necessary to test whether the original data suit the model, so the level test is carried out. If the calculation result is within the range of
The operating income of a technology company from 2008 to 2018 is the original sequence data used to anticipate the operating income data. The established original sequence is given in Table 1,
Operating revenue of Company A from 2008 to 2018
| Particular year | Operating income (10,000 yuan) |
|---|---|
| 2008 | 3535.55 |
| 2009 | 8372.08 |
| 2010 | 14080.25 |
| 2011 | 17269.10 |
| 2012 | 27380.32 |
| 2013 | 34692.68 |
| 2014 | 64902.99 |
| 2015 | 102214.74 |
| 2016 | 170173.42 |
| 2019 | 181580.94 |
| 2018 | 198486.27 |
3.4 Model accuracy evaluation
The residual error test calculates the relative and absolute errors and observes whether the error changes are stable by calculating the residual error.
The correlation degree test is calculated, and the test is passed when the value is more significant than 0.5. The metric assesses the model’s ability to capture data patterns, with a strong correlation indicating accurate predictions. This efficient test reliably evaluates the model’s performance by quantifying the strength and direction of the relationship.
Then, calculate the small error probability as
According to the above research, the conventional GM(1,1) model can forecast businesses’ cash flow and volatility, but it also has several drawbacks. The model, for instance, works well with data series that exhibits traits of mild volatility and exponential change. However, as indicated in Table 2, most businesses are in the startup or growth stages, with multiple development and investment stages.
Evaluation classification of prediction results
| P | C | Accuracy class | |
|---|---|---|---|
| More than 0.96 | Less than 0.36 | Level 1 | Good |
| More than 0.9 | Less than 0.6 | Level 2 | Qualified |
| More than 0.8 | Less than 0.66 | Level 3 | Barely qualified |
| Up to 0.8 | 0.66 or more | Level 4 | Unqualified |
This study will correct the nonlinear residual generated by the original model. Polynomial regression analysis is a critical regression analysis method. Since polynomials can approximate any function, it can solve related problems in nonlinear regression. When revising the GM(1,1) model, polynomial regression can be introduced to perform polynomial regression on the residual between the predicted sequence
The revised GM(1,1) model can increase forecasting accuracy by rewriting the nonlinear residual and is more suited for enterprise data forecasting. The grey forecasting theory can handle the forecasting problem of the system with uncertainty. Its ability to thrive with limited data, adeptness in handling uncertainty, and incorporation of historical and expert insights make it well-suited for unpredictable economic environments. Its flexibility and efficacy in addressing uncertain aspects make it a valuable tool for predicting revenue in turbulent business conditions. The enterprise fluctuation is comparatively severe, and the new model can partially correct the prediction inaccuracy brought on by this nonlinear fluctuation through adaptive simulation. The enhanced grey forecasting model has significant implications for business valuation when taken as a whole. Figure 5 below illustrates how the enterprise market value evaluation model was improved. The market value of an enterprise is determined using methods like discounted cash flow analysis, comparable company analysis, and precedent transactions. Factors influencing market value include revenue and profit growth, market share, competitive position, industry trends, management quality, and economic conditions.

Improvement roadmap for the basic model of enterprise market value evaluation.
4 Experiments
The analysis of regional economic growth and the formation of spatial patterns have changed in recent years from qualitative regional analysis to quantitative analysis. Objective data-driven analyses enhance the efficiency of economic studies, replacing subjective interpretations with quantifiable insights. This shift results in more robust analyses, enabling researchers and policymakers to make well-informed decisions. The expression of economic and geographical elements is more intricate and logical due to the ongoing refinement of regions, provinces, prefecture-level cities, and counties and the constant refinement of spatial units. Advancements in spatial unit refinement have elevated the precision of economic and geographical analysis. Enhanced data granularity enables a more detailed comprehension of relationships, patterns, and trends, facilitating informed decision-making in both economic and geographical realms. Along with market areas, diffusion returns, and the regional economic structure are centered on the center. The spatial mutual spillover link between the core metropolitan and periphery areas and the spatial correlation between the peripheral and central areas serve as crucial performance mechanisms for the effect. The center between the regions can be more clearly displayed from the standpoint of geographical units; more precisely, the regional spatial scale is divided. Marginal connections, economic growth hinges on spatial interdependencies, with positive connections fostering regional clusters and negative links leading to concentrated decline. To ensure balanced growth, prioritize policies that enhance regional connectivity, invest in infrastructure, and implement targeted interventions across geographical areas. Therefore, this study further refines each region of X Province from a geographical point of view and divides it into administrative districts, county-level cities and districts, and counties of urban municipal districts based on the spatial scale division of the existing literature and the actual economic situation of X Province. It may clearly indicate how the various regions of X Province are faring economically.
4.1 Data sources
Logarithmic standardization is applied to the data in this research, taken from the statistical yearbooks of prefecture-level cities in X Province from 2001 to 2019. This section analyses data from 2001 to 2019 as a whole.
4.2 Measurement of regional development difference indicators
Theil entropy, which measures the degree of regional development imbalance and distributes the share of regional imbalance across and within groups, can also be used to scale the Theil index. Based on the assumption that the entire economy, represented by individuals, will be divided into groups, the loss index used to measure regional imbalances is calculated.
By decomposing the Theil index, it can be divided into inter-group gap and intra-group gap.
The Gini coefficient (G) is an indicator used to measure and judge regional income or wealth distribution inequality. It is constructed according to the Lorenz curve, and the international warning value of the Gini coefficient is 0.4.
By studying the Theil index decomposition and the calculation of the Gini coefficient, this study finds that the current regional economic pattern in X Province presents some new phenomena as follows.
In X Province, the ongoing increase of the regional development disparity has been somewhat curbed. Since 2008, the X region has lagged behind the X region regarding GDP growth rate (Figure 6). We measure the imbalanced trend of economic development in X Province using the widely used Theil index, Gini coefficient, and Atkinson index. The change trend is essentially the same for all three, despite some variances in numerical measurement. Before 2006, the regional economic difference in X Province showed a rising tendency. After 2006, the regional disparity steadily declined and became more petite yearly (Figure 7). However, it cannot be denied that the enormous absolute level disparity between the X Province’s east, west, and north regions and the A region continues to be a significant issue for the province’s economic development. The spatial lag model studies spatial patterns in economic factors, incorporating the impact of neighboring areas through weighted relationships. It assesses how economic conditions in one location affect nearby areas, revealing and quantifying spatial trends and interactions in economic data across provinces and counties.

Comparison of GDP growth rates in the A and X’s east, west, and north.
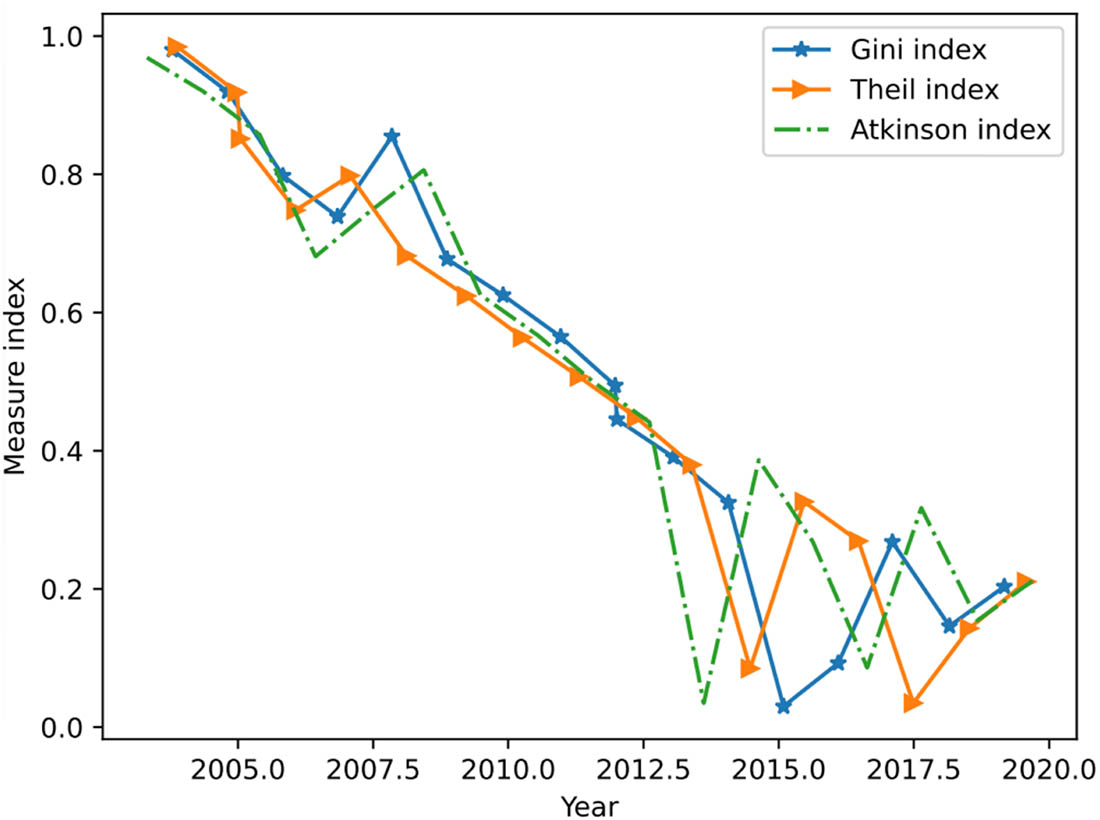
The overall difference measure index of X Province.
There is a clear gap between the central cities of Guangzhou and Shenzhen and other regions, and the internal development of the X region is differentiated.
The gap between the core area of the A and the non-A area is the primary manifestation of the regional gap in X Province. The decrease in disparities across groups primarily reflected the decline in regional differences. While intra-group differences were broadly steady, changes in group differences and the overall index followed the same pattern. Further, we looked at the gap within the group and discovered that the faster the region developed, the bigger the distance within the group was, as shown in Figures 8 and 9. The rate of economic development is relatively rapid. However, because of the increased regional competition, it has also led to differences in economic development rates within the group. The distinctions within groups grew as a result of this. The non-A region has always had a shaky base for economic growth, and there has never been much industrial advancement [19,23]. The per capita GDP distribution is relatively uniform, and the development disparity between X’s east, west, and north sections is insignificant. As X’s internal divisions between its east, west, and north sections strengthen, so do they.

Theil index decomposition of regional differences in X Province.
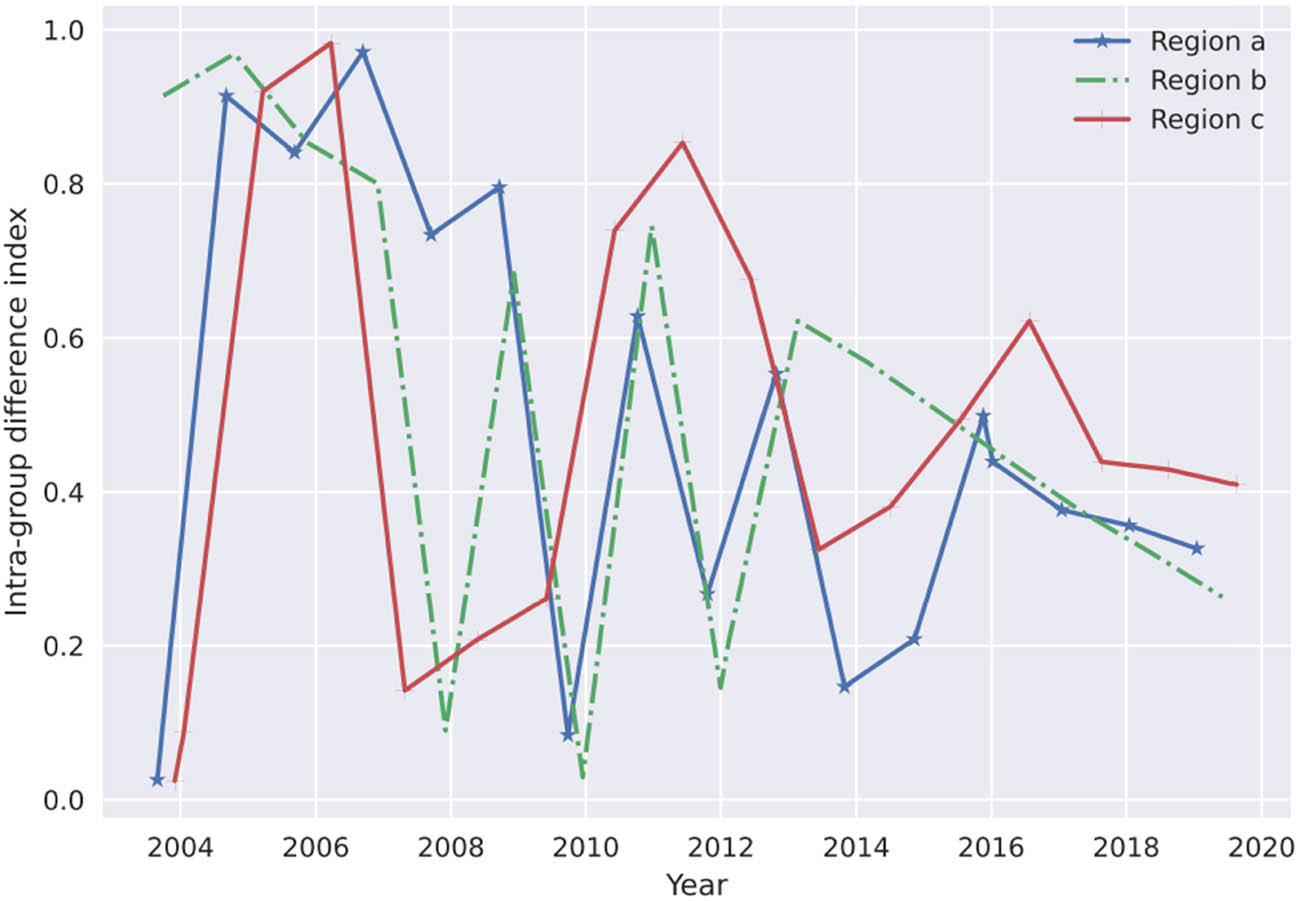
Intra-group difference index by region.
Using internet businesses as an example, those defined narrowly are more indicative of the sector. The essential details regarding specifically categorized internet companies listed in my country. A total of 187 unicorn companies, with a combined market value of 11.2 trillion yuan, were among the 296 domestically listed companies with a market size of more than 3.39 trillion yuan as of the end of December 2019 (excluding the first category of companies). Internet-listed businesses increased from 2008 to 2019, and their market shares also increased.
4.2.1 Test of prediction model
Sun Wang’s operational income data are used to forecast the traditional GM model(1,1) and the enhanced GM model(1,1), respectively, and the horizontal comparison and analysis models are produced. This is done to illustrate better the impact of the improved GM model(1,1) on the prediction accuracy. The data for 2019 using the enterprise income data of X Company from 2008 to 2018 are forecasted as an example, and compared the relative error and prediction error in 2019 as shown in Table 3.
Comparison of prediction accuracy between the original GM 1,1) model and improved GM(1,1) model
| Serial no. | Actual value (10,000 yuan) | GM(1,1) | Improve GM(1,1) | ||||
|---|---|---|---|---|---|---|---|
| Fitted value | Residual | Relative error (%) | Fitted value | Residual | Relative error (%) | ||
| 1 | 3535.55 | 3535.55 | −0.00 | 0.00 | 3646.34 | −110.80 | 3.14 |
| 2 | 8372.08 | 32987.57 | −24615.50 | 294.03 | 5637.44 | 2734.65 | 32.67 |
| 3 | 14080.25 | 40858.36 | −26778.13 | 190.18 | 9960.37 | 4119.89 | 29.27 |
| 4 | 1,726,910 | 50607.14 | −33338.05 | 193.05 | 17160.35 | 108.76 | 0.64 |
| 5 | 27380.32 | 62681.96 | −35301.65 | 128.94 | 28550.60 | −1170.29 | 4.28 |
| 6 | 34692.98 | 77637.82 | −42944.85 | 123.80 | 45769.29 | −11076.32 | 31.94 |
| 7 | 64902.99 | 96162.14 | −31259.16 | 48.17 | 70572.26 | −5669.28 | 8.74 |
| 8 | 102214.74 | 119106.34 | −16891.61 | 16.54 | 104162.47 | −1947.74 | 1.92 |
| 9 | 170173.42 | 147524.98 | 22648.42 | 13.32 | 145488.59 | 24684.84 | 14.52 |
| 10 | 181580.94 | 182724.34 | −1143.41 | 0.64 | 187353.70 | −5772.77 | 3.19 |
| 11 | 198486.27 | 226322.20 | −27835.94 | 14.03 | 208007.80 | −9521.54 | 4.81 |
| Average error | 92.97 | Average error | 12.28 | ||||
| 12 | 157233.29 | 280322.48 | 123089.20 | 43.92 | 153612.72 | 3620.58 | 2.31 |
The system experiment is run under the cloud security terminal network using the new RCNN economic analysis model. To analyze and compile statistics on the relationship and influence between enterprise development and economic development, the big data of enterprise development in a particular region over a year are used [24,25]. In the primary sector, exports to foreign nations make up nearly all of the total, or 99.33%, a far more significant percentage than exports to domestic markets. The tertiary sector exports a higher percentage of its output to other regions of China due to the region’s significant contribution to the country’s high-tech industry. It is compared to the National Bureau of Statistics’ economic analysis findings, as indicated in Table 4.
Demand category statistics
| Demand category | Proportion (%) |
|---|---|
| Consumption of fixed capital | 11.90 |
| Inventory increase consumption | 1.04 |
| Government consumption | 11.36 |
| Rural household consumption | 2.74 |
| Urban household consumption | 20.47 |
| Export from foreign regions | 11.58 |
| Domestic circulation | 40.90 |
The accuracy rate of the data in Table 5 is low because of the unreliable source of industrial data and poor real-time performance. However, it can reach more than 99.5% when the system analyses secondary and tertiary sectors with a high level of information technology.
Comparison of economic analysis results
| Industry | Accuracy (%) | Rejection rate (%) |
|---|---|---|
| Primary industry | 92.6 | 7.4 |
| Secondary industry | 99.3 | 0.7 |
| The service sector, tertiary industry | 99.7 | 0.3 |
5 Conclusion
For the steady and sustainable development of the regional economy against the backdrop of the new normal, it is crucial to strengthen the formulation of market planning for regional economic development. However, creating a regional economic growth market plan requires a systematic process that considers several factors. In addition to strengthening analysis and advancing the scientific nature of system planning, we must also train market planners to enhance their all-around abilities and traits. The article offers several suggestions for market planning for regional economic growth based on the actual scenario to serve as a resource and reference point for pertinent employees. The evaluation and forecasting of the market value of businesses also contribute significantly to the growth of the local economy. The strategy used in this study to make predictions can accurately and successfully forecast market value.
Acknowledgements
The author extends sincere gratitude to the methodologies that have contributed to this research.
-
Funding information: This work was supported by the Scientific Research Fund of the Zhejiang Provincial Education Department. Research on the development path of Zhejiang’s private economy in the context of the 20th anniversary of the “88th Strategy.” General Scientific Research Project of Zhejiang Provincial Department of Education with Grant number Y202352106.
-
Author contributions: Xin Lin is responsible for designing the framework, analyzing the performance, validating the results, and writing the article.
-
Conflict of interest: The author declared no conflicts of interest regarding this work.
-
Code availability: Not applicable.
-
Data availability statement: The experimental data used to support the findings of this study are available from the corresponding author upon request.
References
[1] Hasan M, Popp J, Oláh J. Current landscape and influence of big data on finance. J Big Data. 2020;7(1):1–17.10.1186/s40537-020-00291-zSearch in Google Scholar
[2] Dai HN, Wang H, Xu G, Wan J, Imran M. Big data analytics for manufacturing internet of things: opportunities, challenges and enabling technologies. Enterp Inf Syst. 2020;14(9–10):1279–303.10.1080/17517575.2019.1633689Search in Google Scholar
[3] Coad A, Srhoj S. Catching Gazelles with a Lasso: Big data techniques for predicting high-growth firms. Small Bus Econ. 2020;55(3):541–65.10.1007/s11187-019-00203-3Search in Google Scholar
[4] Shengdong M, Zhengxian X, Yixiang T. Intelligent traffic control system based on cloud computing and extensive data mining. IEEE Trans Ind Inform. 2019;15(12):6583–92.10.1109/TII.2019.2929060Search in Google Scholar
[5] Marinakis V, Doukas H, Tsapelas J, Mouzakitis S, Sicilia Á, Madrazo L, et al. From big data to innovative energy services: An application for intelligent energy management. Future Gener Comput Syst. 2020;110:572–86.10.1016/j.future.2018.04.062Search in Google Scholar
[6] Wang S, Wang H. Big data for small and medium-sized enterprises (SME): A knowledge management model. J Knowl Manag. 2020;24(4):881–97.10.1108/JKM-02-2020-0081Search in Google Scholar
[7] Wu J, Wang J, Nicholas S, Maitland E, Fan Q. Applying big data technology for COVID-19 prevention and control in China: lessons and recommendations. J Med Internet Res. 2020;22(10):e21980.10.2196/21980Search in Google Scholar PubMed PubMed Central
[8] Boone T, Ganeshan R, Jain A, Sanders NR. Forecasting sales in the supply chain: Consumer analytics in the significant data era. Int J Forecast. 2019;35(1):170–80.10.1016/j.ijforecast.2018.09.003Search in Google Scholar
[9] Araz OM, Choi TM, Olson DL, Salman FS. Role of analytics for operational risk management in the era of big data. Decis Sci. 2020;51(6):1320–46.10.1111/deci.12451Search in Google Scholar
[10] Jia Q, Guo Y, Wang G, Barnes SJ. Big data analytics in the fight against major public health incidents (including COVID-19): a conceptual framework. Int J Environ Res Public Health. 2020;17(17):6161.10.3390/ijerph17176161Search in Google Scholar PubMed PubMed Central
[11] Sousa MJ, Pesqueira AM, Lemos C, Sousa M, Rocha Á. Decision-making based on big data analytics for people management in healthcare organizations. J Med Syst. 2019;43(9):1–10.10.1007/s10916-019-1419-xSearch in Google Scholar PubMed
[12] Hassani H, Beneki C, Unger S, Mazinani MT, Yeganegi MR. Text mining in big data analytics. Big Data Cognit Comput. 2020;4(1):1.10.3390/bdcc4010001Search in Google Scholar
[13] Dong JQ, Yang CH. The business value of big data analytics: A systems-theoretic approach and empirical test. Inf Manag. 2020;57(1):103124.10.1016/j.im.2018.11.001Search in Google Scholar
[14] Rippa P, Secundo G. Digital academic entrepreneurship: The potential of digital technologies on academic entrepreneurship. Technol Forecast Soc Change. 2019;146:900–11.10.1016/j.techfore.2018.07.013Search in Google Scholar
[15] Munawar HS, Qayyum S, Ullah F, Sepasgozar S. Big data and its applications in innovative real estate and the disaster management life cycle: A systematic analysis. Big Data Cognit Comput. 2020;4(2):4.10.3390/bdcc4020004Search in Google Scholar
[16] Awan U, Bhatti SH, Shamim S, Khan Z, Akhtar P, Balta ME. The role of big data analytics in manufacturing agility and performance: moderation–mediation analysis of organizational creativity and of the involvement of customers as data analysts. Br J Manag. 2022;33(3):1200–20.10.1111/1467-8551.12549Search in Google Scholar
[17] Sun W, Zhao Y, Sun L. Big data analytics for venture capital application: towards innovation performance improvement. Int J Inf Manag. 2020;50:557–65.10.1016/j.ijinfomgt.2018.11.017Search in Google Scholar
[18] Wang F, Ding L, Yu H, Zhao Y. Big data analytics on enterprise credit risk evaluation of e-Business platform. Inf Syst e-Business Manag. 2020;18(3):311–50.10.1007/s10257-019-00414-xSearch in Google Scholar
[19] Lin R, Xie Z, Hao Y, Wang J. Improving high-tech enterprise innovation in big data environment: a combinative view of internal and external governance. Int J Inf Manag. 2020;50:575–85.10.1016/j.ijinfomgt.2018.11.009Search in Google Scholar
[20] Hung JL, He W, Shen J. Big data analytics for supply chain relationships in banking. Ind Mark Manag. 2020;86:144–53.10.1016/j.indmarman.2019.11.001Search in Google Scholar
[21] You Z, Wu C. A framework for data-driven informatization of the construction company. Adv Eng Inform. 2019;39:269–77.10.1016/j.aei.2019.02.002Search in Google Scholar
[22] Radwan A, Huq KMS, Mumtaz S, Tsang K-F, Rodriguez J. Low-cost on-demand C-RAN based mobile small-cells. IEEE Access. 2016;4:2331–9.10.1109/ACCESS.2016.2563518Search in Google Scholar
[23] Gao RX, Wang L, Helu M, Teti R. Big data analytics for intelligent factories of the future. CIRP Ann. 2020;69(2):668–92.10.1016/j.cirp.2020.05.002Search in Google Scholar
[24] Zhou J, Pang L, Zhang D, Zhang W. Underwater image enhancement method by multi-interval histogram equalization. IEEE J Ocean Eng. 2023;48(2):474–88.10.1109/JOE.2022.3223733Search in Google Scholar
[25] Zhou J, Zhang D, Zhang W. Cross-view enhancement network for underwater images. Eng Appl Artif Intell. 2023;121:105952.10.1016/j.engappai.2023.105952Search in Google Scholar
© 2024 the author(s), published by De Gruyter
This work is licensed under the Creative Commons Attribution 4.0 International License.
Articles in the same Issue
- Research Articles
- A study on intelligent translation of English sentences by a semantic feature extractor
- Detecting surface defects of heritage buildings based on deep learning
- Combining bag of visual words-based features with CNN in image classification
- Online addiction analysis and identification of students by applying gd-LSTM algorithm to educational behaviour data
- Improving multilayer perceptron neural network using two enhanced moth-flame optimizers to forecast iron ore prices
- Sentiment analysis model for cryptocurrency tweets using different deep learning techniques
- Periodic analysis of scenic spot passenger flow based on combination neural network prediction model
- Analysis of short-term wind speed variation, trends and prediction: A case study of Tamil Nadu, India
- Cloud computing-based framework for heart disease classification using quantum machine learning approach
- Research on teaching quality evaluation of higher vocational architecture majors based on enterprise platform with spherical fuzzy MAGDM
- Detection of sickle cell disease using deep neural networks and explainable artificial intelligence
- Interval-valued T-spherical fuzzy extended power aggregation operators and their application in multi-criteria decision-making
- Characterization of neighborhood operators based on neighborhood relationships
- Real-time pose estimation and motion tracking for motion performance using deep learning models
- QoS prediction using EMD-BiLSTM for II-IoT-secure communication systems
- A novel framework for single-valued neutrosophic MADM and applications to English-blended teaching quality evaluation
- An intelligent error correction model for English grammar with hybrid attention mechanism and RNN algorithm
- Prediction mechanism of depression tendency among college students under computer intelligent systems
- Research on grammatical error correction algorithm in English translation via deep learning
- Microblog sentiment analysis method using BTCBMA model in Spark big data environment
- Application and research of English composition tangent model based on unsupervised semantic space
- 1D-CNN: Classification of normal delivery and cesarean section types using cardiotocography time-series signals
- Real-time segmentation of short videos under VR technology in dynamic scenes
- Application of emotion recognition technology in psychological counseling for college students
- Classical music recommendation algorithm on art market audience expansion under deep learning
- A robust segmentation method combined with classification algorithms for field-based diagnosis of maize plant phytosanitary state
- Integration effect of artificial intelligence and traditional animation creation technology
- Artificial intelligence-driven education evaluation and scoring: Comparative exploration of machine learning algorithms
- Intelligent multiple-attributes decision support for classroom teaching quality evaluation in dance aesthetic education based on the GRA and information entropy
- A study on the application of multidimensional feature fusion attention mechanism based on sight detection and emotion recognition in online teaching
- Blockchain-enabled intelligent toll management system
- A multi-weapon detection using ensembled learning
- Deep and hand-crafted features based on Weierstrass elliptic function for MRI brain tumor classification
- Design of geometric flower pattern for clothing based on deep learning and interactive genetic algorithm
- Mathematical media art protection and paper-cut animation design under blockchain technology
- Deep reinforcement learning enhances artistic creativity: The case study of program art students integrating computer deep learning
- Transition from machine intelligence to knowledge intelligence: A multi-agent simulation approach to technology transfer
- Research on the TF–IDF algorithm combined with semantics for automatic extraction of keywords from network news texts
- Enhanced Jaya optimization for improving multilayer perceptron neural network in urban air quality prediction
- Design of visual symbol-aided system based on wireless network sensor and embedded system
- Construction of a mental health risk model for college students with long and short-term memory networks and early warning indicators
- Personalized resource recommendation method of student online learning platform based on LSTM and collaborative filtering
- Employment management system for universities based on improved decision tree
- English grammar intelligent error correction technology based on the n-gram language model
- Speech recognition and intelligent translation under multimodal human–computer interaction system
- Enhancing data security using Laplacian of Gaussian and Chacha20 encryption algorithm
- Construction of GCNN-based intelligent recommendation model for answering teachers in online learning system
- Neural network big data fusion in remote sensing image processing technology
- Research on the construction and reform path of online and offline mixed English teaching model in the internet era
- Real-time semantic segmentation based on BiSeNetV2 for wild road
- Online English writing teaching method that enhances teacher–student interaction
- Construction of a painting image classification model based on AI stroke feature extraction
- Big data analysis technology in regional economic market planning and enterprise market value prediction
- Location strategy for logistics distribution centers utilizing improved whale optimization algorithm
- Research on agricultural environmental monitoring Internet of Things based on edge computing and deep learning
- The application of curriculum recommendation algorithm in the driving mechanism of industry–teaching integration in colleges and universities under the background of education reform
- Application of online teaching-based classroom behavior capture and analysis system in student management
- Evaluation of online teaching quality in colleges and universities based on digital monitoring technology
- Face detection method based on improved YOLO-v4 network and attention mechanism
- Study on the current situation and influencing factors of corn import trade in China – based on the trade gravity model
- Research on business English grammar detection system based on LSTM model
- Multi-source auxiliary information tourist attraction and route recommendation algorithm based on graph attention network
- Multi-attribute perceptual fuzzy information decision-making technology in investment risk assessment of green finance Projects
- Research on image compression technology based on improved SPIHT compression algorithm for power grid data
- Optimal design of linear and nonlinear PID controllers for speed control of an electric vehicle
- Traditional landscape painting and art image restoration methods based on structural information guidance
- Traceability and analysis method for measurement laboratory testing data based on intelligent Internet of Things and deep belief network
- A speech-based convolutional neural network for human body posture classification
- The role of the O2O blended teaching model in improving the teaching effectiveness of physical education classes
- Genetic algorithm-assisted fuzzy clustering framework to solve resource-constrained project problems
- Behavior recognition algorithm based on a dual-stream residual convolutional neural network
- Ensemble learning and deep learning-based defect detection in power generation plants
- Optimal design of neural network-based fuzzy predictive control model for recommending educational resources in the context of information technology
- An artificial intelligence-enabled consumables tracking system for medical laboratories
- Utilization of deep learning in ideological and political education
- Detection of abnormal tourist behavior in scenic spots based on optimized Gaussian model for background modeling
- RGB-to-hyperspectral conversion for accessible melanoma detection: A CNN-based approach
- Optimization of the road bump and pothole detection technology using convolutional neural network
- Comparative analysis of impact of classification algorithms on security and performance bug reports
- Cross-dataset micro-expression identification based on facial ROIs contribution quantification
- Demystifying multiple sclerosis diagnosis using interpretable and understandable artificial intelligence
- Unifying optimization forces: Harnessing the fine-structure constant in an electromagnetic-gravity optimization framework
- E-commerce big data processing based on an improved RBF model
- Analysis of youth sports physical health data based on cloud computing and gait awareness
- CCLCap-AE-AVSS: Cycle consistency loss based capsule autoencoders for audio–visual speech synthesis
- An efficient node selection algorithm in the context of IoT-based vehicular ad hoc network for emergency service
- Computer aided diagnoses for detecting the severity of Keratoconus
- Improved rapidly exploring random tree using salp swarm algorithm
- Network security framework for Internet of medical things applications: A survey
- Predicting DoS and DDoS attacks in network security scenarios using a hybrid deep learning model
- Enhancing 5G communication in business networks with an innovative secured narrowband IoT framework
- Quokka swarm optimization: A new nature-inspired metaheuristic optimization algorithm
- Digital forensics architecture for real-time automated evidence collection and centralization: Leveraging security lake and modern data architecture
- Image modeling algorithm for environment design based on augmented and virtual reality technologies
- Enhancing IoT device security: CNN-SVM hybrid approach for real-time detection of DoS and DDoS attacks
- High-resolution image processing and entity recognition algorithm based on artificial intelligence
- Review Articles
- Transformative insights: Image-based breast cancer detection and severity assessment through advanced AI techniques
- Network and cybersecurity applications of defense in adversarial attacks: A state-of-the-art using machine learning and deep learning methods
- Applications of integrating artificial intelligence and big data: A comprehensive analysis
- A systematic review of symbiotic organisms search algorithm for data clustering and predictive analysis
- Modelling Bitcoin networks in terms of anonymity and privacy in the metaverse application within Industry 5.0: Comprehensive taxonomy, unsolved issues and suggested solution
- Systematic literature review on intrusion detection systems: Research trends, algorithms, methods, datasets, and limitations