Computer aided diagnoses for detecting the severity of Keratoconus
-
Osamah Qays Abdullah
 ,
Aicha Boughariou
,
Aicha Boughariou

Abstract
Problem
Corneal topography instruments have limited parameter constraints for calculating precise defect ratios on the basis of the cone base area of the anterior axial curvature map for patients with Keratoconus (KC).
Aim
The aim of this study is to use thresholding-based segmentation and morphological techniques to calculate the pathological ratio of the keratoconic cornea through cone base area extraction for the detection of KC severity and tracking of disease development.
Methods
Data were collected from February 2022 to March 2023, comprising 97 cases from private clinics in southern Iraq. Disease severity was categorized into three stages, namely, mild, moderate, and severe, according to the topographic KC classification by a senior ophthalmologist. The Galilei system was used in obtaining the corneal topography images. The study proposed an image analysis method for corneal topography images using MATLAB R2020a. The method had four main steps: preprocessing, image segmentation, morphological processing, and pathological ratio calculation. Moreover, pathological ratio was compared with the KC severity through statistical analysis. A P-value less than 0.05 indicated statistically significant results.
Results
The majority of the cases in the mild category had a pathological ratio of ≤20%, and the moderate category had a higher prevalence ranging from 21 to 40%. The severe category had the highest distribution (<40%). A P-value of <0.001 indicated significant and clear link between KC stages and pathologic ratio.
Conclusion
The algorithm used for extracting the cone base area of the keratoconic cornea at different stages was validated by an ophthalmic specialist to ensure that the cone base area was appropriately extracted. The findings may help ophthalmologists to make informed decisions for patients with severe KC and assessments based on the percentage of corneal defects.
1 Introduction
Keratoconus (KC) is a noninflammatory disease characterized by progressive corneal thinning and ectasia of the central or paracentral region [1]. It is an asymmetrical and progressive corneal ectasia that leads to visual impairment caused by irregular astigmatism, myopia, higher-order aberrations (HOAs), and corneal scars [2]. The prevalence of KC varies by country, indicating the possible role of genetics in its etiology; the highest prevalence has been reported in the Mediterranean region and Middle East [3,4]. The etiology of KC is complex and influenced by regional variables, family history, and race, and KC is common in countries with warm climates. Eye rubbing and allergies are the leading causes of corneal curvature progression, although genetic causes and environmental factors can influence its occurrence [5,6,7,8]. Corneal topography imaging is an essential tool for detecting KC. The severity of KC can be assessed using five technologies: manual keratometry (K), automated K, Placido disk corneal topography, scanning-slit corneal topography, and Scheimpflug imaging [9].
Corneal topography assesses and tracks changes in the shape and structure of the human eye, employing a Placido disk, which consists of illuminated rings that are then reflected back to the corneal topography instrument. A recently proposed technology generates a topographical map of the cornea by utilizing Scheimpflug and Placido disk principles, enabling ophthalmologists to examine the eyes’ health by using topographic images [10]. The anterior surfaces of the normal corneas appear cool, whereas that of abnormal corneas appears to be warm colored [11]. Image processing techniques are used in interpreting an image so that information can be extracted. These technologies have been widely used in recent decades and in various fields, such as medical, entertainment, remote sensing, and geological processing of images. Various categories are involved in image processing: image preprocessing, image restoration, enhancement, analysis, reconstruction, and data compression [12].
Image segmentation is an essential procedure in the field of medical image processing. This process divides an image into several regions according to color or shape; each region is then manipulated separately for the extraction of a specified object from the image [13]. Many aspects in the medical field require image segmentation techniques, including Otsu’s thresholding and edge detection [14] to diagnose and analyze various organs and tissues in the human body for tumor detection [15], muscle fiber classification [16], and eye disease diagnosis [17]. Hence, the purpose of this study was to measure and compare the severity of keratometric defects and calculate the defect area and ratio given that the detection and effective management of this disease are of utmost importance [18,19].
The main problem in this study is that corneal topography instruments do not present a parameter for the exact value of a corneal defect based on the axial curvature map. The main contributions of this study are as follows:
This study focuses on the significance of digital image processing (DIP) in medical image analysis.
This study emphasizes threshold-based segmentation to determine KC severity by extracting the cone base area and computing the pathological ratio.
The study demonstrates that calculating pathological ratios is valuable for the evaluation of disease progression, preparation for corneal procedures, and detection of disease severity.
The research organization is discussed in Section 2, which focuses on preprocessing, segmentation, and morphology algorithms used in extracting the cone base area. Results are presented in Section 3, and Section 4 discusses the findings and statistical significance of image analysis results. Finally, Section 5 summarizes the findings and offers recommendations for future studies to address current limitations in extracting pathogenic regions and calculating their ratios.
2 Literature review
In this section, several studies on corneal topographic images that allowed ophthalmologists to evaluate the cornea easily and effectively are reviewed. This section is organized in terms of the use of corneal topographic images for KC detection, classification, and differentiation. Feizi et al. used Galilei systems to differentiate subclinical KC and KC from normal corneas in 2016 in 148 topographic map images; and their findings demonstrated the efficiency of their method in separating subclinical KC from normal corneas according to evaluated surface indices [20]. Daud et al. utilized corneal curvature characteristics to identify KC in anterior segment images, utilizing 112 images, demonstrating the effectiveness of DIP [21]. In 2018, Ali et al. utilized image processing techniques to detect KC through topography, utilizing 40 right eye images from patients using Pentacam [22]. Husynli et al. evaluated Scheimpflug tomography parameters between thin non-keratoconic, subclinical keratoconic, and mild keratoconic corneas using 114 cornea topographic maps to differentiate between non-KC thin cornea eyes and those with subclinical or clinical KC [23]. In 2019, Lavric et al. used a KC identification method to discriminate between normal and KC based on corneal topography images [24]. In 2022, Ahmed et al. used corneal elevation topographic maps to assess different KC detections. There were 118 corneal topography images involved, depending on K, thinnest corneal thickness (TCT), and central corneal thickness (CCT) [25]. According to previous investigations, utilizing corneal topography imaging to determine KC severity is typically excellent when using common and standard criteria, with a clear absence of studies involving the cone base area and pathological ratio based on the axial curvature map. Thus, the present study focuses on employing DIP methods to diagnose KC severity by extracting the cone base area and computing the defect ratio. These methods may result in excellent performance. The summary on the related works is presented in Table 1.
Related studies on corneal imaging
| No. | Author/year | Health statues | Parameter studies | Dataset | Conclusion |
|---|---|---|---|---|---|
| 1 | Lavric and Valentin 2019 | Normal, KCN | Synthetic maps | — | Detecting KC through corneal topography imaging |
| 2 | Huseynli et al. 2018 | 54 healthy, 30 mild-stage KC, 30 subclinical KC | Topographic maps, the anterior corneal surface asphericity | 114 images | Separate non-KC thin cornea patients from those with subclinical and clinical KC |
| 3 | Moghaddam et al. 2022 | KCN | K readings, TCT, CCT | 114 eyes | K readings increased with case propagation. CCT and TCT decreased as KC progressed from mild to severe |
| 4 | Ali et al. 2018 | KC | Four topographic maps obtained with Pentacam | 40 Oculus dexter images | Image processing techniques for KC detection |
| 5 | Daud et al. 2018 | KC | Anterior segmented photographed images (ASPIs) obtained using Huawei P9 and iPhone SE | 112 images | Digital image processing for KC detection |
| 6 | Feizi 2016 | KC | Topographic maps obtained using Galilei system | 148 images | Effectively differentiate subclinical KC from normal corneas by using surface indices |
3 Materials and methods
Data were collected from February 2022 to March 2023 from four governorates in southern Iraq. A total of 97 cases were collected from private clinics using Ziemer Galilei G4 topography. A crucial bias in utilizing data is to commit that patients’ personal information will never be utilized. Another bias is acquiring images in JPG format. Disease severity was classified into three groups, namely, mild (stage I), moderate (stage II), and severe (stage III), as diagnosed by an ophthalmologist senior H.O at AL-Kadhimiya Educational Hospital. The classification was based on the topographical KC classification (TKC). The Galilei dual Scheimpflug system (Ziemer Ophthalmic System AG, Port, Switzerland) is a noninvasive diagnostic instrument designed for analyzing anterior segment characteristics. Its principle is dual Scheimpflug with Placido disk-based topography, the acquisition speed is 25–50 scan images in 2 s, and 120,000 anterior and posterior point maps to provide pachymetry, net corneal power, elevation maps, anterior chamber depth, and corneal wavefront [9,26,27]. The device provides four sub-images of the cornea: anterior axial curvature, corneal thickness, and anterior and posterior elevation. The proposed algorithm in this study is composed mainly of four steps: preprocessing, image segmentation, morphological processing, and defect ratio calculation. Statistical analysis was performed using Statistical Package for the Social Sciences (SPSS; IBM SPSS Statistics, version 25), and the pathological ratio was compared with the severity of KC. Statistical tests were considered, such as cross tabulation for descriptive statistics, chi-square, and P-value to show the significance of the findings. The number and distribution of cases are presented in Table 2 and the proposed Computer Aided Diagnoses for Detecting the Severity of KC are presented in Figure 1.
Number and distribution of cases
| Governorate | Mild KC | Moderate KC | Severe KC | Total |
|---|---|---|---|---|
| Babil | 8 | 8 | 8 | 24 |
| Al-Basra | 14 | 5 | 12 | 31 |
| Maysan | 6 | 7 | 6 | 19 |
| Dhi-Qar | 13 | 7 | 3 | 23 |
| Total | 41 | 27 | 29 | 97 |
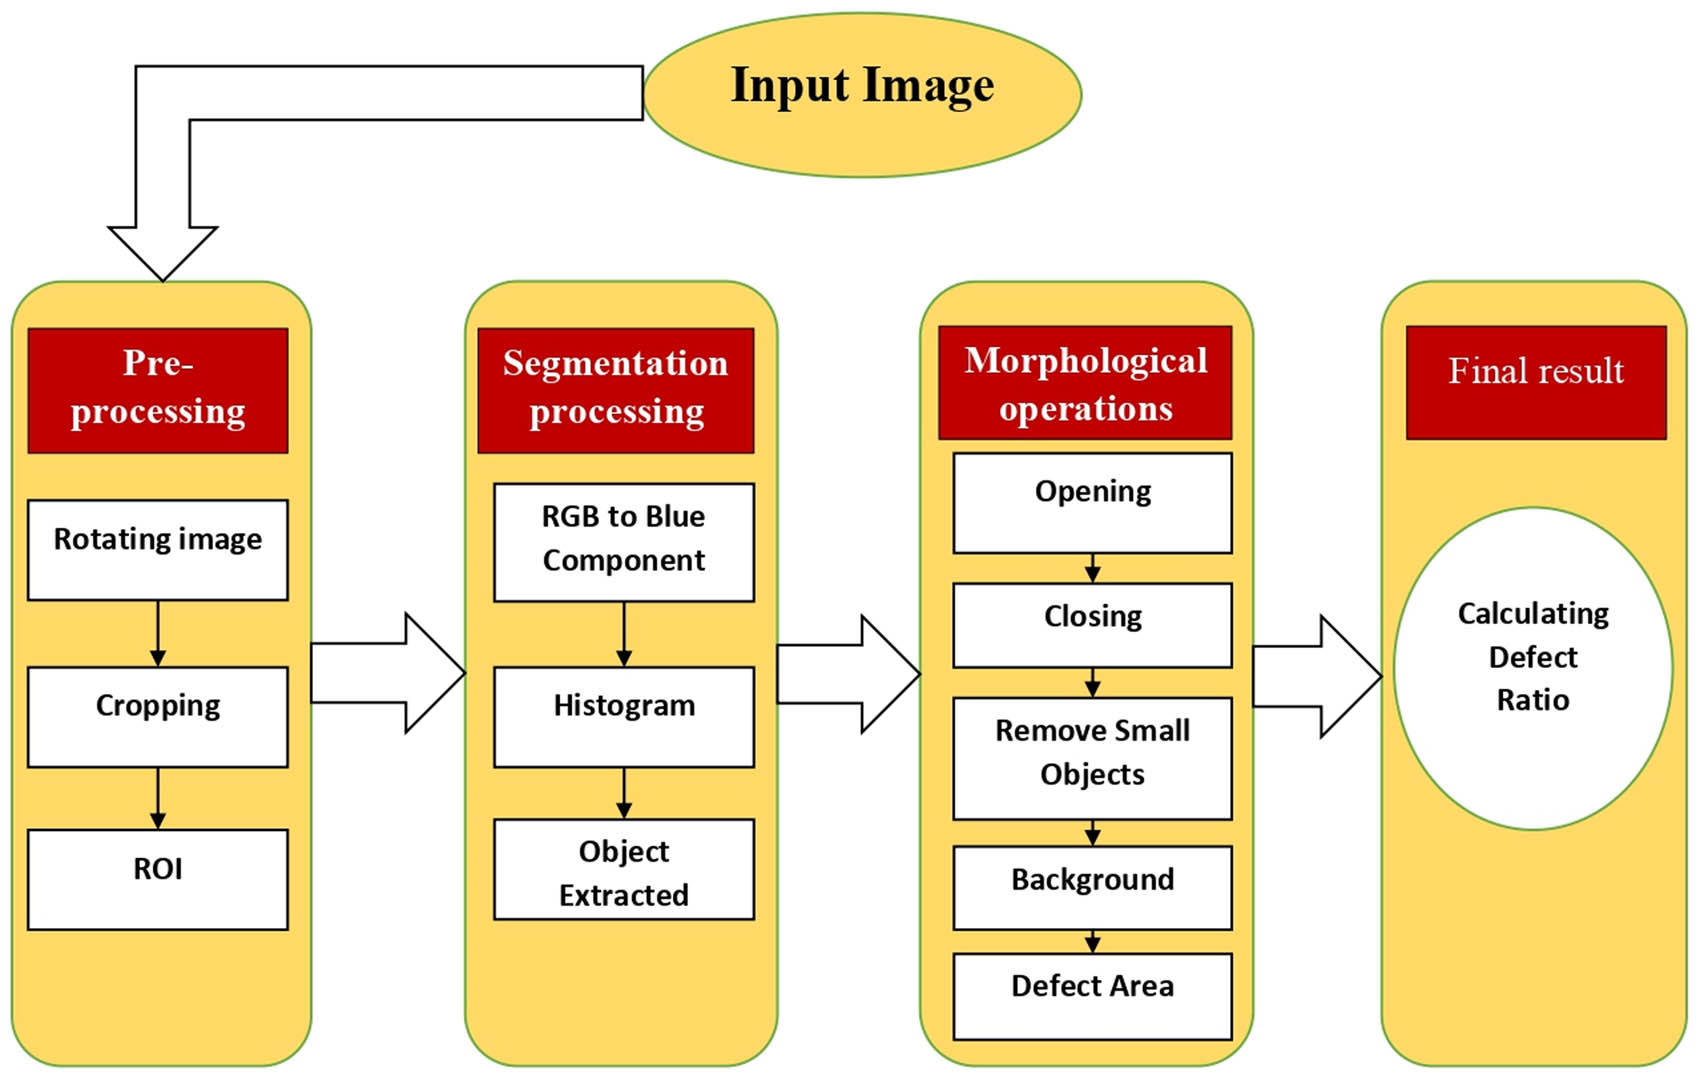
The proposed computer aided diagnoses for detecting the severity of KC.
3.1 Preprocessing
The region of interest (ROI) was obtained through image preprocessing, which represents the anterior axial curvature. The anterior axial curvature map aids in assessing astigmatism irregularities and determining corneal dioptric power, using a color scheme with warm colors representing steeper curvatures and cool colors representing flatter areas [11]. Challenges due to difference in image size were addressed using three methods: resizing, orientation, and cropping. A specific operation is applied according to image size. By adaptively adjusting the preprocessing steps on the basis of image size, the methods ensure consistent orientation and size for subsequent analysis or processing tasks. The process involves reading an image file, determining its dimensions, and calculating the total size by multiplying the number of rows by one-third of the number of columns. After the total size of the image is calculated, it is compared with a predefined value. If the size is met, the image undergoes rotation and resizing operations. The input image is rotated 270° to align with the desired orientation and resized to a target size. A rectangular ROI is defined, and the specific coordinates of top-left and bottom-right corners are determined. ROI specification determines a specific region to be cropped or extracted for further analysis. If the condition is not met, the input image remains unrotated, with a rotation angle of 0°. An alternative ROI is cropped with specific coordinates for the top-left and bottom-right corners. The cropped image, either rotated and resized or unrotated, is cropped using the defined ROI coordinates and represents the anterior axial curvature image.
3.2 Image segmentation
A threshold-based segmentation utilizes the histogram of blue component images used in extracting an ROI. A histogram of a blue component image is used in calculating and displaying disruption in pixel intensities. The intensity values of a pixel refer to its brightness or gray level. For the differentiation between foreground and background regions in corneal topography images, a blue component image is compared with a threshold value (T) of 7, and a binary image is created. Pixels with an intensity over 7 are represented as white (1) in the binary image, whereas the remaining pixels are black (0), as shown in equation (1). The threshold value is selected through experimentation and fine-tuning.
where g: output binary image of dimensions x and y, f: blue component of ROI with dimensions x and y, and T: predefined threshold value.
3.3 Morphological operations
The morphology procedure implements various operations: opening, closing, area filtering, and hole filling for feature extraction (equations (2) and (3)). These operations are applied to input images, and different structuring elements are used. The appropriate mask for morphological actions is selected through experimentation and fine-tuning. Small objects are removed from the image through area filtering. Holes in the binary image are filled by finding pixels that are similar to the background. The resulting image will represent the defect area in white color, whereas the rest of the cornea will be represented in black color.
where A: segmented image, and B: disk-shaped structuring element with a radius of 1.
where A: opening image, and B: disk-shaped structuring element with a radius of 7.
Determining the threshold value and selecting appropriate structural elements for segmentation and morphological operations are technical challenges because of varying severity of cases and morphological operations and are thus achieved through extensive testing and fine-tuning.
3.4 Calculating the defect ratio
This section outlines the process of calculating pathological percentage for binary images. This percentage is the output of the morphology component, and the method involves two operations: “defect calculation” and “nondefect calculation.” The first involves counting the number of pixels considered defects in a binary image, and the values are stored in the variable “d,” which represents all pixels with a value of 1. The second operation counts the number of pixels considered non-defects in the background image, and the value is stored in the variable “b,” which represents all pixels with a value of 0. The final step calculates the defect ratio by dividing the number of pixels in the d by the total number in the b and d variables. The following equations illustrate the calculation process.
where d: defect area, and h: hole-filled image with dimensions x and y.
where b: background.
where Defect ratio is the final result.
4 Results and discussion
4.1 Preprocessing
Image preprocessing operations are used in obtaining the anterior axial curvature map, which represents the curvature of the anterior corneal surface in dioptric values. The objective of this operation is to eliminate unwanted components, including patient identification, report parameters, and other sub-pictures. The operation is conducted depending on the calculated picture size. By adaptively adjusting the preprocessing steps according to image size, these methods ensure consistent orientation and size for subsequent processing tasks. Figure 2 shows the original pictures of the three stages of KC (mild, moderate, and severe). One case is selected as a sample of each stage, and the result of the preprocessing operation to obtain ROI after the removal of all undesired components and preparation of the picture for segmentation processing is evaluated.
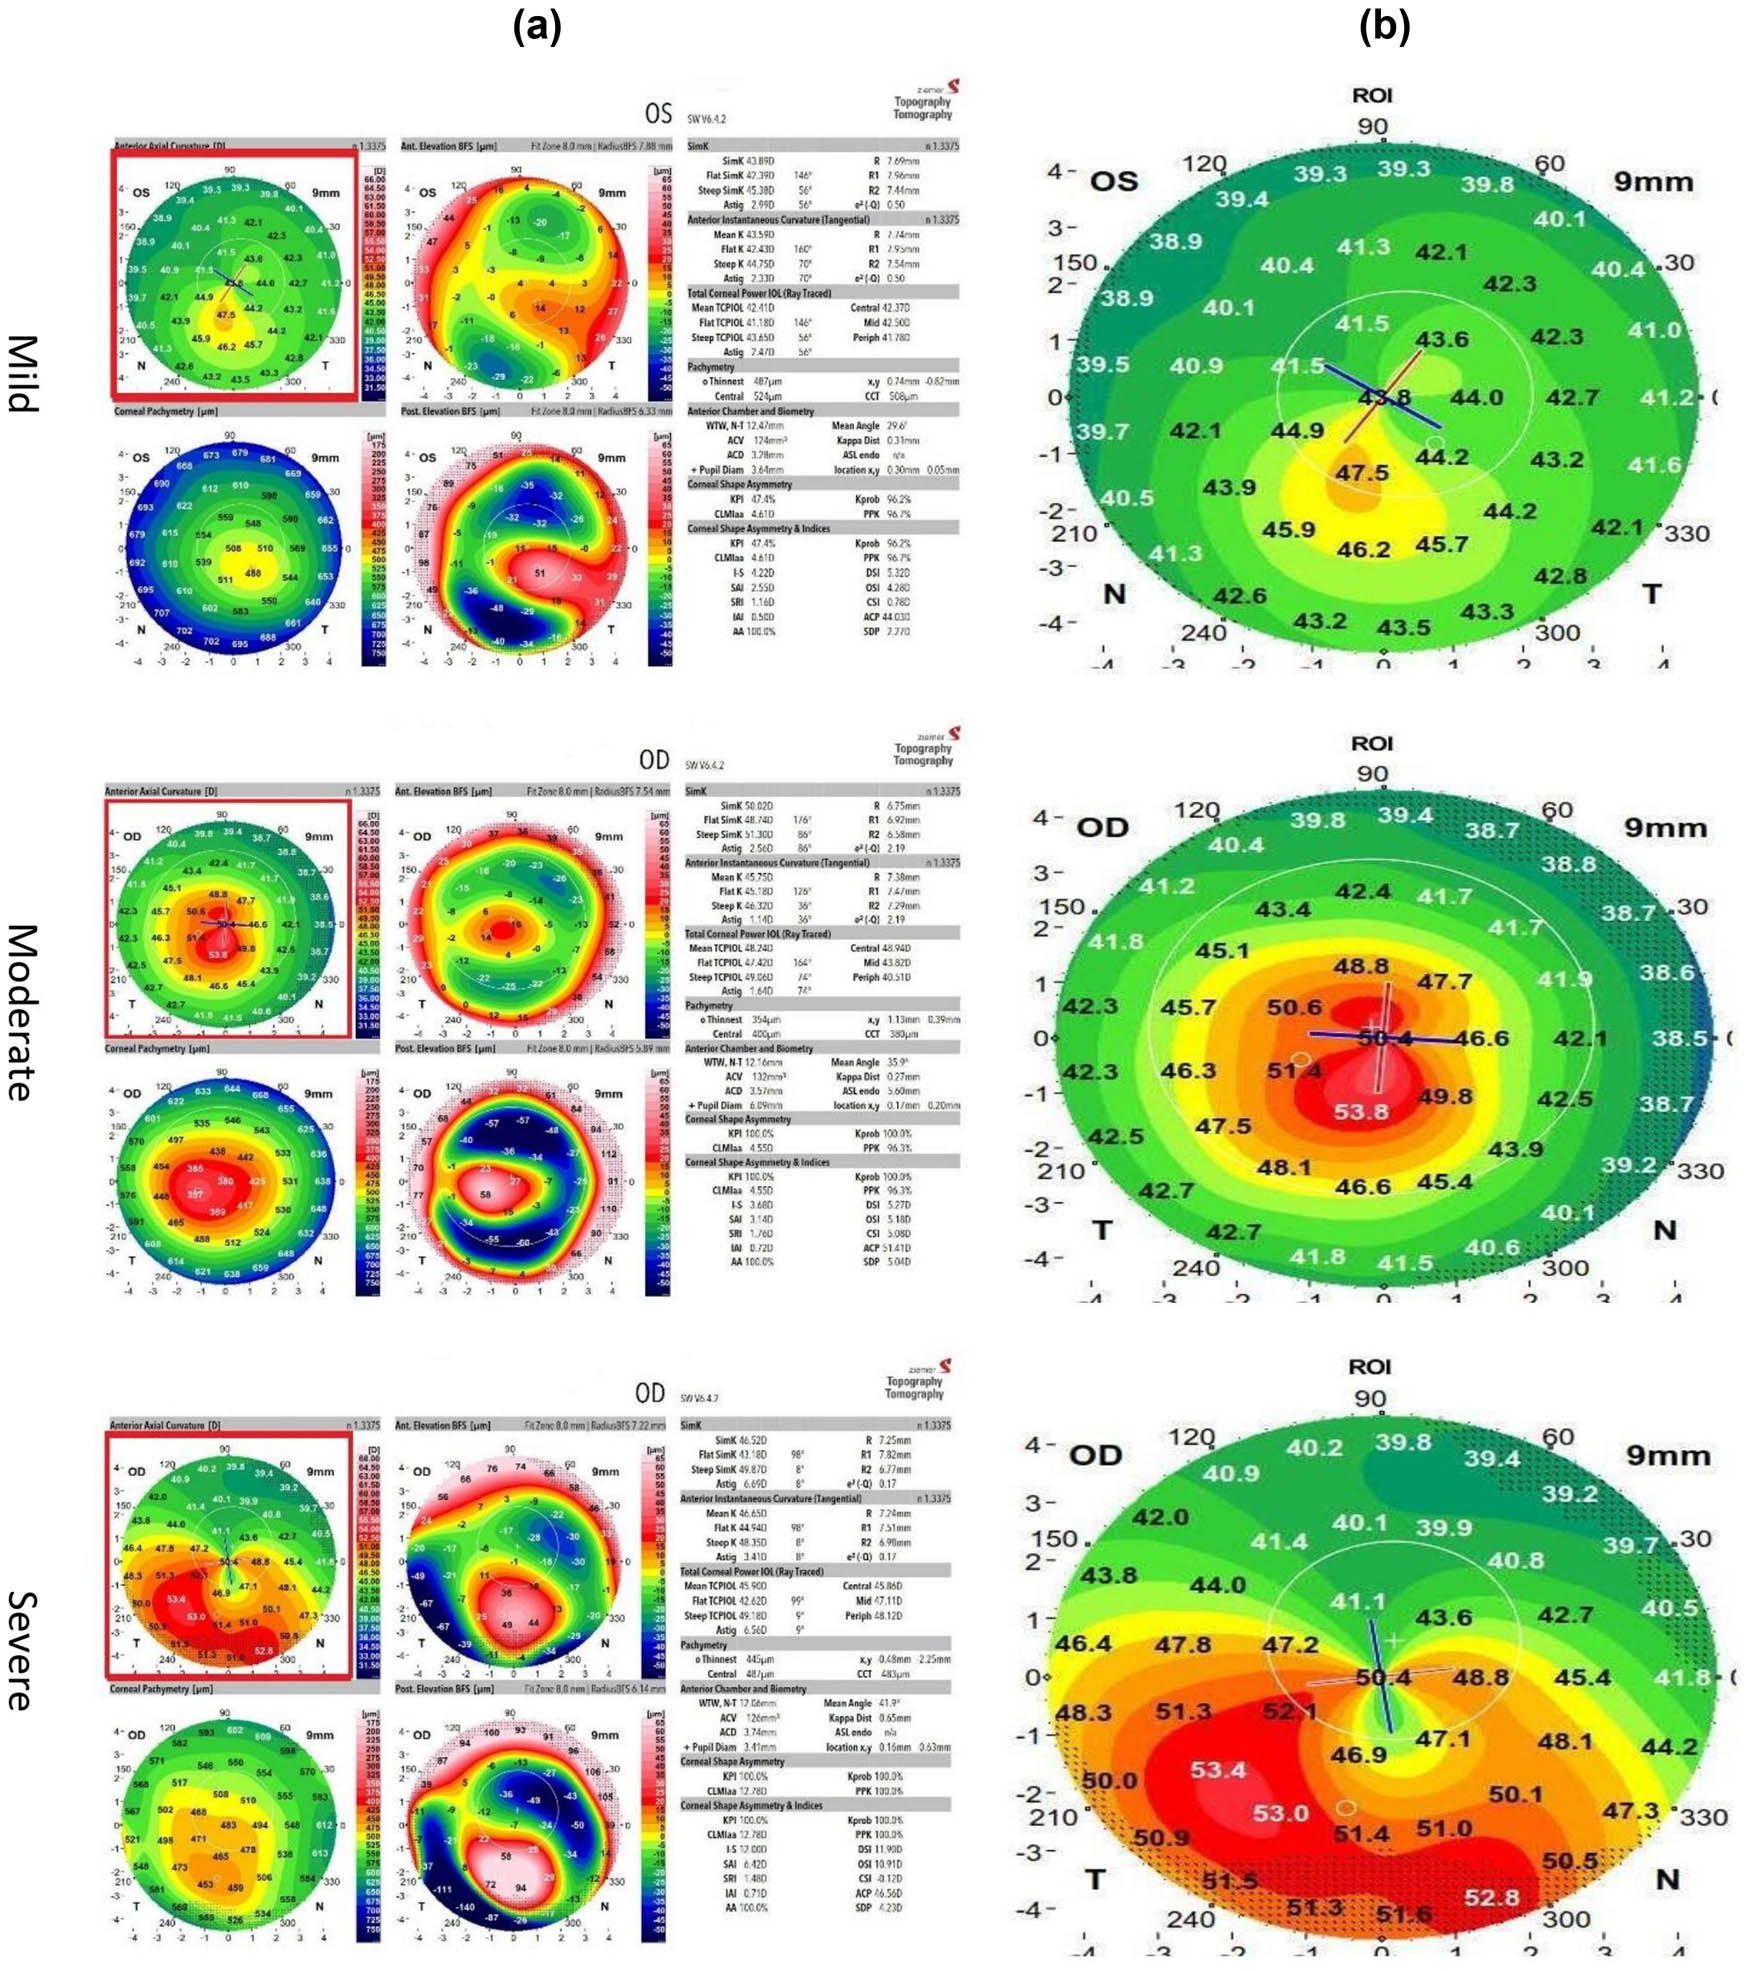
Preprocessing techniques for cases: (a) original image and (b) ROI.
4.2 Image segmentation results
Experimental results were obtained from 97 topography images of mild, moderate, and severe KC cases, demonstrating the thresholding approach in segmentation and preparing images for morphological processing. Figure 3 illustrates the segmentation process for the cases selected.
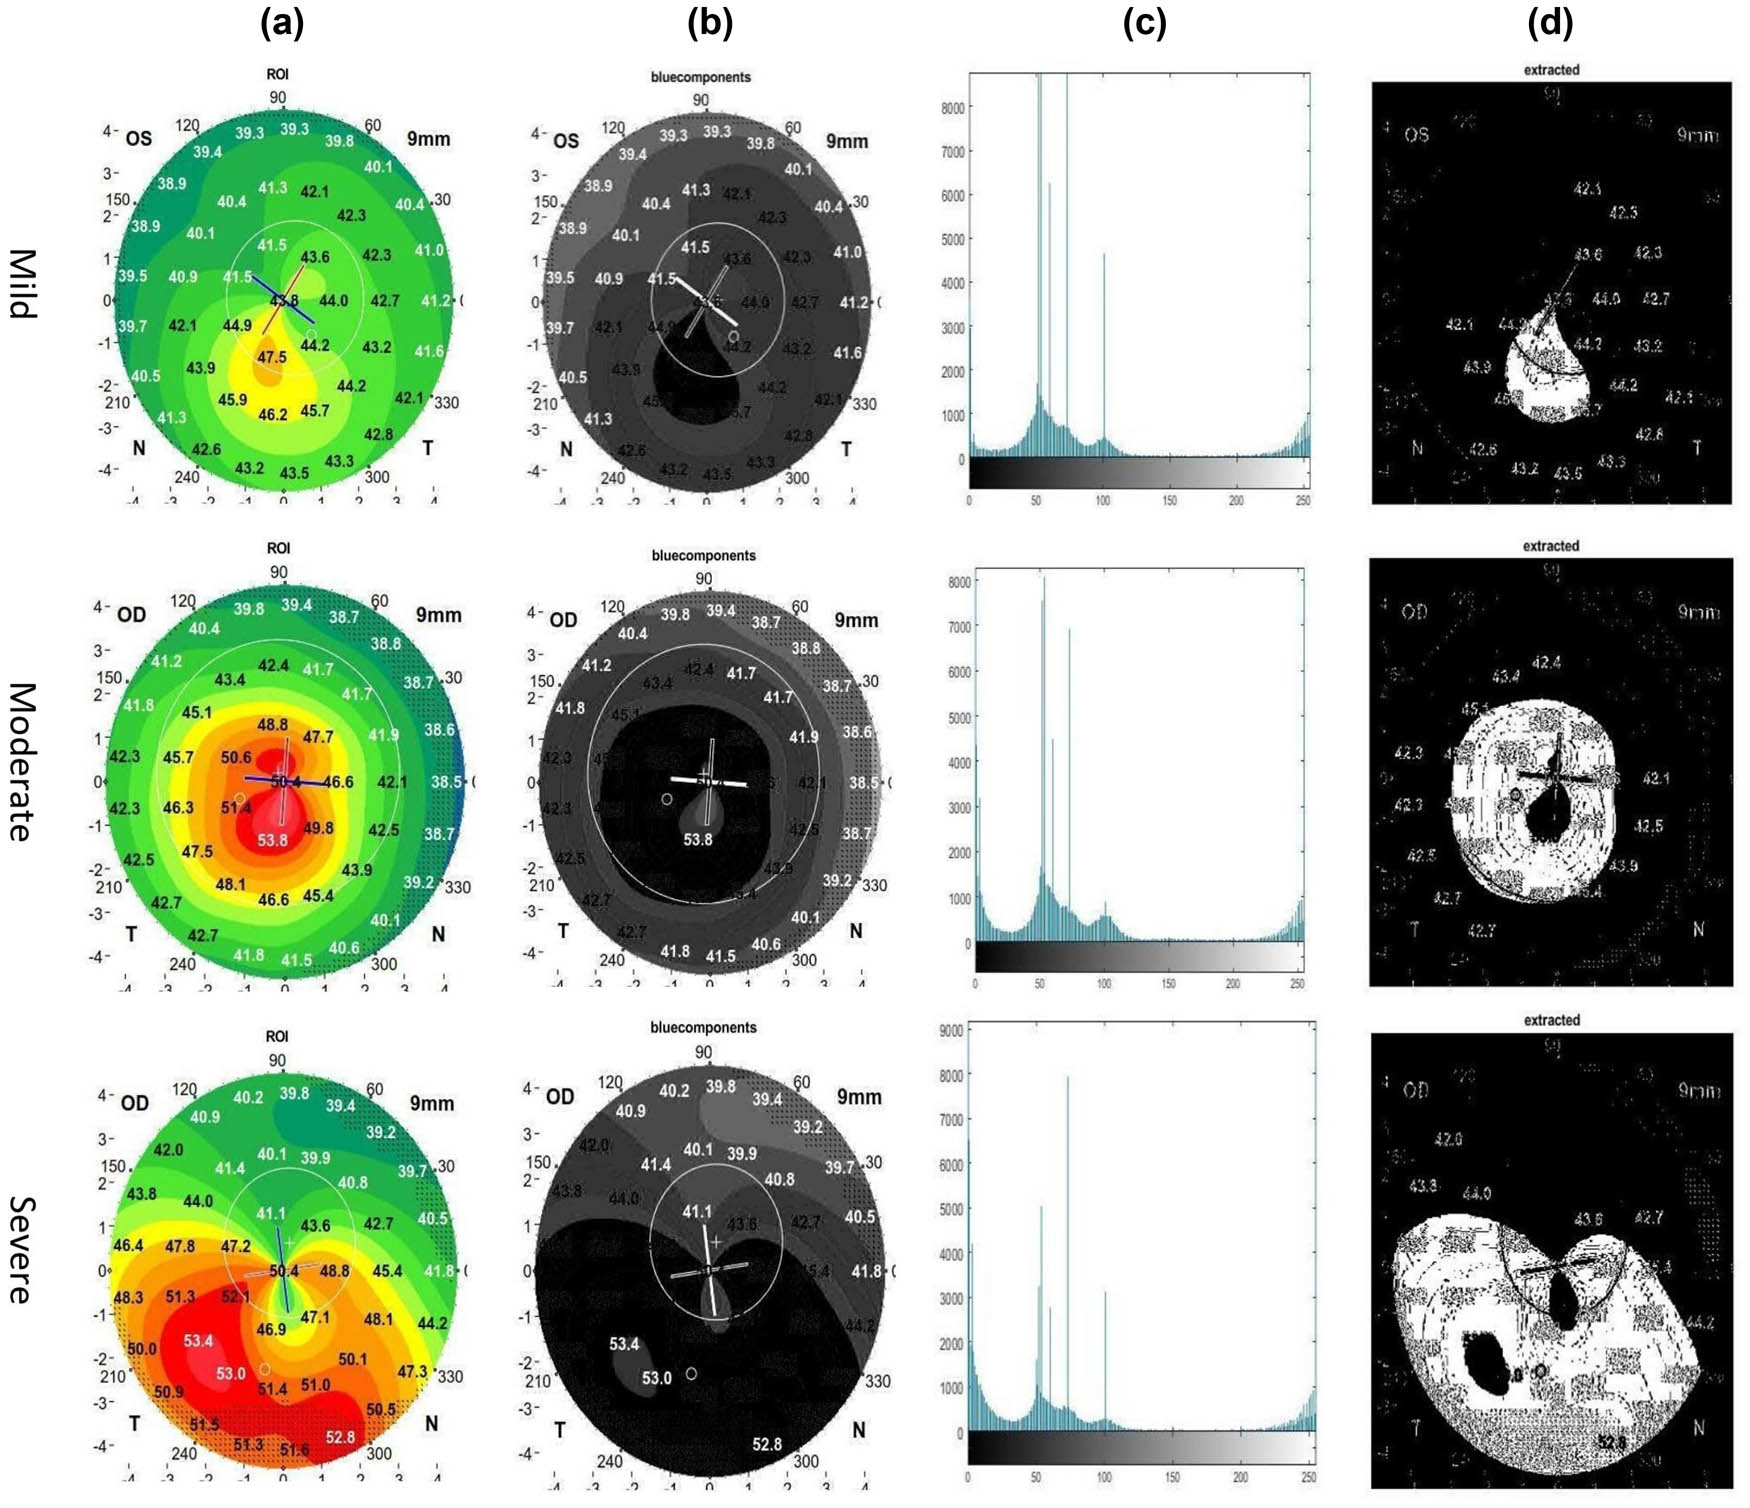
Segmentation techniques for the cases: (a) ROI, (b) blue component, (c) histogram, and (d) extraction.
4.3 Morphological operations
This section outlines the process of implementing morphological operations for the extraction of attributes from an image and identification of a defect area representation. The operations include opening, closing, area filtering, and hole filling. The opening operation is conducted to remove small-scale noise and fine details, and closing fills small gaps and smooths object boundaries. Area filtering is utilized to remove connected components with an area less than 300 pixels, removing any noise or irrelevant components. The size-filtering image then undergoes hole filling, filling cavities or gaps in the binary image and resulting in a more complete representation of the defect area. The process is illustrated in Figure 4.
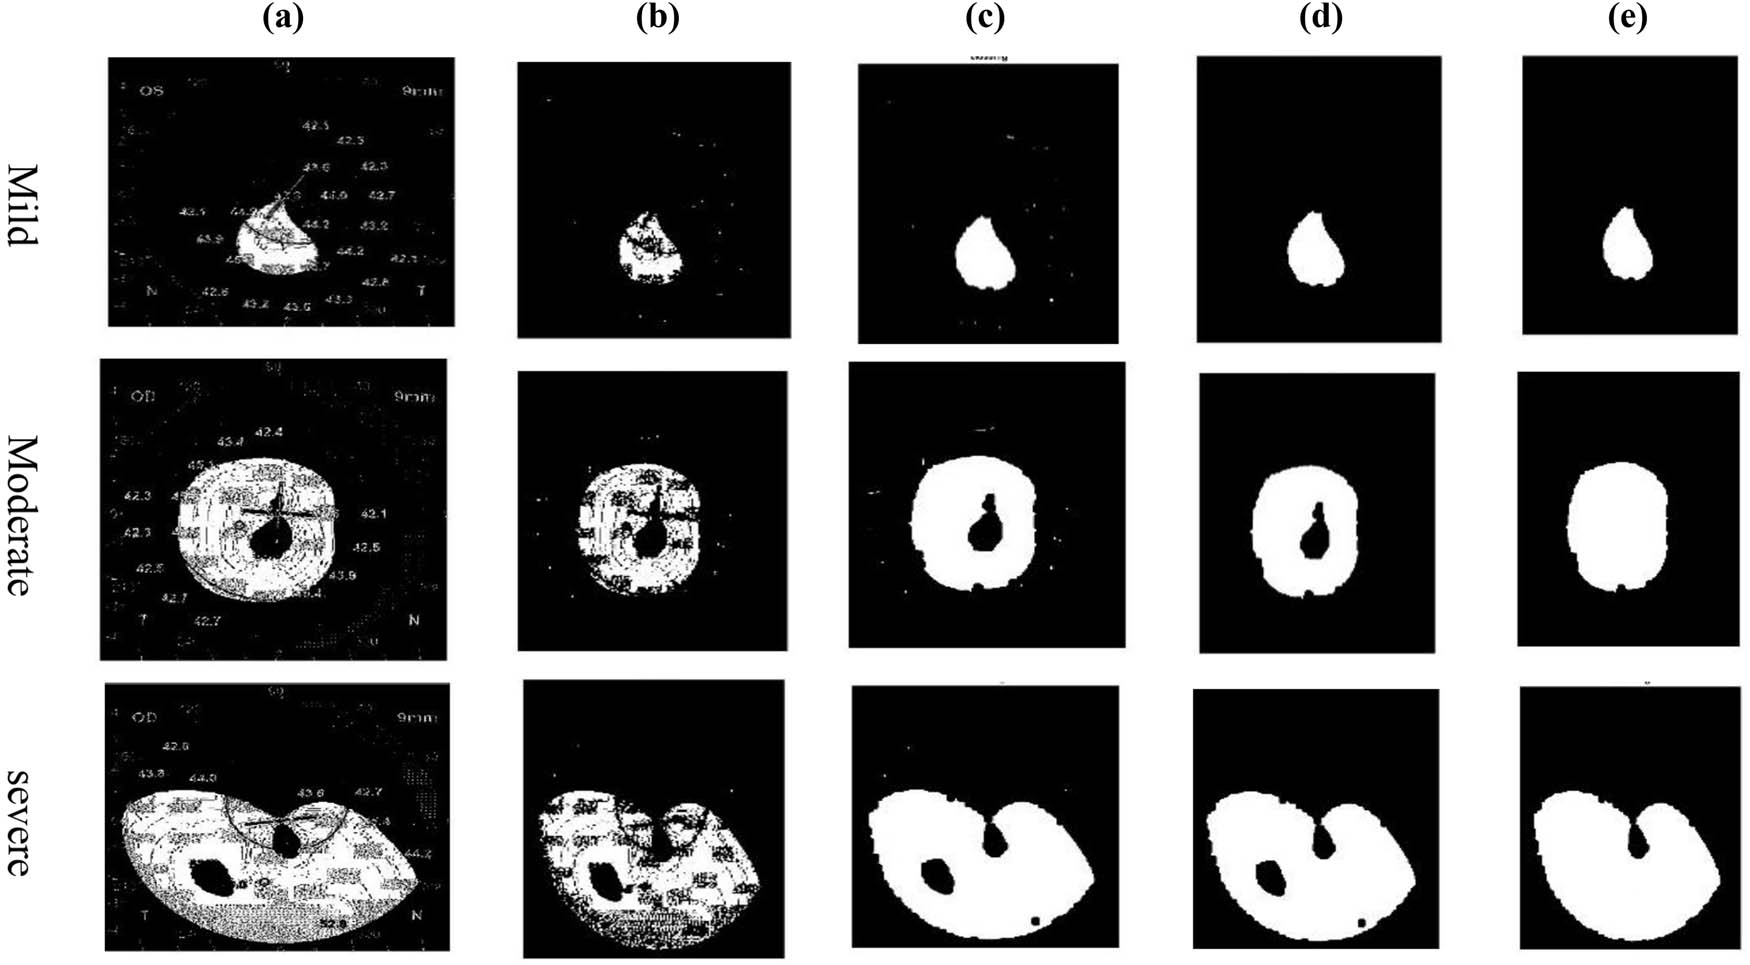
Morphological techniques for cases: (a) extracted, (b) opening, (c) closing, (d) largest object, and (e) hole filling.
4.4 Final results
This stage involves several steps for quantifying the presence of defects and assessing their impact relative to the overall image composition. The following steps are performed: pixels in the defect’s area are counted, which are pixels considered defects in the morphology operations output image (hole filling) with a value of 1. The value is determined and stored in the variable “d” (equation (4)). Then, the pixels in a non-defect image are counted, representing the pixels that are not classified as defects (with a value of 0) in the binary image (background). The value is calculated and stored in the variable “b” (equation (5)). Finally, the defect ratio is calculated, which is computed by dividing the number of white pixels (d) by the total number of black pixels (b). The resulting ratio is then multiplied by 100 and expressed as a percentage. This value is saved as “defect ratio,” Figure 5.
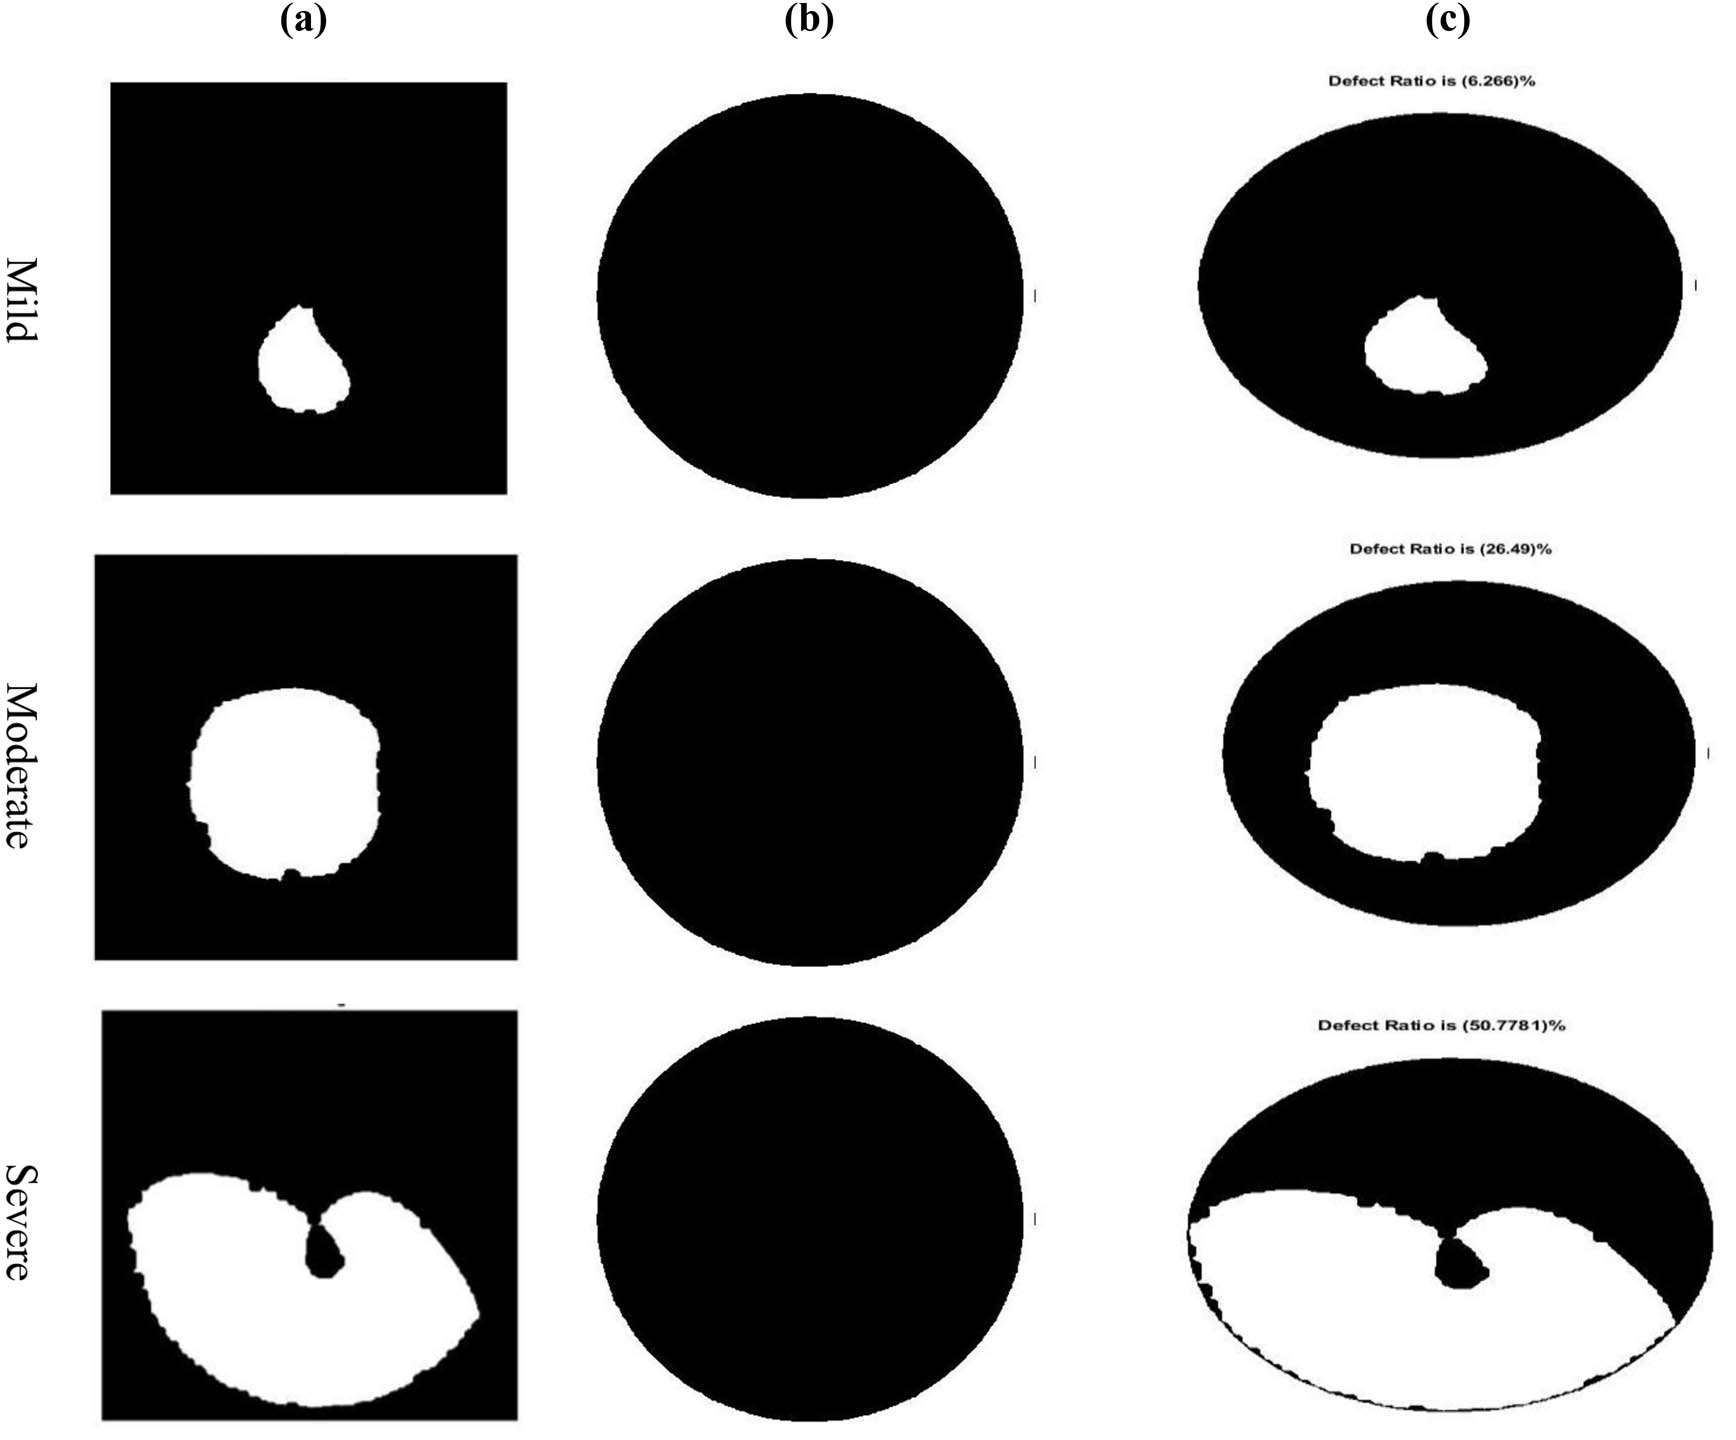
Defect ratio calculation: (a) hole filling image, (b) background image, and (c) final image (defect ratio).
Table 3 presents the pathological percentage for the 97 cases. Figure 6 shows that the pathogenic ratio of mild cases was more prevalent (less than 20%), moderate cases were more prevalent (21–40%), and severe cases were more widespread (41–60%). The statistical test demonstrates its significance, which is essential for ophthalmologists and optometrists assessing diseases, classifying severity, diagnosing and treating conditions, and monitoring defect progression.
Association between KC severity and pathological ratio
| KC | Pathological ratio | Total | |||||
|---|---|---|---|---|---|---|---|
| ≤20% | 21–30% | 31–40% | 41–50% | 51–60% | >60% | ||
| Mild | 27 | 3 | 5 | 2 | 0 | 4 | 41 |
| Moderate | 1 | 8 | 10 | 5 | 3 | 0 | 27 |
| Severe | 0 | 3 | 5 | 9 | 7 | 5 | 29 |
| Total | 28 | 14 | 20 | 16 | 10 | 9 | 97 |
| Chi-squared | 66.179 | ||||||
| Df* | 10 | ||||||
| Significance level | P < 0.001 | ||||||
*Degree of freedom.
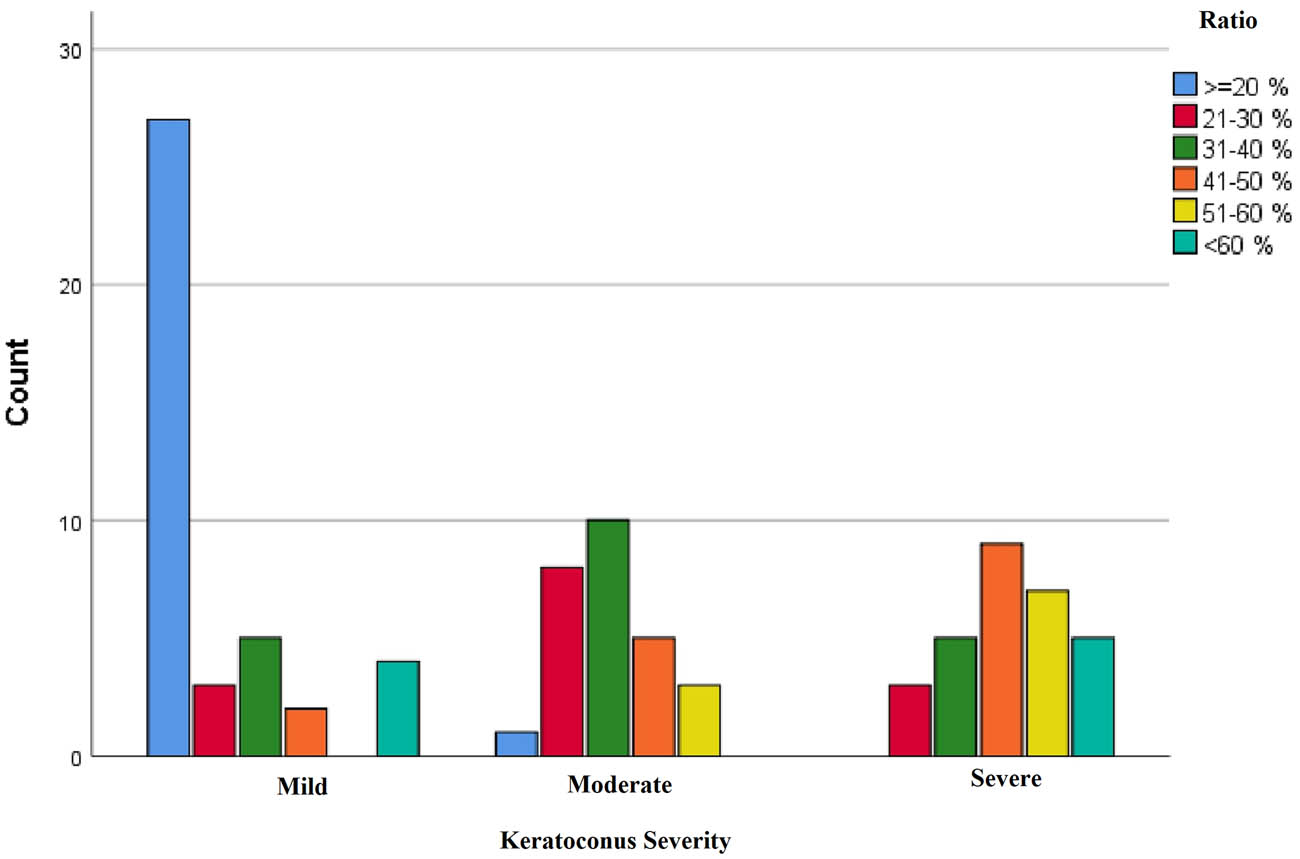
Association of KC severity and pathological ratio.
5 Discussion
The main aim of this study is to extract the pathological area of a keratoconic cornea and calculate the defect ratio. Thresholding-based segmentation and morphological techniques are used in obtaining and calculating the corneal pathological area and ratio for 97 cases, and severity is classified as mild, moderate, and severe. The result of image processing operations, specifically those related to the pathological ratio associated with different stages of KC severity, shows that the pathological ratio of mild cases was less than 20%, moderate cases were more prevalent in the 21–40% range, and severe cases were more widespread in the 41–60% range. A statistical analysis found a correlation between defect ratio and KC severity, with a P-value of <0.0001, which indicates statistical significance. These findings demonstrate that the pathological ratio helps ophthalmologist in making decisions regarding KC treatment and is a reliable indicator for assessing disease severity. The indications facilitate the selection of treatment approaches, such as corneal cross-linking for mild cases or corneal transplantation for advanced stages. Furthermore, the pathogenic ratio value might be essential for determining KC severity according to the TKC because it may facilitate the assessment of corneal distortion. Higher ratios indicate advanced TKC stages. The percentage of pathological area is crucial for the assessment of corneal health, tracking of the progression of corneal conditions, and assessment treatment effectiveness. Given the progression of KC based on severity levels provides information that may influence treatment options. By demonstrating changes in the pathological area and calculating the ratios as the disease progresses, ophthalmologists may predict the severity of the disease and adapt suitable treatments. The size of a defect can affect treatment directions, such as implanting intraocular lenses or performing a procedure more complex than surgery.
6 Conclusion
Image processing techniques are crucial for the detection, classification, and diagnosis of KC severity. This study proposes a novel detection method for KC severity based on cone-based area with DIP for the extraction of pathological area and calculation of pathological ratio. The algorithm is verified by comparing its results to expert manual measurements and checked by an ophthalmologist. The algorithm consists of four steps: preprocessing, segmentation, morphological processing, and calculation of area and ratio of defects. Moreover, pathological ratio was compared with the KC severity through statistical analysis. A P-value less than 0.05 indicated statistically significant results. Results: The majority of the cases in the mild category had a pathological ratio of ≤20%, and the moderate category had a higher prevalence ranging from 21 to 40%. The severe category had the highest distribution (<40%). A P-value of <0.001 indicated significant and clear link between KC stages and pathologic ratio. The results can be useful for ophthalmologists evaluating corneal health, planning surgeries, tracking development, and making clinical decisions. The study’s limitations included difficulties in acquiring JPG corneal topography images and the absence of a public database. Future studies should focus on improving the algorithm that can be used in other corneal topography devices, such as the Allegro Oculyzer (Wavelight) and Sirius tomographer CSO.
-
Funding information: The authors received no specific funding for this study.
-
Author contributions: Osamah Qays Abdullah: writing, visualization, methodology, editing, and supervision. Aicha Boughariou: investigation, and supervision Fadia W. Al-Azawi: investigation, and supervision. Mohammed Khadum Abdulamer Al-Araji: analysis and interpretation of the data and supervision. Mehdy Mwaffeq Mehdy: methodology and reviewing.
-
Conflict of interest: The authors declare they have no conflict of interest.
-
Code and Data availability statement: Code and data availability statement can be obtained from the corresponding author upon reasonable request.
-
Supplemental Material: Supplemental material is not applicable for this research.
References
[1] Davidson AE, Hayes S, Hardcastle AJ, Tuft SJ. The pathogenesis of keratoconus. Eye. 2014;28(2):189–95.Search in Google Scholar
[2] Kymes SM, Walline JJ, Zadnik K, Sterling J, Gordon MO, Group CLEoKS. Changes in the quality-of-life of people with keratoconus. Am J Ophthalmol. 2008;145(4):611e617.10.1016/j.ajo.2007.11.017Search in Google Scholar PubMed PubMed Central
[3] Mohd-Ali B, Abdu M, Yaw CY, Mohidin N. Clinical characteristics of keratoconus patients in Malaysia: a review from a cornea specialist centre. J Optom. 2012;5(1):38e42.10.1016/j.optom.2012.01.002Search in Google Scholar
[4] Nielsen K, Hjortdal J, Aagaard Nohr E, Ehlers N. Incidence and prevalence of keratoconus in Denmark. Acta Ophthalmol Scand. 2007;85(8):890e892.10.1111/j.1600-0420.2007.00981.xSearch in Google Scholar PubMed
[5] Xu L, Wang YX, Guo Y, You QS, Jonas JB, et al. Prevalence and associations of steep cornea/Keratoconus in greater Beijing. The Beijing Eye Study. PLoS One. 2012;7(7):e39313.10.1371/journal.pone.0039313Search in Google Scholar PubMed PubMed Central
[6] Davidson AE, Hayes S, Hardcastle AJ, Tuft SJ. The pathogenesis of keratoconus. Eye (Lond). 2014;28(2):189–95.10.1038/eye.2013.278Search in Google Scholar PubMed PubMed Central
[7] Sharif R, Bak-Nielsen S, Hjortdal J, Karamichos D. Pathogenesis of Keratoconus: The intriguing therapeutic potential of prolactin-inducible protein. Prog Retin Eye Res. 2018;67:150–67.10.1016/j.preteyeres.2018.05.002Search in Google Scholar PubMed PubMed Central
[8] Carlson AN. Keratoconus. Ophthalmology. 2009;116(10):2036–7.10.1016/j.ophtha.2009.08.026Search in Google Scholar PubMed
[9] Konstantopoulos A, Hossain P, Anderson DF. Recent advances in ophthalmic anterior segment imaging: a new era for ophthalmic diagnosis? Br J Ophthalmol. 2007;91:551–7. http://www.ncbi.nlm.nih.gov/pmc/articles/PMC1994765/pdf/551.pdf. Accessed September 24, 2010.10.1136/bjo.2006.103408Search in Google Scholar PubMed PubMed Central
[10] Alio JL, Abbouda A, Valle DD, Del Castillo JMB, Fernandez JAG. Corneal cross linking and infectious keratitis: a systematic review with a meta-analysis of reported cases. J Ophthalmic Inflamm Infect. 2013;3:47.10.1186/1869-5760-3-47Search in Google Scholar PubMed PubMed Central
[11] Subramanian P, Ramesh GP. Keratoconus classification with convolutional neural networks using segmentation and index quantification of eye topography images by particle swarm optimisation. Biomed Res Int. 2022;2022:8119685.10.1155/2022/8119685Search in Google Scholar PubMed PubMed Central
[12] Kanimozhi R, Gayathri R. Detection and evaluation of keratoconus (corneal topography) by using the image classifier techniques. Soft Comput. 2021;25:2531–43. 10.1007/s00500-020-05255-2.Search in Google Scholar
[13] Phonsa G, Manu K. A survey: Image segmentation techniques. Adv Intell Syst Comput. 2019;741:1123–40. 10.1007/978-981-13-0761-4_105.Search in Google Scholar
[14] Oliveira RB, Filho ME, Ma Z, Papa JP, Pereira AS. Computational methods for the image segmentation of pigmented skin lesions: A Review. Comput Methods Prog Biomed. 2016;131:127–41.10.1016/j.cmpb.2016.03.032Search in Google Scholar PubMed
[15] Moghbel M, Mashohor S, Mahmud R, Bin Saripan MI. Automatic liver tumor segmentation on computed tomography for patient treatment planning and monitoring. EXCLI J. 2016;15:406–23. 10.17179/excli2016-402.Search in Google Scholar PubMed PubMed Central
[16] Mehdy MM, Mohammed SR, Khamiss Nasser N, Al-Salihi AR. Classification of skeletal muscle fiber types using image segmentation. Proc. 2nd Int. Conf. Emerg. Technol. Intell. Syst. ICETIS 2022. 573, 2022. p. 647–56.10.1007/978-3-031-20429-6_58Search in Google Scholar
[17] Amiri E, Roozbakhsh Z, Amiri S, Asadi MH. Detection of topographic images of keratoconus disease using machine vision. Int J Eng Sci Appl. 2020;4(4):145–50.Search in Google Scholar
[18] Mohd-Ali B, Abdu M, Das S, Mohidin N. Ethnicity related to keratoconus: A study with clinical implications. Int Med J. 2011;18(3):233e236.Search in Google Scholar
[19] Jones-Jordan LA, Walline JJ, Sinnott LT, Kymes SM, Zadnik K. Asymmetry in keratoconus and vision-related quality of life. Cornea. 2013;32(3):267e272.10.1097/ICO.0b013e31825697c4Search in Google Scholar PubMed PubMed Central
[20] Feizi S, Yaseri M, Kheiri B. Predictive ability of Galilei to distinguish subclinical keratoconus and keratoconus from normal corneas. J Ophthalmic Vis Res. 2016;11(1):8–16. 10.4103/2008-322X.180707.Search in Google Scholar PubMed PubMed Central
[21] Daud MM, Mimi W, Wan D, Hussain A, Mutalib HA. Detection of keratoconus in anterior segment photographed images using corneal curvature features. 2019;(March):1191–8. 10.11591/ijeecs.v13.i3.Search in Google Scholar
[22] Ali AH, Ghaeb NH, Musa ZM. Support vector machine for keratoconus detection by using topographic maps with the help of image processing techniques. J Pharm Biol Sci. 2017;12(6):50–8. 10.9790/3008-1206065058.Search in Google Scholar
[23] Huseynli S, Salgado-Borges J, Alio JL. Comparative evaluation of Scheimpflug tomography parameters between thin non-keratoconic, subclinical keratoconic, and mild keratoconic corneas. Eur J Ophthalmol. 2018;28(5):521–34. 10.1177/1120672118760146.Search in Google Scholar PubMed
[24] Lavric A, Popa V, David C, Paval CC. Keratoconus detection algorithm using convolutional neural networks: Challenges. In 2019 11th International conference on electronics, computers and artificial intelligence (ECAI), IEEE; p. 1–4. 10.1109/ECAI46879.2019.9042100.Search in Google Scholar
[25] Ahmed SM, See OH, Weng LY, Al-Sharify NT, Nser HY, Al-Sharify ZT, et al. Corneal elevation topographic maps assessing different diseases detection: A review. Ain Shams Eng J. 2024;15(1):102292. 10.1016/j.asej.2023.102292.Search in Google Scholar
[26] Swartz T, Marten L, Wang M. Measuring the cornea: The latest developments in corneal topography. Curr Opin Ophthalmol. 2007;18:325–333.12.10.1097/ICU.0b013e3281ca7121Search in Google Scholar PubMed
[27] Seyala N, Abdullah SN. Cluster analysis on longitudinal data of patients with kidney dialysis using a smoothing cubic B-spline model. Int J Math Stat Computer Sci. 2023;2:85–95. 10.59543/ijmscs.v2i.8337.Search in Google Scholar
© 2024 the author(s), published by De Gruyter
This work is licensed under the Creative Commons Attribution 4.0 International License.
Articles in the same Issue
- Research Articles
- A study on intelligent translation of English sentences by a semantic feature extractor
- Detecting surface defects of heritage buildings based on deep learning
- Combining bag of visual words-based features with CNN in image classification
- Online addiction analysis and identification of students by applying gd-LSTM algorithm to educational behaviour data
- Improving multilayer perceptron neural network using two enhanced moth-flame optimizers to forecast iron ore prices
- Sentiment analysis model for cryptocurrency tweets using different deep learning techniques
- Periodic analysis of scenic spot passenger flow based on combination neural network prediction model
- Analysis of short-term wind speed variation, trends and prediction: A case study of Tamil Nadu, India
- Cloud computing-based framework for heart disease classification using quantum machine learning approach
- Research on teaching quality evaluation of higher vocational architecture majors based on enterprise platform with spherical fuzzy MAGDM
- Detection of sickle cell disease using deep neural networks and explainable artificial intelligence
- Interval-valued T-spherical fuzzy extended power aggregation operators and their application in multi-criteria decision-making
- Characterization of neighborhood operators based on neighborhood relationships
- Real-time pose estimation and motion tracking for motion performance using deep learning models
- QoS prediction using EMD-BiLSTM for II-IoT-secure communication systems
- A novel framework for single-valued neutrosophic MADM and applications to English-blended teaching quality evaluation
- An intelligent error correction model for English grammar with hybrid attention mechanism and RNN algorithm
- Prediction mechanism of depression tendency among college students under computer intelligent systems
- Research on grammatical error correction algorithm in English translation via deep learning
- Microblog sentiment analysis method using BTCBMA model in Spark big data environment
- Application and research of English composition tangent model based on unsupervised semantic space
- 1D-CNN: Classification of normal delivery and cesarean section types using cardiotocography time-series signals
- Real-time segmentation of short videos under VR technology in dynamic scenes
- Application of emotion recognition technology in psychological counseling for college students
- Classical music recommendation algorithm on art market audience expansion under deep learning
- A robust segmentation method combined with classification algorithms for field-based diagnosis of maize plant phytosanitary state
- Integration effect of artificial intelligence and traditional animation creation technology
- Artificial intelligence-driven education evaluation and scoring: Comparative exploration of machine learning algorithms
- Intelligent multiple-attributes decision support for classroom teaching quality evaluation in dance aesthetic education based on the GRA and information entropy
- A study on the application of multidimensional feature fusion attention mechanism based on sight detection and emotion recognition in online teaching
- Blockchain-enabled intelligent toll management system
- A multi-weapon detection using ensembled learning
- Deep and hand-crafted features based on Weierstrass elliptic function for MRI brain tumor classification
- Design of geometric flower pattern for clothing based on deep learning and interactive genetic algorithm
- Mathematical media art protection and paper-cut animation design under blockchain technology
- Deep reinforcement learning enhances artistic creativity: The case study of program art students integrating computer deep learning
- Transition from machine intelligence to knowledge intelligence: A multi-agent simulation approach to technology transfer
- Research on the TF–IDF algorithm combined with semantics for automatic extraction of keywords from network news texts
- Enhanced Jaya optimization for improving multilayer perceptron neural network in urban air quality prediction
- Design of visual symbol-aided system based on wireless network sensor and embedded system
- Construction of a mental health risk model for college students with long and short-term memory networks and early warning indicators
- Personalized resource recommendation method of student online learning platform based on LSTM and collaborative filtering
- Employment management system for universities based on improved decision tree
- English grammar intelligent error correction technology based on the n-gram language model
- Speech recognition and intelligent translation under multimodal human–computer interaction system
- Enhancing data security using Laplacian of Gaussian and Chacha20 encryption algorithm
- Construction of GCNN-based intelligent recommendation model for answering teachers in online learning system
- Neural network big data fusion in remote sensing image processing technology
- Research on the construction and reform path of online and offline mixed English teaching model in the internet era
- Real-time semantic segmentation based on BiSeNetV2 for wild road
- Online English writing teaching method that enhances teacher–student interaction
- Construction of a painting image classification model based on AI stroke feature extraction
- Big data analysis technology in regional economic market planning and enterprise market value prediction
- Location strategy for logistics distribution centers utilizing improved whale optimization algorithm
- Research on agricultural environmental monitoring Internet of Things based on edge computing and deep learning
- The application of curriculum recommendation algorithm in the driving mechanism of industry–teaching integration in colleges and universities under the background of education reform
- Application of online teaching-based classroom behavior capture and analysis system in student management
- Evaluation of online teaching quality in colleges and universities based on digital monitoring technology
- Face detection method based on improved YOLO-v4 network and attention mechanism
- Study on the current situation and influencing factors of corn import trade in China – based on the trade gravity model
- Research on business English grammar detection system based on LSTM model
- Multi-source auxiliary information tourist attraction and route recommendation algorithm based on graph attention network
- Multi-attribute perceptual fuzzy information decision-making technology in investment risk assessment of green finance Projects
- Research on image compression technology based on improved SPIHT compression algorithm for power grid data
- Optimal design of linear and nonlinear PID controllers for speed control of an electric vehicle
- Traditional landscape painting and art image restoration methods based on structural information guidance
- Traceability and analysis method for measurement laboratory testing data based on intelligent Internet of Things and deep belief network
- A speech-based convolutional neural network for human body posture classification
- The role of the O2O blended teaching model in improving the teaching effectiveness of physical education classes
- Genetic algorithm-assisted fuzzy clustering framework to solve resource-constrained project problems
- Behavior recognition algorithm based on a dual-stream residual convolutional neural network
- Ensemble learning and deep learning-based defect detection in power generation plants
- Optimal design of neural network-based fuzzy predictive control model for recommending educational resources in the context of information technology
- An artificial intelligence-enabled consumables tracking system for medical laboratories
- Utilization of deep learning in ideological and political education
- Detection of abnormal tourist behavior in scenic spots based on optimized Gaussian model for background modeling
- RGB-to-hyperspectral conversion for accessible melanoma detection: A CNN-based approach
- Optimization of the road bump and pothole detection technology using convolutional neural network
- Comparative analysis of impact of classification algorithms on security and performance bug reports
- Cross-dataset micro-expression identification based on facial ROIs contribution quantification
- Demystifying multiple sclerosis diagnosis using interpretable and understandable artificial intelligence
- Unifying optimization forces: Harnessing the fine-structure constant in an electromagnetic-gravity optimization framework
- E-commerce big data processing based on an improved RBF model
- Analysis of youth sports physical health data based on cloud computing and gait awareness
- CCLCap-AE-AVSS: Cycle consistency loss based capsule autoencoders for audio–visual speech synthesis
- An efficient node selection algorithm in the context of IoT-based vehicular ad hoc network for emergency service
- Computer aided diagnoses for detecting the severity of Keratoconus
- Improved rapidly exploring random tree using salp swarm algorithm
- Network security framework for Internet of medical things applications: A survey
- Predicting DoS and DDoS attacks in network security scenarios using a hybrid deep learning model
- Enhancing 5G communication in business networks with an innovative secured narrowband IoT framework
- Quokka swarm optimization: A new nature-inspired metaheuristic optimization algorithm
- Digital forensics architecture for real-time automated evidence collection and centralization: Leveraging security lake and modern data architecture
- Image modeling algorithm for environment design based on augmented and virtual reality technologies
- Enhancing IoT device security: CNN-SVM hybrid approach for real-time detection of DoS and DDoS attacks
- High-resolution image processing and entity recognition algorithm based on artificial intelligence
- Review Articles
- Transformative insights: Image-based breast cancer detection and severity assessment through advanced AI techniques
- Network and cybersecurity applications of defense in adversarial attacks: A state-of-the-art using machine learning and deep learning methods
- Applications of integrating artificial intelligence and big data: A comprehensive analysis
- A systematic review of symbiotic organisms search algorithm for data clustering and predictive analysis
- Modelling Bitcoin networks in terms of anonymity and privacy in the metaverse application within Industry 5.0: Comprehensive taxonomy, unsolved issues and suggested solution
- Systematic literature review on intrusion detection systems: Research trends, algorithms, methods, datasets, and limitations