
Effect of microscopic pore–throat structure heterogeneity on waterflooding seepage characteristics of tight sandstone reservoirs
-
Quanpei Zhang
 ,
Chen Yang
,
Chen Yang

Abstract
Investigations into the complex pore–throat structures (PTS) of tight sandstone reservoirs are vital for optimizing waterflooding strategies. In this study, 13 cores from the Dingbian area of the Ordos Basin were examined using casting thin sections, X-ray diffraction, high-pressure mercury injection (HPMI), and nuclear magnetic resonance (NMR). These analyses quantitatively characterized mineral composition, petrophysical properties, PTS heterogeneity, and fluid mobility. Based on these findings, high-temperature and high-pressure waterflooding experiments were performed to explore dynamic waterflooding behavior and systematic factors influencing fluid mobility and waterflooding efficiency (E w). Results indicate significant differences in fluid mobility across four PTS types, transitioning from uniform displacement (type I) to finger displacement (type IV), with corresponding reductions in movable fluid saturation and E w. Residual oil morphologies evolve from dispersed membranes to continuous clusters and sheet shapes. Integrated HPMI and NMR analysis accurately delineates the full pore–throat size distribution (PSD) (0.0001–10 μm) that exhibit multi-fractal characteristics, enabling differentiation of macropores, mesopores, micropores, and nanopores. Micropores, which are relatively uniform, dominate reservoir petrophysical properties and serve as primary sites for movable fluids. Elevated clay mineral content augments PTS heterogeneity, lowers permeability, and promotes nonlinear seepage phenomena (blockage and bypassing), leading to more extensive residual oil accumulation and reduced E w. Overall, PTS heterogeneity emerges as the principal factor governing fluid mobility and E w, highlighting the importance of full PSD characterization and real seepage condition simulation in reservoir engineering. This study provides key insights into optimizing water injection strategies, suggesting that maintain a stable injection pressure and injection volume multiple of less than 2 pore volumes, while also considering clay mineral sensitivity.
1 Introduction
Tight sandstone reservoirs often suffer from insufficient natural energy and low natural productivity, necessitating water injection development [1,2,3]. However, during the water injection process, issues such as complex pore–throat structure (PTS), high fluid seepage resistance, and poor water absorption capacity in tight sandstone reservoirs lead to notably low oil production rates and poor development effectiveness [4,5,6,7]. These issues pose significant challenges in the development of tight oil reservoirs at home and abroad. Therefore, it is essential to quantitatively study the microscopic PTS characteristics of tight sandstone reservoirs and their impact on waterflooding seepage characteristics and waterflooding efficiency (E w).
The PTS of tight sandstone directly determines the reservoir’s storage capacity and seepage ability and significantly influences the reservoir evaluation and oil recovery rates [5,8,9,10]. At present, various testing methods are used to accurately characterize the multi-scale PTS of tight sandstone reservoirs such as high-pressure mercury injection (HPMI) [11,12], constant-rate mercury injection [11,12,13], nuclear magnetic resonance (NMR) [11,12,13,14,15], low-temperature nitrogen adsorption [14,16], and computed tomography (CT) scanning [8,17]. The characterization of PTS is advancing toward more refined, quantitative, high-precision, and full-size approaches [9,18]. The complex pore–throat configuration and the differential distribution of mineral components in tight reservoirs are direct causes of PTS heterogeneity, which affects the residual oil distribution and development effectiveness in tight oil reservoirs [14,19,20]. Traditional Euclidean geometric methods struggle to quantitatively characterize irregular shapes, while the fractal theory proposed by Mandelbrot in 1975 overcomes this limitation by using fractal dimensions to describe the complexity of irregular pore–throat spaces with self-similarity [21,22,23]. Currently, numerous researchers apply fractal theory to calculate the fractal dimensions of various testing methods that characterize PTS [11,12,14,16]. However, they often overlook the fact that different testing methods represent different pore–throat scales and have conducted limited studies on the heterogeneity of the full pore–throat size distribution (PSD) and the PSD at different scales.
Currently, researchers have conducted extensive studies on the mechanisms of waterflooding seepage, E w, residual oil distribution, and their influencing factors [24,25,26,27,28,29,30,31,32,33,34,35,36,37,38,39,40,41,42]. Research methods used include long core displacement, photolithographic micro-models [24,25], real sandstone micro-models [26,27], CT scanning technology [28,29,30,31], and NMR waterflooding techniques [32,33,34,35]. Among them, long core displacement experiments can determine the relative permeability of the oil–water two-phase system under various displacement pressures and water saturations and can realistically simulate the displacement environment of original reservoirs [36,37]. However, they cannot visually reveal the distribution characteristics of residual oil. Photolithographic micro-models effectively study the seepage mechanisms of waterflooding, but their overly idealized designs differ significantly from the actual PTS and surface physical properties of reservoir rocks [38,39]. Real sandstone micro-models, constructed by sandwiching core samples between glass plates can truly reflect the waterflooding displacement process and visually observe the distribution characteristics of residual oil [26,27]. However, they are challenging to use for simulating high-temperature and high-pressure subsurface displacement environments, and quantitative analysis of images presents significant difficulties. CT scanning technology offers high resolution and can obtain quantitative information about the occurrence and mobilization characteristics of crude oil in three-dimensional pore spaces, as well as the distribution of residual oil, through image processing. However, this method typically requires a lengthy testing period and is expensive [40,41]. NMR waterflooding techniques involve adding an Mn2⁺ solution to simulated formation water to obtain a T 2 relaxation spectrum of the oil phase under various displacement pressures, allowing for quantitative characterization of the mobilization laws of waterflooding through imaging technologies [42]. While the above testing methods can quantitatively investigate the waterflooding characteristics and seepage mechanisms, they have yet to combine high-temperature and high-pressure experimental environments with visual displacement processes. Consequently, they cannot accurately simulate the true fluid states present in actual formations, leading to a lack of accuracy in the simulated results.
To address these issues, this study focuses on 13 tight sandstone core samples from the Chang 7 member of the Yanchang Formation in the Dingbian area of the Ordos Basin. The core holder of the real sandstone micromodel was modified to withstand elevated temperatures and pressures, thus developing a new high-temperature and high-pressure microscopic waterflooding displacement system. This enhanced experimental apparatus enables precise characterization of oil displacement dynamics and residual oil distribution patterns in tight sandstone core samples under simulated reservoir conditions. Furthermore, based on HPMI and NMR test results, the heterogeneity and fluid mobility of full PSD and the pore–throats at different scales in the tight sandstone core were quantitatively characterized. The effects of dynamic and static factors on reservoir fluid mobility and E w were systematically analyzed. Additionally, the types and formation mechanisms of microscopic residual oil were identified. This research provides a basis for improving the effectiveness of waterflooding development in tight sandstone reservoirs.
2 Geological background
The Ordos Basin, located in the central and western regions of China, is the second-largest sedimentary basin in China (Figure 1a and b) [14,43,44]. The western margin of the basin features numerous faults and folds, while the central and eastern parts have relatively simple structures characterized by a gently west-dipping monocline with angles less than 1°. The Dingbian area (study area) spans two tectonic belts: the Yishan Slope and the Tianhuan Depression, both of which have gentle topography without developed faults. During the Late Triassic sedimentary period, this region underwent several cycles of custrine transgression and regression, resulting in a complete continental lacustrine-river-delta sedimentary system. Notably, the Chang 7 member of the Yanchang Formation in the study area represents a peak period of lake basin development, characterized by a coarsening-upward sequence indicative of “lake regression and sand advancement” [45,46]. Based on sedimentary cycles and petrophysical characteristics, the Chang 7 member of the study area is subdivided from bottom to top into the Chang 73, Chang 72, and Chang 71 sub-members, with an overall stratigraphic thickness of approximately 110 m. At the Chang 73 and Chang 72 sub-members, there is a thick sequence of dark mudstones and oil shales, averaging 80.1 m in thickness, which served as the primary source rocks in the basin [47]. The Chang 71 sub-member consists of multi-stage thin layers of fine sandstone to siltstone, averaging 29.3 m in thickness, which served as the target formation of this study and sampling (Figure 1c and d).
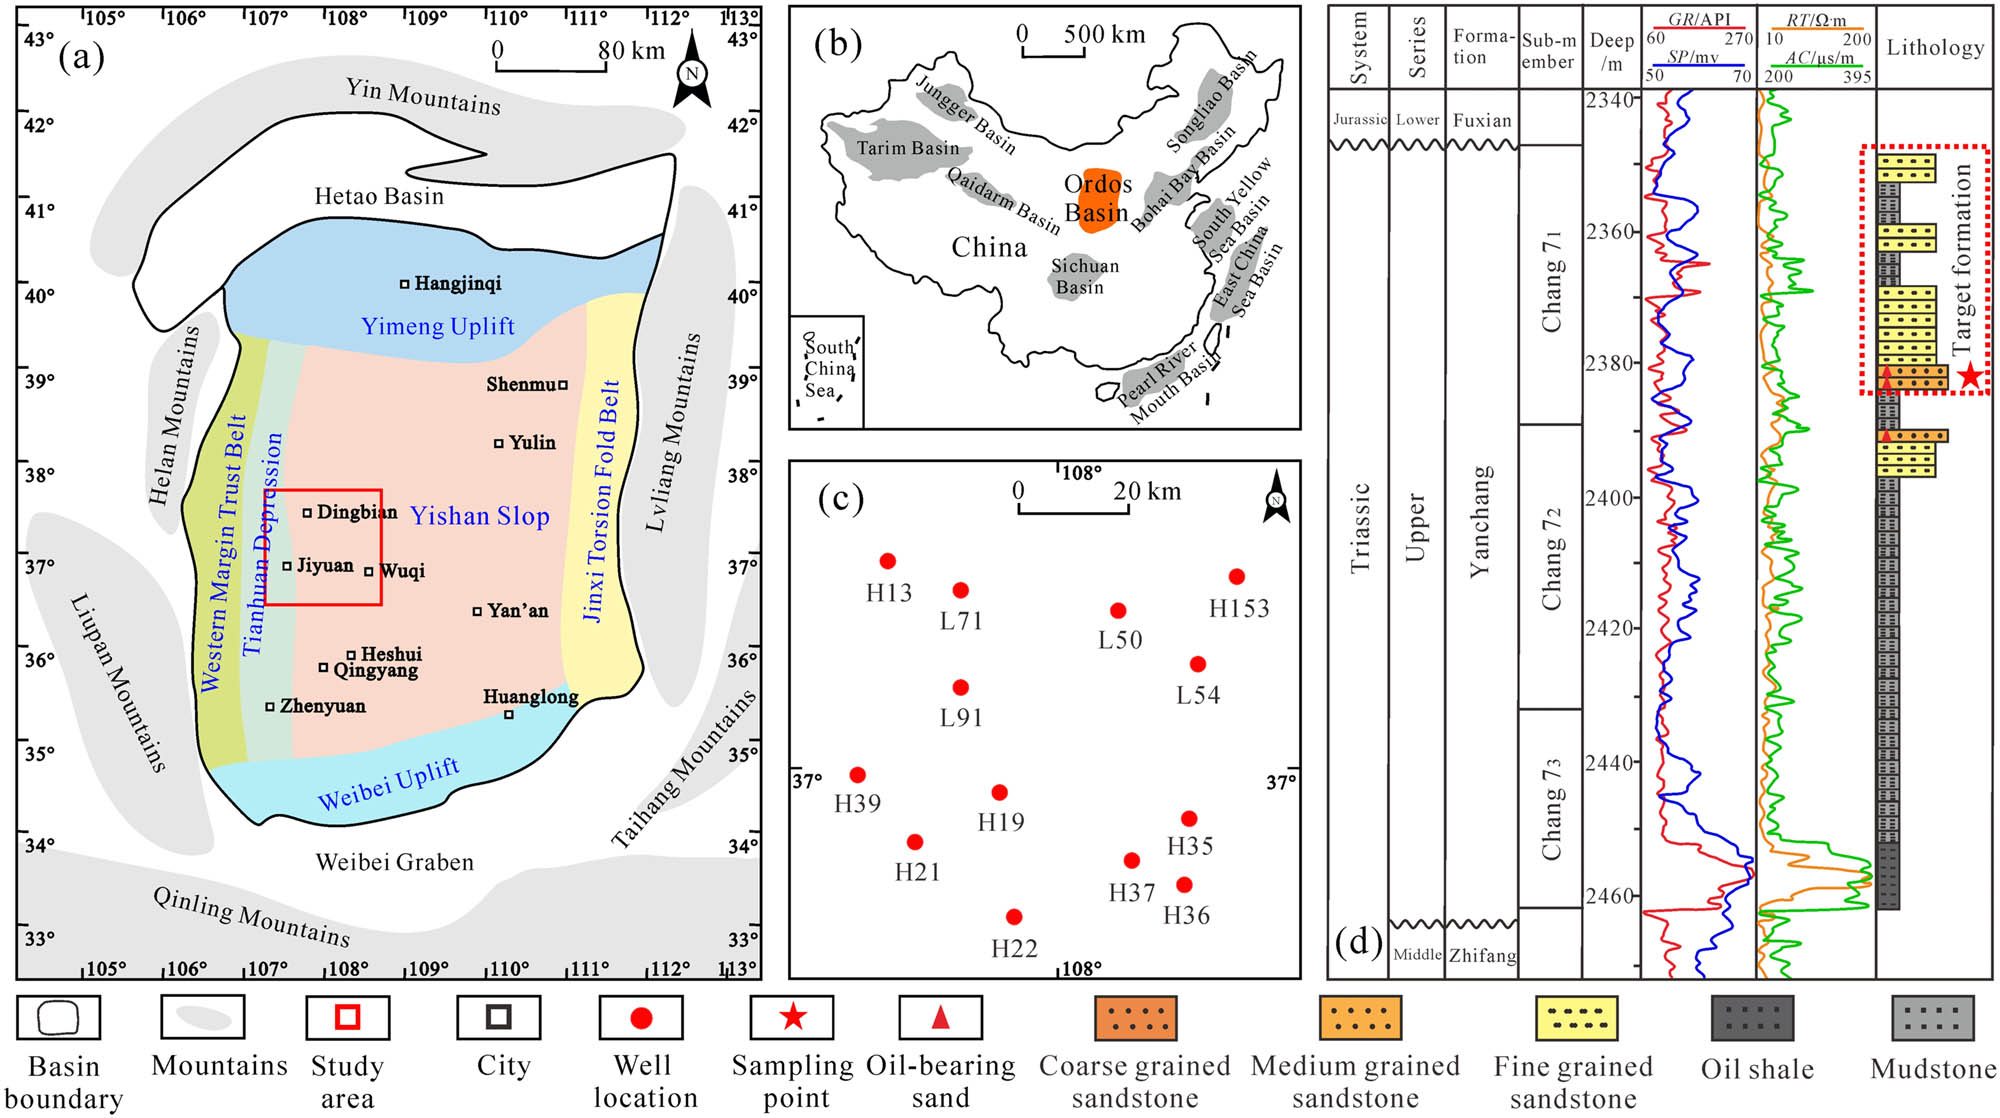
Location map of the study area (a), the Ordos Basin (b), sampling point (c), and the target formation of this study (d).
3 Materials and methods
In this study, 13 tight sandstone samples were collected from the Chang 71 sub-member based on favorable results from previous oil testing. These samples were then drilled into 2.5 cm diameter cylindrical plugs along the formation direction to perform various experiments, including petrophysical property analysis, wettability testing, cast thin sections, scanning electron microscopy (SEM), X-ray diffraction (XRD), HPMI, NMR, and high-temperature and high-pressure waterflooding. To ensure the consistency of test results and mitigate the effects of internal heterogeneity, all experiments were performed on the same sample.
3.1 XRD
The mineralogical composition and content analysis of whole rocks and clay minerals was carried out using the Bruker D8 Advance X-ray diffractometer. Before the experiment, approximately 3–5 g of sample was ground to achieve a uniform powder with a particle size of 40 μm. The dried powder sample was then placed into a glass tube, mixed with distilled water, and thoroughly dispersed using ultrasound. The resulting suspension was poured onto a microscope slide for testing. Based on the parameters such as position, intensity, and width of diffraction peaks, the crystal structure, size, mineral composition, and relative mass content of the sample were determined by fitting with the characteristic spectra of standard minerals.
3.2 NMR and HPMI
The full-scale distribution of PTS was determined by the combination of NMR and HPMI experiments. The NMR tests were performed using the MARAN-2 core analyzer and the PC-102 centrifuge, the samples were saturated with a CaCl2 solution of a total salinity of 50 g/L. Centrifugation at a force of 300 psi was used to obtain movable fluid saturation (MFS). After completion of NMR testing, the samples were dried and subjected to HPMI testing using the AutoPore IV 9520 mercury porosimeter. Based on the Washburn equation, the PTS characteristics were determined by converting the injection pressure of the HPMI into pore–throat radii.
3.3 T 2 spectral transformation and fractal theory
Previous studies have suggested that the uncentrifuged T 2 spectrum characterizes the connected pore space of saturated water, and the transverse relaxation time T 2 is related to the size and shape of the pore space [11,12], following the relationship:
where n is the power index and m is a constant. Therefore, by determining the parameters m and n, the NMR T 2 spectrum of saturated water can be transformed into the full PSD. Specific formula derivations and operational steps have been described in the literature [48,49].
This study employs the widely applied Brooks–Corey model to obtain the fractal dimension of the full PSD. The model assumes that the pore space of the rock consists of a series of capillary bundles [50,51], and the relationship between the cumulative volume percentage V(c) of pore–throat radii less than r and r can be expressed as [52]
where D is the fractal dimension, typically ranging between 2 and 3, with higher values indicating higher PTS heterogeneity, and C is a constant. As seen from equation (2), V(c) is positively linearly correlated with r in a double logarithmic coordinate system. If the full PSD of the core exhibits multi-segment linear relationships, it indicates that the sample has a multi-fractal characteristic. The total fractal dimension (D t ) represents the degree of heterogeneity across the full PSD of the sample and serves as a porosity-weighted average of the fractal dimensions corresponding to different pore–throat types. It can be obtained using the following formula [53]:
3.4 Microscopic high-temperature and high-pressure waterflooding experiment
Thirteen flake core models were subjected to oil cleaning, drying, slicing, and polishing and then bonded between two glass plates. The length, width, and thickness of the sandstone model were 2.5, 2.5, and 0.065 cm, respectively (Figure 2a). The glass plates were heat-resistant (up to 150°C), pressure-resistant (up to 20.0 MPa), and explosion-proof tempered glass. The experimental temperature was controlled at approximately 65°C, with a maximum fluid displacement pressure of 16.0 MPa. The experimental water used was the same as for the NMR tests and was dyed with a small amount of methylene blue to make the formation water appear blue. A mixture of kerosene and vacuum pump oil in a certain ratio was used to prepare the simulated crude oil, with a viscosity of 1.45 mPa s at 65°C, and was dyed with a small amount of oil-soluble red to make the crude oil appear red, facilitating the observation of oil–water displacement characteristics.
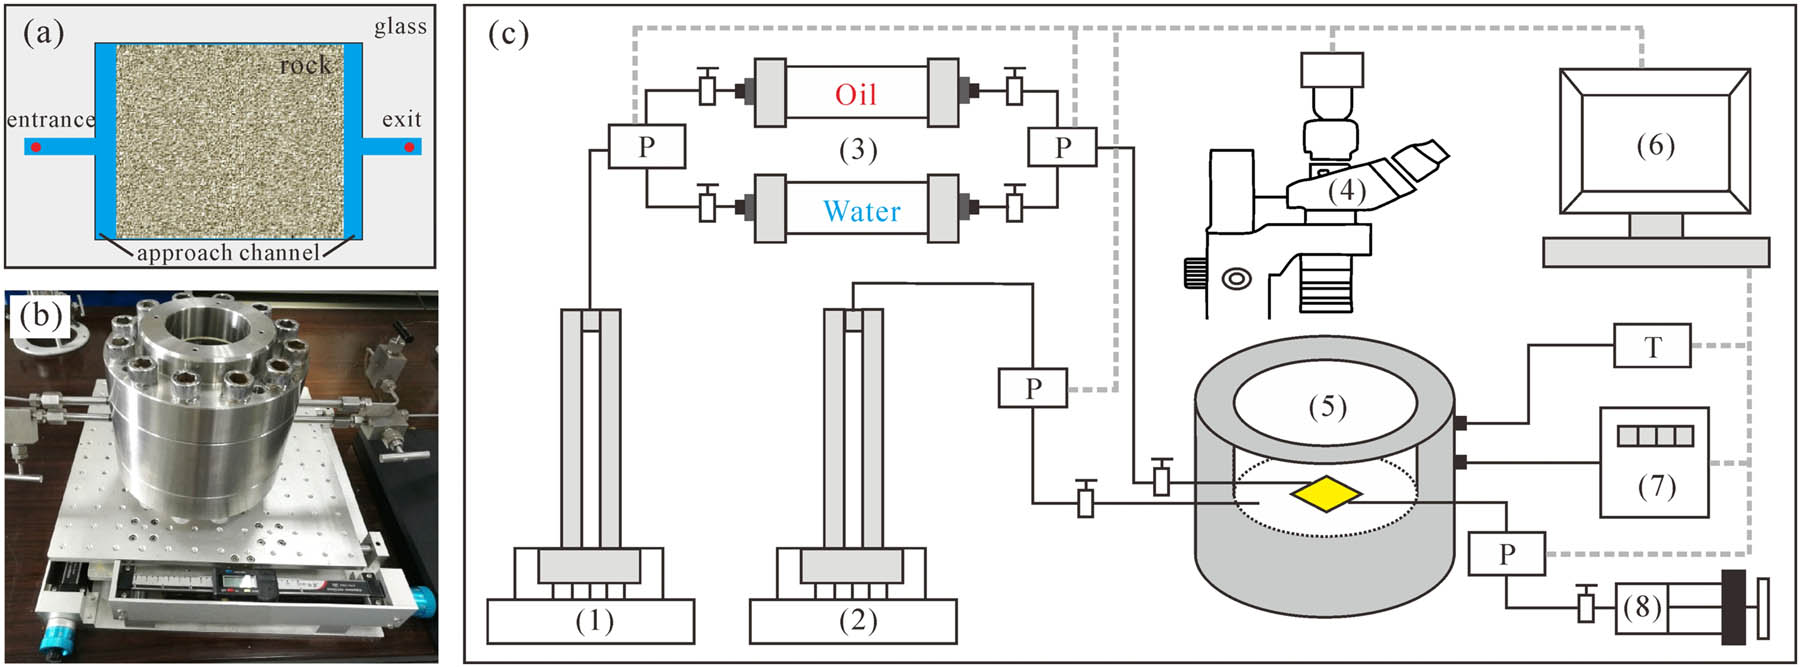
Schematic diagram of the waterflooding experiment setup: (a) sandstone model diagram; (b) high-temperature and high-pressure reactors; and (c) experimental device, wherein (1) positive displacement pump; (2) confining pressure pump; (3) fluid tank; (4) stereomicroscopes; (5) high-temperature and high-pressure reactors; (6) computer; (7) metering device; and (8) hand pump.
The real core microscopic model displacement experiment mainly consists of a high-temperature and high-pressure reactor (Figure 2b), constant-speed and constant-pressure pumps, a constant-temperature system, a stereomicroscope, a metering device, a computer, and an image acquisition system (Figure 2c). The visual high-temperature and high-pressure reactor with an upper visual window was used to hold the sandstone models, through which the seepage process could be observed and recorded with the stereomicroscope. The computer and metering device were used to record the pressure difference and stabilized flow rates between the two ends of the model, as well as to analyze and process the captured images. The constant-speed and constant-pressure pumps included a positive displacement pump and a confining pressure pump. The positive displacement pump was used to pressurize the displacement fluid, while the confining pressure pump simulated the overburden pressure of the rock and protected the sandstone model. The hand pressure pump was used to maintain system pressure, and the constant-temperature system heated the model.
4 Results
4.1 Petrophysical properties and mineral composition characteristics
The wettability of 13 samples was determined to be neutral to weakly hydrophilic using the spontaneous imbibition method. The porosity of each sample was essentially between 6.45 and 11.78%, averaging 8.79% (Table 1). The permeability mainly ranged between 0.050 and 0.433 × 10⁻3 μm2, averaging 0.199 × 10⁻3 μm2, indicating poor petrophysical properties. The XRD test results showed that the mineral composition of each sample consisted mainly of feldspar, quartz, calcite, and clay minerals, corresponding to mass percentages of 42.75, 39.73, 3.58, and 13.61%, respectively, indicating moderate compositional maturity. Among the clay minerals, illite was the primary component, followed by chlorite and kaolinite, with a minimal amount of illite–smectite (I/S) mixed layer. Their average relative contents were 52.35, 23.67, 17.94, and 6.04%, respectively. The lower petrophysical properties and the higher clay mineral content suggest a strong cementation degree and complex PTS in the sandstone samples.
The porosity, permeability, mineral composition, and content of 13 samples
| Sample | Deep (m) | Porosity (%) | Permeability (×10−3 μm2) | Detrital component content from XRD (%) | Relative content of clay minerals (%) | ||||||||
|---|---|---|---|---|---|---|---|---|---|---|---|---|---|
| Quartz | Feldspar | Calcite | Dolomite | Siderite | Clay | Illite | Chlorite | Kaolinite | I/S | ||||
| L50 | 2185.45 | 11.78 | 0.351 | 38.26 | 45.91 | 5.60 | — | 0.15 | 10.08 | 23.77 | 38.67 | 23.00 | 14.55 |
| L54 | 2184.94 | 11.19 | 0.433 | 38.73 | 49.00 | 4.48 | 1.00 | 0.08 | 6.72 | 36.99 | 28.70 | 16.23 | 18.07 |
| H153 | 2394.52 | 10.09 | 0.202 | 41.84 | 43.10 | 2.24 | 0.50 | — | 12.32 | 36.70 | 32.27 | 22.14 | 8.88 |
| H35 | 2065.72 | 10.20 | 0.296 | 37.44 | 45.76 | 6.72 | — | — | 10.08 | 51.67 | 23.90 | 18.40 | 6.03 |
| H36 | 2074.37 | 8.24 | 0.194 | 36.60 | 48.59 | 1.12 | 0.25 | — | 13.44 | 62.47 | 10.79 | 25.52 | 1.22 |
| H37 | 2088.72 | 8.97 | 0.258 | 51.43 | 41.15 | 1.12 | 0.25 | 0.45 | 5.60 | 50.07 | 14.38 | 25.47 | 10.08 |
| L91 | 2372.01 | 9.05 | 0.228 | 48.59 | 45.12 | 0.56 | 0.13 | — | 5.60 | 49.67 | 27.88 | 18.71 | 3.74 |
| L71 | 2331.25 | 7.34 | 0.123 | 38.90 | 42.25 | 1.68 | 0.38 | — | 16.80 | 67.00 | 18.41 | 11.06 | 3.53 |
| H13 | 2673.59 | 8.99 | 0.208 | 37.98 | 39.06 | 7.28 | — | — | 15.68 | 61.57 | 12.20 | 23.87 | 2.36 |
| H39 | 2386.07 | 7.32 | 0.113 | 38.05 | 40.36 | 3.92 | 0.88 | — | 16.80 | 60.94 | 30.97 | 8.00 | 0.08 |
| H19 | 2184.94 | 6.45 | 0.050 | 37.72 | 38.76 | 3.36 | — | — | 20.16 | 52.70 | 25.09 | 20.12 | 2.09 |
| H21 | 2183.01 | 7.74 | 0.053 | 33.86 | 40.64 | 2.80 | — | 0.30 | 22.40 | 68.21 | 21.42 | 8.50 | 1.87 |
| H22 | 2186.56 | 6.88 | 0.080 | 37.07 | 36.05 | 5.60 | — | — | 21.28 | 58.73 | 23.07 | 12.18 | 6.02 |
4.2 Pore and throat types
According to the results of casting thin sections and SEM, the pore types in each sample consist of dissolution pores, residual intergranular pores, and intercrystalline pores. These dissolution pores include feldspar dissolution pores (Figure 3a and c), lithic dissolution pores, and intergranular dissolution pores, corresponding to the average face ratio of 1.15, 0.08, and 0.05%, respectively. The dissolution pores have complex shapes, and some feldspar grains are completely dissolved to form moldic pores with larger pore sizes, which has a positive effect on improving reservoir properties. Residual intergranular pores (average face ratio of 1.04%) are primary pores remaining after compaction and cementation of the reservoir (Figure 3b). These pores have irregular shapes and large diameters, with lining chlorite and hair-like illite often occurring along the pore edges. Intercrystalline pores (average face ratio of 0.04%) are micro-pores formed by clay minerals filling intergranular pores and dissolution pores generated by reservoir cementation (Figure 3a and c), and the pore spaces are fine and complex. The throat types in each sample are primarily sheet-shaped, bent sheet-shaped (Figure 3b and d), and tubular. Sheet-shaped and bent sheet-shaped throats indicate that the rock particles have undergone strong compaction, compressing the throats into narrow elongated ribbons, making it difficult for them to connect with surrounding large pores. Tubular throats primarily consist of clay minerals filling pores, splitting them into irregularly sized, tube-shaped, or bundle-shaped intercrystalline pores, thereby reducing the connectivity between pores and throats (Figure 3e and f).
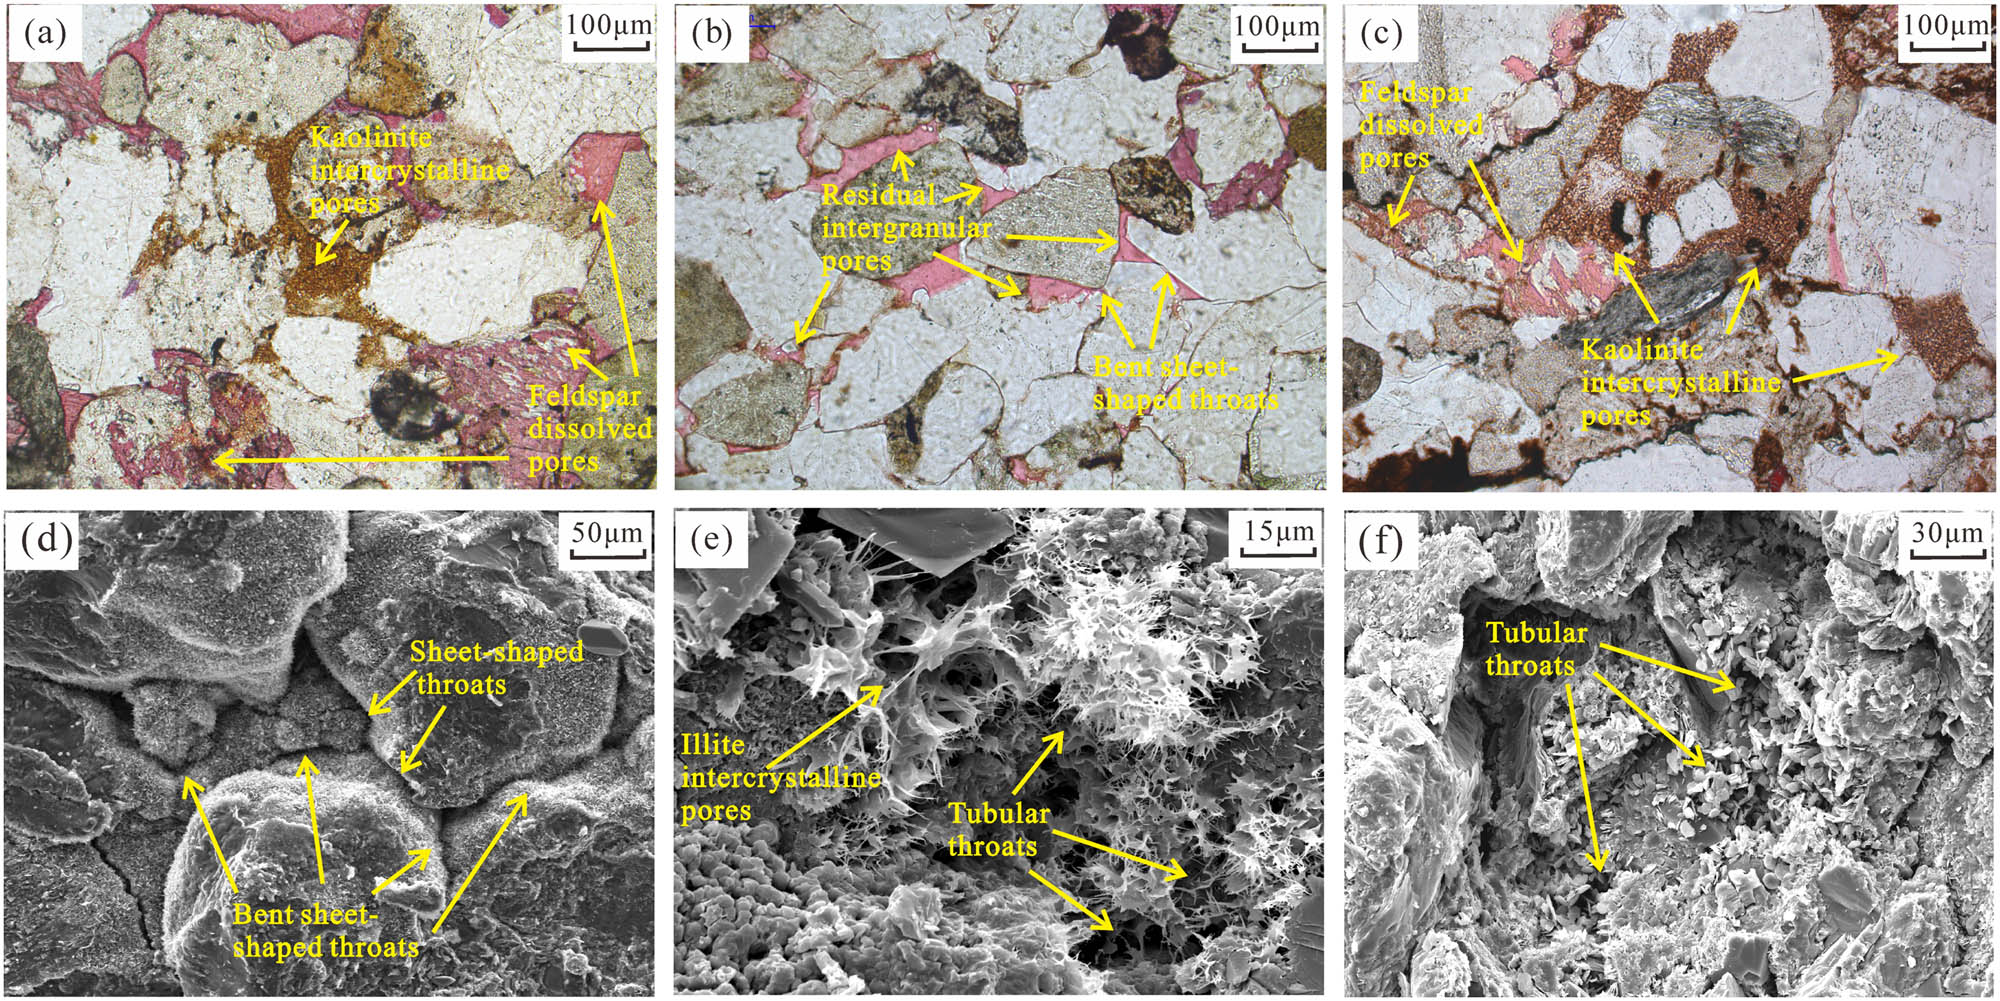
Pore and throat types of typical samples: (a) Feldspar dissolution pores and kaolinite intercrystalline pores, L54, 2184.94 m; (b) residual intergranular pores and bent sheet-shaped throats, H36, 2,074.37 m; (c) kaolinite filled the feldspar dissolved pores and formed intercrystalline pores, H13, 2673.59 m; (d) development of sheet-shaped and bent sheet-shaped throats, and the chlorite film attached to the surface of the particles, L71, 2331.25 m; (e) illite filled pores and formed intercrystalline pores and tubular throats, H37, 2088.72 m; (f) kaolinite filled pores and formed a tubular throat, H21, 2183.01 m.
4.3 HPMI results
Based on the morphology of the HPMI capillary pressure curves (Figure 4a), PSD curves (Figure 4b), and PTS parameters (Table 2), the PTS of the 13 samples were divided into four categories. From type I to type IV, the capillary pressure curves shift progressively upward, with the threshold pressure (P t) increasing accordingly (averaging 0.43, 0.69, 1.18, and 4.23 MPa, respectively). Accordingly, the PSD curves exhibit single-peak distributions, with the peak of the pore–throat radius gradually shifting to the left. The average pore–throat radius (R a) (averaging 0.30, 0.19, 0.12, and 0.02 μm, respectively) and the maximum pore–throat radius (R max) (averaging 1.71, 1.06, 0.71, and 0.21 μm, respectively) progressively decreased. Additionally, the maximum mercury injection saturation (S max) (averaging 85.18, 80.18, 75.86, and 58.64%, respectively) and the mercury withdrawal efficiency (W e) (averaging 50.09, 43.20, 37.89, and 15.89%, respectively) decreased sequentially, indicating that the reservoir space and pore–throat connectivity gradually deteriorated between the four types of samples. However, there are significant differences in the sorting coefficient (S P) and homogeneity coefficient (α) of the four types of PTS, indicating complex pore–throat configurations and strong PTS heterogeneity in tight sandstone samples. Types I and III have lower S P (averaging 2.66 and 2.09, respectively) and higher α (averaging 0.23 and 0.27, respectively), indicating that the PSD has good sorting and concentration. The difference lies in that type I PTS developed larger pore–throat than type III PTS. Type II and IV PTSs have higher S P (averaging 3.00 and 4.39, respectively) and lower α (averaging 0.17 and 0.13, respectively), indicating poor sorting and non-uniform PSD. Type II PTS simultaneously develops numerous large and small pore–throats with good pore–throat configuration and connectivity, resulting in higher W e and petrophysical properties. In contrast, type IV PTS develops numerous nanoscale pore–throats with the strongest PTS heterogeneity and the worst petrophysical properties.
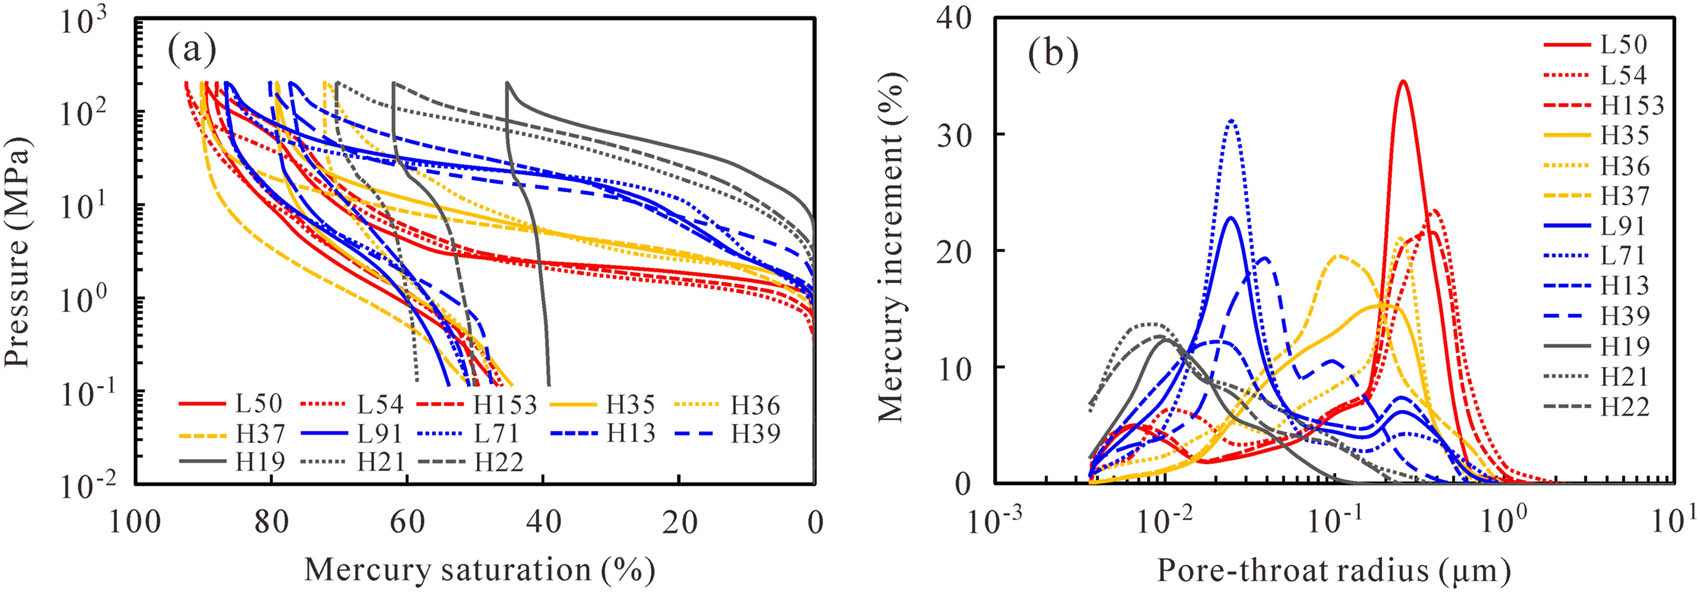
Characteristics of capillary pressure curves (a) and PSD curves (b) obtained by HPMI.
Results of HPMI, NMR, and waterflooding experiments
| Type | Sample | HPMI | NMR | Waterflooding | ||||||||
|---|---|---|---|---|---|---|---|---|---|---|---|---|
| P t (MPa) | R max (μm) | R a (μm) | S p | α | S max (%) | W e (%) | MFS (%) | T 2cutoff (ms) | S io (%) | E w (%) | ||
| Ⅰ | L50 | 0.47 | 1.57 | 0.27 | 2.82 | 0.24 | 86.68 | 50.03 | 52.98 | 28.89 | 67.91 | 46.83 |
| L54 | 0.39 | 1.89 | 0.33 | 3.03 | 0.26 | 81.69 | 52.11 | 62.16 | 12.52 | 61.89 | 55.70 | |
| H153 | 0.44 | 1.66 | 0.30 | 2.13 | 0.19 | 87.16 | 48.13 | 56.59 | 16.54 | 71.36 | 51.37 | |
| Ⅱ | H35 | 0.71 | 1.04 | 0.17 | 3.00 | 0.19 | 85.71 | 45.79 | 54.65 | 11.66 | 62.37 | 47.80 |
| H36 | 0.75 | 0.97 | 0.19 | 3.17 | 0.17 | 76.45 | 41.93 | 46.48 | 12.54 | 55.77 | 42.21 | |
| H37 | 0.62 | 1.18 | 0.22 | 2.83 | 0.14 | 78.39 | 41.86 | 49.12 | 7.24 | 53.67 | 40.41 | |
| Ⅲ | L91 | 0.76 | 0.97 | 0.18 | 2.46 | 0.26 | 75.93 | 40.26 | 53.01 | 7.65 | 52.96 | 44.99 |
| L71 | 1.44 | 0.51 | 0.13 | 2.05 | 0.25 | 76.71 | 32.67 | 46.54 | 5.99 | 51.58 | 39.77 | |
| H13 | 0.78 | 0.94 | 0.13 | 2.17 | 0.28 | 71.42 | 39.56 | 41.50 | 9.24 | 47.44 | 34.60 | |
| H39 | 1.73 | 0.42 | 0.06 | 1.69 | 0.31 | 79.41 | 39.07 | 38.78 | 13.04 | 50.46 | 32.04 | |
| Ⅳ | H19 | 7.09 | 0.10 | 0.02 | 4.73 | 0.12 | 44.83 | 13.02 | 25.26 | 0.51 | 46.59 | 22.28 |
| H21 | 2.79 | 0.26 | 0.03 | 3.77 | 0.15 | 69.69 | 16.23 | 32.12 | 0.53 | 45.38 | 25.31 | |
| H22 | 2.79 | 0.26 | 0.03 | 4.69 | 0.12 | 61.38 | 18.43 | 35.77 | 0.66 | 40.36 | 27.56 | |
4.4 Full PSD and fractal characteristics
NMR testing offers a non-destructive method for the comprehensive characterization of pore–throat spaces. As shown from the NMR saturated water T 2 spectrum (Figure 5a), type I, III, and IV samples exhibit single-peak distribution characteristics with peaks increasingly shifted to the left, while type II samples display a bimodal feature. This is consistent with the findings from HPMI, which suggests that type II samples have a greater development of large and small pore–throats. The PSD curves obtained from HPMI were used to convert the NMR-saturated water T 2 spectrum, quantitatively characterizing the full PSD of tight sandstone samples. The results indicate that the full PSD for each sample is between 0.0001 and 10 μm (Figure 5b).
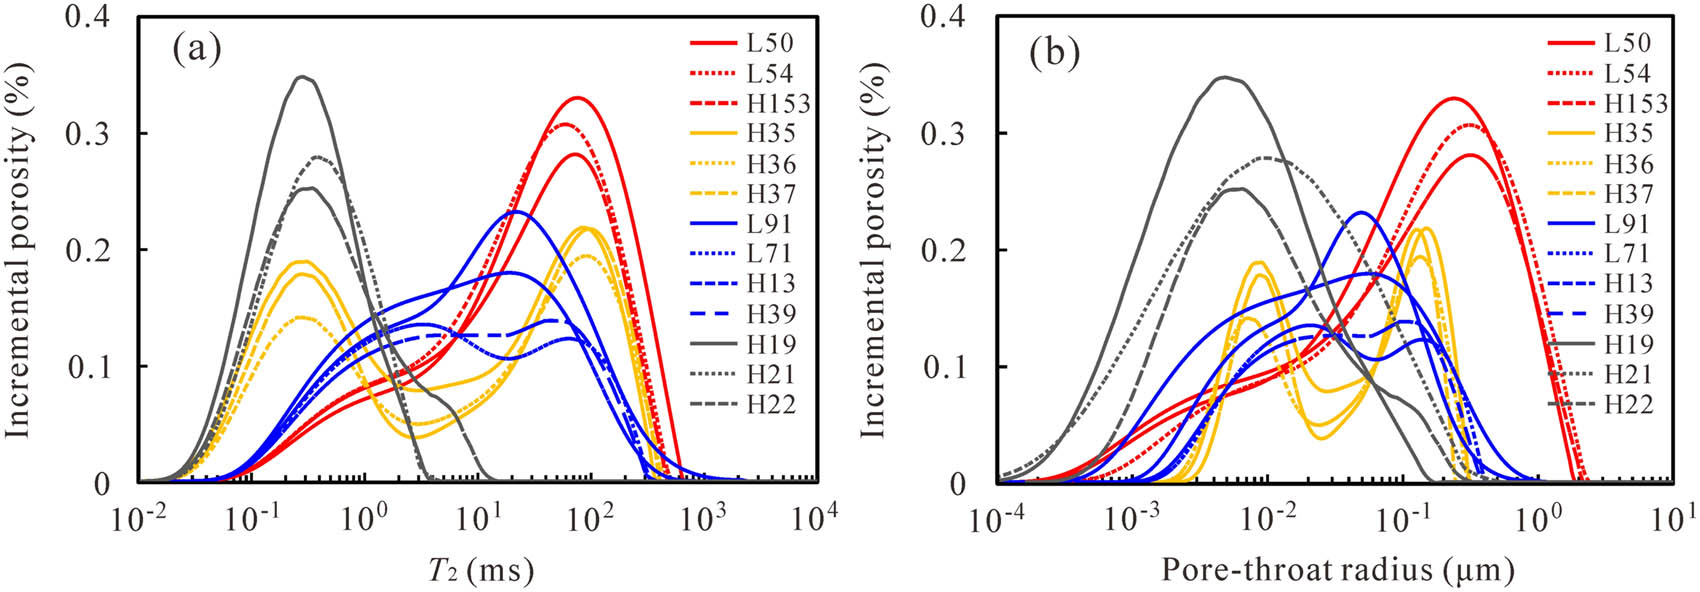
NMR saturated water T 2 spectrum curves (a) and full PSD curves (b) of 13 samples.
By plotting the Lg V(c) and Lg r curves of each sample (Figure 6), it is found that the fractal characteristic curves of the full PSD exhibit a distinct multi-segment pattern rather than a straight line, with significant inflection points at pore–throat radii of 1, 0.1, and 0.01 μm. This indicates that the PTS of tight sandstone samples have multi-fractal characteristics. Based on these fractal inflection points, the pore–throat spaces of tight sandstone samples are divided into macropores (>1 μm), mesopores (0.1–1 μm), micropores (0.01–0.1 μm), and nanopores (<0.01 μm), and the corresponding fractal dimensions were defined as D 1, D 2, D 3, and D 4, respectively. The fractal dimensions for each pore–throat type across all samples exhibit the relationship D 1 > D 2 > D 3 > D 4, with corresponding average fractal dimensions of 2.8509, 2.8189, 2.5462, and 2.3143, respectively (Table 3). This indicates self-similarity within each pore–throat type, with different levels of complexity. Macropores and mesopores with larger pore–throat radii are more susceptible to the filling and transformation of clay minerals, resulting in stronger PTS heterogeneity, while micropores and nanopores with higher proportions and relatively smaller pore–throat radii exhibit better overall homogeneity and similarity, corresponding to smaller fractal dimensions. Furthermore, the D t value for each sample ranges from 2.2373 to 2.8712, with an average value of 2.5630, indicating strong overall PTS heterogeneity. Moreover, the D t value increases progressively from type I to type IV PTS, with average values of 2.3571, 2.4728, 2.6293, and 2.7709, respectively.
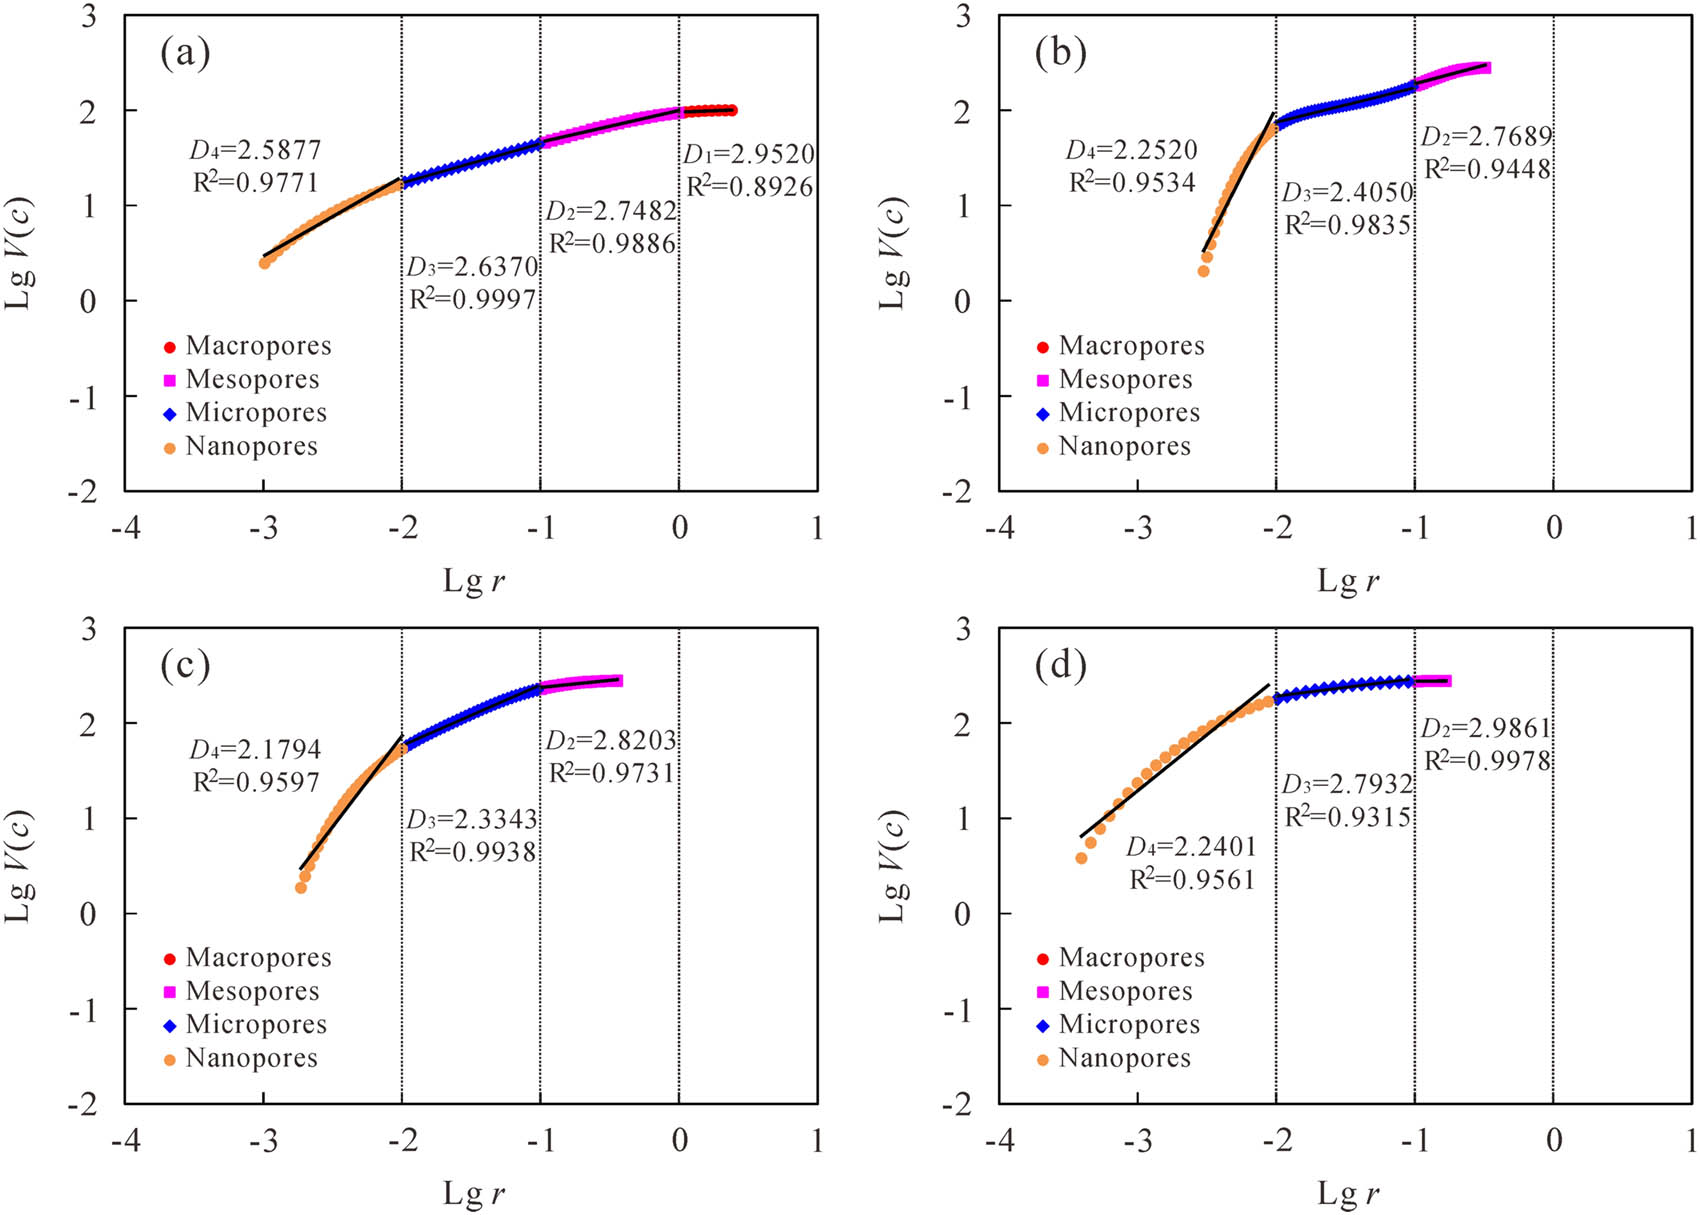
Fractal characteristic curves of typical samples H153 (a), H36 (b), L91 (c), and H19 (d) in the four types of PTS.
MFS, permeability contribution values, and fractal dimensions of different pore–throat spaces in each sample
| Sample | Macropores | Mesopores | Micropores | Nanopores | D t | ||||||||
|---|---|---|---|---|---|---|---|---|---|---|---|---|---|
| MFS (%) | K 1 (×10−3 μm2) | D 1 | MFS (%) | K 2 (×10−3 μm2) | D 2 | MFS (%) | K 3 (×10−3 μm2) | D 3 | MFS (%) | K 4 (×10−3 μm2) | D 4 | ||
| L50 | 2.18 | 0.146012 | 2.8731 | 27.82 | 0.202863 | 2.6626 | 15.62 | 0.001957 | 2.5488 | 7.36 | 7.2 × 10⁻⁶ | 2.3481 | 2.3974 |
| L54 | 3.83 | 0.226637 | 2.7275 | 33.89 | 0.205104 | 2.7705 | 16.54 | 0.001412 | 2.5869 | 7.89 | 7.01 × 10⁻⁶ | 2.3832 | 2.4366 |
| H153 | 2.46 | 0.090245 | 2.9520 | 28.13 | 0.110744 | 2.7482 | 16.16 | 0.000887 | 2.6370 | 9.83 | 4.09 × 10⁻⁶ | 2.5877 | 2.2373 |
| H35 | — | — | — | 16.62 | 0.265513 | 2.7680 | 22.81 | 0.030057 | 2.4623 | 15.23 | 0.00039 | 2.2041 | 2.4170 |
| H36 | — | — | — | 14.88 | 0.171275 | 2.7689 | 18.63 | 0.022544 | 2.4050 | 12.97 | 0.000221 | 2.2520 | 2.5260 |
| H37 | — | — | — | 14.90 | 0.219097 | 2.7249 | 21.33 | 0.038904 | 2.4076 | 12.90 | 0.000425 | 2.2782 | 2.4754 |
| L91 | — | — | — | 8.89 | 0.271254 | 2.8203 | 31.55 | 0.056103 | 2.3343 | 12.57 | 0.000355 | 2.1794 | 2.4244 |
| L71 | — | — | — | 11.65 | 0.111571 | 2.8408 | 24.17 | 0.011797 | 2.2467 | 10.72 | 0.000112 | 2.3486 | 2.6845 |
| H13 | — | — | — | 8.46 | 0.192561 | 2.7643 | 19.30 | 0.014977 | 2.5875 | 13.74 | 0.000124 | 2.3495 | 2.6875 |
| H39 | — | — | — | 9.19 | 0.09793 | 2.8704 | 20.86 | 0.014856 | 2.5732 | 8.73 | 0.000109 | 2.4004 | 2.7206 |
| H19 | — | — | — | 0.20 | 0.045 | 2.9861 | 7.95 | 0.003727 | 2.7932 | 17.10 | 0.001347 | 2.2401 | 2.8712 |
| H21 | — | — | — | 1.90 | 0.037768 | 2.9341 | 12.87 | 0.015166 | 2.7147 | 17.35 | 0.00028 | 2.3381 | 2.7537 |
| H22 | — | — | — | 1.78 | 0.054855 | 2.9871 | 13.07 | 0.024526 | 2.8029 | 20.92 | 0.000684 | 2.1768 | 2.6878 |
4.5 Fluid mobility
Table 2 shows the movable fluid parameters derived from NMR for 13 samples, with the MFS for each sample ranging from 25.26 to 62.16%, averaging 45.77%. This indicates overall low fluid mobility in tight sandstone samples, with most of the pore–throat spaces occupied by bound fluids. The MFS decreases sequentially for the four types of PTS, with average values of 57.24, 50.09, 44.96, and 31.05%, respectively. Furthermore, the proportion, MFS, and permeability contribution values of different pore–throat types were statistically analyzed to quantitatively assess the fluid mobility of tight sandstone samples (Table 3 and Figure 7). The results show that micropores have the highest fluid mobility among the 13 samples (average MFS of 18.53%), primarily due to their large reservoir space (averaging 40.75%) and their significant contribution to permeability (averaging 0.0182 × 10⁻³ μm2), which facilitates the occurrence and seepage of mobile fluids. Mesopores and nanopores show relatively high fluid mobility (average MFS of 13.72 and 12.87%, respectively), with similar proportions of reservoir space (averaging 26.70 and 31.43%, respectively), but mesopores have significantly higher permeability contribution values than nanopores (averaging 0.1528 × 10⁻³ and 0.0003 × 10⁻³ μm2, respectively). Macropores develop only in type I PTS, with the largest pore–throat radii and permeability contribution values (averaging 0.1543 × 10⁻³ μm2), but their development is limited (average proportion of 1.12%) and reduces pore–throat interconnectivity, resulting in the lowest MFS (averaging 2.82%).
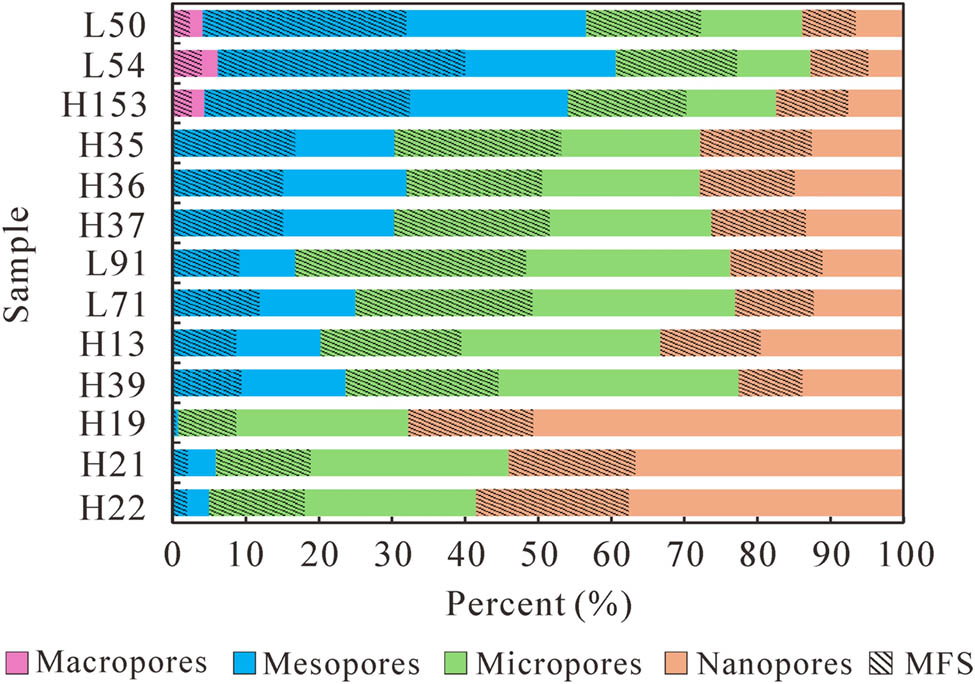
Proportion of different pore–throat types and distribution of MFS in each sample.
From the perspective of PTS classification, type I PTS have higher development of mesopores (average proportion of 52.25%) and greater seepage capability (average permeability contribution value of 0.1729 × 10⁻³ μm2), resulting in higher fluid mobility for mesopores (average MFS of 29.95%). In types II and III PTS, macropores are absent and the proportion of mesopores decreases (average proportions of 30.92 and 21.47%, respectively), resulting in mainly movable fluid being present in micropores (average MFS of 20.92 and 23.97%, respectively). In type IV PTS, movable fluids are mainly present in nanopores (average MFS of 18.46%). Although nanopores are more developed (average proportion of 60.08%), their smaller pore–throat radii result in lower connectivity and percolation ability, resulting in poor overall fluid mobility.
4.6 Microscopic waterflooding characteristics
The waterflooding results for each sample showed that the initial oil saturation (S io) ranged from 40.36 to 71.36%, averaging 54.44%, while the average E w was 39.07% (Table 2), indicating that most of the crude oil remained undisplaced and trapped in the pore–throat spaces. Significant differences in oil–water seepage paths and residual oil distribution characteristics were observed among different PTSs (Figure 8). From type I to type IV PTS, the waterflooding patterns with decreasing core permeability and deterioration of PTS successively showed uniform, network, finger-network, and finger displacement, and the morphology of residual oil gradually transitioned from scattered membranous, angular, isolated, and patchy shapes to continuous cluster and sheet shapes [38,54].
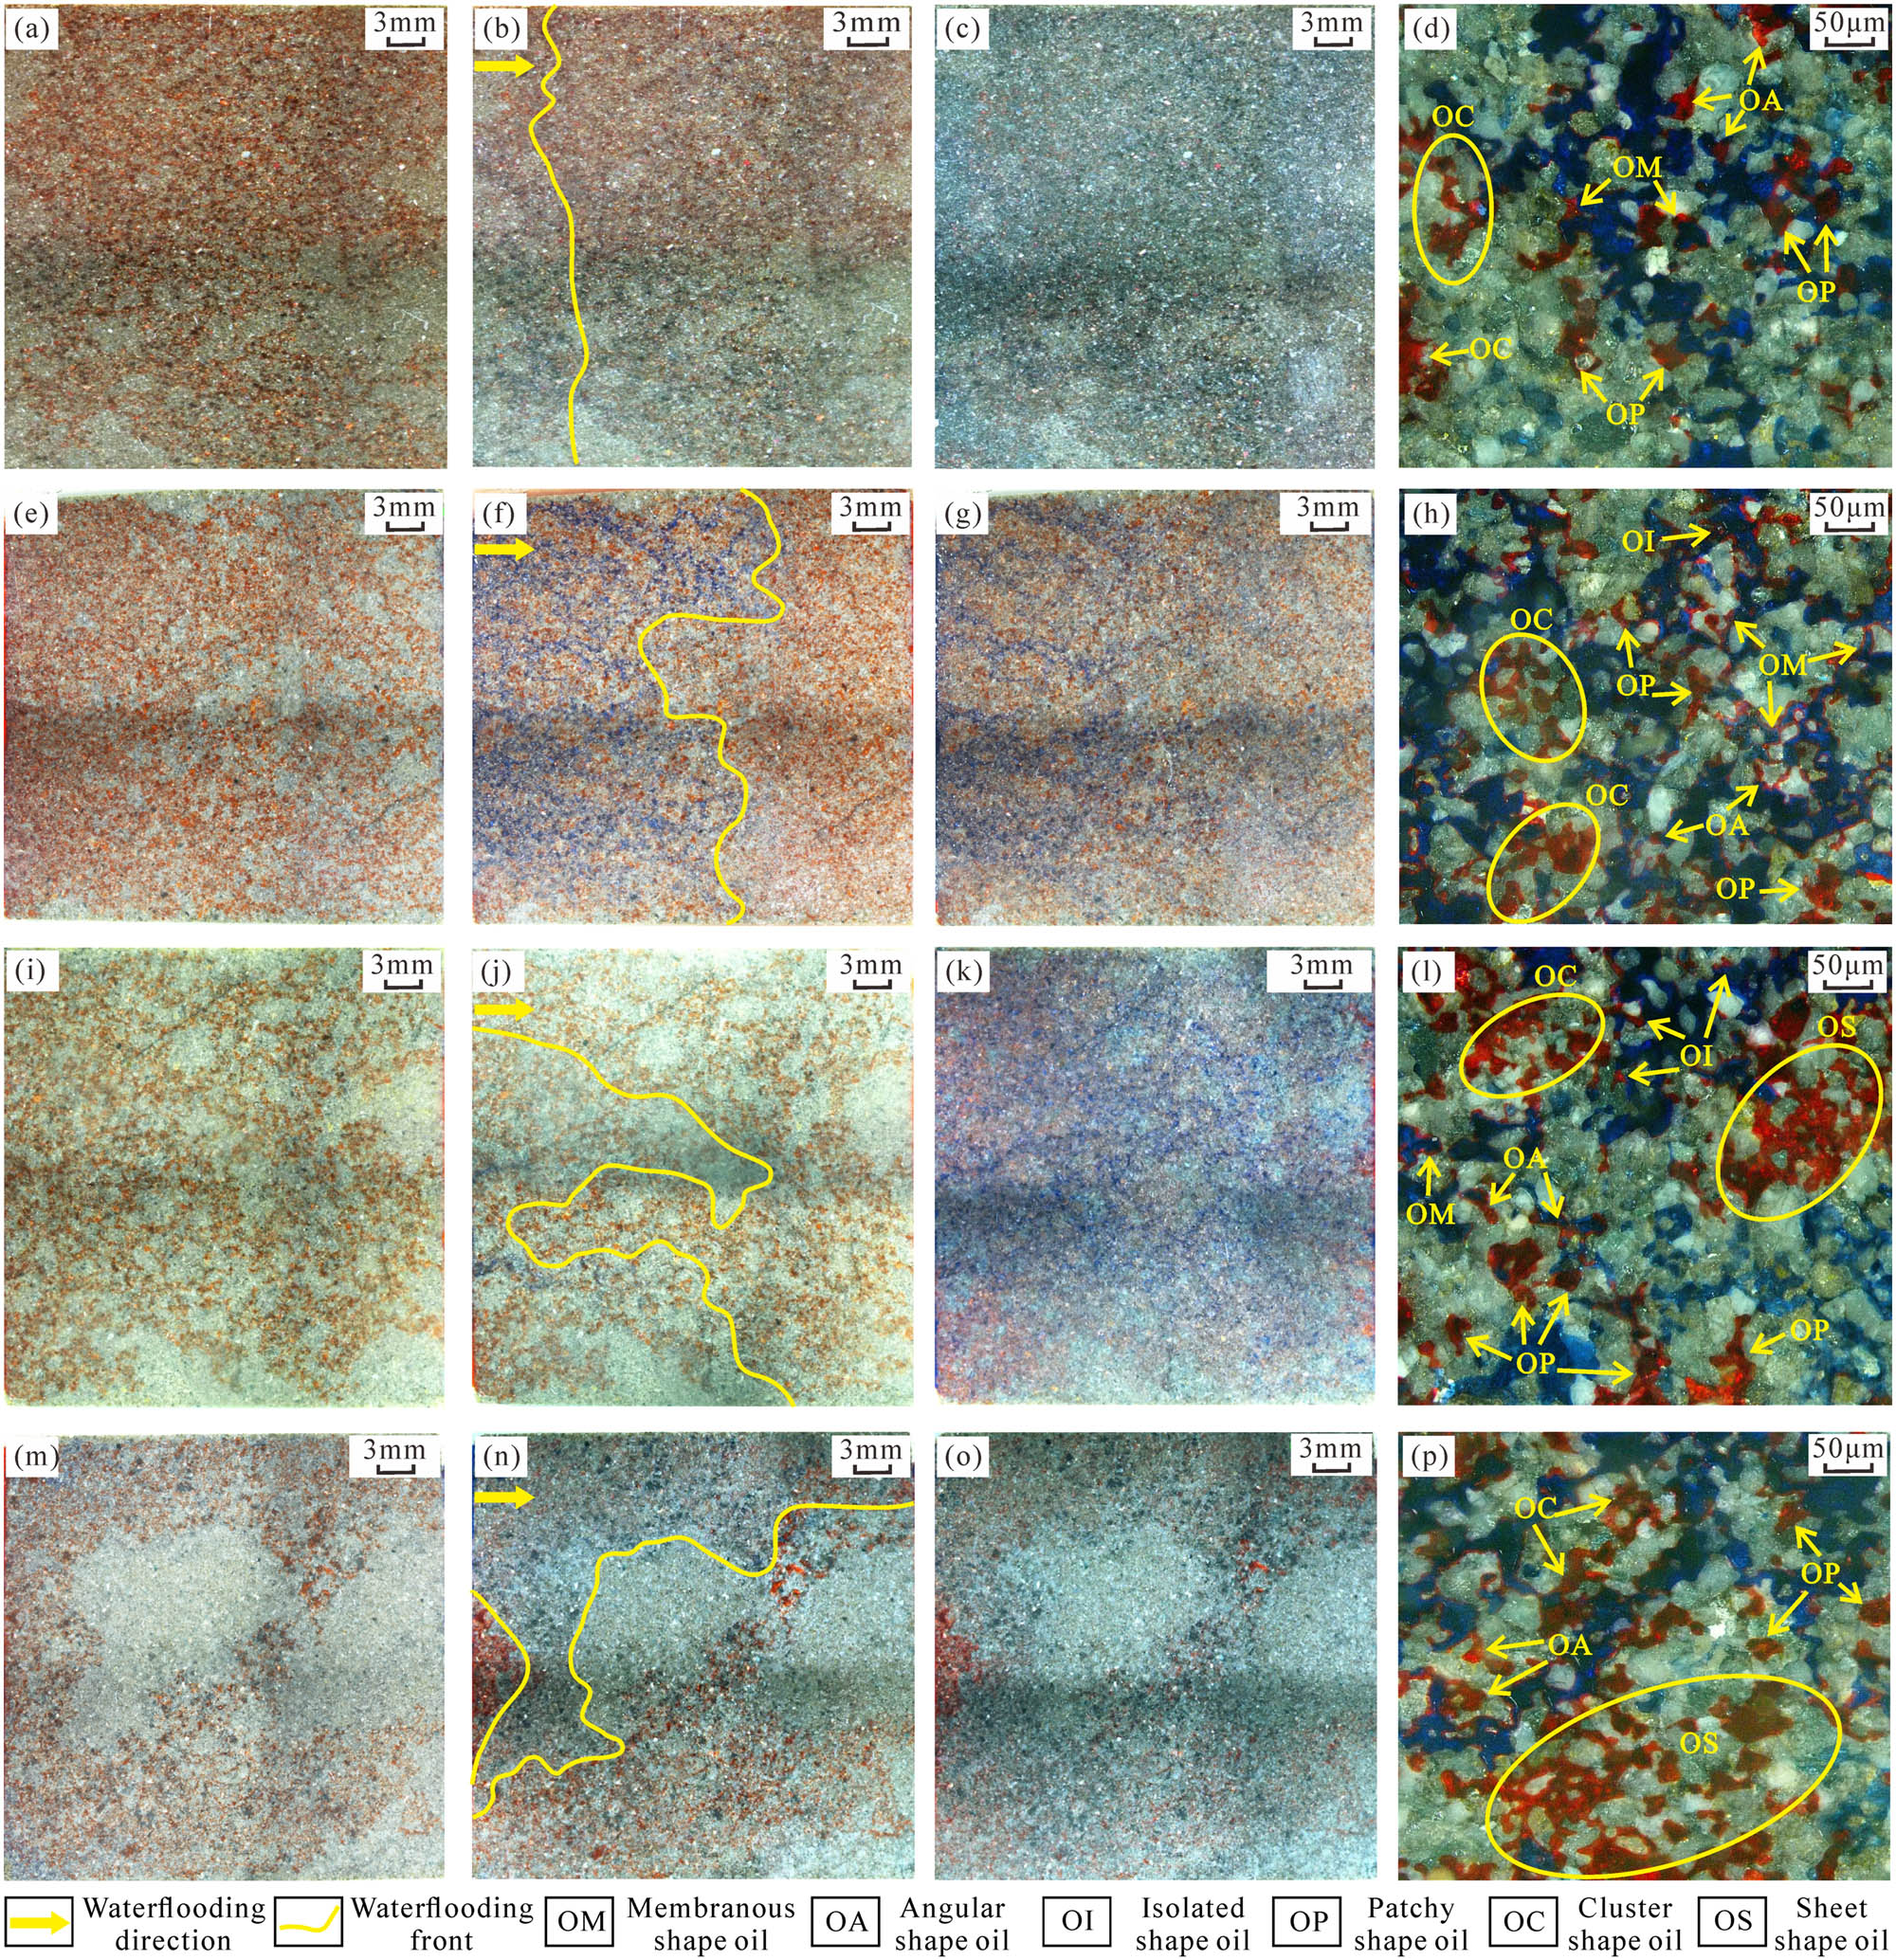
Oil–water seepage paths and residual oil distribution characteristics corresponding to type I PTS (a–d), type II PTS (e–h), type III PTS (i–l), and type IV PTS (m–p).
In type I PTS, mesopores and macropores account for a higher proportion, corresponding to the samples with the best petrophysical properties and the highest S io (averaging 67.06%), the waterflooding patterns primarily exhibiting uniform displacement. In the early stages of waterflooding, the formation water preferentially enters the larger pores with less resistance, forming multiple seepage paths, and the forward movement rate of formation water along each seepage path remains stable. The waterflooding front remains substantially parallel at different times, achieving uniform waterflooding coverage and high E w (averaging 51.30%) (Figure 8a–c). After waterflooding, the residual oil primarily exists as dispersed isolated, angular, patchy shapes, and a small amount of cluster shapes, trapped in the pore blind ends and the grain edge of the core (Figure 8d).
In type II PTS, mesopores and micropores account for a higher proportion, with a relatively high S io (averaging 57.27%) and a relatively uniform distribution, primarily characterized by network oil–water seepage paths. During the initial waterflooding phase, injected water enters through larger channels at the inlet end and forms multiple injection lines that advance irregularly in a branch-like manner. The waterflooding front advances in a network-like pattern, with significant local bypassing. As the displacement pressure and injected water volume increase, the injected water gradually penetrates smaller pores, thereby widening the seepage paths and increasing the waterflooding coverage and E w (averaging 43.47%) (Figure 8e–g). After waterflooding, the residual oil types are mainly membranous, angular, patchy, and cluster shapes (Figure 8h).
In type III PTS, micropores account for a higher proportion, the pore–throat radius and connectivity decrease, and PTS heterogeneity increases. The S io is lower (averaging 50.61%) and discontinuously distributed, primarily characterized by finger-network displacement. During the initial waterflooding phase, injected water extends forward in a finger-like manner along larger pore–throats. As displacement proceeds, the injected water gradually enters smaller pores and spreads outward along the original paths to form tree branch-like paths. The waterflooding network gradually becomes smaller and denser, and the waterflooding coverage expands, but the E w remains low (averaging 37.85%) (Figure 8i–k). After waterflooding, the residual oil types include membranous, angular, cluster, and sheet shapes (Figure 8l).
In type IV PTS, nanopores account for a higher proportion, with the lowest pore–throat radius and connectivity, higher clay mineral content, higher cementation degree, and PTS heterogeneity, leading to the undersaturation of some pores with crude oil. S io and E w are the lowest (averaging 44.11 and 25.05%, respectively) and unevenly distributed. During waterflooding, there are relatively high-permeability channels, and injected water advances along one or more channels in a finger-like manner, with significant bypasses occurring, resulting in large areas of residual oil remaining in the pore–throat space (Figure 8m–o). After waterflooding, the residual oil types are mainly in cluster and sheet shapes (Figure 8p).
5 Discussion
5.1 Effects of petrophysical properties on MFS and E w
The correlation between permeability and MFS and E w is stronger than that between porosity and these two (Figure 9a and b). This is primarily because both MFS and E w reflect fluid mobility within the reservoir, which is closely related to pore–throat connectivity and seepage capacity. High-porosity samples merely have larger storage spaces and weaker control over fluid mobility in the reservoir. Higher permeability in tight sandstone samples promotes fluid penetration into pores, where movable fluids in pore–throats are less affected by capillary resistance in finer throats and adsorption by hydrophilic minerals, resulting in higher MFS. For samples with better petrophysical properties, injected water preferentially enters larger pore–throats, increasing the number and width of seepage paths and expanding the waterflooding coverage, resulting in a significant increase in E w. Interestingly, the MFS of each sample is higher than the E w and has a high correlation with petrophysical properties. This is because only a single-phase flow of the formation water in the pore–throat space is simulated by NMR during centrifugation, resulting in MFS that reflects the theoretical or maximum movable degree of the fluids in tight sandstone samples. E w, on the other hand, is the relative percolation result of oil–water two-phase fluids in the pore–throats, influenced by reservoir PTS, fluid properties, solid–liquid interfacial interactions, etc., and accurately evaluates the recoverable degree of tight oil [55,56]. Furthermore, the reservoir quality index (RQI) of each sample was found to have a good correlation with MFS and E w (Figure 9c), indicating that fluid mobility in tight sandstone samples is influenced by both porosity and permeability, with higher pore–throat space and larger pore–throat development both facilitating fluid seepage. There is also a good positive correlation between permeability and MFS for different pore–throat types in each sample (Figure 9d). Fewer macropores develop, so they are not included in the analysis. Mesopores and micropores contribute to higher permeability, which corresponds to higher MFS, indicating that the development of larger pore–throats favors the occurrence and seepage of movable fluids. Nanopores have smaller pore–throat radii, resulting in lower fluid seepage capability, but their high pore–throat proportion and homogeneity allow some movable fluids to occur.
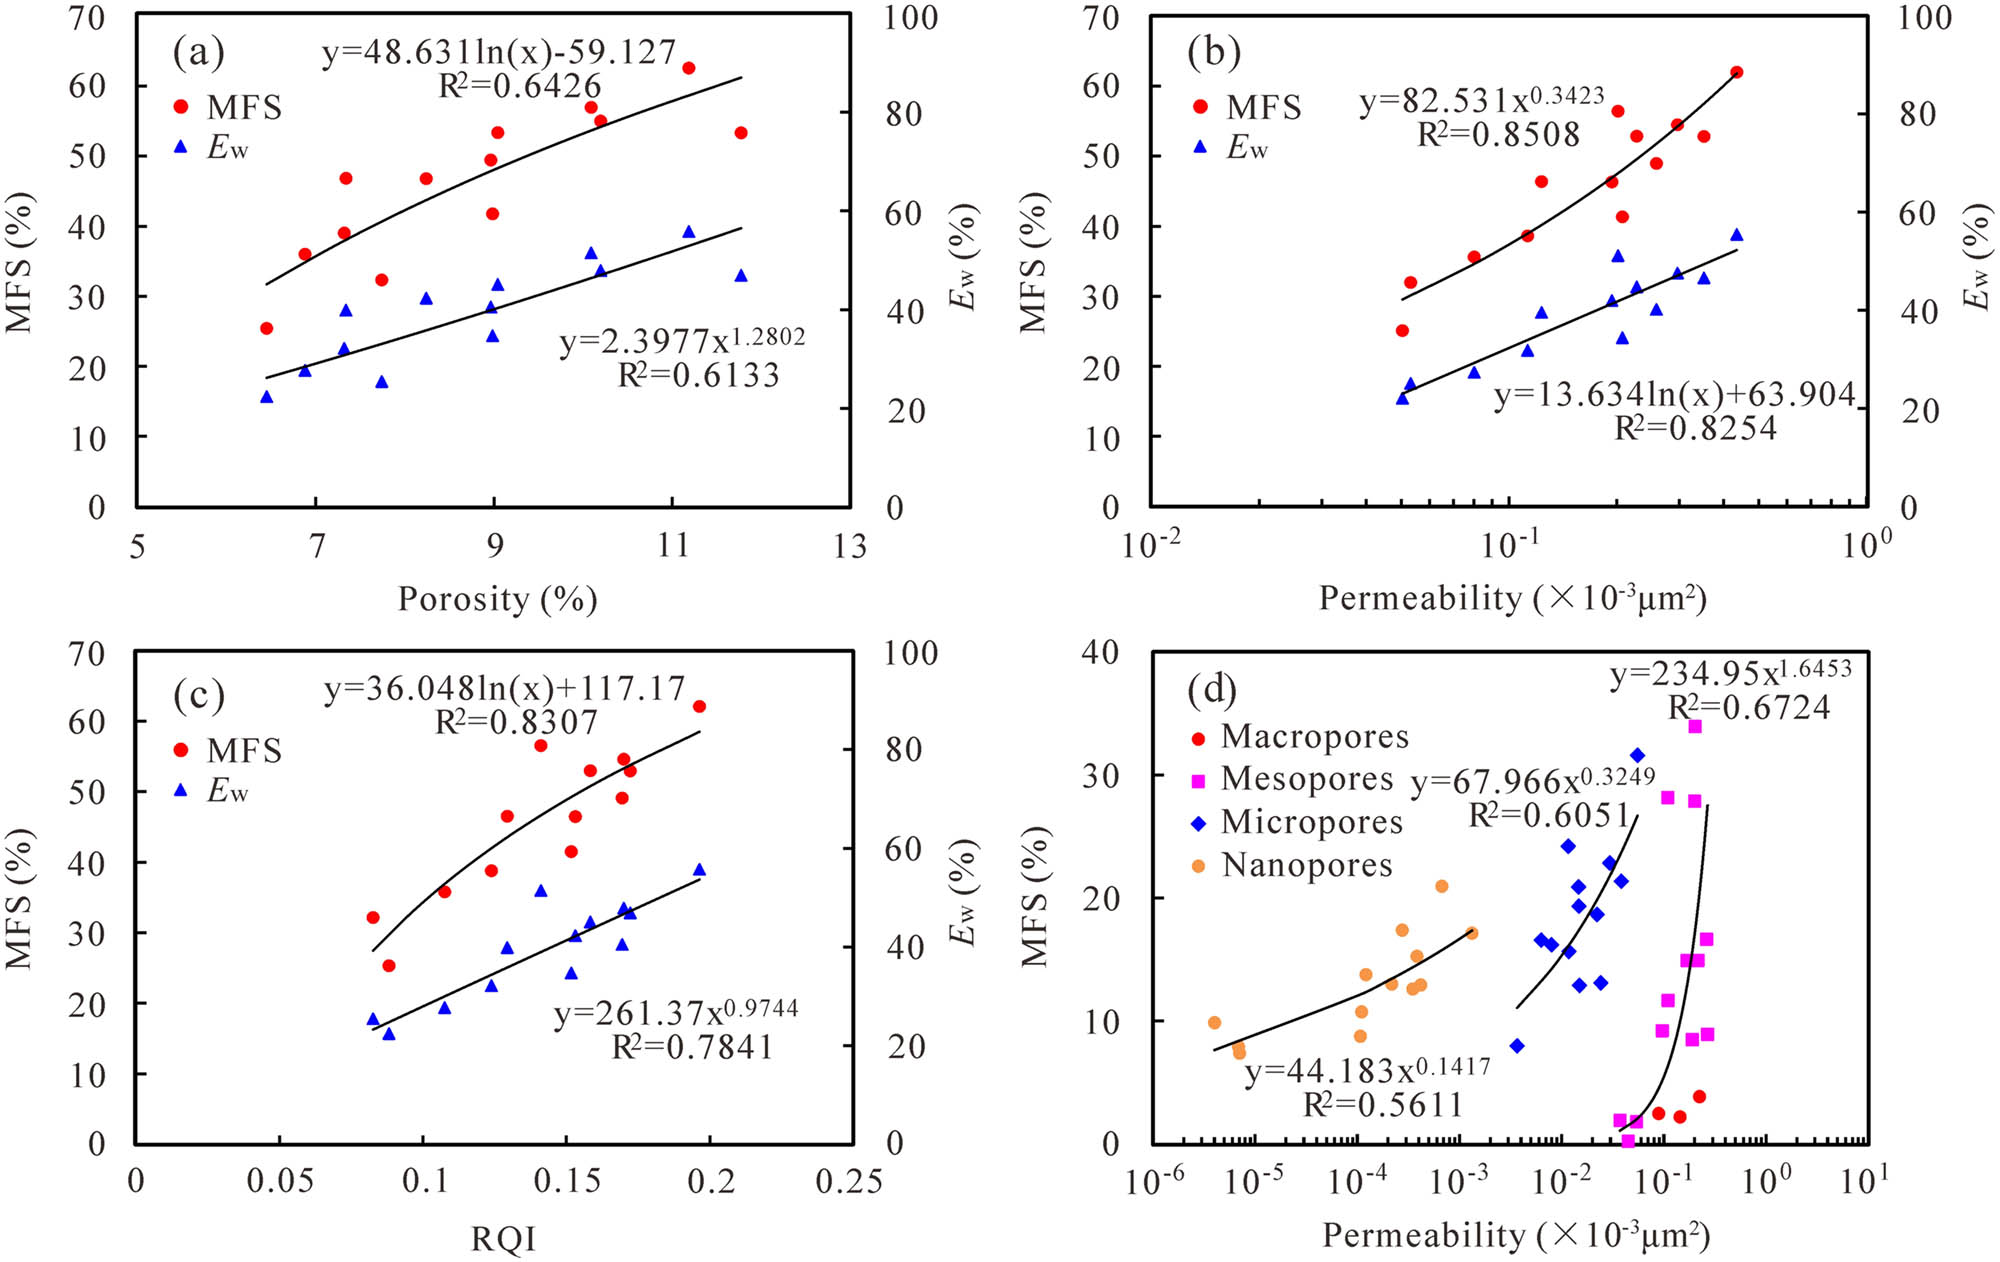
Correlation between MFS and E w with porosity (a), permeability (b), and RQI (c), and the correlation between MFS and permeability in different pore–throat types (d).
5.2 Effects of PTS on MFS and E w
R a and R max, which represent the pore–throat size, are significantly positively correlated with MFS and E w (Figure 10a and b). This indicates that larger pore–throat radii are more conducive to fluid seepage. Conversely, finer pore–throats have a stronger binding effect on movable fluids, causing greater capillary resistance, resulting in more frequent waterflooding bypassing and lower E w. P t exhibits a good negative correlation with MFS and E w (Figure 10c). This is because higher displacement pressures indicate poorer petrophysical properties of the sample, with a higher proportion of smaller pore–throats that are unfavorable for movable fluid flow. Additionally, injected water initially requires a higher starting pressure to enter the pore–throats, and once it breaks through smaller pore–throats, the displacement pressure decreases, allowing water to preferentially enter larger pore–throats for displacement, which easily leads to finger displacement and lower E w. S max and W e have a good positive correlation with MFS and E w (Figure 10d and e), indicating that higher reservoir space and pore–throat connectivity are beneficial to the occurrence and flow of reservoir fluids. Since the mercury withdrawal process is similar to the water-oil displacement process, both involve the non-wetting phase (mercury and injected water) displacing the wetting phase (air and crude oil) under high pressure, many scholars approximate the W e as the E w [57,58]. The difference lies in the mercury withdrawal process, in which the pressure drops rapidly, causing mercury in smaller pore–throats to be preferentially expelled and isolated, disrupting the continuity of the mercury and causing more mercury trapped in larger pore–throats. In contrast, during the water-oil displacement process, the injection pressure gradually increases, allowing a more continuous flow of the non-wetting phase, resulting in a generally higher E w than W e across samples. Therefore, in the actual waterflooding development of the reservoir, it is advisable to avoid sudden pressure changes and maintain gentle water injections, which is conducive to improving the recovery rate of tight oil.
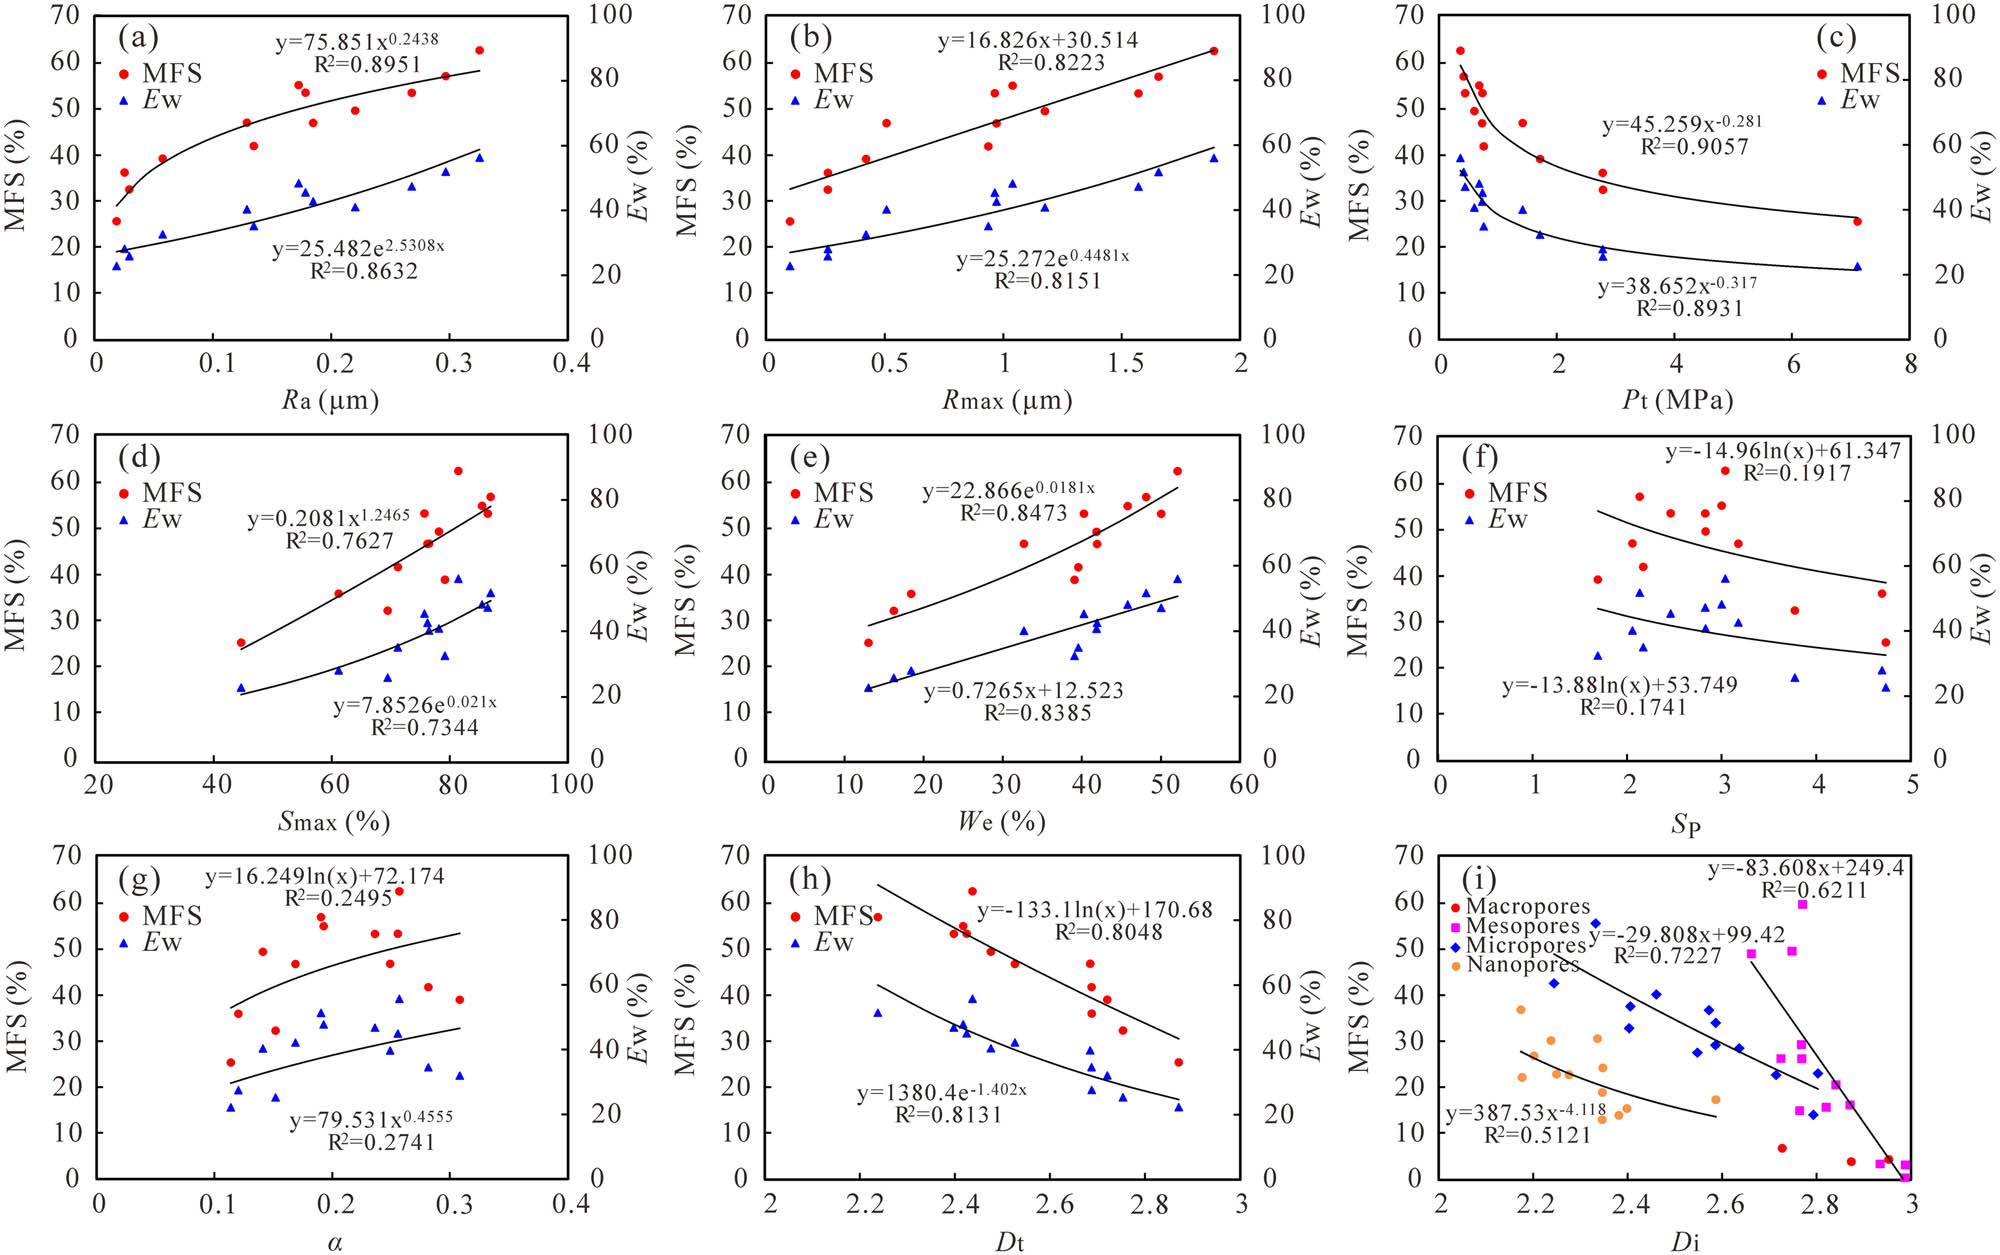
Correlation between MFS and E w with R a (a), R max (b), P t (c), S max (d), W e (e), S p (f), α (g), and D t (h), and the correlation between MFS and fractal dimensions for different pore–throat types (i).
S p and α of the pore–throats in tight sandstone samples have a relatively weak impact on MFS and E w (Figure 10f and g). This is because samples with high S p and low α indicate significant PSD variation. Although a higher proportion of larger pore–throats can reduce the displacement pressure differentials, the injected water tends to advance along high-permeability paths formed by larger pore–throats, leading to bypass flow phenomena that make it difficult to displace oil from certain pore–throats. Conversely, samples with smaller S p have a more uniform distribution, although exhibiting they generally have finer pore–throats. Under larger displacement pressure differentials, once the injected water breaks through, it can advance uniformly, and the displacement process often manifests as uniform or network displacement, with a larger sweep range and a better displacement effect. The D t of various PTS shows a good negative correlation with MFS and E w (Figure 10h), indicating that stronger PTS heterogeneity is detrimental to the flow of reservoir fluids. Furthermore, there is a good negative correlation between MFS and fractal dimensions for different pore–throat types (Figure 10i). Micropores serve as primary sites for movable fluids and possess high seepage capacity, the development and complexity of micropores has a significant impact on fluid mobility. Thus, for tight sandstone reservoirs, low permeability and fine pore–throats are not necessarily problematic; rather, PTS heterogeneity emerges as the principal factor governing fluid mobility and E w, highlighting the importance of integrated pore–throat characterization in reservoir engineering.
5.3 Effects of clay mineral composition and content on MFS and E w
The effects of different clay mineral compositions, occurrences, and their relative contents on the occurrence and seepage of fluids in reservoirs vary. The total clay minerals content has a good negative correlation with MFS and E w (Figure 11a). The presence of clay minerals tends to increase the specific surface area and roughness of the pore–throats, enhancing the interaction forces between the pore walls and the crude oil, which leads to elevated water injection pressures and difficulty in separating the crude oil, thereby reducing E w. High relative content of illite often occurs in the form of curved sheets or filamentous structures that fill into larger pore–throats, easily reducing the pore space or blocking the throats, making it difficult for fluids to flow and form trapped fluids. Additionally, during waterflooding, illite easily swells in the presence of water, blocking pore–throat spaces and reducing pore–throat connectivity and seepage capacity. Therefore, the relative content of illite shows a good negative correlation with MFS and E w (Figure 11b). Chlorite has dual effects on reservoir fluid mobility and reservoir space size. Early cemented chlorite films can effectively preserve pores, while late-formed chlorite liners fill pore spaces, resulting in less significant correlations between chlorite and MFS and E w (Figure 11c). Kaolinite is often associated with feldspar dissolution pores and commonly fills pore spaces in hexagonal thin plates, increasing PTS heterogeneity. Under water injections, kaolinite can migrate easily causing severe water sensitivity. However, given its relatively low content, it has little impact on MFS and E w (Figure 11d). In the process of waterflooding development, it is crucial to fully consider the clay mineral sensitivity and design waterflooding schemes tailored to different types of clay minerals.
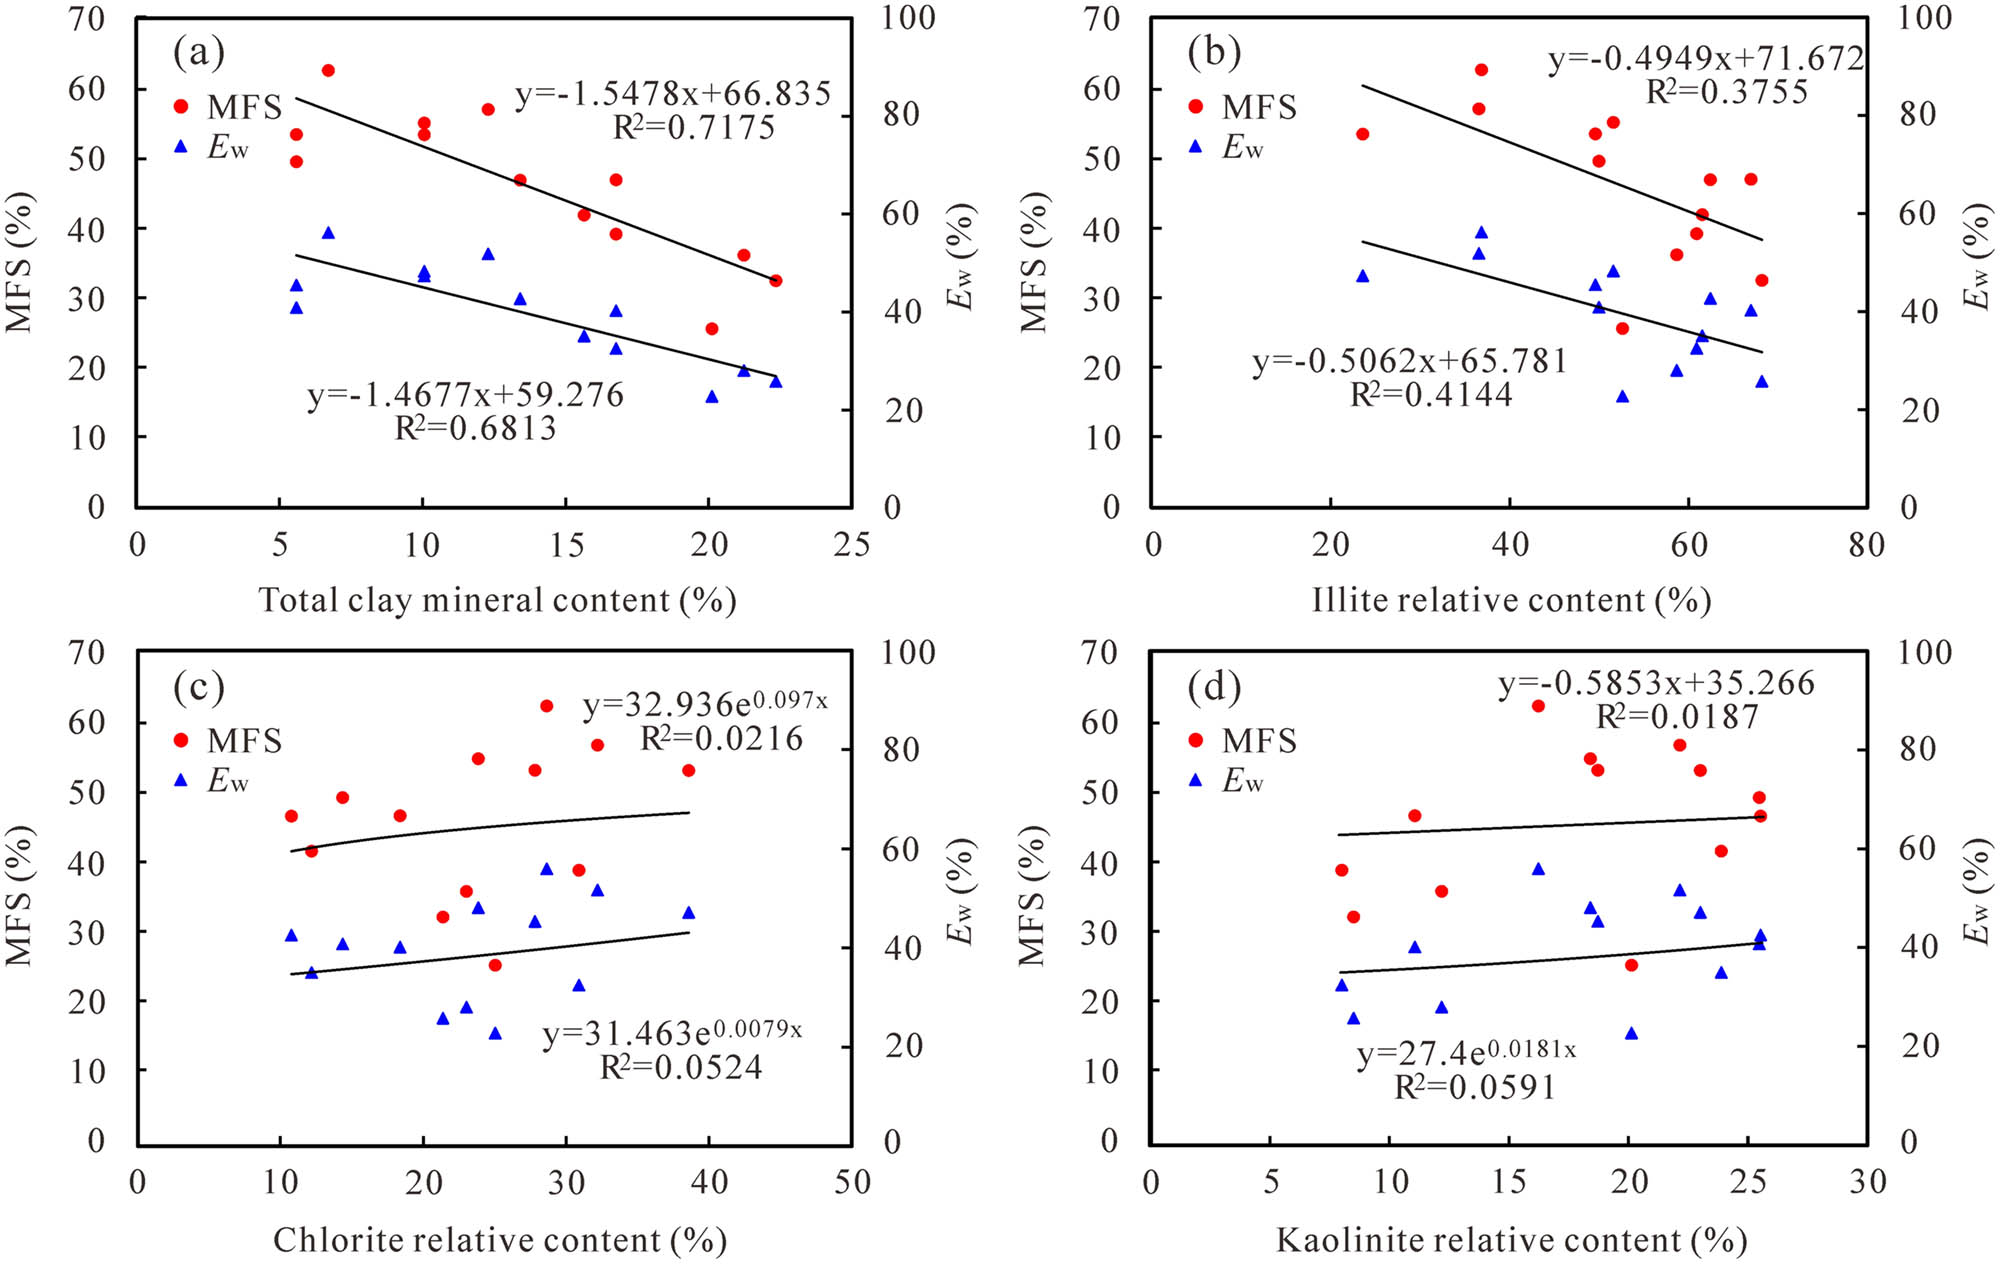
Correlation between MFS and E w with total clay mineral content (a), illite relative content (b), chlorite relative content (c), and kaolinite relative content (d).
5.4 Effect of water injection volume multiple on E w
Statistics were conducted on the E w of each sample at different water injection volume multiples (Figure 12). The results showed that when the water injection volume multiple was less than 1 pore volume (PV) (water-free period), the seepage channels and sweep area of the injected water for each sample expanded rapidly, increasing E w. However, when the water injection volume multiple reached 1 PV, the increase in E w was small for each sample. This was because, with the increase in water saturation or water cut in the pore–throat space, the relative permeability of the water phase increased and became more mobile, and oil–water seepage channels had already formed. The continuous increase in water injection pressure and volume made it difficult to displace the oil trapped in smaller pore–throats. The type IV samples had the worst PTS and petrophysical properties with strong PTS heterogeneity, yet their E w increased slowly at a high water injection volume multiple. This was due to the overall small pore–throat radius of these samples, with a high proportion of nanopores. Under higher displacement pressure, injected water gradually entered the nanopores and displaced the oil phase. However, due to the limited reservoir space of the nanopores and lower S io, the overall increase in E w was small. Additionally, the E w of type III sample L91 was significantly higher than that of type II samples H36 and H37. Although samples H36 and H37 had better petrophysical properties and PTS with developed mesopores and micropores, their S p and D t were both higher than those of sample L91, indicating stronger PTS heterogeneity. Increasing the content of larger pore–throats resulted in a reduced displacement pressure differential, causing injected water to mostly advance along the high-permeability channels and form continuous cluster and sheet shape residual oil. Therefore, it is recommended to maintain a stable injection pressure and injection volume multiple of less than 2 PV in the process of waterflooding in tight sandstone reservoirs, which is conducive to improving the water injection utilization rate and protecting the environment.
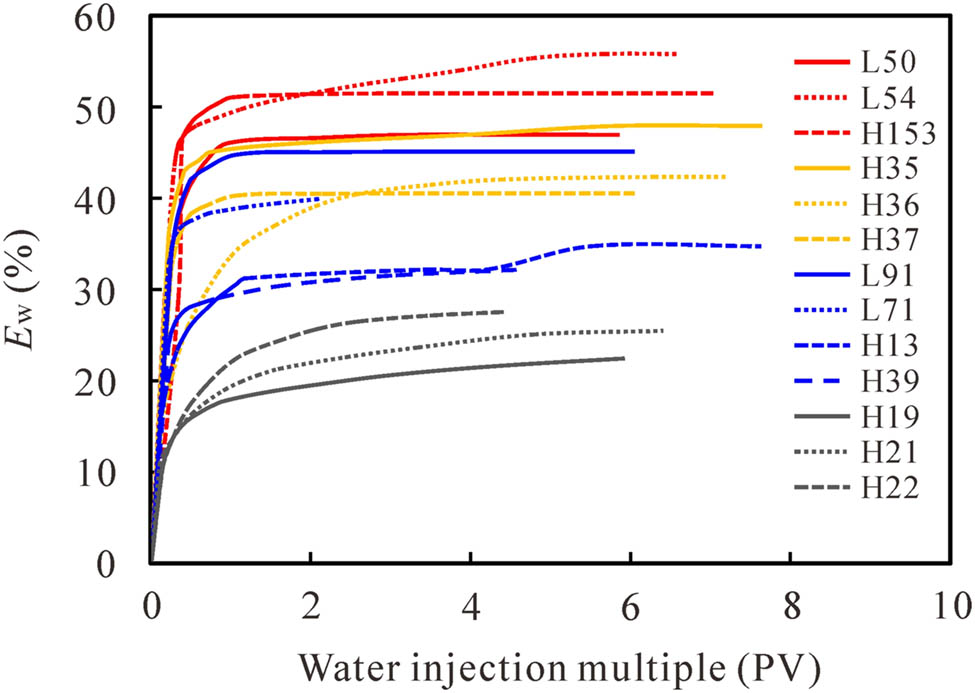
E w of each sample under different injection volume multiples.
5.5 Analysis of residual oil formation reasons
In the actual water injection development process of tight oil reservoirs, the morphology and formation mechanisms of residual oil are extremely complex. The formation of a specific residual oil morphology in pore–throats is typically controlled by several mechanisms. For instance, clustered residual oil is often controlled by a combination of injected water bypass flow and low displacement pressure. Therefore, this paper only analyzes and summarizes the common morphologies and formation mechanisms of residual oil, which mainly include the following five categories: (1) non-piston displacement within pore–throats. Due to the differences in the wettability of rock particle surfaces and their heterogeneity, as well as the unbalanced driving forces and capillary pressures that the injected water experiences during seepage, the velocity of the injected water moving through the pore channels is uneven. Water tends to flow faster in the center or edges of the pore channels, resulting in the formation of membranous and isolated residual oil (Figure 13a and b). (2) No seepage outlet or blind pores. The sedimentation and diagenesis of the rock particles in the reservoir create linear or closer contacts between local rock particles, creating blind pores. This configuration makes it difficult for the oil in the pores to be separated by the displacing agents, leading to the formation of angular and patchy residual oil (Figure 13c and d). (3) Blockage due to small pore–throats. Continuous oil droplets in the pore–throats may experience blockage when passing through very small pore–throats due to an imbalance between driving force and resistance, which easily leads to the occurrence of the Jamin effect and the formation of isolated residual oil (Figure 13b). (4) Low driving force or low displacement pressure differential within the pore–throats. When the connectivity of pore–throats is poor or the displacement direction of the injected water is perpendicular to the pore channels, the pressure differential at both ends of the pore channel may be small or even zero, making it difficult to displace the oil contained therein, resulting in the formation of patchy residual oil. Furthermore, as the displacement radius increases, the driving force of the injected water in the pore–throats near the outlet becomes very low, preventing further displacement and leading to the formation of cluster and sheet residual oil (Figure 13e and f). (5) Water coning and bypassing of injected water. Due to the overall small pore–throat radius and severe local cementation of the tight sandstone samples, the injected water is likely to seep along the channels of larger pore–throats, often advancing in a finger displacement, which easily results in the formation of cluster and sheet residual oil (Figure 13e and f).
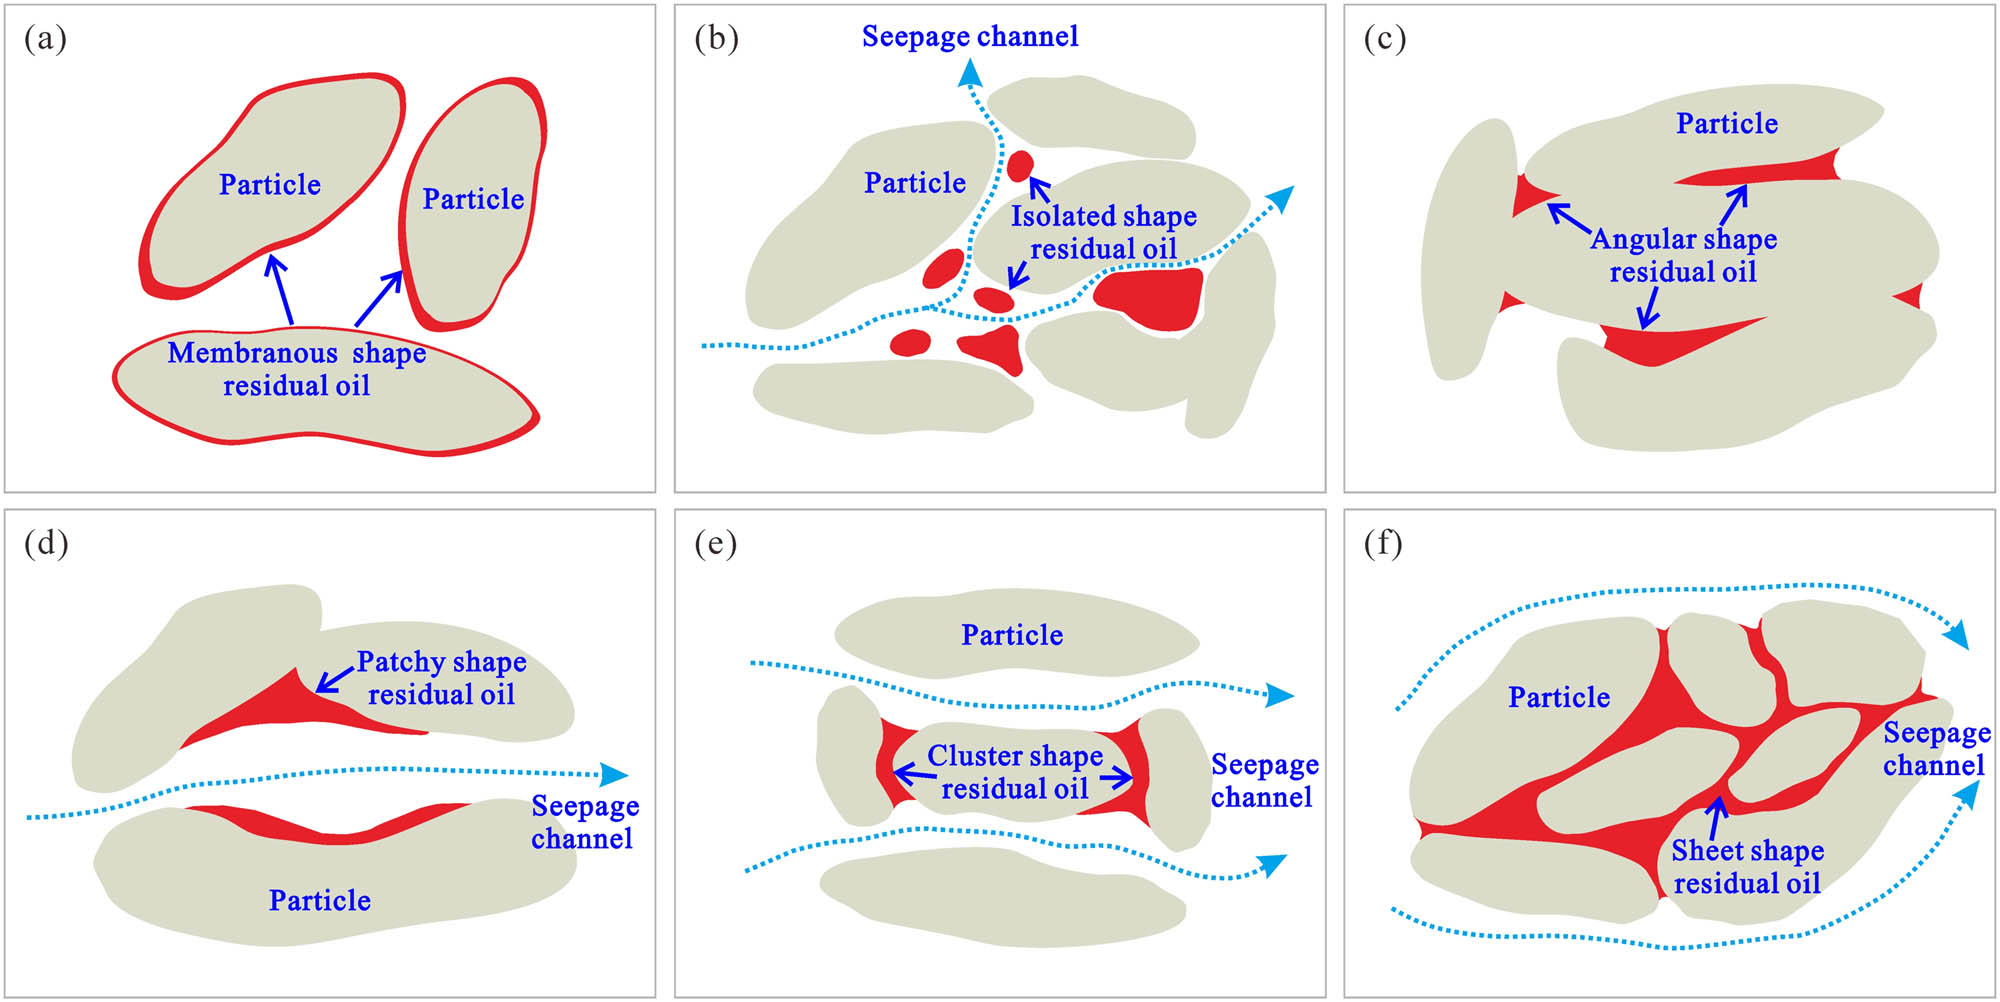
Schematic diagram of distribution and formation mechanisms of microscopic residual oil: (a) membranous shape residual oil; (b) isolated shape residual oil; (c) angular shape residual oil; (d) patchy shape residual oil; (e) cluster shape residual oil; and (f) sheet shape residual oil.
6 Conclusion
Tight sandstone reservoirs exhibit inherently poor PTS and fluid mobility. HPMI analysis identifies four PTS categories (I–IV) showing progressive increases in clay mineral content and intercrystalline pores. Enhanced PTS heterogeneity directly correlates with deteriorating petrophysical properties and fluid mobility.
Integrated HPMI and NMR analysis accurately delineates the full PSD (0.0001–10 μm) that exhibits multi-fractal characteristics, enabling differentiation of macropores, mesopores, micropores, and nanopores. Micropores, which are relatively uniform, dominate reservoir petrophysical properties and serve as primary sites for movable fluids.
With worsening reservoir properties and PTS, the oil–water seepage paths transition from uniform displacement (type I) to finger displacement (type IV), with corresponding reductions in MFS and E w. Residual oil morphologies evolve from dispersed membranes to continuous clusters and sheet shapes.
PTS heterogeneity is the primary factor affecting fluid mobility and E w. Enhanced PTS heterogeneity reduces permeability and induces nonlinear seepage phenomena (blockage and fluid bypassing), resulting in more extensive residual oil accumulation and diminished E w. In practice, maintaining stable injection pressures and limiting injection volume multiple to less than 2 PV is recommended, while also considering clay mineral sensitivity.
Acknowledgments
The authors thank China Shaanxi Yanchang Petroleum (Group) Company for providing the samples and related materials.
-
Funding information: Authors state no funding involved.
-
Author contributions: Quanpei Zhang contributed to the conceptualization and project administration of the manuscript. Chen Yang and Yu Tian contributed to the methodology and supervision of the manuscript. Hui Liu and Wen Xiao contributed importantly to writing, reviewing, and editing. Zhikun Wang and Zhongrong Mi helped perform data curation. Zheyu Li, Yong Huo, and Yong Li contributed to the investigation and resources. Jie Min, Duoduo Zhang, Linzi Chen, and Qiong Duan were responsible for data management and algorithms. All authors have read and agreed to the published version of the manuscript.
-
Conflict of interest: All authors declare that there is no conflict of interest.
References
[1] Xue L, Zhang J, Chen G, Wang XY, Huang X, Li X, et al. Enhance oil recovery by carbonized water flooding in tight oil reservoirs. Geoenergy Sci Eng. 2025;244:213430.10.1016/j.geoen.2024.213430Suche in Google Scholar
[2] Qin GW, Dai X, Sui L, Geng M, Sun LH, Zheng YZ, et al. Study of massive water huff-n-puff technique in tight oil field and its field application. J Pet Sci Eng. 2021;196:107514.10.1016/j.petrol.2020.107514Suche in Google Scholar
[3] Xiao WL, Yang YB, Li M, Li N, You JX, Zhao JZ, et al. Experimental study on the oil production characteristics during the waterflooding of different types of reservoirs in Ordos Basin, NW China. Pet Explor Dev. 2021;48(4):807–16.10.1016/S1876-3804(21)60078-2Suche in Google Scholar
[4] Wang L, Lei X, Zhang QL, Yao GQ, Sui B, Chen XJ, et al. Experimental study of the effects of a multistage pore-throat structure on the seepage characteristics of sandstones in the Beibuwan Basin: Insights into the flooding mode. Pet Sci. 2024;21(2):1044–61.10.1016/j.petsci.2023.12.018Suche in Google Scholar
[5] Jiang F, Zhang C, Wang K, Zhao Z, Zhong K. Characteristics of micropores, pore throats, and movable fluids in the tight sandstone oil reservoirs of the Yanchang Formation in the southwestern Ordos Basin, China. AAPG Bull. 2019;103(12):2835–59.10.1306/03061917284Suche in Google Scholar
[6] Jia C, Zou C, Li J, Li D, Zheng M. Assessment criteria, main types, basic features, and resource prospects of the tight oil in China. Acta Pet Sin. 2012;33(3):343–50.Suche in Google Scholar
[7] Wang L, Tian Y, Yu XY, Wang C, Yao BW, Wang SH, et al. Advances in improved/enhanced oil recovery technologies for tight and shale reservoirs. Fuel. 2017;210:425–45.10.1016/j.fuel.2017.08.095Suche in Google Scholar
[8] Liu X, Wang J, Ge L, Hu F, Li C, Li X, et al. Pore-scale characterization of tight sandstone in yanchang formation ordos basin China using micro-CT and SEM imaging from nm- to cm-scale. Fuel. 2017;209:254–64.10.1016/j.fuel.2017.07.068Suche in Google Scholar
[9] Lai J, Wang G, Wang Z, Chen J, Pang X, Wang S, et al. A review on pore structure characterization in tight sandstones. Earth Sci Rev. 2018;178:436–57.10.1016/j.earscirev.2017.12.003Suche in Google Scholar
[10] Dong XX, Meng XZ, Pu RH. Impacts of mineralogy and pore throat structure on the movable fluid of tight sandstone gas reservoirs in coal measure strata: A case study of the Shanxi formation along the southeastern margin of the Ordos Basin. J Pet Sci Eng. 2022;220:111257.10.1016/j.petrol.2022.111257Suche in Google Scholar
[11] Wang X, Hou J, Song S, Wang D, Gong L, Ma K, et al. Combining pressure-controlled porosimetry and rate-controlled porosimetry to investigate the fractal characteristics of full-range pores in tight oil reservoirs. J Pet Sci Eng. 2018;171:353–61.10.1016/j.petrol.2018.07.050Suche in Google Scholar
[12] Guo X, Huang Z, Zhao L, Han W, Ding C, Sun X, et al. Pore structure and multi-fractal analysis of tight sandstone using MIP, NMR and NMRC methods: A case study from the Kuqa depression, China. J Pet Sci Eng. 2019;178:544–58.10.1016/j.petrol.2019.03.069Suche in Google Scholar
[13] Zhang WK, Shi ZJ, Tian YM. An improved method to characterize the pore-throat structures in tight sandstone reservoirs: Combined high-pressure and rate-controlled mercury injection techniques. Energ Explor Exploit. 2020;38(6):2389–412.10.1177/0144598720920729Suche in Google Scholar
[14] Zhang QP, Liu YC, Wang BT, Ruan JF. Effects of pore-throat structures on the fluid mobility in chang 7 tight sandstone reservoirs of longdong area, Ordos Basin. Mar Pet Geol. 2022;135:105407.10.1016/j.marpetgeo.2021.105407Suche in Google Scholar
[15] Jiang Y, Xu GQ, Bi H, Shi Y, Gao Y, Han XL, et al. A new method to determine surface relaxivity of tight sandstone cores based on LF-NMR and high-speed centrifugation measurements. J Pet Sci Eng. 2021;196:108096.10.1016/j.petrol.2020.108096Suche in Google Scholar
[16] Li Z, Shen X, Qi Z, Hu R. Study on the pore structure and fractal characteristics of marine and continental shale based on mercury porosimetry, N2 adsorption and NMR methods. J Nat Gas Sci Eng. 2018;53:12–21.10.1016/j.jngse.2018.02.027Suche in Google Scholar
[17] Xiao Q, Yang Z, Wang Z. A full-scale characterization method and application for pore-throat radius distribution in tight oil reservoirs. J Pet Sci Eng. 2020;187:106857.10.1016/j.petrol.2019.106857Suche in Google Scholar
[18] Li P, Zheng M, Bi H, Wu S, Wang X. Pore throat structure and fractal characteristics of tight oil sandstone: a case study in the Ordos Basin, China. J Pet Sci Eng. 2017;49:665–74.10.1016/j.petrol.2016.11.015Suche in Google Scholar
[19] Anees A, Zhang HC, Ashraf U, Wang R, Liu K, Abbas A, et al. Sedimentary facies controls for reservoir quality prediction of Lower Shihezi Member-1 of the Hangjinqi area, Ordos Basin. Minerals. 2022;12(2):126.10.3390/min12020126Suche in Google Scholar
[20] Ashraf U, Zhang HC, Anees A, Ali M, Zhang X, Shakeel AS, et al. Controls on reservoir heterogeneity of a shallow-marine reservoir in Sawan Gas Field, SE Pakistan: Implications for reservoir quality prediction using acoustic impedance inversion. Water. 2020;12(11):2972.10.3390/w12112972Suche in Google Scholar
[21] Krohn CE. Sandstone fractal and Euclidean pore volume distributions. J Geophys Res Solid Earth. 1988;93(B4):3286–96.10.1029/JB093iB04p03286Suche in Google Scholar
[22] Mandelbrot BB. On the geometry of homogeneous turbulence with stress on the fractal dimension of the iso-surfaces of scalars. J Fluid Mech. 1975;72(3):401–16.10.1017/S0022112075003047Suche in Google Scholar
[23] He C, Hua M. Fractal geometry description of reservoir pore structure. Oil Gas Geol. 1998;19(1):15–23.Suche in Google Scholar
[24] Jamaloei BY, Asghari K, Kharrat R, Ahmadloo F. Pore-scale two-phase filtration in imbibition process through porous media at high- and low-interfacial tension flow conditions. J Pet Sci Eng. 2010;72(3–4):251–69.10.1016/j.petrol.2010.03.026Suche in Google Scholar
[25] Wu D, Ju BS, Chen XL, Fu YK, Brantson ET. Experimental evaluation of different strategies for improving oil recovery at high-water-cut by quantitative etched-glass micro-models. Energy Explor Exploit. 2016;34(4):586–605.10.1177/0144598716643627Suche in Google Scholar
[26] Ren D, Sun W, Huang H, Nan J, Chen B. Determination of microscopic water flooding characteristics and influence factors in ultra-low permeability sandstone reservoir. J Cent South Univ. 2017;24(9):2134–44.10.1007/s11771-017-3622-6Suche in Google Scholar
[27] Liu GF, Wang HL, Tang JC, Liu ZK, Yang DY. Effect of wettability on oil and water distribution and production performance in a tight sandstone reservoir. Fuel. 2023;341:127680.10.1016/j.fuel.2023.127680Suche in Google Scholar
[28] Hou J, Zhang SK, Zhang YH, Wang RR, Luo FQ. Prediction of microscopic remaining oil distribution using fuzzy comprehensive evaluation. Transp Porous Med. 2011;89(3):533–45.10.1007/s11242-011-9784-zSuche in Google Scholar
[29] Wang DG, Hu YL, Sun JJ. X-ray MCT based numerical analysis of residual oil pore-scale characteristics under various displacing systems. J Pet Sci Eng. 2015;135:168–76.10.1016/j.petrol.2015.09.015Suche in Google Scholar
[30] Turner ML, Knüfing L, Arns CH, Sakellariou A, Senden TJ, Sheppard AP, et al. Three-dimensional imaging of multiphase flow in porous media. Phys Stat Mech Appl. 2004;339(1–2):166–72.10.1016/j.physa.2004.03.059Suche in Google Scholar
[31] Li J, Jiang H, Wang C, Zhao Y, Gao Y, Pei Y, et al. Pore-scale investigation of microscopic remaining oil variation characteristics in water-wet sandstone using CT scanning. J Nat Gas Sci Eng. 2017;48:36–45.10.1016/j.jngse.2017.04.003Suche in Google Scholar
[32] Amirmoshiri M, Zeng Y, Chen Z, Singer PM, Puerto MC, Grier H, et al. Probing the effect of oil type and saturation on foam flow in porous media: core-flooding and nuclear magnetic resonance (NMR) imaging. Energy Fuel. 2018;32(11):11177–89.10.1021/acs.energyfuels.8b02157Suche in Google Scholar
[33] Teng Y, Liu Y, Jiang LL, Song YC, Zhao JF, Zhang Y, et al. A visualization study on twophase gravity drainage in porous media by using magnetic resonance imaging. Magn Reson Imag. 2016;34(7):855–63.10.1016/j.mri.2016.03.004Suche in Google Scholar PubMed
[34] Mitchell J, Chandrasekera TC, Holland DJ, Gladdena LF, Fordham EJ. Magnetic resonance imaging in laboratory petrophysical core analysis. Phys Rep. 2013;526:165–225.10.1016/j.physrep.2013.01.003Suche in Google Scholar
[35] Yang YB, Xiao WL, Bernabe Y, Xie QC, Wang J, He YA, et al. Effect of pore structure and injection pressure on waterflooding in tight oil sandstone cores using NMR technique and pore network simulation. J Pet Sci Eng. 2022;217:110886.10.1016/j.petrol.2022.110886Suche in Google Scholar
[36] Liu L, Dai S, Ning F. Fractal characteristics of unsaturated sands−implications to relative permeability in hydrate-bearing sediments. J Nat Gas Sci Eng. 2019;66:11–7.10.1016/j.jngse.2019.03.019Suche in Google Scholar
[37] Mirzaei-Paiaman A, Saboorian-Jooybari H, Chen Z. New technique of true effective mobility (TEM-Function) in dynamic rock typing: reduction of uncertainties in relative permeability data for reservoir simulation. J Pet Sci Eng. 2019;179:210–27.10.1016/j.petrol.2019.04.044Suche in Google Scholar
[38] Zhang Y, Zhao PQ, Cai MJ, Lu FM, Wu X, Guo ZQ. Occurrence state and forming mechanism of microscopic remaining oil controlled by dynamic and static factors. J Pet Sci Eng. 2020;193:107330.10.1016/j.petrol.2020.107330Suche in Google Scholar
[39] Bultreys T, Boone MA, Boone MN, Schryver TD. Real-time visualization of Haines jumps in sandstone with laboratory-based microcomputed tomograpgy. Water Resour Res. 2015;51(10):8668–76.10.1002/2015WR017502Suche in Google Scholar
[40] Jia H, Zhang R, Luo XB, Zhou ZL, Yang L. Nuclear magnetic resonance experiments on the time-varying law of oil viscosity and wettability in high-multiple waterflooding sandstone cores. Pet Explor Dev. 2024;51(2):394–402.10.1016/S1876-3804(24)60031-5Suche in Google Scholar
[41] Sun PK, Xu HM, Zhu HQ, Jia LB, Hu XN, Fang HJ, et al. Investigation of pore-type heterogeneity and its control on microscopic remaining oil distribution in deeply buried marine clastic reservoirs. Mar Pet Geol. 2021;123:104750.10.1016/j.marpetgeo.2020.104750Suche in Google Scholar
[42] Chen M, Dai JC, Liu XJ, Kuang Y, Wang ZT, Gou SC, et al. Effect of displacement rates on fluid distributions and dynamics during water flooding in tight oil sandstone cores from nuclear magnetic resonance (NMR). J Pet Sci Eng. 2020;184:106588.10.1016/j.petrol.2019.106588Suche in Google Scholar
[43] Zhu HH, Zhang QX, Dong GD, Shang F, Zhang FY, Zhao XM, et al. Characteristics and control factors of feldspar dissolution in gravity flow sandstone of Chang 7 Member, Triassic Yanchang Formation, Ordos Basin, NW China. Pet Explor Dev. 2024;51(1):114–26.10.1016/S1876-3804(24)60009-1Suche in Google Scholar
[44] Dai Q, Luo Q, Zhang C, Lu C, Zhang Y, Lu S, et al. Pore structure characteristics of tight-oil sandstone reservoir based on a new parameter measured by NMR experiment: a case study of seventh Member in Yanchang Formation, Ordos Basin. Acta Pet Sin. 2016;37(7):887–97.Suche in Google Scholar
[45] Li P, Jia C, Jin Z, Liu Q, Zheng M, Huang Z. The characteristics of movable fluid in the Triassic lacustrine tight oil reservoir: a case study of the Chang 7 member of Xin’anbian Block, Ordos Basin, China. Mar Pet Geol. 2019;102:126–37.10.1016/j.marpetgeo.2018.11.019Suche in Google Scholar
[46] Wang F, Chen D, Yao D, Cheng M, Wang Q. Disparities in tight sandstone reservoirs in different source-reservoir assemblages and their effect on tight oil accumulation: Triassic Chang 7 member in the Qingcheng area, Ordos Basin. J Pet Sci Eng. 2022;217:110914.10.1016/j.petrol.2022.110914Suche in Google Scholar
[47] Yang H, Liang X, Niu X. Geological conditions for continental tight oil formation and the main controlling factors for the enrichment: A case of Chang 7 Member, Triassic Yanchang Formation, Ordos Basin, NW China. Pet Explor Dev. 2017;44:12–20.10.1016/S1876-3804(17)30003-4Suche in Google Scholar
[48] Qu YQ, Sun W, Wu HN, Huang SJ, Li T, Ren DZ, et al. Impacts of pore-throat spaces on movable fluid: Implications for understanding the tight oil exploitation process. Mar Pet Geol. 2022;137:105509.10.1016/j.marpetgeo.2021.105509Suche in Google Scholar
[49] Meng ZY, Sun W, Liu YQ, Luo B, Zhao MR. Effect of pore networks on the properties of movable fluids in tight sandstones from the perspective of multi-techniques. J Pet Sci Eng. 2021;201:108449.10.1016/j.petrol.2021.108449Suche in Google Scholar
[50] Li K. Analytical derivation of Brooks-Corey type capillary pressure models using fractal geometry and evaluation of rock heterogeneity. J Pet Sci Eng. 2010;73(1–2):20–6.10.1016/j.petrol.2010.05.002Suche in Google Scholar
[51] Zhang BQ, Li SF. Determination of the surface fractal dimension for porous media by mercury porosimetry. Ind Eng Chem Res. 1995;34:1383–6.10.1021/ie00043a044Suche in Google Scholar
[52] Dou WC, Liu LF, Jia LB, Xu ZJ, Wang MY, Du CJ, et al. Pore structure, fractal characteristics and permeability prediction of tight sandstones: A case study from Yanchang Formation, Ordos Basin, China. Mar Pet Geol. 2021;123:104737.10.1016/j.marpetgeo.2020.104737Suche in Google Scholar
[53] Huang H, Chen L, Sun W, Xiong F, Ji W, Jia J, et al. Pore-throat structure and fractal characteristics of Shihezi Formation tight gas sandstone in the Ordos Basin, China. Fractals. 2018;26:1840005.10.1142/S0218348X18400054Suche in Google Scholar
[54] Li JJ, Liu Y, Gao YJ, Cheng BY, Meng FL, Xu HM, et al. Effects of microscopic pore structure heterogeneity on the distribution and morphology of remaining oil. Pet Explor Dev. 2018;45(6):1112–22.10.1016/S1876-3804(18)30114-9Suche in Google Scholar
[55] Sun TB, Lin CY, Cui ST, Zhang SZ, Wang P, Wang L, et al. Microscopic heterogeneity characteristics of marine clastic reservoirs and effect to remaining oil distribution in high water cut stage. J Cent S Univ. 2013;44(8):3282–92.Suche in Google Scholar
[56] Chen H, Hu H, Wu H, Cao C, Sui Y. Advances in remaining oil researches of fine reservoir description. Sci Technol Eng. 2018;18(29):140–53.Suche in Google Scholar
[57] Zhang X, Guo H, Li H. Distribution characteristics and influencing factors of movable oil in tight oil reservoir. Sci Technol Eng. 2017;17(27):31–8.Suche in Google Scholar
[58] Lei X, Zhao CP, Zhang QL, Wang PR, Xiong RF. Effect of high-multiple water injection on rock pore structure and oil displacement efficiency. Energy Geosci. 2024;5(1):100137.10.1016/j.engeos.2022.09.007Suche in Google Scholar
© 2025 the author(s), published by De Gruyter
This work is licensed under the Creative Commons Attribution 4.0 International License.
Artikel in diesem Heft
- Research Articles
- Seismic response and damage model analysis of rocky slopes with weak interlayers
- Multi-scenario simulation and eco-environmental effect analysis of “Production–Living–Ecological space” based on PLUS model: A case study of Anyang City
- Remote sensing estimation of chlorophyll content in rape leaves in Weibei dryland region of China
- GIS-based frequency ratio and Shannon entropy modeling for landslide susceptibility mapping: A case study in Kundah Taluk, Nilgiris District, India
- Natural gas origin and accumulation of the Changxing–Feixianguan Formation in the Puguang area, China
- Spatial variations of shear-wave velocity anomaly derived from Love wave ambient noise seismic tomography along Lembang Fault (West Java, Indonesia)
- Evaluation of cumulative rainfall and rainfall event–duration threshold based on triggering and non-triggering rainfalls: Northern Thailand case
- Pixel and region-oriented classification of Sentinel-2 imagery to assess LULC dynamics and their climate impact in Nowshera, Pakistan
- The use of radar-optical remote sensing data and geographic information system–analytical hierarchy process–multicriteria decision analysis techniques for revealing groundwater recharge prospective zones in arid-semi arid lands
- Effect of pore throats on the reservoir quality of tight sandstone: A case study of the Yanchang Formation in the Zhidan area, Ordos Basin
- Hydroelectric simulation of the phreatic water response of mining cracked soil based on microbial solidification
- Spatial-temporal evolution of habitat quality in tropical monsoon climate region based on “pattern–process–quality” – a case study of Cambodia
- Early Permian to Middle Triassic Formation petroleum potentials of Sydney Basin, Australia: A geochemical analysis
- Micro-mechanism analysis of Zhongchuan loess liquefaction disaster induced by Jishishan M6.2 earthquake in 2023
- Prediction method of S-wave velocities in tight sandstone reservoirs – a case study of CO2 geological storage area in Ordos Basin
- Ecological restoration in valley area of semiarid region damaged by shallow buried coal seam mining
- Hydrocarbon-generating characteristics of Xujiahe coal-bearing source rocks in the continuous sedimentary environment of the Southwest Sichuan
- Hazard analysis of future surface displacements on active faults based on the recurrence interval of strong earthquakes
- Structural characterization of the Zalm district, West Saudi Arabia, using aeromagnetic data: An approach for gold mineral exploration
- Research on the variation in the Shields curve of silt initiation
- Reuse of agricultural drainage water and wastewater for crop irrigation in southeastern Algeria
- Assessing the effectiveness of utilizing low-cost inertial measurement unit sensors for producing as-built plans
- Analysis of the formation process of a natural fertilizer in the loess area
- Machine learning methods for landslide mapping studies: A comparative study of SVM and RF algorithms in the Oued Aoulai watershed (Morocco)
- Chemical dissolution and the source of salt efflorescence in weathering of sandstone cultural relics
- Molecular simulation of methane adsorption capacity in transitional shale – a case study of Longtan Formation shale in Southern Sichuan Basin, SW China
- Evolution characteristics of extreme maximum temperature events in Central China and adaptation strategies under different future warming scenarios
- Estimating Bowen ratio in local environment based on satellite imagery
- 3D fusion modeling of multi-scale geological structures based on subdivision-NURBS surfaces and stratigraphic sequence formalization
- Comparative analysis of machine learning algorithms in Google Earth Engine for urban land use dynamics in rapidly urbanizing South Asian cities
- Study on the mechanism of plant root influence on soil properties in expansive soil areas
- Simulation of seismic hazard parameters and earthquakes source mechanisms along the Red Sea rift, western Saudi Arabia
- Tectonics vs sedimentation in foredeep basins: A tale from the Oligo-Miocene Monte Falterona Formation (Northern Apennines, Italy)
- Investigation of landslide areas in Tokat-Almus road between Bakımlı-Almus by the PS-InSAR method (Türkiye)
- Predicting coastal variations in non-storm conditions with machine learning
- Cross-dimensional adaptivity research on a 3D earth observation data cube model
- Geochronology and geochemistry of late Paleozoic volcanic rocks in eastern Inner Mongolia and their geological significance
- Spatial and temporal evolution of land use and habitat quality in arid regions – a case of Northwest China
- Ground-penetrating radar imaging of subsurface karst features controlling water leakage across Wadi Namar dam, south Riyadh, Saudi Arabia
- Rayleigh wave dispersion inversion via modified sine cosine algorithm: Application to Hangzhou, China passive surface wave data
- Fractal insights into permeability control by pore structure in tight sandstone reservoirs, Heshui area, Ordos Basin
- Debris flow hazard characteristic and mitigation in Yusitong Gully, Hengduan Mountainous Region
- Research on community characteristics of vegetation restoration in hilly power engineering based on multi temporal remote sensing technology
- Identification of radial drainage networks based on topographic and geometric features
- Trace elements and melt inclusion in zircon within the Qunji porphyry Cu deposit: Application to the metallogenic potential of the reduced magma-hydrothermal system
- Pore, fracture characteristics and diagenetic evolution of medium-maturity marine shales from the Silurian Longmaxi Formation, NE Sichuan Basin, China
- Study of the earthquakes source parameters, site response, and path attenuation using P and S-waves spectral inversion, Aswan region, south Egypt
- Source of contamination and assessment of potential health risks of potentially toxic metal(loid)s in agricultural soil from Al Lith, Saudi Arabia
- Regional spatiotemporal evolution and influencing factors of rural construction areas in the Nanxi River Basin via GIS
- An efficient network for object detection in scale-imbalanced remote sensing images
- Effect of microscopic pore–throat structure heterogeneity on waterflooding seepage characteristics of tight sandstone reservoirs
- Environmental health risk assessment of Zn, Cd, Pb, Fe, and Co in coastal sediments of the southeastern Gulf of Aqaba
- A modified Hoek–Brown model considering softening effects and its applications
- Evaluation of engineering properties of soil for sustainable urban development
- The spatio-temporal characteristics and influencing factors of sustainable development in China’s provincial areas
- Application of a mixed additive and multiplicative random error model to generate DTM products from LiDAR data
- Gold vein mineralogy and oxygen isotopes of Wadi Abu Khusheiba, Jordan
- Prediction of surface deformation time series in closed mines based on LSTM and optimization algorithms
- 2D–3D Geological features collaborative identification of surrounding rock structural planes in hydraulic adit based on OC-AINet
- Spatiotemporal patterns and drivers of Chl-a in Chinese lakes between 1986 and 2023
- Land use classification through fusion of remote sensing images and multi-source data
- Nexus between renewable energy, technological innovation, and carbon dioxide emissions in Saudi Arabia
- Analysis of the spillover effects of green organic transformation on sustainable development in ethnic regions’ agriculture and animal husbandry
- Factors impacting spatial distribution of black and odorous water bodies in Hebei
- Large-scale shaking table tests on the liquefaction and deformation responses of an ultra-deep overburden
- Impacts of climate change and sea-level rise on the coastal geological environment of Quang Nam province, Vietnam
- Reservoir characterization and exploration potential of shale reservoir near denudation area: A case study of Ordovician–Silurian marine shale, China
- Seismic prediction of Permian volcanic rock reservoirs in Southwest Sichuan Basin
- Application of CBERS-04 IRS data to land surface temperature inversion: A case study based on Minqin arid area
- Geological characteristics and prospecting direction of Sanjiaoding gold mine in Saishiteng area
- Research on the deformation prediction model of surrounding rock based on SSA-VMD-GRU
- Geochronology, geochemical characteristics, and tectonic significance of the granites, Menghewula, Southern Great Xing’an range
- Hazard classification of active faults in Yunnan base on probabilistic seismic hazard assessment
- Characteristics analysis of hydrate reservoirs with different geological structures developed by vertical well depressurization
- Estimating the travel distance of channelized rock avalanches using genetic programming method
- Landscape preferences of hikers in Three Parallel Rivers Region and its adjacent regions by content analysis of user-generated photography
- New age constraints of the LGM onset in the Bohemian Forest – Central Europe
- Characteristics of geological evolution based on the multifractal singularity theory: A case study of Heyu granite and Mesozoic tectonics
- Soil water content and longitudinal microbiota distribution in disturbed areas of tower foundations of power transmission and transformation projects
- Oil accumulation process of the Kongdian reservoir in the deep subsag zone of the Cangdong Sag, Bohai Bay Basin, China
- Investigation of velocity profile in rock–ice avalanche by particle image velocimetry measurement
- Optimizing 3D seismic survey geometries using ray tracing and illumination modeling: A case study from Penobscot field
- Sedimentology of the Phra That and Pha Daeng Formations: A preliminary evaluation of geological CO2 storage potential in the Lampang Basin, Thailand
- Improved classification algorithm for hyperspectral remote sensing images based on the hybrid spectral network model
- Map analysis of soil erodibility rates and gully erosion sites in Anambra State, South Eastern Nigeria
- Identification and driving mechanism of land use conflict in China’s South-North transition zone: A case study of Huaihe River Basin
- Evaluation of the impact of land-use change on earthquake risk distribution in different periods: An empirical analysis from Sichuan Province
- A test site case study on the long-term behavior of geotextile tubes
- An experimental investigation into carbon dioxide flooding and rock dissolution in low-permeability reservoirs of the South China Sea
- Detection and semi-quantitative analysis of naphthenic acids in coal and gangue from mining areas in China
- Comparative effects of olivine and sand on KOH-treated clayey soil
- YOLO-MC: An algorithm for early forest fire recognition based on drone image
- Earthquake building damage classification based on full suite of Sentinel-1 features
- Potential landslide detection and influencing factors analysis in the upper Yellow River based on SBAS-InSAR technology
- Assessing green area changes in Najran City, Saudi Arabia (2013–2022) using hybrid deep learning techniques
- An advanced approach integrating methods to estimate hydraulic conductivity of different soil types supported by a machine learning model
- Hybrid methods for land use and land cover classification using remote sensing and combined spectral feature extraction: A case study of Najran City, KSA
- Streamlining digital elevation model construction from historical aerial photographs: The impact of reference elevation data on spatial accuracy
- Analysis of urban expansion patterns in the Yangtze River Delta based on the fusion impervious surfaces dataset
- A metaverse-based visual analysis approach for 3D reservoir models
- Late Quaternary record of 100 ka depositional cycles on the Larache shelf (NW Morocco)
- Integrated well-seismic analysis of sedimentary facies distribution: A case study from the Mesoproterozoic, Ordos Basin, China
- Study on the spatial equilibrium of cultural and tourism resources in Macao, China
- Urban road surface condition detecting and integrating based on the mobile sensing framework with multi-modal sensors
- Application of improved sine cosine algorithm with chaotic mapping and novel updating methods for joint inversion of resistivity and surface wave data
- The synergistic use of AHP and GIS to assess factors driving forest fire potential in a peat swamp forest in Thailand
- Dynamic response analysis and comprehensive evaluation of cement-improved aeolian sand roadbed
- Rock control on evolution of Khorat Cuesta, Khorat UNESCO Geopark, Northeastern Thailand
- Gradient response mechanism of carbon storage: Spatiotemporal analysis of economic-ecological dimensions based on hybrid machine learning
- Comparison of several seismic active earth pressure calculation methods for retaining structures
- Mantle dynamics and petrogenesis of Gomer basalts in the Northwestern Ethiopia: A geochemical perspective
- Study on ground deformation monitoring in Xiong’an New Area from 2021 to 2023 based on DS-InSAR
- Paleoenvironmental characteristics of continental shale and its significance to organic matter enrichment: Taking the fifth member of Xujiahe Formation in Tianfu area of Sichuan Basin as an example
- Equipping the integral approach with generalized least squares to reconstruct relict channel profile and its usage in the Shanxi Rift, northern China
- InSAR-driven landslide hazard assessment along highways in hilly regions: A case-based validation approach
- Attribution analysis of multi-temporal scale surface streamflow changes in the Ganjiang River based on a multi-temporal Budyko framework
- Maps analysis of Najran City, Saudi Arabia to enhance agricultural development using hybrid system of ANN and multi-CNN models
- Hybrid deep learning with a random forest system for sustainable agricultural land cover classification using DEM in Najran, Saudi Arabia
- Long-term evolution patterns of groundwater depth and lagged response to precipitation in a complex aquifer system: Insights from Huaibei Region, China
- Remote sensing and machine learning for lithology and mineral detection in NW, Pakistan
- Spatial–temporal variations of NO2 pollution in Shandong Province based on Sentinel-5P satellite data and influencing factors
- Numerical modeling of geothermal energy piles with sensitivity and parameter variation analysis of a case study
- Stability analysis of valley-type upstream tailings dams using a 3D model
- Variation characteristics and attribution analysis of actual evaporation at monthly time scale from 1982 to 2019 in Jialing River Basin, China
- Investigating machine learning and statistical approaches for landslide susceptibility mapping in Minfeng County, Xinjiang
- Investigating spatiotemporal patterns for comprehensive accessibility of service facilities by location-based service data in Nanjing (2016–2022)
- A pre-treatment method for particle size analysis of fine-grained sedimentary rocks, Bohai Bay Basin, China
- Study on the formation mechanism of the hard-shell layer of liquefied silty soil
- Comprehensive analysis of agricultural CEE: Efficiency assessment, mechanism identification, and policy response – A case study of Anhui Province
- Simulation study on the damage and failure mechanism of the surrounding rock in sanded dolomite tunnels
- Towards carbon neutrality: Spatiotemporal evolution and key influences on agricultural ecological efficiency in Northwest China
- Review Articles
- Humic substances influence on the distribution of dissolved iron in seawater: A review of electrochemical methods and other techniques
- Applications of physics-informed neural networks in geosciences: From basic seismology to comprehensive environmental studies
- Ore-controlling structures of granite-related uranium deposits in South China: A review
- Shallow geological structure features in Balikpapan Bay East Kalimantan Province – Indonesia
- A review on the tectonic affinity of microcontinents and evolution of the Proto-Tethys Ocean in Northeastern Tibet
- Advancements in machine learning applications for mineral prospecting and geophysical inversion: A review
- Special Issue: Natural Resources and Environmental Risks: Towards a Sustainable Future - Part II
- Depopulation in the Visok micro-region: Toward demographic and economic revitalization
- Special Issue: Geospatial and Environmental Dynamics - Part II
- Advancing urban sustainability: Applying GIS technologies to assess SDG indicators – a case study of Podgorica (Montenegro)
- Spatiotemporal and trend analysis of common cancers in men in Central Serbia (1999–2021)
- Minerals for the green agenda, implications, stalemates, and alternatives
- Spatiotemporal water quality analysis of Vrana Lake, Croatia
- Functional transformation of settlements in coal exploitation zones: A case study of the municipality of Stanari in Republic of Srpska (Bosnia and Herzegovina)
- Hypertension in AP Vojvodina (Northern Serbia): A spatio-temporal analysis of patients at the Institute for Cardiovascular Diseases of Vojvodina
- Regional patterns in cause-specific mortality in Montenegro, 1991–2019
- Spatio-temporal analysis of flood events using GIS and remote sensing-based approach in the Ukrina River Basin, Bosnia and Herzegovina
- Flash flood susceptibility mapping using LiDAR-Derived DEM and machine learning algorithms: Ljuboviđa case study, Serbia
- Geocultural heritage as a basis for geotourism development: Banjska Monastery, Zvečan (Serbia)
- Assessment of groundwater potential zones using GIS and AHP techniques – A case study of the zone of influence of Kolubara Mining Basin
- Impact of the agri-geographical transformation of rural settlements on the geospatial dynamics of soil erosion intensity in municipalities of Central Serbia
- Where faith meets geomorphology: The cultural and religious significance of geodiversity explored through geospatial technologies
- Applications of local climate zone classification in European cities: A review of in situ and mobile monitoring methods in urban climate studies
- Complex multivariate water quality impact assessment on Krivaja River
- Ionization hotspots near waterfalls in Eastern Serbia’s Stara Planina Mountain
- Shift in landscape use strategies during the transition from the Bronze age to Iron age in Northwest Serbia
- Assessing the geotourism potential of glacial lakes in Plav, Montenegro: A multi-criteria assessment by using the M-GAM model
- Flash flood potential index at national scale: Susceptibility assessment within catchments
- SWAT modelling and MCDM for spatial valuation in small hydropower planning