Spatial–temporal variations of NO2 pollution in Shandong Province based on Sentinel-5P satellite data and influencing factors
-
Siting Zeng
 ,
Fengwei Wang
,
Fengwei Wang

Abstract
With the rapid development of the social economy, nitrogen dioxide (NO2), a trace gas that is an air pollutant, has dual impacts on human health and climate change. In this study, the Google Earth Engine platform is used to retrieve the vertical column concentration inverted by the Tropospheric Monitoring Instrument (TROPOMI) sensor onboard the Sentinel-5 Precursor satellite, and the characteristics of the spatial–temporal distribution of the tropospheric NO2 column concentration in Shandong Province from 2019 to 2023 are analyzed. The results show that there is a high correlation between the NO2 column concentration retrieved from the TROPOMI and the NO2 concentration observed at ground-level monitoring points in Shandong Province (R = 0.8289). The distribution of the NO2 column concentration in Shandong Province exhibits a progressive structure of “high in the west and low in the east” with significant spatial heterogeneity. In addition, the fluctuation in the NO2 column concentration in Shandong Province has obvious cyclical and seasonal characteristics, and the change rate is “summerflat in spring and autumn, high in winter and low in summer.” The results of the geographical detectors indicate that temperature has the greatest influence on the NO2 column concentration in Shandong Province (q = 0.5). The geographically weighted regression model indicated that the NO2 column concentration was negatively correlated with the topography, temperature, and precipitation, and the correlation coefficients are −0.010, −0.952, and −0.330, respectively. It is positively correlated with the intensity of human activities, the degree of urbanization of the land, and the population density, and the correlation coefficients are 0.1610, 0.982, and 0.001, respectively.
1 Introduction
1.1 Status of atmospheric pollutants in nitrogen dioxide (NO2) and ozone (O3)
With the rapid development of the global socioeconomy, industrialization, and urbanization, air quality is increasingly deteriorating [1]. In 2020, the World Health Organization (WHO) published the “Global Air Quality Guidelines,” which highlighted that the number of deaths caused by air pollution worldwide reached several million, resulting in a significant economic burden. Consequently, the control and improvement of air quality has become an essential component of global environmental governance. To reduce global public health risks, the WHO issued the newly revised “Global Air Quality Guidelines (2021)” (hereinafter referred to as “AQG 2021”) to provide new target references for the atmospheric environmental governance of various countries [2]. In 2023, the WHO demonstrated in the Outcome Report that the implementation of various measures, such as air quality and hygienic control measures, added to the health of people around the globe.
In the study of global air pollutants, the focus is on PM2.5, PM10, O3, NO2, sulfur dioxide (SO2), and carbon monoxide (CO). According to their formation mode, pollutants can be divided into primary pollutants (such as NO2 and SO2) and secondary pollutants (such as particulate matter [PM] and O3). Primary pollutants NO2 and SO2 mainly originate from the combustion of coal, oil, natural gas, and other fuels. They also act as key precursors for PM formation. NO2 is additionally a critical precursor for O3 formation. The spatiotemporal distribution characteristics of NO2 and O3 can directly reflect the spatial differences in pollution sources and the complexity of atmospheric chemical processes.
NO2, a trace gas that is an air pollutant, plays a significant role in the troposphere, contributing to a range of urban environmental pollution problems, including acid rain, smog, and photochemical smog [3,4,5,6]. Furthermore, NO2 can be employed to ascertain regional and global air quality, human health, climate change, and ecological conditions. Atmospheric NO2 pollution can have numerous adverse effects on human health. Even if the exposure level of NO2 is below the regulatory limit, there is still a substantial public health risk [7]. Additionally, air pollution has a relatively close relationship with infectious diseases, such as childhood asthma [8] and respiratory and cardiovascular disease [9]. Whereas O3 is mainly produced by photochemical reactions of NO x with volatile organic compounds (VOCs), O3 and NO2 are closely linked through photochemical cycles. Compounds such as RO2 and HO2 convert NO to NO2 without consuming O3, leading to O3 formation. O3, a secondary photochemical product, is also generated through NO2 photolysis [10]. In 2009, Chang et al. (1951–2000) demonstrated that the increase in O3 radiative forcing in eastern China was closely tied to rising NO x emissions. Rapid industrialization in the region led to higher NO x emissions, which enhanced photochemical O3 production. Anthropogenic emissions (e.g., NO x ) drive O3’s climate effects [11]. Quantifying changes in O3 precursor emissions revealed that stratospheric O3 depletion significantly impacted the stratosphere, despite increases in anthropogenic O3 precursors [12]. Additionally, studies indicate that climate warming-induced vegetation drought stress may weaken terrestrial ecosystems’ ability to absorb O3. This not only exacerbates surface O3 pollution extremes but could also offset the O3 reduction achieved in Europe over the past three decades through stringent emission controls [13]. Such vegetation–climate–pollution interactions underscore new challenges for air quality management under climate change.
In addition, changes in O3 indirectly affect aerosols. O3 influences aerosol concentrations through ecological and hydrological cycles, while aerosol changes can, in turn, alter ozone levels [14]. Aerosols can delay precipitation by interacting with clouds when rainfall or snowfall exceeds climatic norms. They also absorb solar radiation, modifying atmospheric stability and further impacting precipitation development [15]. Extreme precipitation events can alter air pollutant concentrations through humidity and concentration effects [16]. For example, Fan et al. [17] found that the 2013 extreme flooding in the Sichuan Basin likely resulted from aerosol-enhanced conditional instability, which intensified nocturnal convection and precipitation in mountainous areas. The resulting rainfall was more severe than in other regions, prompting calls for stricter air pollutant controls to mitigate future flooding risks. In contrast, prolonged low precipitation and high evapotranspiration reduce soil moisture and groundwater levels, leading to droughts and water scarcity. As one of the most destructive natural disasters, extreme droughts elevate the frequency, intensity, and spatial extent of wildfires [18]. Concurrently, heatwaves – extreme overheating events – directly exacerbate wildfires and increase emissions of VOCs and NO2 [19,20].
From the perspective of spatial distribution characteristics, NO2 concentrations in China exhibit significant heterogeneity. In 2013, Xu et al. analyzed tropospheric NO2 trends from 1996 to 2010 and found distinct spatial disparities, with an overall increasing trend, particularly in economically developed regions like the North China Plain, Yangtze River Delta, Pearl River Delta, and Liaodong Peninsula [21]. Gao et al. studied NO2 variations in the Yangtze River Delta (2005–2013) and observed the lowest concentrations in summer and the highest in winter, followed by autumn and spring. NO2 levels increased continuously in northern Jiangsu and mid-southern Zhejiang but stabilized in southern Jiangsu and Northeastern Zhejiang. Notably, they found that abnormally low temperatures and dry weather significantly elevated NO2 concentrations [22]. In 2019, Wang et al. analyzed the spatiotemporal variation characteristics of NO2 concentrations in the Pearl River Delta region from January to August 2019 and found that the NO2 concentrations across the Pearl River Delta exhibited an overall “concave” pattern, which was associated with urban economic conditions and industrial structures [23]. In the same year, Zhao et al. focused on the North China Plain, revealing concentrated NO2 pollution in Henan, Hebei, and Tianjin (January–August 2019), highlighting the need for sustained attention to industrial city air pollution [24].
At the end of 2019, China implemented emergency measures such as work stoppages and remote working during the early stages of the Coronavirus disease 2019 (COVID-19) pandemic. These measures effectively contained the outbreak but also extended the period of weakened socioeconomic activity by 2–3 weeks, causing short-term suppression of economic activity while significantly reducing air pollutant concentrations [25]. In 2020, Tao et al. used Ozone Monitoring Instrument (OMI) satellite data to analyze changes in NO2 concentrations across China following the resumption of work and production [26]. Later in 2023, Cheng et al. employed the Environmental Trace Gases Monitoring Instrument to study NO2 variations during the pandemic in Europe, Iran, South Korea, and eastern China. They observed a significant decline in average NO2 levels during lockdowns, attributing this primarily to reduced emissions from transportation and industrial activities [27]. During the lockdown period, the decrease in NO2 concentrations was more significant in economically developed and densely populated cities. Provinces with historically high NO2 emissions, such as Jiangsu, Henan, and Shandong provinces, were particularly prominently affected by the pandemic measures [28]. Also in 2023, Wu et al. investigated NO2 spatiotemporal patterns and their socioeconomic linkages in Shanxi Province during the pandemic. They found significantly higher NO2 concentrations in the Guanzhong Plain, Northern Shanxi, and peri-urban areas compared to other regions, while socioeconomic activities were markedly impacted by containment policies. This further confirmed the strong correlation between NO2 fluctuations and human activity [29]. These studies demonstrate that in recent years, tropospheric NO2 and O3 pollution has severely affected developed regions like the Beijing–Tianjin–Hebei cluster, Yangtze River Delta, and Guangdong–Hong Kong–Macao Area, hindering nationwide air quality improvement efforts.
1.2 Air pollution monitoring by satellite remote sensing
With the changes in the needs of global and national environmental governance management, the development and updating of global or local monitoring methods and information is a constant process. Compared with traditional ground monitoring instruments, satellite remote sensing overcomes the limitations of ground measurements and can observe gaseous pollutants for a long time, thereby providing near-real-time measurement products from low to high spatial resolution, which can be applied to investigate the spatiotemporal distribution patterns of pollutants at multiple scales, as well as to infer the inversion of pollutants and the driving mechanisms behind them. Since 1995, the European Space Agency (ESA) has successively launched a series of instruments, including the Global Ozone Monitoring Experiment (GOME), Scanning Imaging Absorption Spectrometer for Atmospheric Cartography (SCIAMACHY), Tropospheric Monitoring Instrument (TROPOMI), the OMI on the Earth Observation System-Aura satellite of the National Aeronautics and Space Administration, and the GOME-2 on Meteorological operational satellite-A and Meteorological operational satellite-B (Metop-A and Metop-B) of the European Meteorological Satellite Organization, all of which can monitor the concentration of NO2 in the atmosphere.
In 2001, Leue et al. [30] proposed a quantitative method for determining global NO2 concentrations based on long time series images from the GOME monitor. In 2015, Van Damme et al. [31] employed the Metop-A instrument to monitor the seasonal pattern and inter-annual changes in NH3 in the atmosphere and found that the distribution of NH4 in various regions of the world exhibits discernible and distinctive cycles. Krotkov et al. [32] utilized OMI to observe changes in global NO2 and SO2 pollution from 2005 to 2015. The observation capabilities of the OMI sensor reflect rapid changes in air quality in different regions. Zhang et al. [33] identified the long-term trend in the NO2 concentration in China from 1997 to 2016 based on the NO2 spectral columns of the GOME, SCIAMACHY, and GOME-2A platforms. In 2017, Chen et al. [34] compared the spatiotemporal changes in the tropospheric NO2 column (TNC) products in China across five satellites, including the GOME, SCIAMACHY, OMI, GOME-2/Metop-B, and GOME-2/Metop-B. Zhang et al. [35] used the “POMINO” inversion algorithm to perform a quantitative comparative analysis of the main OMI satellite products and discussed the impact of POMINO–TROPOMI product updates and other issues.
At present, the TROPOMI mounted on the Sentinel-5P satellite of the ESA is currently the world’s most advanced satellite sensor, which further improves the accuracy and spatial resolution of monitoring and can be used to effectively monitor the global atmosphere. The TROPOMI has a higher signal-to-noise ratio and finer spatial resolution than the OMI, effectively improving the quality and accuracy of the data [36]. Butz et al. [37] proposed an accurate retrieval method based on the monitoring data of the TROPOMI to minimize the error introduced by the scattering of aerosols and cirrus particles as much as possible. Vîrghileanu et al. [38] used the Sentinel-5P satellite to monitor the changes in NO2 pollution in Europe during the outbreak of COVID-19 and performed cross-correlation analysis with ground-based NO2 data, verifying that the Sentinel-5P product can well reflect the dynamics of NO2 pollution in Europe. Moreover, Lorente et al. [39] used the TROPOMI sensor to determine the spatiotemporal distribution characteristics of NO2 emissions in cities and verified the results with an air quality database. Due to the wide distribution of coal-fired power plants in South Africa, Shikwambana et al. [40] reported for the first time the observation results of SO2 and NO2 over South Africa by Sentinel-5P and observed that SO2 and NO2 showed a partial diffusion trend in the South African region in winter, and the opposite in summer. van der Velde et al. [41] distinguished the emission of NO2 and CO from flame combustion and smoldering combustion by monitoring with the TROPOMI to study the spatial and temporal efficiency of fire combustion. In 2022, Bodah et al. [42] analyzed the monitoring data of atmospheric NO2 and CO2 pollutants from Sentinel-5P products, focusing on urban air quality and environmental assessment research. Zheng et al. [43] used the Sentinel-5P product to analyze the spatiotemporal distribution and change characteristics of the tropospheric NO2 concentration in mainland China and then further analyzed the spatiotemporal distribution of the tropospheric NO2 in the Guangdong–Hong Kong–Macao Greater Bay Area of China based on the Google Earth Engine (GEE) cloud platform [44]. In 2022, Liu et al. [45] used the Sentinel-5P product to explore the significant ring structure of the NO2 concentration in China and revealed the importance of urbanization on NO2 emissions.
Shandong Province is a significant agricultural and industrial center in China. Rapid urbanization has intensified regional pollution. China is currently focusing on the prevention and control of air pollution in the Beijing–Tianjin–Hebei region and its surrounding areas. In this context, the country has proposed air pollution control tasks for the “2 + 26” cities [46]. In 2023, China implemented a revised approach to air pollution prevention and control, with a focus on “2 + 36” key cities. This holistic strategy aims to address air pollution challenges in the Beijing–Tianjin–Hebei region, the Yangtze River Delta, and other areas. At present, there are relatively few studies on NO2 pollution monitoring in Shandong Province based on Sentinel-5P remote sensing. It is of great significance and application value to use the high-resolution TROPOMI on Sentinel-5P to monitor the NO2 column concentration in Shandong Province, analyze its spatiotemporal distribution characteristics, explore its potential influencing factors, and provide data to support the government in formulating pollution prevention and reduction policies. Therefore, this article obtained NO2 column concentration data for Shandong Province from January 2019 to December 2023 based on the GEE cloud platform, analyzed the spatial distribution and changes in the NO2 concentration in Shandong Province, and explored the potential influencing factors of NO2 pollutants in Shandong Province. The remainder of this article is organized as follows: the study area, data sources, and processing methods are briefly presented in Section 2, the results and analysis are presented in Section 3, and conclusions are given in Section 4.
2 Materials and methods
2.1 Study area
Shandong Province is located in the lower reaches of the Yellow River in the eastern coastal region of China, with geographic coordinates of 114°48′ to 122°42′ east longitude and 34°23′ to 38°17′ north latitude. It has a temperate monsoon climate, with warm and humid summers and cold and dry winters. The land area is 155,800 km2. Shandong Province is the only province in the country that has 41 major industrial categories within the province, and in 2021, the total industrial value added of Shandong Province ranked third in the country, second only to Guangdong and Jiangsu. Due to various factors, such as high population density and industrial scale development, the air pollution in Shandong Province is not ideal. The administrative division of Shandong Province is the vector data of the provincial, city, and county-level administrative divisions of Tianditu in 2024, with verification number of GS (2024) 0650 and a coordinate system of GCS_WGS_1984 (Figure 1).
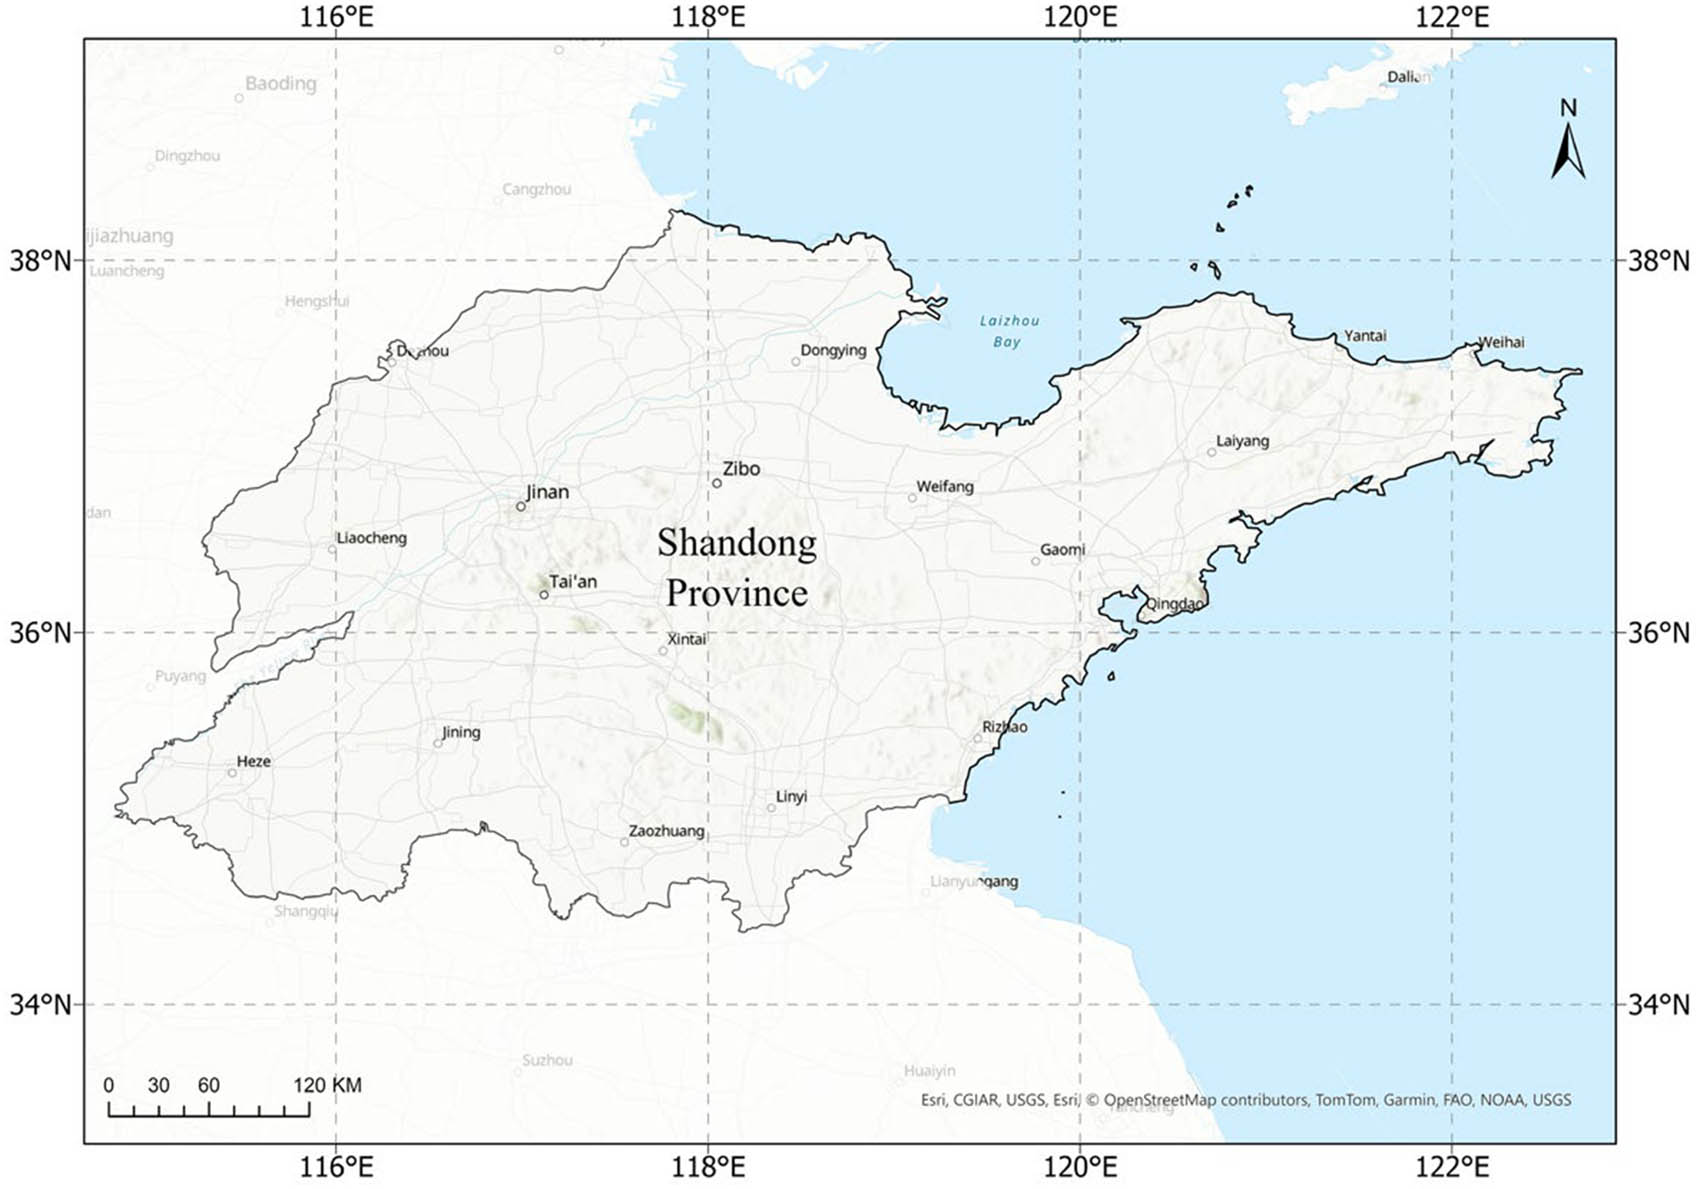
Geographical map of Shandong Province. Note: The map is made based on the standard map with the review number GS (2024) 0650, downloaded from the Standard Map Service of the Ministry of Natural Resources.
2.2 Data Sources
2.2.1 Sentinel-5P TROPOMI NO2
The Sentinel-5 Precursor is a satellite launched by the ESA on October 13, 2017, for air pollution monitoring. The satellite has improved the spatial resolution and signal-to-noise ratio, with a signal-to-noise ratio increase of a factor of 5, which is sufficient for monitoring various pollutants in the air [47]. The TROPOMI NO2 retrieval of TROPOMI uses the DOMINO method, which was originally developed for the NO2 inversion development method specifically for OMI sensors and applied to the NO2 inversion of multiple sensors (OMI, GOME-2, SCIAMACHY, and GOME) in the QA4ECV project [48]. In 2011, Boersma et al. proposed an improved tropospheric NO2 column retrieval algorithm (DOMINO v2.0), which corrected the across-track stripes problem caused by OMI backscatter reflectivity calibration errors, utilized the improved air mass factor (AMF) calculation, and increased the sensitivity to high-altitude NO2 distribution [49]. The TROPOMI NO2 Level 3 (L3) product of GEE cloud computing platform (COPERNICUS/S5P/OFFL/L3_NO2) utilizes the official L2 product and DOMINO v2.0 algorithm (following OMI’s QA4ECV reprocessing project). The TM5-MP chemical transport model (1° × 1° resolution) was utilized to optimize the AMF calculation. TM5-MP is a TROPOMI auxiliary model specified by the ESA. Its simulated vertical distribution of NO2 is used as an a priori profile required for calculations, converting the satellite-observed inclined column concentration into vertical column density (VCD). At the same time, the high-quality NO2 vertical profile provided by this model can effectively reduce the error of AMF in polluted regions [50]. After the inversion modeling, three-dimensional assimilation and grid data processing were further carried out, the effective pixels are integrated by median aggregation, and the data with quality mark “qa_mean > 0.6” were screened, and finally the tropospheric NO2 VCD and total NO2 column concentration products with 0.1° × 0.1° grid were generated, namely the “COPERNICUS/S5P/OFFL/L3_NO2” dataset.
Compared with L2 products, the gridded data in the L3 products provided by GEE avoids the complicated spatio-temporal matching operation of the original L2 data, and the unified assimilation process based on the TM5-MP model reduces the systematic deviation between regions. In this study, after eliminating pixels with quality assurance values less than 50 in the third-level Sentinel 5p NO2 offline products, a total of 28,725 satellite images covering the VCD of Shandong Province from January 2019 to December 2023 were selected, and 60 NO2 column concentration images of Shandong Province were synthesized monthly.
2.2.2 Surface O3 dataset based on satellite inversion
Zhu et al. [51] trained and validated Chinese, European, and US surface O3 data by using the deep learning algorithm of the Deep Forest v2021.2. 1 (DF21) model based on the LESO system, combining field measurement data from local institutions with multi-satellite data (such as TROPOMI O3 total column taken from near-real-time [NRTI] products and the total number of NO2 columns obtained by OMIs, etc.), providing calculations between surface O3 hourly surface O3 datasets provided by satellite inversion for ten years (2012–2021). This dataset shows excellent performance at 4,821 in situ sites, with strong correlation and slight deviation between predicted values and observed values, and accurately retrieves the spatial and temporal distribution of surface O3 in China, Europe, and the United States. This study uses monthly and annual data of surface O3 in China to further analyze the temporal and spatial distribution characteristics of O3 and its relationship with NO2 in Shandong Province.
2.2.3 Surface NO2 concentration data
China Urban Air Quality Real-time Publishing Platform (https://air.cnemc.cn:18007/) updates the national air quality data of China Ambient Air Quality Monitoring Station daily with a time resolution of 1 h, and the air pollutants monitored in real time are PM2.5, PM10, SO2, NO2, CO, and O3. In this article, according to the scope of China, the observation sites are selected to obtain the daily NO2 concentration change data by using linear interpolation and average value. The air quality NO2 monitoring data of each station in China obtained by processing are used as the monitoring reference data of surface NO2 concentration in China, and the monthly NO2 concentration (µg/m3) of each station in the study area is selected as the NO2 surface monitoring result for subsequent correlation analysis with the NO2 results retrieved by TROPOMI, and the distribution of stations in China.
2.2.4 Impact factor data
To verify the applicability of the NO2 inversion results from the TROPOMI in Shandong Province, air quality monitoring data collected from various stations in Shandong Province via the National Urban Air Quality Real-Time Release Platform were used as reference data for monitoring the ground NO2 concentration in Shandong Province. In this paper, the monthly NO2 concentration (µg/m3) at each station in the study area was selected as the NO2 ground monitoring result for subsequent correlation analysis with the NO2 result inverted by the TROPOMI.
The data pertinent to the analysis of potential influencing factors of NO2 in Shandong Province, as presented in this article, include the following:
Vegetation factors: The Kernel Normalized Difference Vegetation Index (kNDVI) was proposed by Camps-Valls et al. [52] in 2021 on the basis of the traditional NVDI and NIRv indexes. This index can make the best use of spectral information, more accurately measure carbon source dynamics and stabilize atmospheric CO2, alleviate the pressure of global climate change, and show stronger stability and robustness. The kNDVI is calculated using the global surface spectral reflectance provided by the “MOD09GA” product [53], with a spatial resolution of 500 m;
Terrain factors: The global Digital Elevation Model (DEM) dataset is derived from the “SRTM Digital Elevation Data” [54] with a spatial resolution of 30 m;
Meteorological factors: The temperature and precipitation dataset is derived from the “TerraClimate” product [55], which is a global monthly climate and hydrological dataset with high resolution and wide temporal coverage and a spatial resolution of 500 m;
Intensity of human activity: The nighttime light dataset used in this study is derived from the Suomi National Polar-orbiting Partnership/Visible Infrared Imaging Radiometer Suite (NPP/VIIRS) products, produced by the Earth Observation Group at the National Centers for Environmental Information (NCEI), National Oceanic and Atmospheric Administration, with a spatial resolution of 500 m [56].
Spatial distribution of the population: The population dataset is derived from the “LandScan” product of the Oak Ridge National Laboratory of the US Department of Energy (https://www.ornl.gov/), provided by East View Cartographic, with a spatial resolution of 1 km.
Degree of land urbanization: The land urbanization rate (LUR) was calculated using the CNLUCC dataset, which is sourced from the Resource and Environmental Science Data Platform [57], with a spatial resolution of 30 m. The remote sensing image data sources and resampling information are shown in Table 1.
Socioeconomic data: The socioeconomic statistics for Shandong Province (including population, GDP, total number of civilian vehicles, and number of licensed drivers) were obtained from the National Bureau of Statistics database (https://data.stats.gov.cn/) covering the period 2019–2023.
List of factor datasets
| Factors | Spatial resolution | |||
|---|---|---|---|---|
| Dataset (layer) | Original | Resampling | ||
| Natural factors | Vegetation factors | MOD09GA (kNDVI) | 500 m | 1 km |
| Topographic factors | SRTM DEM | 30 m | 1 km | |
| Meteorological factors | TerraClimate (temperature) | 500 m | 1 km | |
| TerraClimate (precipitation) | 500 m | 1 km | ||
| Social factors | Human activity factors | NPP/VIIR (Activity) | 500 m | 1 km |
| Population density factors | LandScan (population) | 1 km | Maintain 1 km | |
| Urbanization factors | CNLUCC(LUR) | 30 m | Maintain 30 m | |
2.3 Processing methods
2.3.1 Linear correlation analysis
Linear correlation analysis is used to measure the linear relationship between two variables, mainly to measure the linear correlation between the two variables. The value range is −1 to 1, where 0 indicates no linear correlation. The calculation formula is as follows:
where
2.3.2 Nonlinear normalized vegetation index
The kNDVI is a method that summarizes a wide range of VI series based on the differences and ratios of spectral bands [52]. The specific calculation equation is as follows:
where
2.3.3 Urbanization index of land
The ratio of urban land and other construction land in the China Land Use Remote Sensing Monitoring Dataset (CNLUCC) to the total scale of urban and rural construction land is calculated to construct the urbanization rate of land [58]. The calculation formula is as follows:
where
2.3.4 The geographical detector
A geographical detector is a statistical method used to explore and utilize spatial heterogeneity and to interpret the driving forces behind it. It can determine whether there is an interaction between two numerical or qualitative factors, thereby judging the influence of the factors on the dependent variable [59]. The calculation equation for single-factor detection is as follows:
where
Interaction Detection: To detect whether the explanatory power of two factors on the NO2 column concentration will change due to the interaction between the two factors, the explanatory power of the two factors on the NO2 column concentration,
Types of interactions
| Description | Interaction |
|---|---|
|
|
Weakened, nonlinear |
|
|
Weakened, unique |
|
|
Enhanced, bilinear |
|
|
Independent |
|
|
Enhanced, nonlinear |
2.3.5 Geographically weighted regression based on ordinary least squares (OLS)
OLS is employed to analyze the interrelationship between the explanatory variable and the dependent variable, with the objective of minimizing the sum of the squared residuals of all observations [44]. The equation is as follows:
where
Geographically weighted regression (GWR) is a local statistical analysis method that accurately depicts the geographical spatial relationships of a research object by exploring spatial changes in the research object [60]. The calculation equation is as follows:
where
3 Results and analysis
3.1 Comparison of Sentinel-5P inversion results with ground monitoring values
Current experimental studies demonstrate strong correlations between tropospheric NO2 column concentrations derived from satellite remote sensing (e.g., OMI and Sentinel-5P) and ground-level NO2 measurements. Judd et al. validated this relationship using airborne spectrometer measurements of NO2 columns, which showed good agreement with TROPOMI observations. Although TROPOMI sensors, while subject to prior surface reflectance and cloud pressure inversion errors in some urban scenarios, still offer unique advantages for validating TROPOMI in regions with large variations in NO2 concentration quantities, they can also be used in urban areas with high NO2 concentrations, and the inversion results can reach a high correlation with the ground measurement data [61]. At the same time, the accuracy of the TROPOMI inversion data can be verified by traditional ground detection equipment or by analyzing the correlation between the NO2 ground monitoring concentration released by the “China Urban Air Quality Monthly Report” and the TROPOMI inversion results [62].
This study selected the NO2 hourly concentration data series from 65 air quality monitoring stations in Shandong Province. After preprocessing, such as linear interpolation and adjacent averaging of the hourly NO2 concentration, we obtained the ground monthly NO2 concentration (µg/m3) data for Shandong Province. At the same time, we extracted the TROPOMI NO2 column concentration (mol/m2) at the corresponding geographical location and conducted a correlation analysis with the NO2 ground monitoring data. The specific results are presented in Figure 2. The results show that there is a good linear correlation between the ground NO2 concentration in Shandong Province and the NO2 column concentration in the troposphere
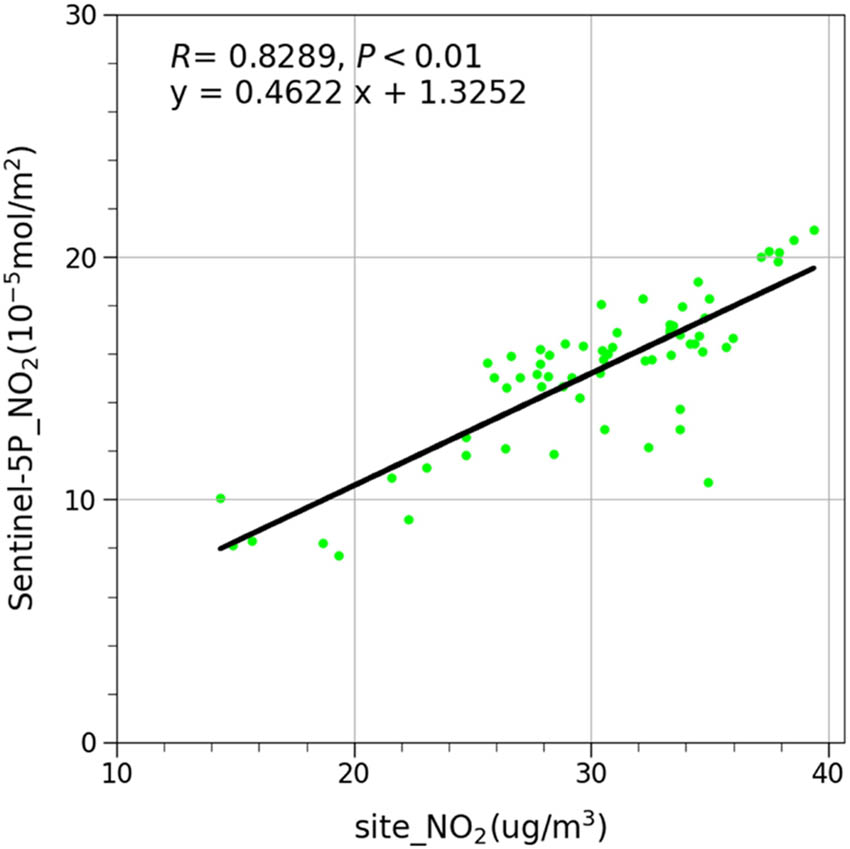
Correlation between site-based NO2 concentrations and tropospheric NO2 concentrations in Shandong Province.
3.2 Column concentration of NO2 and O3 in Shandong Province
3.2.1 Temporal variation of the NO2 column concentration
During the 60-month period from 2019 to 2023, the overall NO2 column concentration in Shandong Province exhibited fluctuations, with pronounced seasonal variations and periodic fluctuations. The monthly average NO2 column concentration during the research period is presented in Figure 3(a). The maximum NO2 column concentration in Shandong Province was observed in December 2020, reaching 37.37 × 10⁻⁵ mol/m2. Conversely, the minimum value was observed in August 2020, with a concentration of 4.53 × 10⁻⁵ mol/m2. The NO2 column concentration in Shandong Province exhibited a relatively stable pattern from April to September, with a low level throughout the year. From September to November, the NO2 column concentration maintained a stable upward trend. The annual NO2 column concentration peaked in December and January. Starting in February, the NO2 column concentration gradually returned to the low value observed in April.
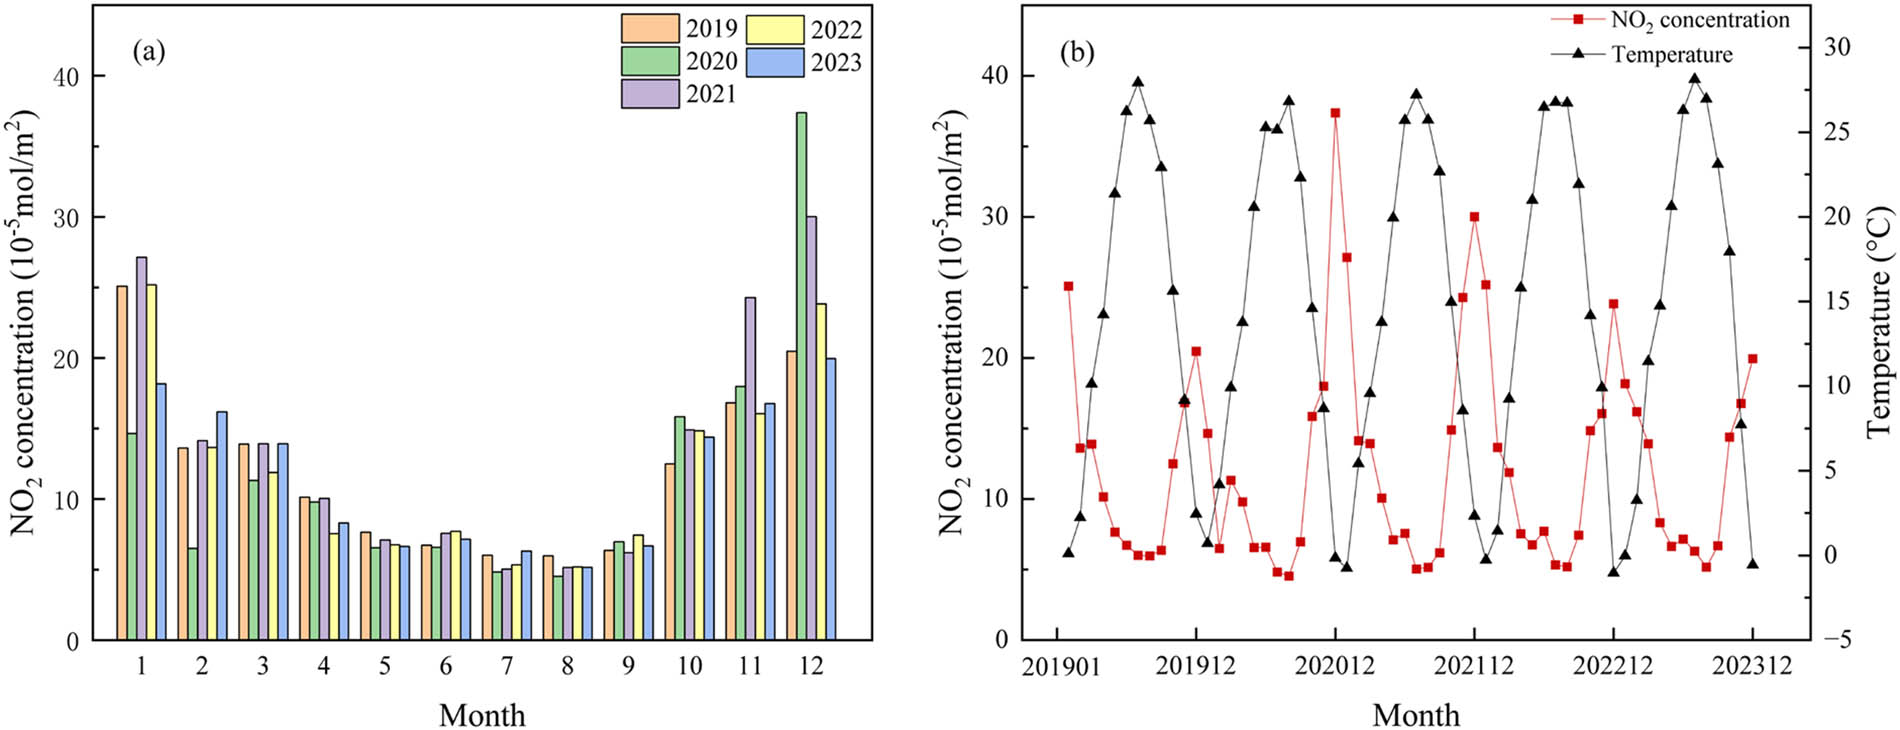
(a) Monthly variation characteristics of the NO2 concentration in Shandong Province from 2019 to 2023. (b) Monthly variation characteristics of 2023 NO2 concentration and temperature from 2019 to 2023.
The NO2 column concentration exhibited seasonal fluctuations, indicating a correlation between the NO2 concentration and temperature changes. This article further examined the NO2 concentration and monthly average temperature from 2019 to 2023, as illustrated in Figure 3(b). The results indicated a strong negative correlation between the two variables. Shandong Province is situated within the temperate monsoon climate zone, with simultaneous rain and heat. The climate is characterized by warm and humid conditions during the summer months and cold and dry conditions during the winter. When the temperature decreases, solar radiation diminishes, the rate of photochemical reactions decreases, and the residence time of NO2 in the troposphere increases, resulting in elevated NO2 concentrations. When the temperature increases, accompanied by increased rainfall [63], the concentration of NO2 decreases [64]. Consequently, fluctuations in temperature are among the factors influencing the seasonal variations in NO2 concentrations.
3.2.2 The spatial distribution of the NO2 column concentration
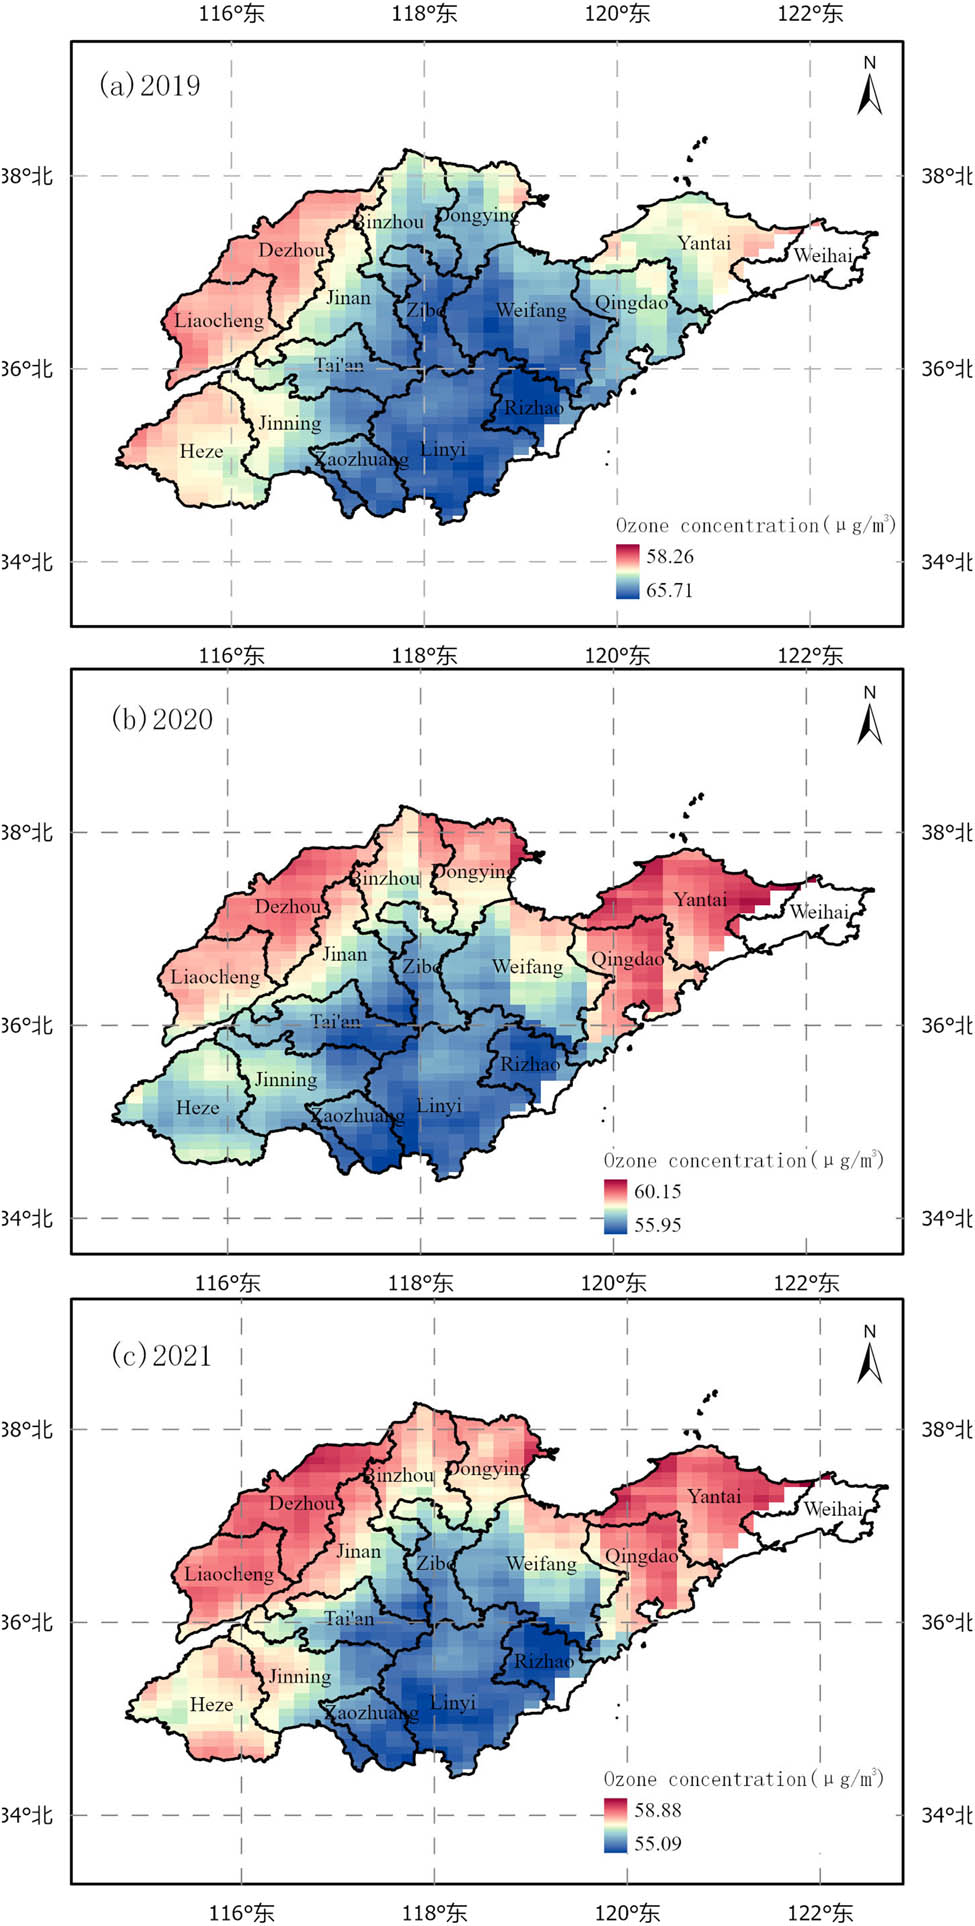
According to statistics on the annual spatial distribution of NO2 concentration in Shandong Province from 2019 to 2023, it can be seen from Figure 4 that NO2 air pollutants in Shandong Province are mainly distributed in the north-central and western regions of the province. In comparison with earlier years, the spatial distribution of NO2 in 2021 underwent significant modifications, as evidenced by the considerable enlargement of high-concentration areas in the north-central and western regions and the emergence of a clear diffusion trend. During 2019–2023, NO2 concentration aggregation centers appeared in Zibo City–Jinan City–Binzhou City, and the NO2 concentration in Linyi City was relatively low, but there was always a relatively high concentration in the central area of Linyi City from 2019 to 2020, which is related to the local industrial structure and emissions. As the capital city of Shandong Province, Jinan has a large population and affects the local industrial structure. According to statistics, the highest concentration of NO2 in Shandong Province appears in Binzhou City and spreads to the surroundings from this area as the center and gradually decreases, thus forming the NO2 gathering center of Zibo City–Jinan City–Binzhou City. It can be seen from Figure 4 that the eastern coastal areas of Shandong Province, such as Weihai, Yantai, and Qingdao, have humid air and low NO2 pollution levels. Affected by the industrial structure of non-heavy industries such as vigorous tourism and high level of foreign trade, the air environment is in good condition. It is worth noting that NO2 pollution in Qingdao shows a trend of gradually decreasing from the coast to the inland.
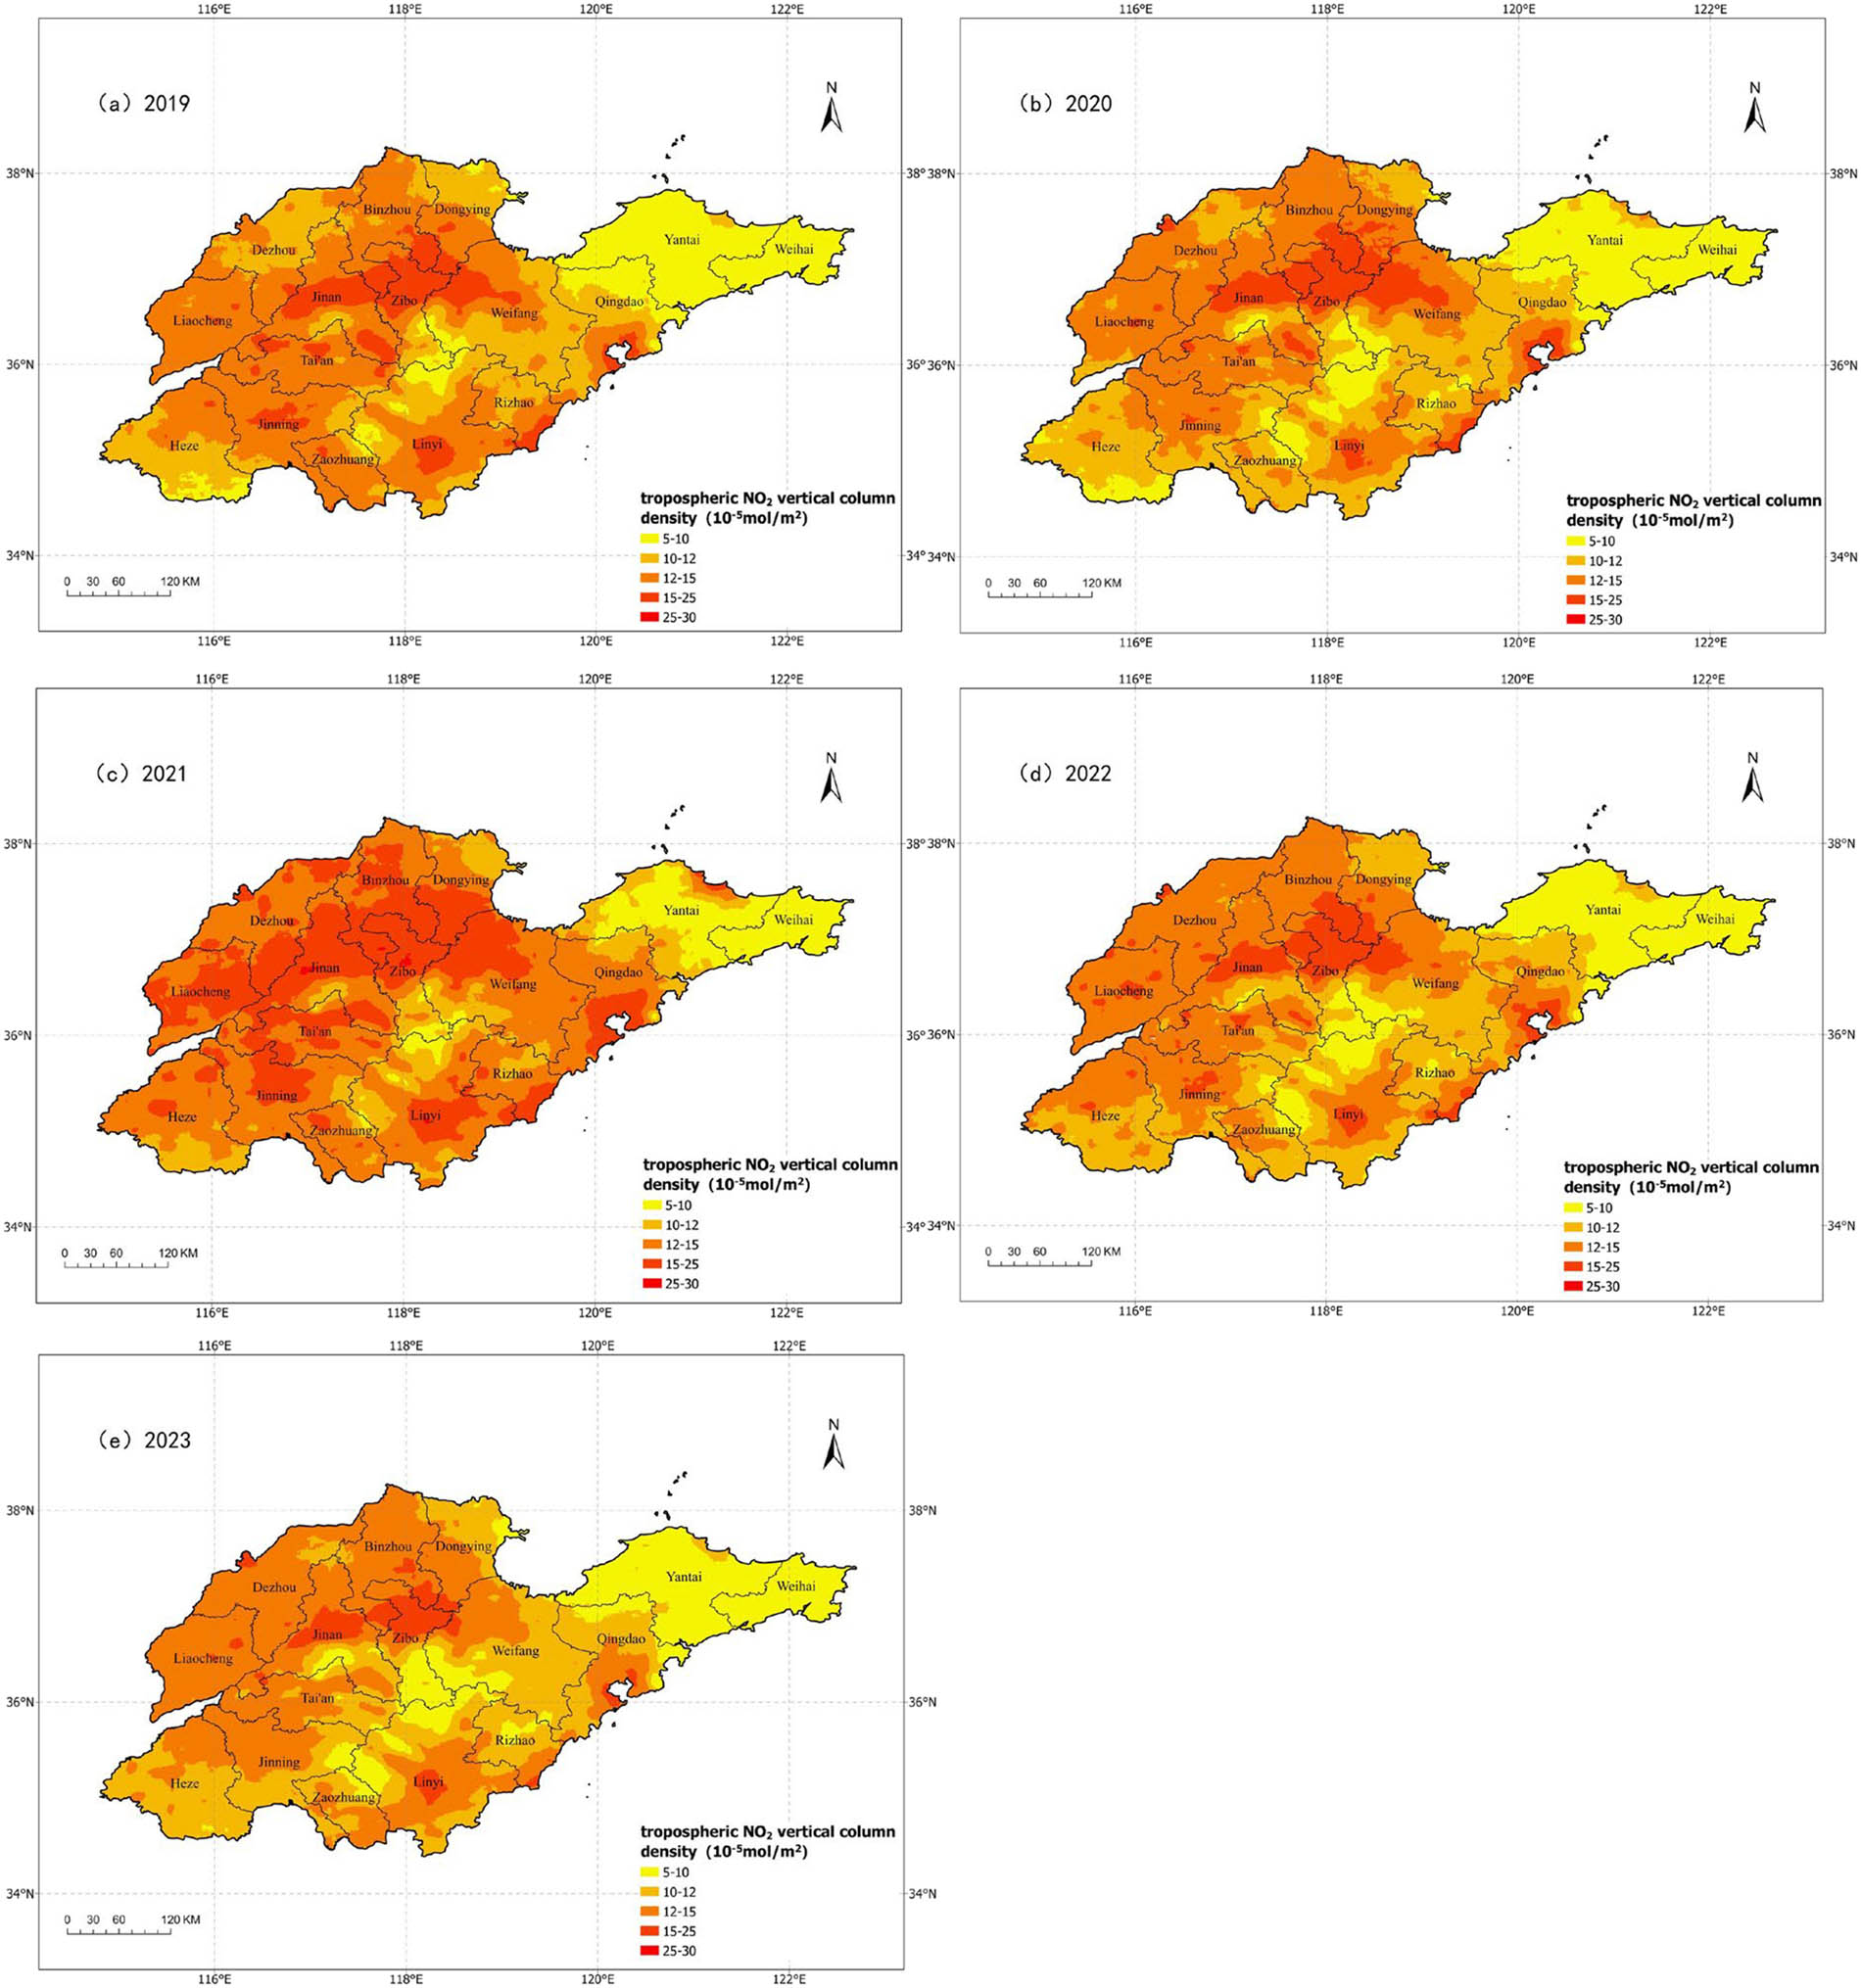
Spatial distribution of the NO2 column concentration in Shandong Province in (a) 2019, (b) 2020, (c) 2021, (d) 2022, and (e) 2023.
By counting the area proportion of different concentrations of tropospheric NO2 in Shandong Province, as shown in Figure 5, in 2021, the proportion of high-concentration areas with average tropospheric NO2 levels of 15–25 × 10−5 mol/m2 increased by 21%, corresponding to an expansion of 31867.60 km2 in polluted area. On the contrary, the proportion of areas with a concentration of 10–15 × 10−5 mol/m2 in the same year decreased by 17% year-on-year, and the proportion of areas with a concentration of 12–15 × 10−5 mol/m2 reached the lowest, which shows that in 2021, the overall average level of NO2 pollution in Shandong Province increased, and the impact of air pollution continued to deepen. In 2023, the area of high-concentration areas with an average tropospheric NO2 concentration of 15–25 × 10−5 mol/m2 will be reduced to 5% of the total area, while the areas with a concentration of 12–15 × 10−5 mol/m2 in the same year will remain at the average level of previous years, the proportion of areas with medium and low pollution levels with a concentration of 5–12 × 10−5 mol/m2 has increased slightly. It can be seen from this that the prevention and control of NO2 pollution in Shandong Province has achieved certain results in 2023. The degree of high NO2 pollution has decreased, and the overall pollution level has been controlled to a certain extent.
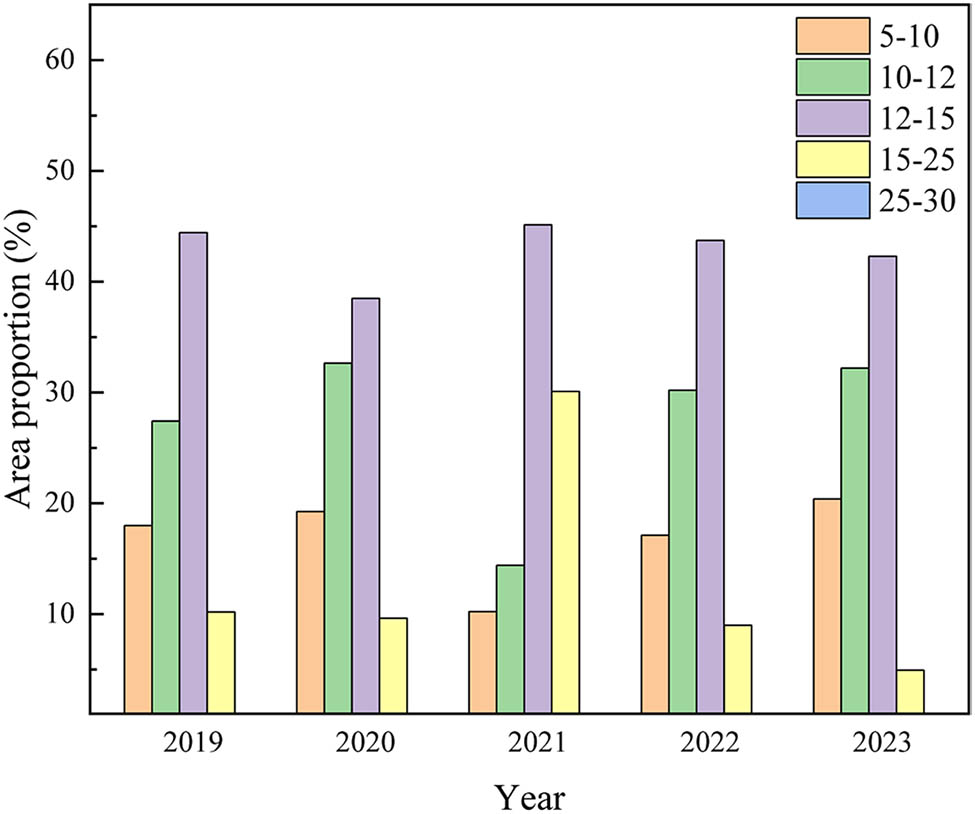
Fluctuation characteristics of the NO2 concentration classification structure from 2019 to 2023.
This article presents the spatial distribution of the annual average NO2 column concentration. The distribution of the average NO2 concentration from January 2019 to December 2023 is shown in Figure 6(a). In general, the distribution of the tropospheric NO2 column concentration in Shandong Province exhibits a “high in the west and low in the east” pattern, with the concentration in the western region typically higher, mostly ranging from 12 to 15 × 10−5 mol/m2. The areas with lower NO2 column concentrations are primarily located in the eastern region. From the city perspective, the areas with high NO2 column concentrations are mainly concentrated in Jinan, Zibo, Binzhou, Weifang, and Dongying, where the NO2 column concentration is most widely distributed between 15 and 25 × 10−5 mol/m2. Cities with lower NO2 column concentrations are located in the eastern region of Shandong Province, with concentrations primarily observed in Yantai and Weihai.
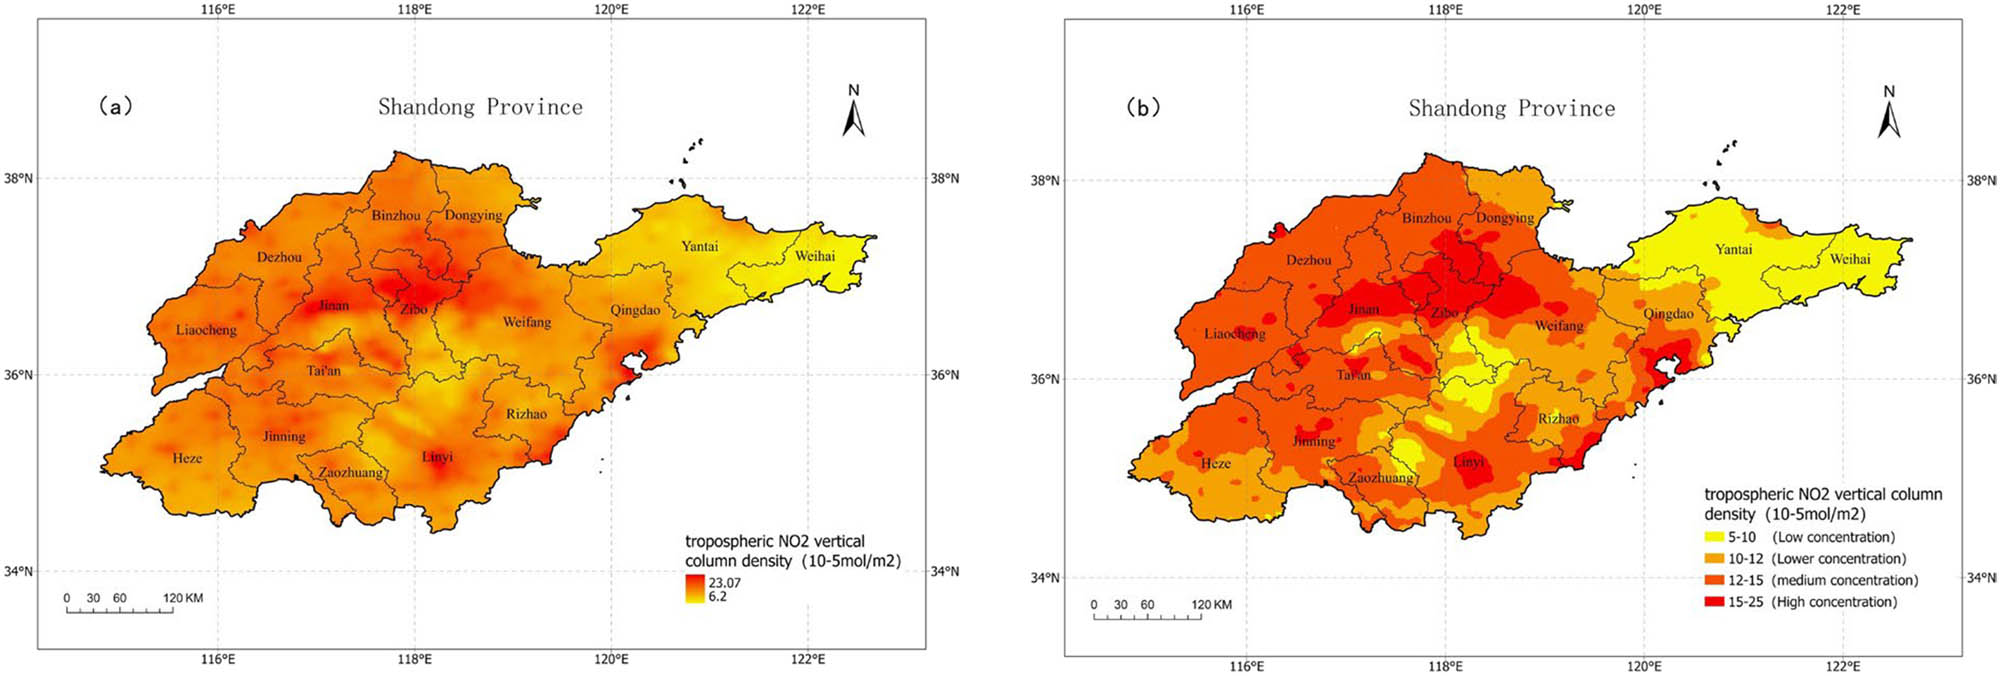
(a) Spatial distribution and (b) hierarchical structure of the NO2 column concentration in Shandong Province from 2019 to 2023.
The spatial differences in the NO2 concentration in Shandong Province from 2019 to 2023 can be divided into four levels, as shown in Figure 6(b). These levels are defined as follows: low NO2 column concentration (5 × 10⁻⁵ to 10 × 10−5 mol/m2), relatively low NO2 column concentration (10 × 10−5 to 12 × 10−5 mol/m2), medium NO2 column concentration (12 × 10−5 to 15 × 10−5 mol/m2), and high NO2 column concentration (15 × 10−5 to 25 × 10−5 mol/m2). The overall distribution structure of the NO2 column concentration levels in Shandong Province presents a progressive structure. High NO2 column concentrations are mainly distributed in the central and northern parts of Shandong Province, the center of Linyi City, and the coastal area of Qingdao City, with an area of approximately 16471.81 km2, accounting for approximately 10.58% of the total area of Shandong Province. The medium concentration area is primarily situated in the western region of Shandong Province, encompassing an area of approximately 72619.39 km2, accounting for approximately 46.63% of the total area of Shandong Province. The low-concentration area covers an area of approximately 42059.95 km2 and is primarily located in the central, northern, and southwestern parts of Shandong Province. The low-concentration area is primarily situated in the eastern region of Shandong Province, encompassing Weihai, Yantai, and some regions of Qingdao.
3.2.3 Spatiotemporal evolution of O3 column concentration and its synergistic distribution mechanism with NO2
The hourly surface O3 dataset retrieved by satellite [51] was used to visualize the O3 concentration in Shandong Province and analyze its variation law. The monthly, seasonal, and annual mean values of the inverted O3 concentration images were calculated, and the monthly, seasonal, and annual changes of O3 concentration in Shandong Province from 2012 to 2021 were obtained (Figure 7). In terms of interannual temporal changes, the average annual concentration of O3 in Shandong Province has reached 58.92 µg/m3 in recent ten years, with little overall change. Since 2012, the overall concentration of O3 in Shandong Province has gradually increased, and the average monthly concentration of O3 reached the highest value in July 2018, reaching 92.21 µg/m3. There is a slow downward trend afterwards, which may be related to the coordinated control measures of fine PM and O3 implemented by the Chinese government and the continued impact of COVID-19 on China.
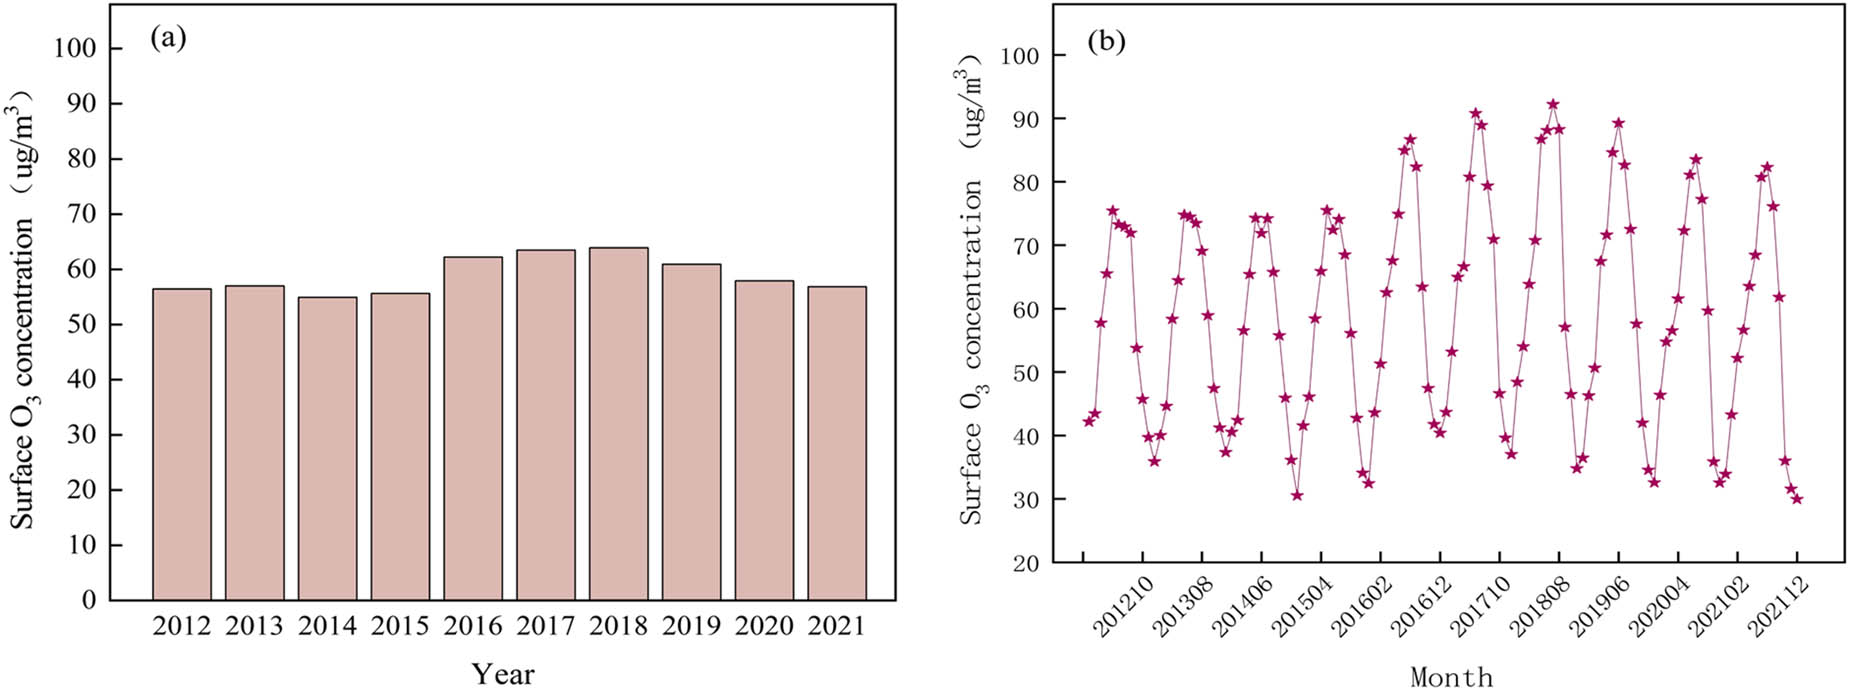
(a) Interannual and (b) monthly variation of O3 concentration in Shandong Province.
From the perspective of seasonal changes, the seasonal changes of surface O3 concentration in Shandong from 2012 to 2021 are the highest in summer, followed by autumn and spring, and the lowest in winter, which is contrary to the seasonal trend of high NO2 concentration in summer and winter and low in spring and autumn. From 2012 to 2019, the surface O3 concentration in Shandong Province maintained a slow growth trend in spring, summer, and autumn, with the most prominent change in the surface O3 concentration in summer and generally higher than the O3 concentration in other quarters. The O3 concentration in spring, summer, and autumn began to show a downward trend in 2020, while the O3 concentration in winter maintained a continuous downward trend in 2017 (Figure 8).
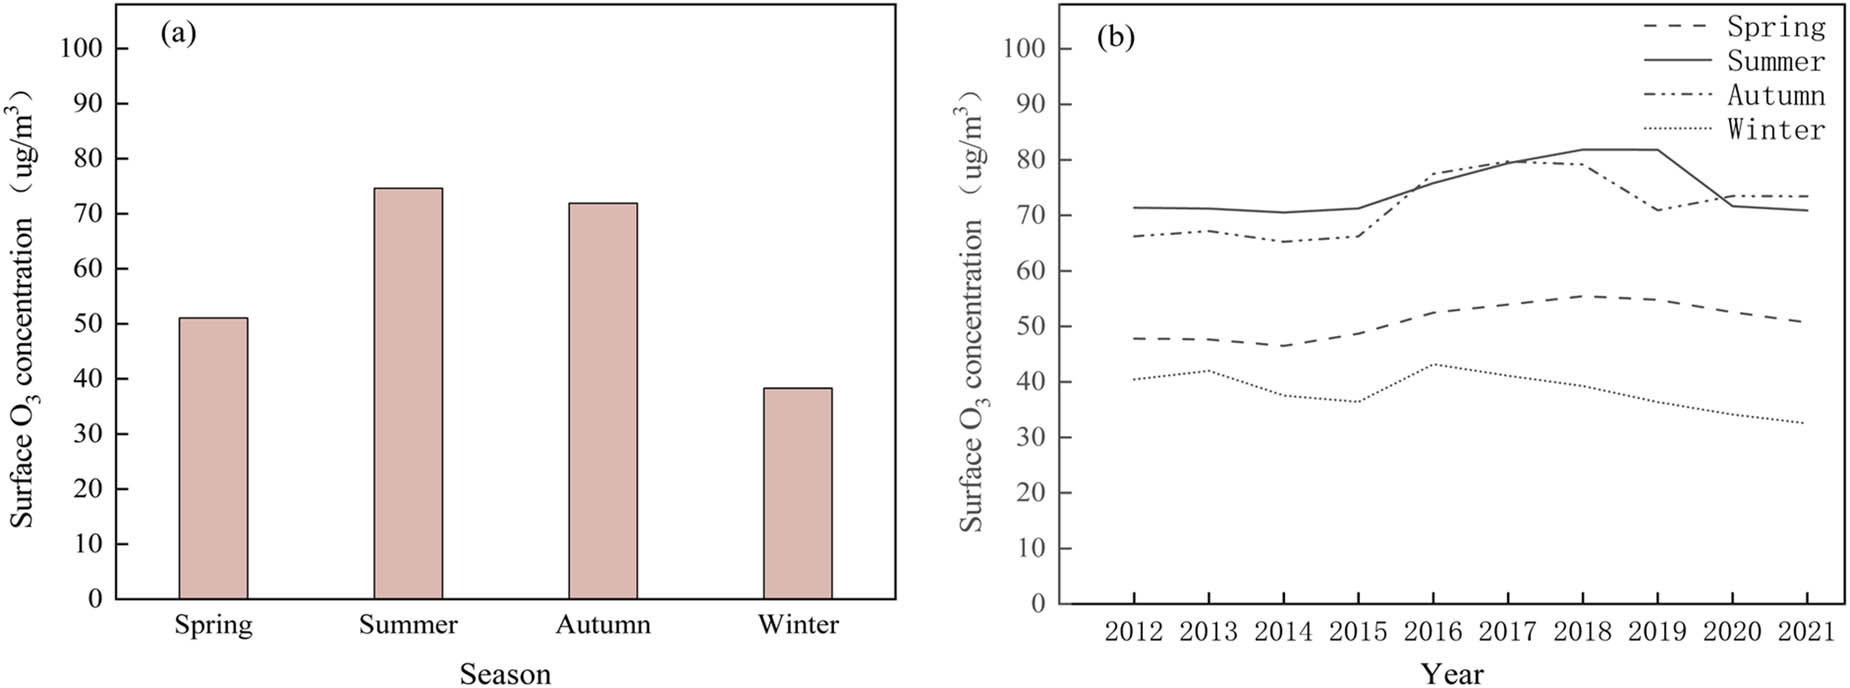
(a) Quarterly overall change and (b) annual change of surface O3 concentration in Shandong Province.
In order to conduct a matching analysis with the tropospheric NO2 concentration in Shandong Province, this article selects the O3 concentration data of Shandong Province from 2019 to 2021. Its spatial distribution is shown in Figure 9, showing obvious regional differences. The high-value areas of ozone concentration are mainly concentrated in Dezhou and Liaocheng in the west, Qingdao and Yantai in the east, and the ozone concentration in the central and southern parts of Shandong is relatively low.
Spatial distribution of the O3 concentration in Shandong Province from (a) 2019, (b) 2020, and (c) 2021.
In order to more clearly reflect the spatial synergistic distribution characteristics of tropospheric O3 and NO2 concentrations in Shandong Province, combined with the satellite data of the two pollutants, the bivariate coloring method was used to explore the interaction mechanism and regional pollution patterns of the two pollutants. From 2019 to 2021, the high O3 concentration area in northwestern Shandong was mainly rose red as a whole, as shown in Figure 10. This area was highly affected by O3, and photochemical reactions dominated O3 accumulation.
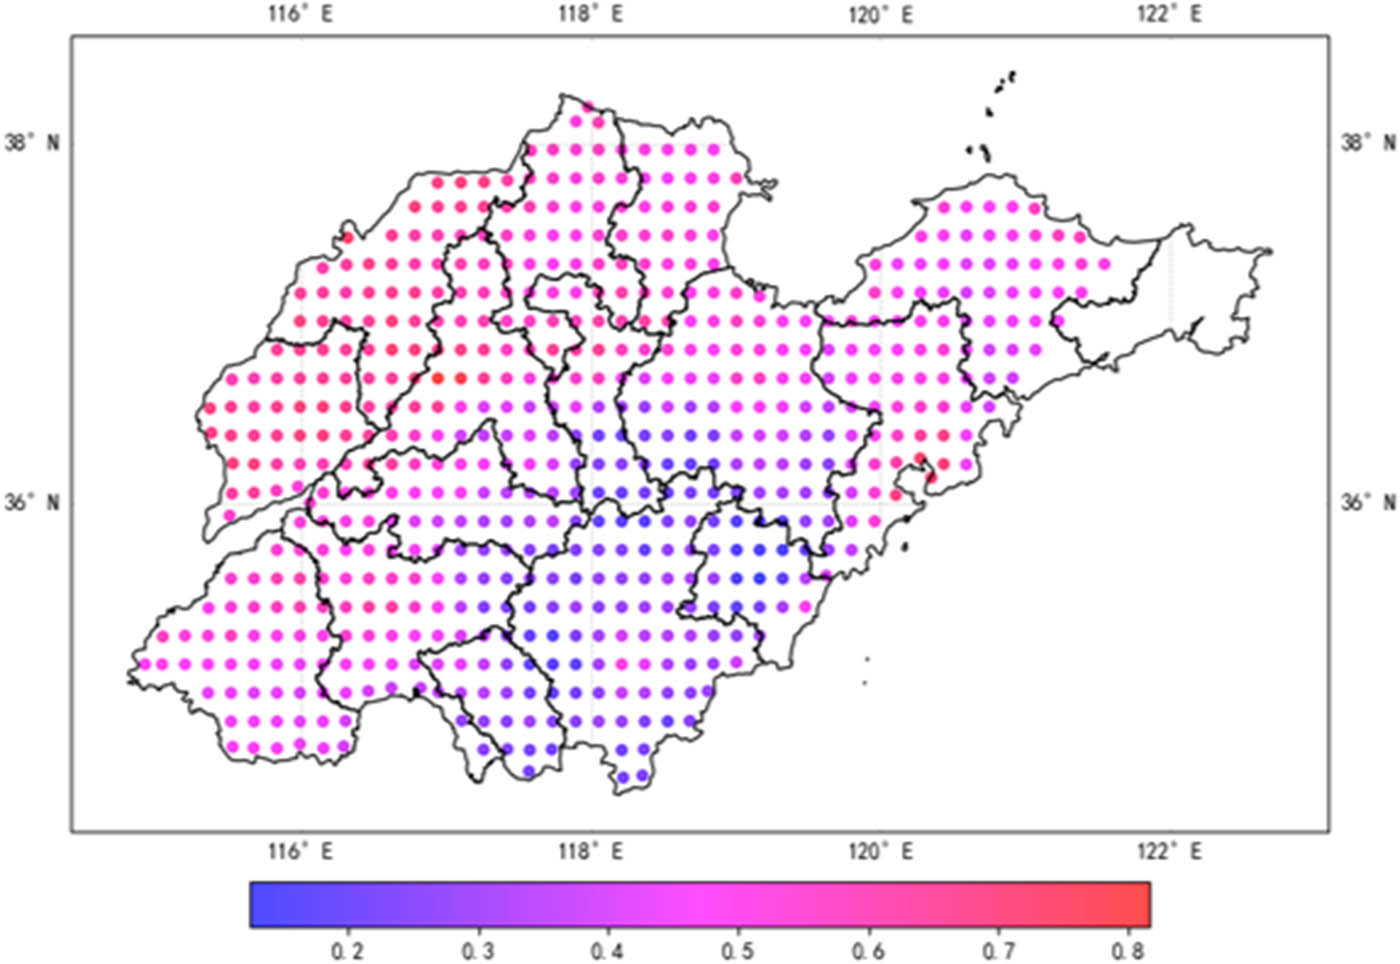
Spatial synergistic distribution and interaction mechanism of tropospheric O3–NO2 in Shandong Province.
3.3 Annual analysis of the factors influencing the NO2 column concentration based on the geographic detector
This article employs a geographic detector to investigate the influence of six factors on the annual spatial differentiation of NO2 in Shandong Province from 2019 to 2023. The results of the single factor detection are presented in Table 3. The effect of temperature on NO2 is greater than that of other factors (q = 0.5). The order of the key driving factors affecting the spatial differentiation of NO2 was as follows: temperature > precipitation > population > Activity > DEM > kNDVI.
Detection statistics of detection factors from 2019 to 2023
| Indicator | 2019 | 2020 | 2021 | 2022 | 2023 | |||||
|---|---|---|---|---|---|---|---|---|---|---|
| q | p | q | p | q | p | q | p | q | p | |
| kNDVI | 0.02 | 0.00 | 0.05 | 0.00 | 0.05 | 0.00 | 0.07 | 0.00 | 0.08 | 0.00 |
| DEM | 0.01 | 0.12 | 0.09 | 0.00 | 0.10 | 0.00 | 0.12 | 0.00 | 0.13 | 0.00 |
| Temperature | 0.48 | 0.00 | 0.49 | 0.00 | 0.47 | 0.00 | 0.49 | 0.00 | 0.57 | 0.00 |
| Precipitation | 0.20 | 0.00 | 0.09 | 0.00 | 0.14 | 0.00 | 0.31 | 0.00 | 0.17 | 0.00 |
| Activity | 0.15 | 0.00 | 0.13 | 0.00 | 0.18 | 0.000 | 0.16 | 0.00 | 0.12 | 0.00 |
| Population | 0.14 | 0.00 | 0.14 | 0.00 | 0.20 | 0.000 | 0.17 | 0.00 | ||
The interaction effect of two factors on the spatial differentiation of NO2 in Shandong Province was generally greater than that of a single factor. The results of the interaction are all double-factor enhancement or nonlinear enhancement. In addition, the interaction of the annual temperature factor with other factors is considerably more pronounced than the interaction between other influencing factors, as illustrated in Figure 11.
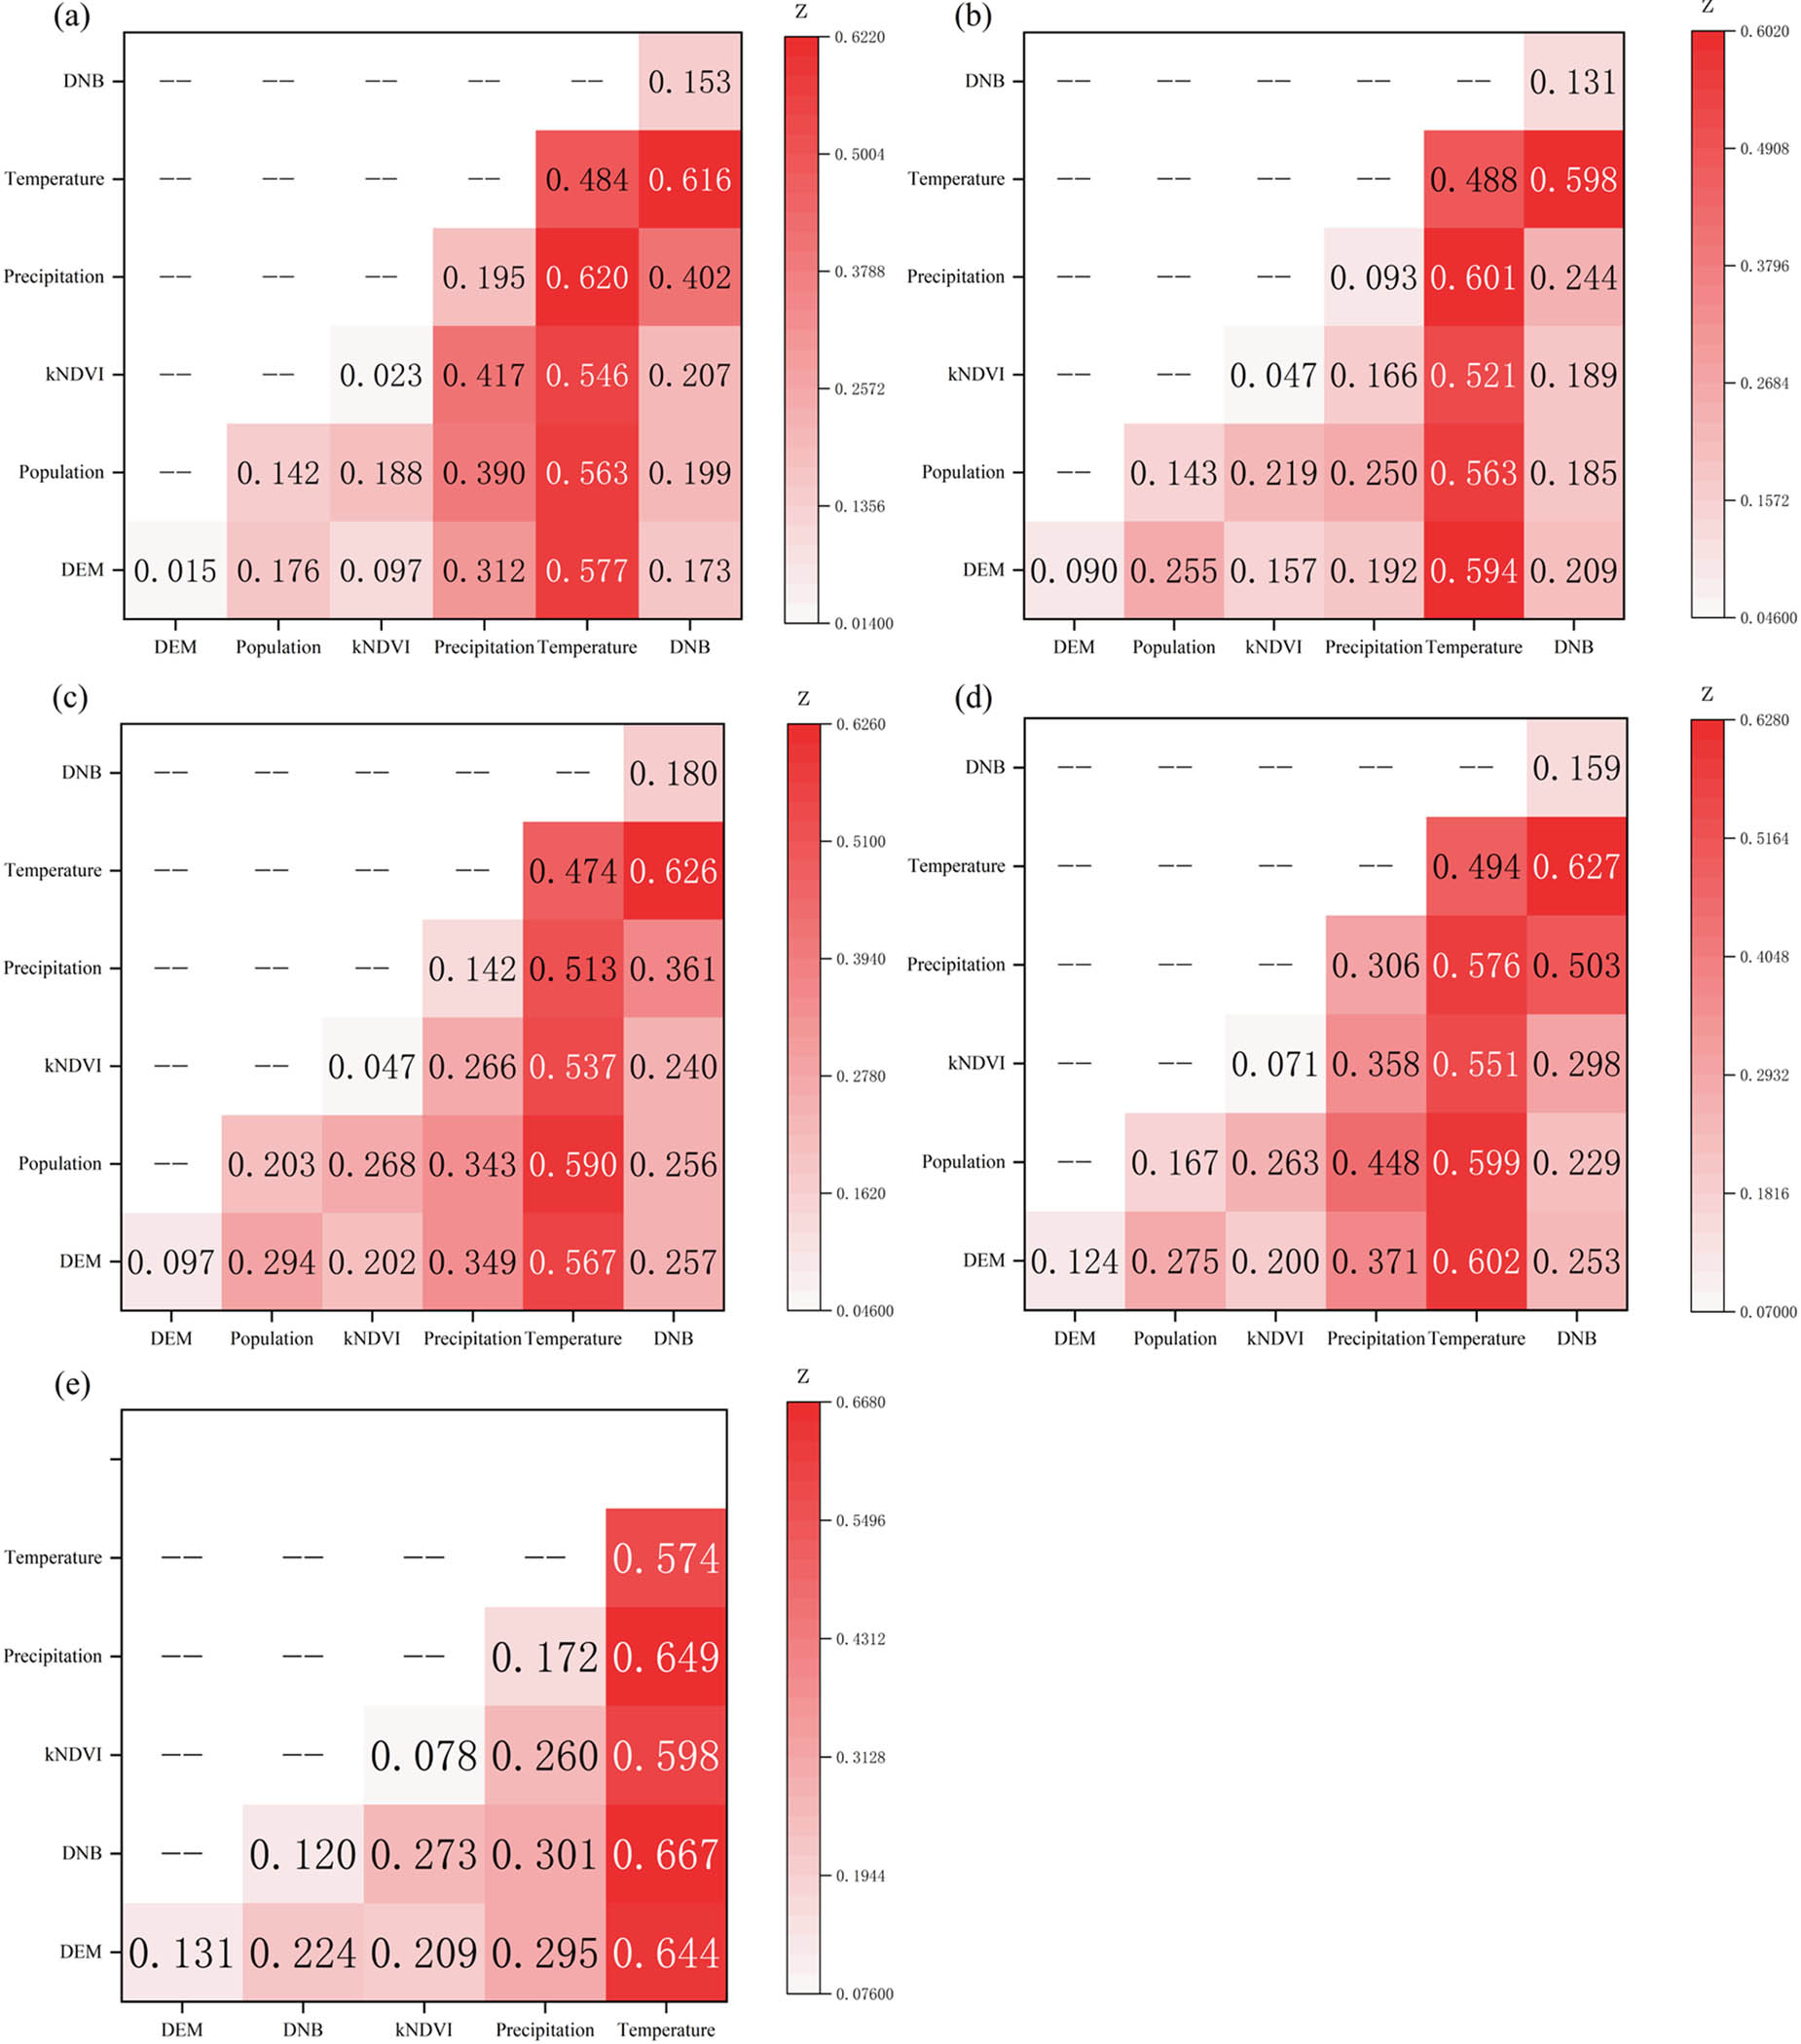
Interaction diagram of impact factors in (a) 2019, (b) 2020, (c) 2021, (d) 2022, and (e) 2023.
3.4 Analysis of NO2 column concentration influencing factors based on ordinary least squares – geographically weighted regression
To study the impact of various factors on the NO2 concentration at its highest during this period, this article selects the average NO2 concentration in November and December each year as the maximum concentration of NO2 for that year. The column concentration of NO2 in Shandong Province from 2019 to 2023 was then obtained after averaging. Similarly, the average precipitation and average temperature are obtained. This article constructs 1,674 10 km × 10 km grids within the scope of Shandong Province. The “urban and rural, industrial and mining, residential land” patches were then extracted from the multiperiod land use remote sensing monitoring dataset of China in 2020. Finally, the urbanization rate of land within the grid is calculated as the LUR factor. Subsequently, the NO2 column concentration of each grid is combined with the average of each factor to construct the OLS-GWR model for the seven factors using ArcGIS and GWmodels [65,66] for each grid unit.
OLS is employed for modeling, and the results are presented in Table 4. The regression model passed the Koenker (BP) test, with a p value significant at the 1% level. This indicates that the model has statistically significant and nonstationary characteristics. Concurrently, the six variables that demonstrated statistical significance in the significance test are the DEM, temperature, precipitation, population, Activity, and LUR. Conversely, the kNDVI variable did not pass the significance test, indicating that it is not statistically significant. The DEM, temperature, and precipitation are negatively correlated with the NO2 concentration. Areas with lower altitudes, temperatures, and precipitation tend to have higher NO2 concentrations. The population, Activity, and LUR, which are positively correlated with the NO2 concentration, have coefficients of 0.001, 0.161, and 0.982, respectively. A clear linear relationship exists between the intensity of nighttime light and energy consumption. Nighttime light can reflect the actual situation of temporal and spatial changes in energy consumption in the study area [67]. Existing studies have confirmed that the amount of coal burned per unit area and population density have a very wide impact on the NO2 column concentration [68].
Regression parameters and results of the OLS model
| Variable | Intercept | Standard error | p Value | VIF |
|---|---|---|---|---|
| Intercept | 34.729 | 0.620 | 0.000* | — |
| kNDVI | −0.357 | 1.685 | 0.832 | 1.697 |
| DEM | −0.010 | 0.001 | 0.000* | 1.289 |
| Temperature | −0.952 | 0.113 | 0.000* | 1.566 |
| Precipitation | −0.330 | 0.026 | 0.000* | 1.578 |
| Population | 0.001 | 0.000 | 0.000* | 1.918 |
| Activity | 0.161 | 0.026 | 0.000* | 2.404 |
| LUR | 0.982 | 0.351 | 0.005* | 1.777 |
| AICc: 8492.1 | ||||
| Coefficient of determination R 2: 0.390 | Adjusted coefficient of determination Adj.R 2: 0.388 | |||
| Koenker (BP) test: 0.00* | Jarque-Bera test: 0.00* | |||
| Joint F-statistic: 0.00* | Joint Wald test: 0.00* | |||
Note: * Significance levels: *p < 0.01.
The OLS regression model was validated to demonstrate significant spatial heterogeneity. This means that the regression parameters will change with changes in geographical location [69]. In view of the characteristics of statistical significance and non-stationarity, the GWR model, which uses the bi-square kernel function and is judged by the AICc value, was used to model the six variables that passed the significance test. The results are shown in Table 5. Compared to that of the OLS model, the explanatory power of each factor for the NO2 concentration in the GWR model is enhanced to 97%, rendering it more suitable for the analysis of factors influencing the distribution of the NO2 concentration in Shandong Province.
Regression results of the GWR model
| Variable | Bandwidth | Minimum | First quartile (Q1) | Median | Median third quartile (Q3) | Maximum |
|---|---|---|---|---|---|---|
| Intercept | 39 | −79.26 | 9.142 | 24.276 | 39.729 | 123.631 |
| DEM | 39 | −0.737 | −0.029 | −0.015 | −0.001 | 0.752 |
| Temperature | 39 | −17.694 | −3.188 | −1.092 | 1.104 | 12.704 |
| Precipitation | 39 | −2.817 | −0.209 | 0.200 | 0.698 | 3.479 |
| LUR | 39 | −0.012 | 0.000 | 0.000 | 0.001 | 0.007 |
| Activity | 39 | −0.777 | 0.042 | 0.144 | 0.311 | 4.214 |
| Population | 39 | −4.066 | −0.307 | 0.417 | 1.347 | 5.089 |
| AICc: 3678.781 | ||||||
| Coefficient of determination R 2: 0.986 | Adjusted coefficient of determination adj. R 2: 0.977 | |||||
Figure 12 clearly shows that the overall explanatory power of the GWR model for the NO2 concentration varies within Shandong Province. The area where the GWR model exhibits a lower explanatory power for the NO2 concentration in Shandong Province is approximately 5644.35 km2, while the area where the explanatory power reaches 93% is approximately 133649.10 km2, which is approximately 85.8% of the area of Shandong Province.
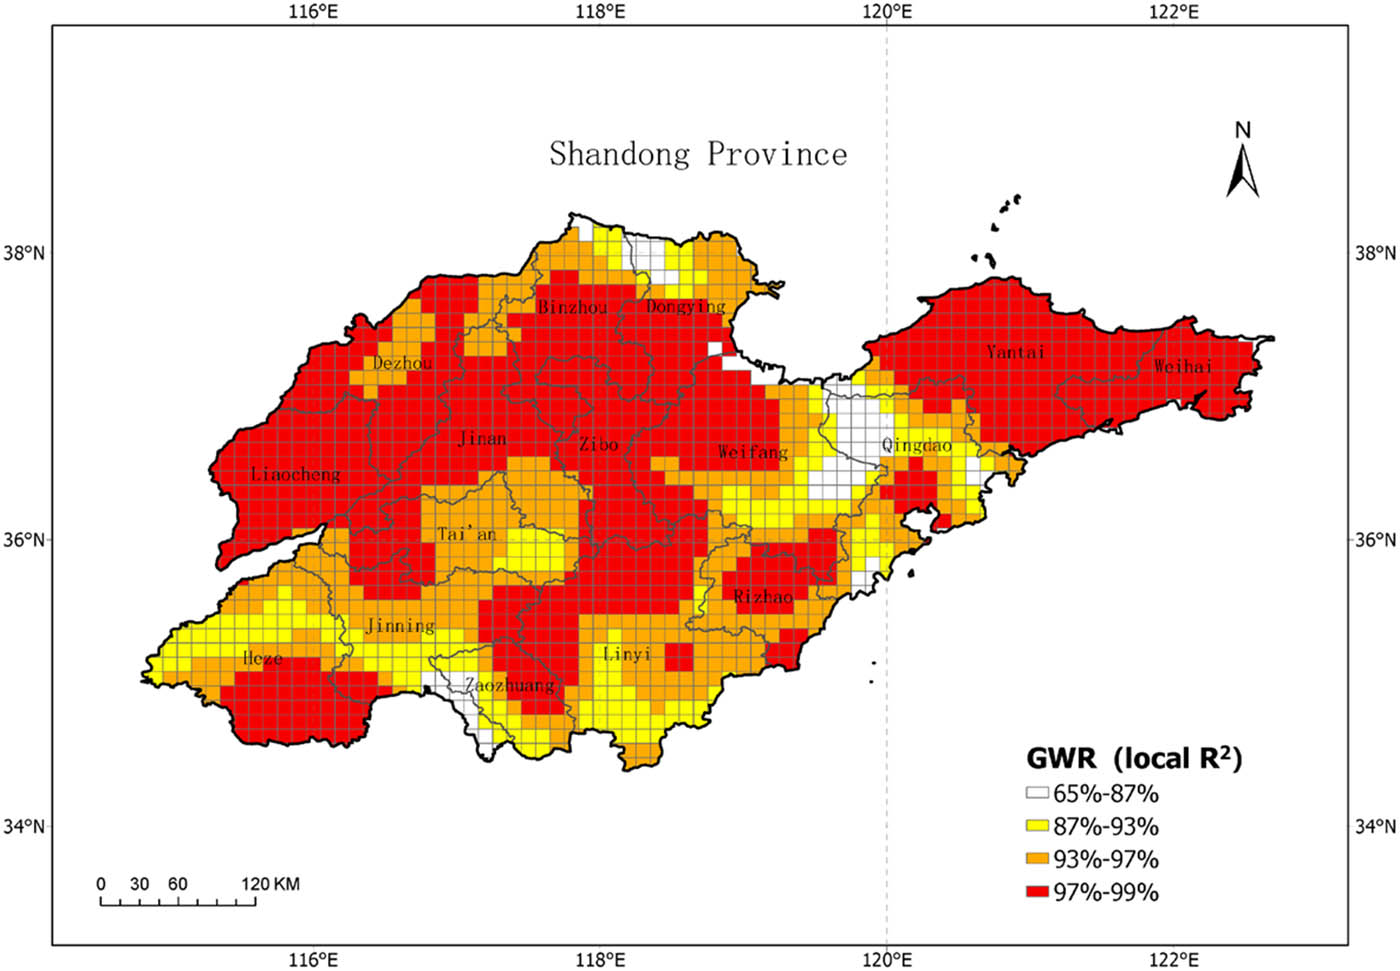
Spatial distribution of the local R 2 of the GWR model in Shandong Province.
4 Discussion
4.1 Effects of socioeconomic factors on NO2 emissions
According to the above research on the temporal and spatial distribution and influencing factors of tropospheric NO2 pollutants, it is found that the urban NO2 pollution pattern is closely related to economic growth. As shown in Figure 13, the permanent population of Shandong Province showed a slow growth trend from 2005 to 2023. By the end of 2022, the permanent population of Shandong Province reached 101.63 million, an increase of 9.15 million over 2005. At the same time, the GDP of Shandong Province has shown a continuous growth trend from 2005 to 2023, from a regional GDP of 1594.75 billion yuan in 2005 to 9206.87 billion yuan in 2023, which is 5.77 times that of 2005. The primary industry, dominated by agriculture and forestry, has a low proportion in the national economic structure, and the primary industry has developed steadily from 2005 to 2023, with an annual average of 429.491 billion yuan. The GDP of the secondary and tertiary industries continues to increase. From 2005 to 2014, the GDP of the secondary industry accounted for a higher proportion of the total GDP than that of the tertiary industry. However, since 2015, the proportion of GDP of the tertiary industry has gradually surpassed that of the secondary industry and continues to rise. The secondary industry, which is dominated by industrial production, has a large demand for energy and still produces a large amount of NO x emissions during the production process. This is why although the GDP of the secondary industry is surpassed by the tertiary industry, its proportion is still at a high level.
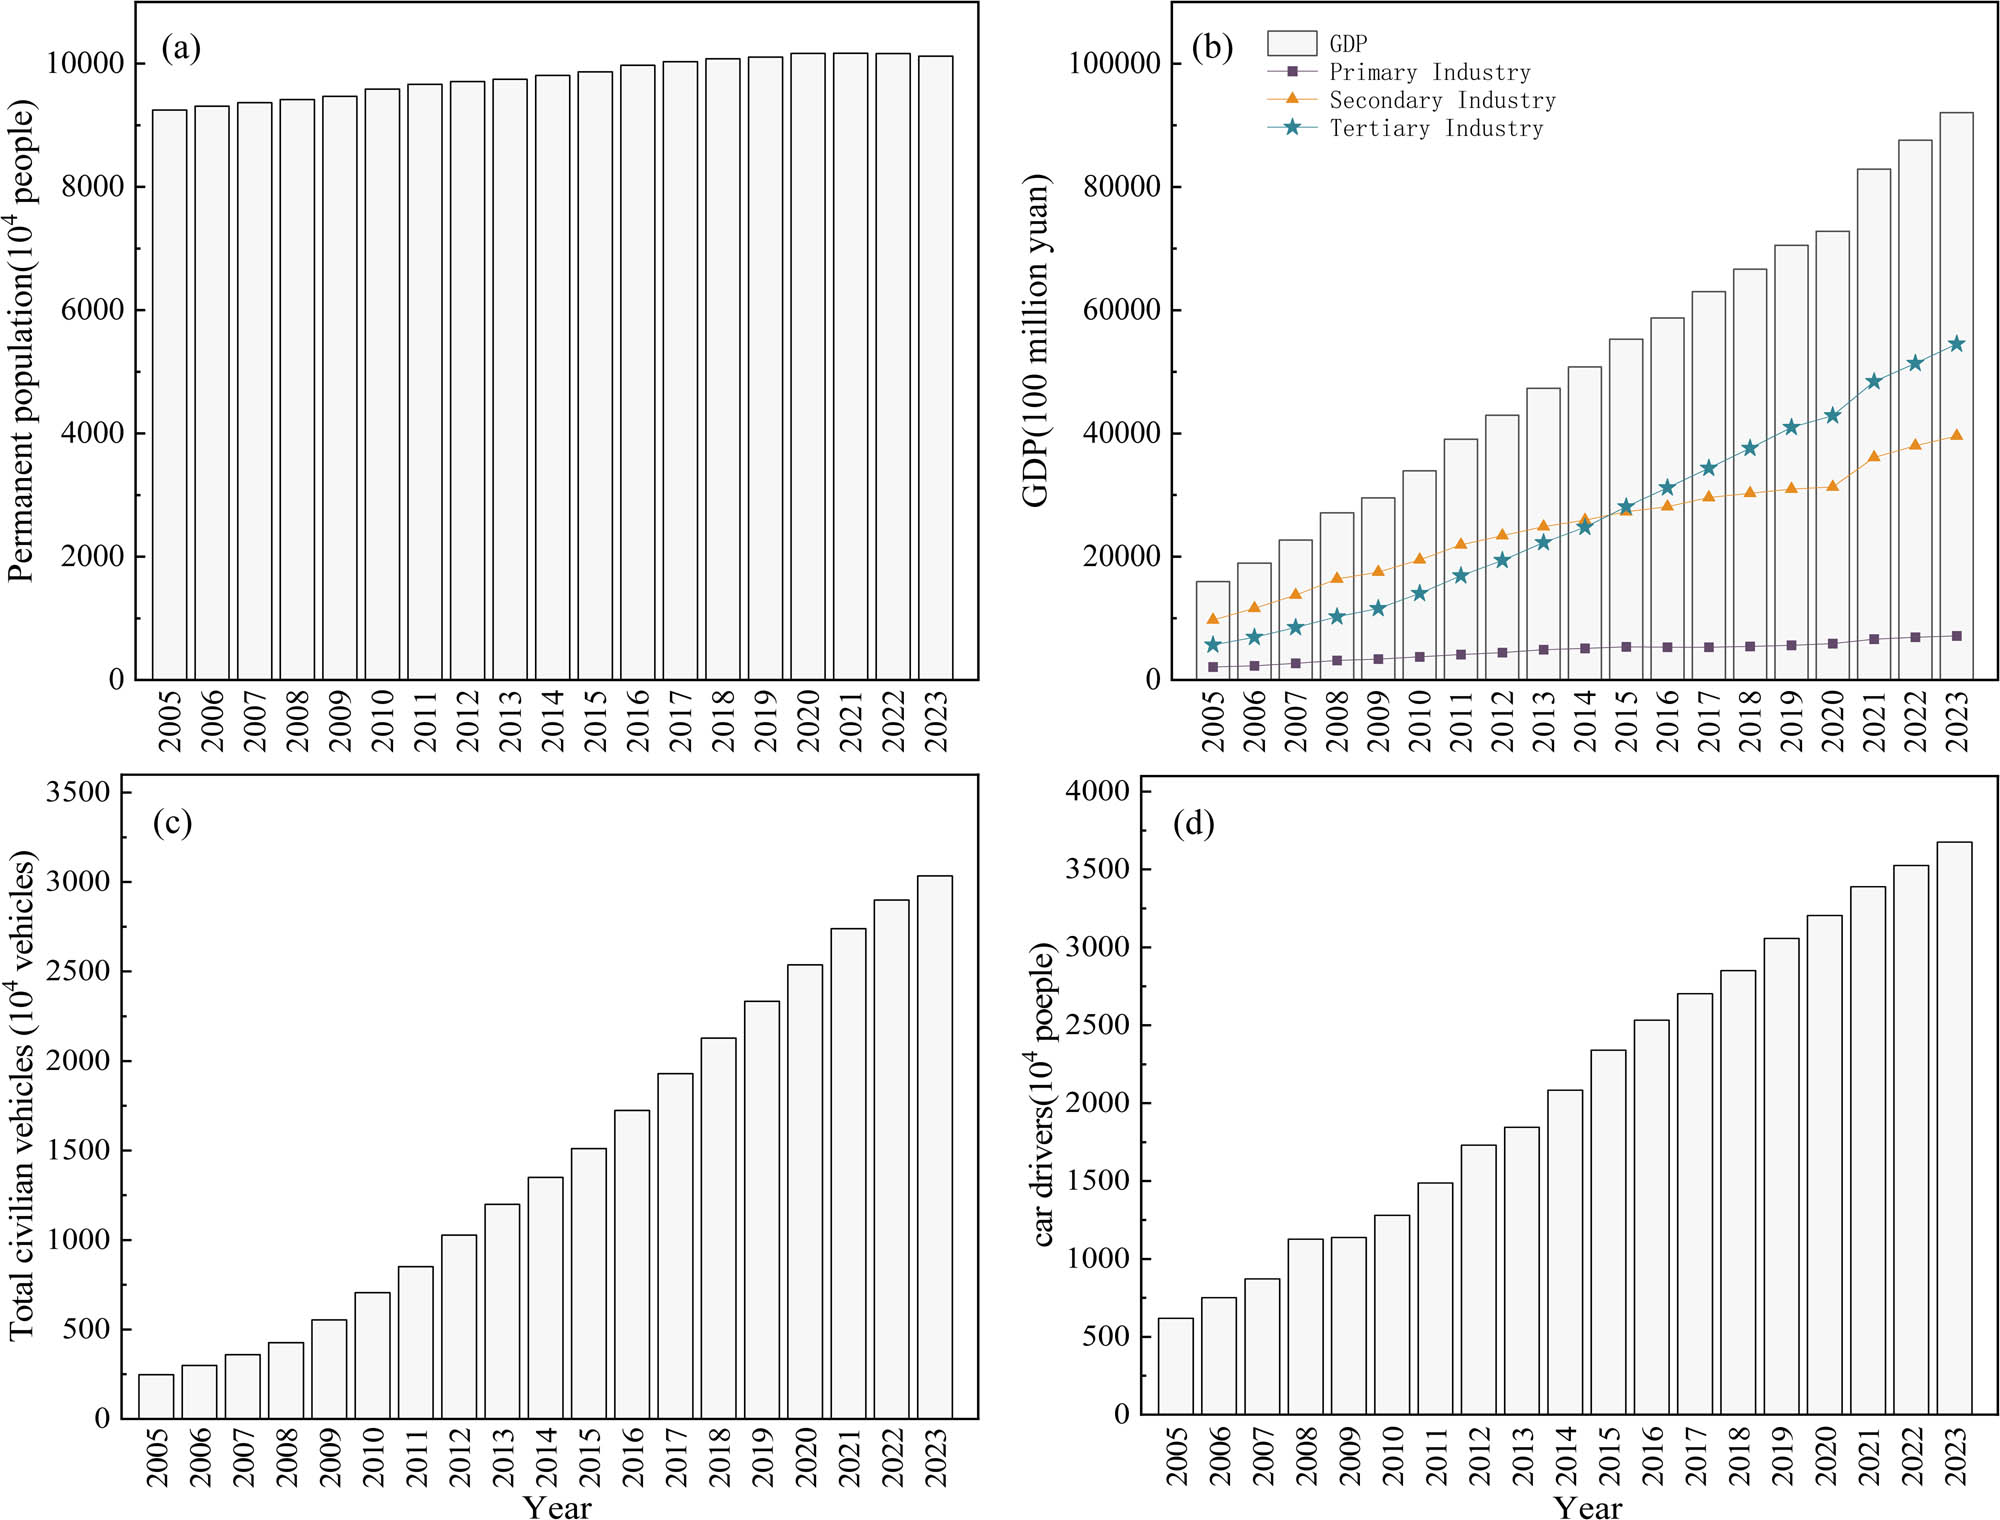
(a) Permanent population of Shandong Province from 2005 to 2023. (b) GDP of Shandong Province from 2005 to 2023. (c) Total number of civilian vehicles of Shandong Province from 2005 to 2023. (d) Number of car drivers in Shandong Province from 2005 to 2023.
With the steady increase of population, the tertiary industry, including transportation, technical services, and other industries, is developing rapidly, and the motor vehicle exhaust emissions generated during transportation have gradually become one of the important reasons affecting NO2 pollution in Shandong Province. During the period from 2005 to 2023, the total number of civilian vehicles and the number of car drivers in Shandong Province showed a continuous upward trend. In 2023, the total number of civilian vehicles in Shandong Province also reached 30.3354 million. According to the “China Statistical Yearbook 2024,” National NO x emissions in 2023 will be 12.0732 million tons. As a major industrial province, Shandong’s NO x emissions will be 1.2568 million tons, accounting for 10.41% of the country’s NO x emissions, ranking first in the country. The “China Mobile Source Environmental Management Annual Report (2023)” clarifies that the emissions of nitrogen oxides from mobile sources represented by motor vehicles and construction machinery will reach 10 million tons in 2022, which has become the primary source of air pollutants in some domestic cities. Taking Jinan City, Shandong Province as an example, nitrogen oxide emissions account for 49% of the city’s total emissions and are the largest contributor [70].
Under the background of continuous GDP growth, traffic has become the main source of NO x emissions, and it is in the stage of intensification of NO2 pollution. It is very important to change the development mode of the high energy-consuming economic growth mode. Therefore, future research needs to clarify the relationship between urbanization level and NO2 concentration distribution, not only to understand the NO2 concentration distribution in Shandong Province, but also to understand the impact of surrounding cities on NO2, and actively promote the air pollution control of “3 + 26” cities. As the total number of civilian vehicles and NO x emissions from motor vehicles continue to increase, we should encourage the development of public transportation and more policies to reduce exhaust emissions to alleviate NO x and O3 concentrations.
4.2 Interactions of temperature, urbanization, and broader atmospheric processes
Although key influencing factors such as temperature and urbanization have been identified in this study, the mechanism of these factors and their connection with wider atmospheric processes need further exploration. The positive correlation effect of temperature on NO2 concentration may involve complex photochemical reaction mechanisms [71], and high temperature conditions may not only affect the generation and conversion rate of NO2, but also affect the diffusion conditions of pollutants by changing the atmospheric boundary layer height. At the same time, although this study found that urbanization indicators (such as population density, night lighting) are negatively correlated with NO2 concentration, deep-seated factors such as energy structure transformation and industrial layout adjustment may be implied behind this relationship. How these factors pass through the atmospheric chemical process. The ultimate impact on NO2 concentration needs further exploration. In addition, regional atmospheric circulation models [72], cross-regional pollutant transport [73], and the synergistic mechanism between NO2 and other atmospheric pollutants (such as PM2.5, O3, etc.) still need to be systematically studied [74]. Future research should combine ground observation data, atmospheric chemical transport models, and multi-source remote sensing data to build a more comprehensive model of NO2 pollution formation and diffusion mechanism to provide a more accurate scientific basis for regional air pollution prevention and control.
4.3 Spatial heterogeneity and remote sensing data validation challenges
4.3.1 Environmental and geospatial specificities of Shandong
Shandong Province is a typical area of “industry-agriculture-coastal” compound pollution in China, and its spatial and temporal distribution of NO2 will be affected by many factors. The spatial distribution of NO2 concentration presents a gradient of “high in the east and low in the west” (Figure 3a), which is highly correlated with the energy structure of Jiaodong Peninsula industrial belt (Qingdao City, Yantai City) and provincial capital economic circle (Jinan City, Zibo City) [75]. The NO2 concentration in agricultural municipal areas such as Dezhou City and Liaocheng City may be related to the application of ammonia fertilizer, and the agricultural NO x emission is more significant in the crop growing season (May–August) [76]. In addition, the Taishan Mountains are located in the central part of Shandong Province, and the barrier effect on pollutant diffusion increases the NO2 residence time in the western part of Shandong Province [77]. In coastal areas, NO2 concentration is closely related to monsoon, which affects the amplitude of the NO2 diurnal cycle, thus reducing coastal NO2 concentration [78,79].
Comparing the NO2 concentration in the Pearl River Delta region with different natural conditions and industrial structure with that in Shandong Province, the results show that the seasonal fluctuation range of NO2 in the Pearl River Delta region is small, and the comparison of the monthly average concentrations of NO2 in the two places is shown in Figure 14. Among them, the monthly average tropospheric NO2 concentrations in Shandong Province and Pearl River Delta region were 12.31 × 10⁻⁵ mol/m2 and 7.15 × 10⁻⁵ mol/m2, respectively; the lowest concentrations were 4.54 × 10⁻⁵ mol/m2 and 3.91 × 10⁻⁵ mol/m2, respectively; the highest concentrations were 37.37 mol/m2 and 16.04 × 10⁻⁵ mol/m2, respectively. The highest concentration in Shandong Province is 2–3 times that in the Pearl River Delta region, which may be affected by the cumulative effect of pollution or regional transmission effect. This also reflects the impact of differences in dominant control factors in different regions on regional air pollution.
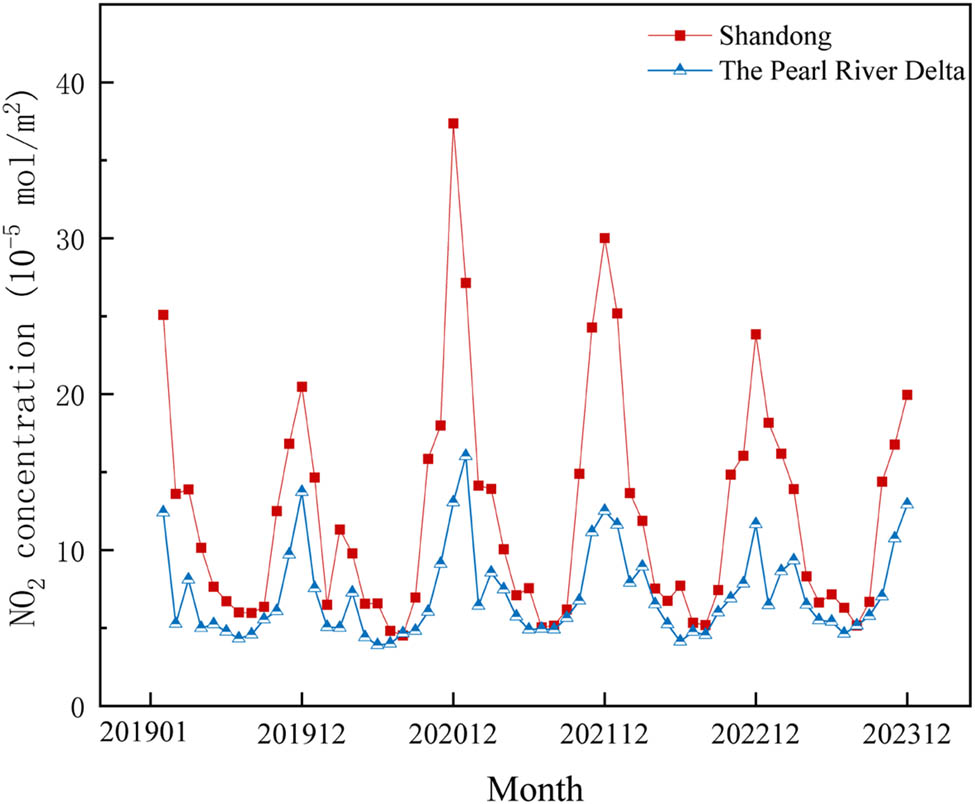
Comparison of monthly average tropospheric NO2 concentration between Shandong Province and Pearl River Delta region.
The spatiotemporal evolution model of NO2 in Shandong Province provides a unique perspective for air pollution control in global industrial transformation zones, but its promotion needs to combine the heterogeneity of regional socioeconomic and natural conditions.
4.3.2 Limitations and validation challenges of Sentinel-5P
Compared with OMI sensors, the 3.5 × 5.5 km2 high-resolution NO2 products provided by TROPOMI sensors can have a more detailed understanding of the spatial distribution characteristics of NO2, thereby further locating pollution emission sources. High-resolution TROPOMI makes up for the shortcomings of low and medium spatial resolution and provides richer spatial distribution information. However, TROPOMI sensors started in 2018. Due to the limitation of observation duration, high-resolution TROPOMI sensors are still difficult to support long-sequence continuous monitoring of tropospheric NO2 polluted gases. At present, there have been studies to fuse multi-source datasets (such as satellite data, climate reanalysis, and chemical transport model datasets, etc.) through machine learning (ML) models (such as multi-stage ML frameworks, LightGBM models, etc.) to generate high temporal resolution NO2 datasets [80,81]. The satellite-based tropospheric column formaldehyde to nitrogen dioxide concentration ratio (FNR) in characterizing the sensitivity of near-surface ozone generation, Jiang et al. developed an FNR stereo distribution reconstruction method system that integrates ground-based and satellite hyperspectral remote sensing to realize the prediction of HCHO and NO2 vertical profiles independent of MAX-DOAS observation [82].
Based on the above, although this article reveals the spatial and temporal distribution pattern of regional NO2 concentration based on TROPOMI NO2 column concentration and products, there are still limitations in the ability to monitor NO2 in long-term series. Future research can integrate high-performance models and high-resolution data to build a refined point prediction system to promote the development of air pollution modeling to long-term scale data with sub-kilometer spatial accuracy.
5 Conclusions
This study employs the GEE cloud platform to obtain the column concentration of Sentinel-5P NO2 from January 2019 to December 2023. Then, we analyzed the spatiotemporal distributions, change characteristics, and influencing factors of the NO2 column concentration in Shandong Province. A comparison with ground-based NO2 concentrations demonstrated the reliability of the NO2 column concentrations retrieved by the TROPOMI sensor. Further analysis of the NO2 column concentrations revealed seasonal and periodic fluctuations in NO2 concentrations in Shandong Province. In terms of the spatial distribution, high NO2 concentrations were concentrated in the central-northern region, the city center of Linyi, and the coastal areas of Qingdao, covering approximately 10.58% of the total area. The medium-concentration areas were primarily located in the western region of Shandong Province, accounting for 46.63% of the total area.
Geographic detectors were employed to investigate the influence of natural and social factors on the distribution of NO2 concentrations. Among the social factors, the population density had the most significant impact on the distribution of NO2 concentrations, while temperature was the most influential natural factor. The explanatory power of each factor increased significantly when interactions were considered in comparison to single-factor effects. Least squares OLS and geographically weighted regression GWR models were employed to construct regression models of the influencing factors. The results indicated that population density, nighttime light intensity, and the urbanization rate promote NO2 pollution, while terrain, temperature, and precipitation have mitigating effects. Compared with the OLS model, the GWR model demonstrated superior explanatory power for the NO2 concentration distribution characteristics. This study provides a reference for governments and policy-makers in formulating relevant policies and measures.
Acknowledgments
This research was funded by the National Natural Science Foundation of China (42064001, 42374017).
-
Funding information: This research was funded by the National Natural Science Foundation of China (Grant Nos. 42064001, 42374017).
-
Author contributions: Conceptualization, Shijian Zhou and Siting Zeng; methodology, Yunqi Zhou and Siting Zeng; investigation, Siting Zeng and Zhang Yuan; data curation, Siting Zeng, Zhang Yuan; writing – original draft preparation, Siting Zeng; writing – review & editing, Shijian Zhou, Fengwei Wang, Yunqi Zhou and Siting Zeng; supervision, Shijian Zhou, Fengwei Wang, Yunqi Zhou and Siting Zeng; funding acquisition, Shijian Zhou. All authors have read and agreed to the published version of the manuscript.
-
Conflict of interest: The authors declare no conflicts of interest.
-
Data availability statement: In view of confidentiality and the need for permission from the authors, data and materials will be available on request.
Appendix
Variable information
| Serial number | Variable | Description (units) |
|---|---|---|
| Equation (1) |
|
The ground-level NO2 concentration (mg/m3) |
|
|
The tropospheric column NO2 concentration (mol/m2) | |
|
|
Average value | |
|
|
The correlation coefficient | |
| n | The number of samples | |
| Equation (2) |
|
Hyperbolic tangent function |
|
|
Reflectivity in the near-infrared band | |
|
|
Red band reflectivity | |
|
|
The scale parameter | |
| Equation (3) |
|
The scale of urban land use |
|
|
The scale of other construction land use | |
|
|
The scale of rural residential land use | |
| Equation (4) |
|
The number of categories or partitions of the factor |
|
|
The total number of units in the whole region | |
|
|
The number of samples in region
|
|
|
|
The variance of region
|
|
|
|
The whole region | |
|
|
The sum of the within-group variances | |
|
|
The total variance of the whole region | |
| Equation (5) |
|
The NO2 column concentration for the corresponding grid
|
|
|
Constant term | |
|
|
The regression coefficient of the influence factor
|
|
|
|
The value of the influence factor
|
|
|
|
The random error term | |
| Equation (6) |
|
The NO2 column concentration value for the corresponding grid
|
|
|
The spatial coordinate of grid
|
|
|
|
The constant term at the
|
|
|
|
The value of the influence factor
|
|
|
|
The value of the influence factor
|
|
|
|
The random error term |
References
[1] Chan CK, Yao X. Air pollution in mega cities in China. Atmos Environ. 2008;42:1–42.10.1016/j.atmosenv.2007.09.003Search in Google Scholar
[2] Organization WH. WHO global air quality guidelines: Particulate matter (PM2.5 and PM10), ozone, nitrogen dioxide, sulfur dioxide and carbon monoxide. Geneva: World Health Organization; 2021.Search in Google Scholar
[3] He Y, Uno I, Wang Z, Ohara T, Sugimoto N, Shimizu A, et al. Variations of the increasing trend of tropospheric NO2 over central east China during the past decade. Atmos Environ. 2007;41:4865–76.10.1016/j.atmosenv.2007.02.009Search in Google Scholar
[4] Shon Z-H, Kim K-H, Song S-K. Long-term trend in NO2 and NOx levels and their emission ratio in relation to road traffic activities in East Asia. Atmos Environ. 2011;45:3120–31.10.1016/j.atmosenv.2011.03.009Search in Google Scholar
[5] Gao J, Zhu B, Wang Y, Kang H. Distribution and long-term variation of tropospheric NO2 over China during 2005 to 2013. China Environ Sci. 2015;35:2307–18.Search in Google Scholar
[6] Li L, Shi R, Chen Y, Xu Y, Bai K, Zhang J. Spatio-temporal characteristics of NO2 in China and the anthropogenic influences analysis based on OMI data. J Geo-Inf Sci. 2013;15:688–94.10.3724/SP.J.1047.2013.00688Search in Google Scholar
[7] Camilleri SF, Kerr GH, Anenberg SC, Horton DE. All-cause NO2-attributable mortality burden and associated racial and ethnic disparities in the United States. Environ Sci Technol Lett. 2023;10:1159–64.10.1021/acs.estlett.3c00500Search in Google Scholar PubMed PubMed Central
[8] Anenberg SC, Mohegh A, Goldberg DL, Kerr GH, Brauer M, Burkart K, et al. Long-term trends in urban NO2 concentrations and associated paediatric asthma incidence: Estimates from global datasets. Lancet Planet Health. 2022;6:e49–58.10.1016/S2542-5196(21)00255-2Search in Google Scholar PubMed
[9] Huangfu P, Atkinson R. Long-term exposure to NO2 and O3 and all-cause and respiratory mortality: A systematic review and meta-analysis. Environ Int. 2020;144:105998.10.1016/j.envint.2020.105998Search in Google Scholar PubMed PubMed Central
[10] Archibald A, Neu J, Elshorbany Y, Cooper O, Young P, Akiyoshi H, et al. Tropospheric ozone assessment report. A critical review of changes in the tropospheric ozone burden and budget from 1850 to 2100. Elementa: Sci Anthropocene. 2020;8(1):34.10.1525/elementa.2020.034Search in Google Scholar
[11] Chang W, Liao H, Wang H. Climate responses to direct radiative forcing of anthropogenic aerosols, tropospheric ozone, and long-lived greenhouse gases in eastern China over 1951–2000. Adv Atmos Sci. 2009;26:748–62.10.1007/s00376-009-9032-4Search in Google Scholar
[12] Griffiths PT, Keeble J, Shin YM, Abraham NL, Archibald AT, Pyle JA. On the changing role of the stratosphere on the tropospheric ozone budget: 1979–2010. Geophys Res Lett. 2020;47:e2019GL086901.10.1029/2019GL086901Search in Google Scholar
[13] Lin M, Horowitz LW, Xie Y, Paulot F, Malyshev S, Shevliakova E, et al. Vegetation feedbacks during drought exacerbate ozone air pollution extremes in Europe. Nat Clim Change. 2020;10:444–51.10.1038/s41558-020-0743-ySearch in Google Scholar
[14] Karset IHH, Berntsen TK, Storelvmo T, Alterskjær K, Grini A, Olivié D, et al. Strong impacts on aerosol indirect effects from historical oxidant changes. Atmos Chem Phys. 2018;18:7669–90.10.5194/acp-18-7669-2018Search in Google Scholar
[15] Rosenfeld D, Lohmann U, Raga GB, O'Dowd CD, Kulmala M, Fuzzi S, et al. Flood or drought: How do aerosols affect precipitation? Science. 2008;321:1309–13.10.1126/science.1160606Search in Google Scholar PubMed
[16] Xu Y, Lamarque J-F. Isolating the meteorological impact of 21st century GHG warming on the removal and atmospheric loading of anthropogenic fine particulate matter pollution at global scale. Earth’s Future. 2018;6:428–40.10.1002/2017EF000684Search in Google Scholar
[17] Fan J, Rosenfeld D, Yang Y, Zhao C, Leung LR, Li Z. Substantial contribution of anthropogenic air pollution to catastrophic floods in Southwest China. Geophys Res Lett. 2015;42:6066–75.10.1002/2015GL064479Search in Google Scholar
[18] Huang X, Ding K, Liu J, Wang Z, Tang R, Xue L, et al. Smoke-weather interaction affects extreme wildfires in diverse coastal regions. Science. 2023;379:457–61.10.1126/science.add9843Search in Google Scholar PubMed
[19] Wiedinmyer C, Kimura Y, McDonald-Buller EC, Emmons LK, Buchholz RR, Tang W, et al. The fire inventory from NCAR version 2.5: An updated global fire emissions model for climate and chemistry applications. Geosci Model Dev. 2023;16:3873–91.10.5194/gmd-16-3873-2023Search in Google Scholar
[20] Wang H, Wu K, Liu Y, Sheng B, Lu X, He Y, et al. Role of heat wave-induced biogenic VOC enhancements in persistent ozone episodes formation in pearl river delta. J Geophys Res: Atmos. 2021;126:e2020JD034317.10.1029/2020JD034317Search in Google Scholar
[21] Xu Y, Wang D, Wu Z. Spatio-temporal variations of tropospheric NO2 over China from 1996 to 2010 based on remote sensing data. Remote Sens Technol Appl. 2013;28:898–903.Search in Google Scholar
[22] Gao C, Zhang C, Yu S. Temporal and spatial variation for vertical column density of tropospheric NO2 over the Yangtze River Delta from 2005 to 2013. J Zhejiang A&F Univ. 2015;32:691–700.Search in Google Scholar
[23] Wang X, Xu Y, Zhang C, Wu Y, Sun Z, Liu C. Spatial-temporal variation of tropospheric NO2 concentration in pearl river delta based on EMI observations. J Atmos Environ Opt. 2021;16:197–206.Search in Google Scholar
[24] Zhao R, Zhang C, Wu Y, Sun Z, Liu C. Analysis of spatio-temporal variations of tropospheric nitrogen dioxide in the north china plain based on EMI. J Atmos Environ Opt. 2021;16:186–96.Search in Google Scholar
[25] Wang S, Han X. China’s economic recovery after the outbreak of COVID-19—analysis based on air NO2 pollution. J Stat. 2021;2:24–34.Search in Google Scholar
[26] Tao J, Fan M, Gu J, CHEN L. Satellite observations of the return-to-work over China during the period of COVID-19. Natl Remote Sens Bull. 2020;24:824–36.10.3724/SP.J.7102193285Search in Google Scholar
[27] Cheng L, Tao J, Wang Y, Yu C, Lin J, CHEN L. Tropospheric NO2 changes in global typical regions during the COVID-19 pandemic from GF-5 EMI observations. Natl Remote Sens Bull. 2023;27:1807–20.10.11834/jrs.20231787Search in Google Scholar
[28] Zhao J, Cai K, Li S, Zhen F, Liu Y, Spatiotemporal analysis on the impact of COVID-19 pandemic on NO2 emission in China. China Environ Sci. 2021;41:56–62.Search in Google Scholar
[29] Wu Y, Wang M, Wang T, Yang M. Effect of COVlD-19 on temporal and spatial distribution of NO2 concentration and socio-economic life: A case study of Shaanxi Province. Ecol Environ Sci. 2023;32:514–24.Search in Google Scholar
[30] Leue C, Wenig M, Wagner T, Klimm O, Platt U, Jähne B. Quantitative analysis of NOxemissions from Global Ozone Monitoring Experiment satellite image sequences. J Geophys Res: Atmos. 2001;106:5493–505.10.1029/2000JD900572Search in Google Scholar
[31] Van Damme M, Erisman JW, Clarisse L, Dammers E, Whitburn S, Clerbaux C, et al. Worldwide spatiotemporal atmospheric ammonia (NH3) columns variability revealed by satellite: NH3spatiotemporal variability. Geophys Res Lett. 2015;42:8660–8.10.1002/2015GL065496Search in Google Scholar
[32] Krotkov NA, McLinden CA, Li C, Lamsal LN, Celarier EA, Marchenko SV, et al. Aura OMI observations of regional SO2 and NO2 pollution changes from 2005 to 2015. Atmos Chem Phys. 2016;16:4605–29.10.5194/acp-16-4605-2016Search in Google Scholar
[33] Zhang X, Zhang W, Lu X, Liu X, Chen D, Liu L, et al. Long-term trends in NO2 columns related to economic developments and air quality policies from 1997 to 2016 in China. Sci Total Environ. 2018;639:146–55.10.1016/j.scitotenv.2018.04.435Search in Google Scholar PubMed
[34] Chen D, Feng Y, Zhang X. Comparison of variability and change rate in tropospheric NO2 column obtained from satellite products across China during 1997–2015. Int J Digital Earth. 2017;10:814–28.10.1080/17538947.2016.1252435Search in Google Scholar
[35] Zhang Y, Lin J, Liu M, Kong H, Chen L, Weng H, et al. High-resolution Tropospheric NO2 Retrieval over Asia based on OMI POMINO v2.1 and quantitative comparison with other products. Natl Remote Sens Bull. 2022;26:971–87.10.11834/jrs.20221413Search in Google Scholar
[36] Zhang X, Liu L, Qin J, Dong J, Cheng M, Lu X, et al. Research progress on estimating atmospheric inorganic nitrogen deposition based on satellite observations. Natl Remote Sens Bull. 2023;27:1769–81.10.11834/jrs.20231631Search in Google Scholar
[37] Butz A, Galli A, Hasekamp O, Landgraf J, Tol P, Aben I. TROPOMI aboard sentinel-5 precursor: Prospective performance of CH4 retrievals for aerosol and cirrus loaded atmospheres. Remote Sens Environ. 2012;120:267–76.10.1016/j.rse.2011.05.030Search in Google Scholar
[38] Vîrghileanu M, Săvulescu I, Mihai B-A, Nistor C, Dobre R. Nitrogen dioxide (NO2) pollution monitoring with sentinel-5P satellite imagery over europe during the coronavirus pandemic outbreak. Remote Sens. 2020;12(21):3575.10.3390/rs12213575Search in Google Scholar
[39] Lorente A, Boersma KF, Eskes HJ, Veefkind JP, van Geffen J, de Zeeuw MB, et al. Quantification of nitrogen oxides emissions from build-up of pollution over Paris with TROPOMI. Sci Rep. 2019;9:20033.10.1038/s41598-019-56428-5Search in Google Scholar PubMed PubMed Central
[40] Shikwambana L, Mhangara P, Mbatha N. Trend analysis and first time observations of sulphur dioxide and nitrogen dioxide in South Africa using TROPOMI/Sentinel-5 P data. Int J Appl Earth Observ Geoinf. 2020;91:102130.10.1016/j.jag.2020.102130Search in Google Scholar
[41] van der Velde IR, van der Werf GR, Houweling S, Eskes HJ, Veefkind JP, Borsdorff T, et al. Biomass burning combustion efficiency observed from space using measurements of CO and NO2 by the TROPOspheric Monitoring Instrument (TROPOMI). Atmos Chem Phys. 2021;21:597–616.10.5194/acp-21-597-2021Search in Google Scholar
[42] Bodah BW, Neckel A, Stolfo Maculan L, Milanes CB, Korcelski C, Ramírez O, et al. Sentinel-5P TROPOMI satellite application for NO2 and CO studies aiming at environmental valuation. J Clean Prod. 2022;357:131960.10.1016/j.jclepro.2022.131960Search in Google Scholar
[43] Zheng Z, Yang Z, Wu Z, Marinello F. Spatial variation of NO2 and its impact factors in China: An application of sentinel-5P products. Remote Sens. 2019;11:1939.10.3390/rs11161939Search in Google Scholar
[44] Zheng Z, Wu Z, Chen Y, ZhiWei Y, Marinello F, et al. Analysis of temporal and spatial variation characteristics of NO2 pollutants in Guangdong-Hong Kong-Macao Greater Bay Area based on Sentinel-5P satellite data. China Environ Sci. 2021;41:63–72.Search in Google Scholar
[45] Liu Y, Xie Y, Guo Z. Monitoring atmospheric NO2 concentrations in China based on Sentinel-5P satellite products. China Environ Sci. 2022;42:4983–90.Search in Google Scholar
[46] Sun R. Characteristics of air pollution and the influence of mutual transport in Jing-Jin-Ji Region. Doctor thesis. Tianjin: Tianjin University; 2018.Search in Google Scholar
[47] Galli A, Butz A, Scheepmaker RA, Hasekamp O, Landgraf J, Tol P, et al. CH4, CO, and H2O spectroscopy for the Sentinel-5 Precursor mission: An assessment with the Total Carbon Column Observing Network measurements. Atmos Meas Tech. 2012;5:1387–98.10.5194/amt-5-1387-2012Search in Google Scholar
[48] Boersma KF, Eskes HJ, Veefkind JP, Brinksma EJ, van der A RJ, Sneep M, et al. Near-real time retrieval of tropospheric NO2 from OMI. Atmos Chem Phys. 2007;7:2103–18.10.5194/acp-7-2103-2007Search in Google Scholar
[49] Boersma KF, Eskes HJ, Dirksen RJ, van der A RJ, Veefkind JP, Stammes P, et al. An improved tropospheric NO2 column retrieval algorithm for the ozone monitoring instrument. Atmos Meas Tech. 2011;4:1905–28.10.5194/amt-4-1905-2011Search in Google Scholar
[50] van Geffen J, Eskes H, Compernolle S, Pinardi G, Verhoelst T, Lambert JC, et al. Sentinel-5P TROPOMI NO2 retrieval: Impact of version v2.2 improvements and comparisons with OMI and ground-based data. Atmos Meas Tech. 2022;15:2037–60.10.5194/amt-15-2037-2022Search in Google Scholar
[51] Zhu S, Xu J, Zeng J, Yu C, Wang Y, Wang H, et al. LESO: A ten-year ensemble of satellite-derived intercontinental hourly surface ozone concentrations. Sci Data. 2023;10:741.10.1038/s41597-023-02656-4Search in Google Scholar PubMed PubMed Central
[52] Camps-Valls G, Campos-Taberner M, Moreno-Martínez Á, Walther S, Duveiller G, Cescatti A, et al. A unified vegetation index for quantifying the terrestrial biosphere. Sci Adv. 2021;7:eabc7447.10.1126/sciadv.abc7447Search in Google Scholar PubMed PubMed Central
[53] Cui X, Liang T, Liu Y. Modeling of aboveground biomass of grassland using remotely sensed MOD09GA data. 2009;45:79–87.Search in Google Scholar
[54] Farr TG, Rosen PA, Caro E, Crippen R, Duren R, Hensley S, et al. The shuttle radar topography mission. Rev Geophys. 2007;45(2).10.1029/2005RG000183Search in Google Scholar
[55] Abatzoglou JT, Dobrowski SZ, Parks SA, Hegewisch KC. TerraClimate, a high-resolution global dataset of monthly climate and climatic water balance from 1958–2015. Sci Data. 2018;5:170191.10.1038/sdata.2017.191Search in Google Scholar PubMed PubMed Central
[56] Elvidge CD, Baugh K, Zhizhin M, Hsu FC, Ghosh T. VIIRS night-time lights. Int J Remote Sens. 2017;38:5860–79.10.1080/01431161.2017.1342050Search in Google Scholar
[57] Xu X, Liu J, Zhang S, Li R, Yan C, Wu S. China multi period land use remote sensing monitoring dataset (CNLUCC). China: Resource and Environmental Science Data Platform; 2018.Search in Google Scholar
[58] Gao J, Bao J, Liu Y, Chen J. Regional disparity and the influencing factors of land urbanization in China at the county level, 2000-2015. Acta Geogr Sin. 2018;73:2329–44.Search in Google Scholar
[59] Wang J, Xu C. Geodetector: Principle and prospective. Acta Geogr Sin. 2017;72:116–34.Search in Google Scholar
[60] Chen X, Zhao M, Lu H, Xu S, Qiu S, Hu K. Comparison and analysis of spatial prediction and variability of soil pH in Anhui Province based on three kinds of geographically weighted regression. Geogr Sci. 2023;43:173–83.Search in Google Scholar
[61] Judd LM, Al-Saadi JA, Szykman JJ, Valin LC, Janz SJ, Kowalewski MG, et al. Evaluating Sentinel-5P TROPOMI tropospheric NO2 column densities with airborne and Pandora spectrometers near New York City and Long Island Sound. Atmos Meas Tech. 2020;13:6113–40.10.5194/amt-13-6113-2020Search in Google Scholar PubMed PubMed Central
[62] Verhoelst T, Compernolle S, Pinardi G, Lambert JC, Eskes HJ, Eichmann KU, et al. Ground-based validation of the Copernicus Sentinel-5P TROPOMI NO2 measurements with the NDACC ZSL-DOAS, MAX-DOAS and Pandonia global networks. Atmos Meas Tech. 2021;14:481–510.10.5194/amt-14-481-2021Search in Google Scholar
[63] Zhu W, Zhou T, Li H, Xu W. Remote sensing monitoring of tropospheric NO2 density in Cheng-du-Chongqing urban agglomeration based on OMI data. Resour Environ Yangtze Basin. 2019;28:2239–50.Search in Google Scholar
[64] Li P, Xiao Z, Chen K, Sun R. Temporal and spatial distribution characteristics of tropospheric NO2 and its adaptability in Tianjin using OMI satellite remote sensing data. Environ Sci Technol. 2016;39:183–6+204.Search in Google Scholar
[65] Lu B, Hu Y, Yang D, Liu Y, Liao L, Yin Z, et al. GWmodelS: A software for geographically weighted models. SoftwareX. 2023;21:101291.10.1016/j.softx.2022.101291Search in Google Scholar
[66] Lu B, Dong G. GWmodelS: A high-performance computing framework for geographically weighted models. In: Wu H, Liu Y, Li J, Meng X, Guan Q, Song X, et al. Spatial data and intelligence. 2022, Cham: Springer Nature Switzerland; 2022. p. 154–61.10.1007/978-3-031-24521-3_11Search in Google Scholar
[67] Tao J, Zhao X, Chen Y, Xu Y, Tang Y, Qu G, et al. Spatial and temporal evolution of carbon dioxide emissions from energy con-sumption and influencing factors in Yunnan Province. Environ Sci Technol. 2023;46:178–87.Search in Google Scholar
[68] Cheng Y, Wu Y. Spatiotemporal changes of tropospheric NO2 vertical column densities in China based on OMI data and its influencing factors. Prog Geophys. 2020;35:1644–50.Search in Google Scholar
[69] Qin W. The basic theoretics and application research on geographically weighted regression. Doctor thesis. Shanghai: Tongji University; 2007.Search in Google Scholar
[70] Accelerate the promotion of digital intelligence in the supervision of mobile source emissions. 2024 at http://www.sdein.gov.cn/dtxx/zhbsdxw/202405/t20240507_4724110.html.Search in Google Scholar
[71] Guan J, Solomon S, Madronich S, Kinnison D. Inferring the photolysis rate of NO2 in the stratosphere based on satellite observations. Atmos Chem Phys. 2023;23(18):10413–22.10.5194/acp-23-10413-2023Search in Google Scholar
[72] Xue J. Temporal and spatial characteristics of nocturnal ozone exceedance in the North China Plain and its meteorological causes. Master thesis. Nanjing: Nanjing University of Information Science & Technology; 2024.Search in Google Scholar
[73] Li K. Measurement and analysis of atmospheric pollutants and CO2, pollution transfer in cross regional transmission of thermal power generation. Environ Sci Manag. 2025;50:141–6.Search in Google Scholar
[74] Lu A, Zhou J. Can collaborative governance of regional air pollution lmprove air quality: An empirical PSM-DlD study of 279 cities in china. Resour Environ Yangtze Basin. 2025;34:652–67.Search in Google Scholar
[75] Zhou C, Li Q, He Y, Wang Z, Chen H, Zhang L, et al. Spatial-temporal change of tropospheric NO2 column density and its impact factors over Shandong province during 2005–2014. China Environ Sci. 2015;35:2281–90.Search in Google Scholar
[76] Zhao Y, Su Z, Chen Y, Hou S, Lu X, Zheng B, et al. Rising importance of agricultural nitrogen oxide emissions in China’s future PM2.5 pollution mitigation. npj Clim Atmos Sci. 2025;8:93.10.1038/s41612-025-00976-3Search in Google Scholar
[77] Shen Y, Luo J, Ma Y, Yao L, Hu C. Spatiotemporal patterns and driving forces of NO2 concentrations from different emission sources in the energy golden triangle of China. China Environ Sci. 2022;42:1585–93.Search in Google Scholar
[78] David LM, Nair PR. Diurnal and seasonal variability of surface ozone and NO at a tropical coastal site: Association with mesoscale and synoptic meteorological conditions. J Geophys Res: Atmos. 2011;116(D10).10.1029/2010JD015076Search in Google Scholar
[79] Tian XP, Wang D, Wang YQ, Gao ZQ, Tian CG, Bi XL, et al. Long-term variations and trends of tropospheric and ground-level NO2 over typical coastal areas. Ecol Indic. 2024;164:112163.10.1016/j.ecolind.2024.112163Search in Google Scholar
[80] de la Cruz Libardi A, Masselot P, Schneider R, Nightingale E, Milojevic A, Vanoli J, et al. High resolution mapping of nitrogen dioxide and particulate matter in Great Britain (2003–2021) with multi-stage data reconstruction and ensemble machine learning methods. Atmos Pollut Res. 2024;15:102284.10.1016/j.apr.2024.102284Search in Google Scholar PubMed PubMed Central
[81] Li T, Liu S, Chen D, Zhang R, Liu H, Song D, et al. Long-term reconstruction of NO2 photolysis rate coefficients using machine learning and its impact on secondary pollution: A case study in a megacity of the Sichuan Basin, China. Atmos Pollut Res. 2025;16:102526.10.1016/j.apr.2025.102526Search in Google Scholar
[82] Jiang Z, Wang S, Yan Y, Zhang S, Xue R, Gu C, et al. Constructing the 3D spatial distribution of the HCHO/NO2 ratio via satellite observation and machine learning model. Environ Sci Technol. 2025;59:4047–58.10.1021/acs.est.4c12362Search in Google Scholar PubMed
© 2025 the author(s), published by De Gruyter
This work is licensed under the Creative Commons Attribution 4.0 International License.
Articles in the same Issue
- Research Articles
- Seismic response and damage model analysis of rocky slopes with weak interlayers
- Multi-scenario simulation and eco-environmental effect analysis of “Production–Living–Ecological space” based on PLUS model: A case study of Anyang City
- Remote sensing estimation of chlorophyll content in rape leaves in Weibei dryland region of China
- GIS-based frequency ratio and Shannon entropy modeling for landslide susceptibility mapping: A case study in Kundah Taluk, Nilgiris District, India
- Natural gas origin and accumulation of the Changxing–Feixianguan Formation in the Puguang area, China
- Spatial variations of shear-wave velocity anomaly derived from Love wave ambient noise seismic tomography along Lembang Fault (West Java, Indonesia)
- Evaluation of cumulative rainfall and rainfall event–duration threshold based on triggering and non-triggering rainfalls: Northern Thailand case
- Pixel and region-oriented classification of Sentinel-2 imagery to assess LULC dynamics and their climate impact in Nowshera, Pakistan
- The use of radar-optical remote sensing data and geographic information system–analytical hierarchy process–multicriteria decision analysis techniques for revealing groundwater recharge prospective zones in arid-semi arid lands
- Effect of pore throats on the reservoir quality of tight sandstone: A case study of the Yanchang Formation in the Zhidan area, Ordos Basin
- Hydroelectric simulation of the phreatic water response of mining cracked soil based on microbial solidification
- Spatial-temporal evolution of habitat quality in tropical monsoon climate region based on “pattern–process–quality” – a case study of Cambodia
- Early Permian to Middle Triassic Formation petroleum potentials of Sydney Basin, Australia: A geochemical analysis
- Micro-mechanism analysis of Zhongchuan loess liquefaction disaster induced by Jishishan M6.2 earthquake in 2023
- Prediction method of S-wave velocities in tight sandstone reservoirs – a case study of CO2 geological storage area in Ordos Basin
- Ecological restoration in valley area of semiarid region damaged by shallow buried coal seam mining
- Hydrocarbon-generating characteristics of Xujiahe coal-bearing source rocks in the continuous sedimentary environment of the Southwest Sichuan
- Hazard analysis of future surface displacements on active faults based on the recurrence interval of strong earthquakes
- Structural characterization of the Zalm district, West Saudi Arabia, using aeromagnetic data: An approach for gold mineral exploration
- Research on the variation in the Shields curve of silt initiation
- Reuse of agricultural drainage water and wastewater for crop irrigation in southeastern Algeria
- Assessing the effectiveness of utilizing low-cost inertial measurement unit sensors for producing as-built plans
- Analysis of the formation process of a natural fertilizer in the loess area
- Machine learning methods for landslide mapping studies: A comparative study of SVM and RF algorithms in the Oued Aoulai watershed (Morocco)
- Chemical dissolution and the source of salt efflorescence in weathering of sandstone cultural relics
- Molecular simulation of methane adsorption capacity in transitional shale – a case study of Longtan Formation shale in Southern Sichuan Basin, SW China
- Evolution characteristics of extreme maximum temperature events in Central China and adaptation strategies under different future warming scenarios
- Estimating Bowen ratio in local environment based on satellite imagery
- 3D fusion modeling of multi-scale geological structures based on subdivision-NURBS surfaces and stratigraphic sequence formalization
- Comparative analysis of machine learning algorithms in Google Earth Engine for urban land use dynamics in rapidly urbanizing South Asian cities
- Study on the mechanism of plant root influence on soil properties in expansive soil areas
- Simulation of seismic hazard parameters and earthquakes source mechanisms along the Red Sea rift, western Saudi Arabia
- Tectonics vs sedimentation in foredeep basins: A tale from the Oligo-Miocene Monte Falterona Formation (Northern Apennines, Italy)
- Investigation of landslide areas in Tokat-Almus road between Bakımlı-Almus by the PS-InSAR method (Türkiye)
- Predicting coastal variations in non-storm conditions with machine learning
- Cross-dimensional adaptivity research on a 3D earth observation data cube model
- Geochronology and geochemistry of late Paleozoic volcanic rocks in eastern Inner Mongolia and their geological significance
- Spatial and temporal evolution of land use and habitat quality in arid regions – a case of Northwest China
- Ground-penetrating radar imaging of subsurface karst features controlling water leakage across Wadi Namar dam, south Riyadh, Saudi Arabia
- Rayleigh wave dispersion inversion via modified sine cosine algorithm: Application to Hangzhou, China passive surface wave data
- Fractal insights into permeability control by pore structure in tight sandstone reservoirs, Heshui area, Ordos Basin
- Debris flow hazard characteristic and mitigation in Yusitong Gully, Hengduan Mountainous Region
- Research on community characteristics of vegetation restoration in hilly power engineering based on multi temporal remote sensing technology
- Identification of radial drainage networks based on topographic and geometric features
- Trace elements and melt inclusion in zircon within the Qunji porphyry Cu deposit: Application to the metallogenic potential of the reduced magma-hydrothermal system
- Pore, fracture characteristics and diagenetic evolution of medium-maturity marine shales from the Silurian Longmaxi Formation, NE Sichuan Basin, China
- Study of the earthquakes source parameters, site response, and path attenuation using P and S-waves spectral inversion, Aswan region, south Egypt
- Source of contamination and assessment of potential health risks of potentially toxic metal(loid)s in agricultural soil from Al Lith, Saudi Arabia
- Regional spatiotemporal evolution and influencing factors of rural construction areas in the Nanxi River Basin via GIS
- An efficient network for object detection in scale-imbalanced remote sensing images
- Effect of microscopic pore–throat structure heterogeneity on waterflooding seepage characteristics of tight sandstone reservoirs
- Environmental health risk assessment of Zn, Cd, Pb, Fe, and Co in coastal sediments of the southeastern Gulf of Aqaba
- A modified Hoek–Brown model considering softening effects and its applications
- Evaluation of engineering properties of soil for sustainable urban development
- The spatio-temporal characteristics and influencing factors of sustainable development in China’s provincial areas
- Application of a mixed additive and multiplicative random error model to generate DTM products from LiDAR data
- Gold vein mineralogy and oxygen isotopes of Wadi Abu Khusheiba, Jordan
- Prediction of surface deformation time series in closed mines based on LSTM and optimization algorithms
- 2D–3D Geological features collaborative identification of surrounding rock structural planes in hydraulic adit based on OC-AINet
- Spatiotemporal patterns and drivers of Chl-a in Chinese lakes between 1986 and 2023
- Land use classification through fusion of remote sensing images and multi-source data
- Nexus between renewable energy, technological innovation, and carbon dioxide emissions in Saudi Arabia
- Analysis of the spillover effects of green organic transformation on sustainable development in ethnic regions’ agriculture and animal husbandry
- Factors impacting spatial distribution of black and odorous water bodies in Hebei
- Large-scale shaking table tests on the liquefaction and deformation responses of an ultra-deep overburden
- Impacts of climate change and sea-level rise on the coastal geological environment of Quang Nam province, Vietnam
- Reservoir characterization and exploration potential of shale reservoir near denudation area: A case study of Ordovician–Silurian marine shale, China
- Seismic prediction of Permian volcanic rock reservoirs in Southwest Sichuan Basin
- Application of CBERS-04 IRS data to land surface temperature inversion: A case study based on Minqin arid area
- Geological characteristics and prospecting direction of Sanjiaoding gold mine in Saishiteng area
- Research on the deformation prediction model of surrounding rock based on SSA-VMD-GRU
- Geochronology, geochemical characteristics, and tectonic significance of the granites, Menghewula, Southern Great Xing’an range
- Hazard classification of active faults in Yunnan base on probabilistic seismic hazard assessment
- Characteristics analysis of hydrate reservoirs with different geological structures developed by vertical well depressurization
- Estimating the travel distance of channelized rock avalanches using genetic programming method
- Landscape preferences of hikers in Three Parallel Rivers Region and its adjacent regions by content analysis of user-generated photography
- New age constraints of the LGM onset in the Bohemian Forest – Central Europe
- Characteristics of geological evolution based on the multifractal singularity theory: A case study of Heyu granite and Mesozoic tectonics
- Soil water content and longitudinal microbiota distribution in disturbed areas of tower foundations of power transmission and transformation projects
- Oil accumulation process of the Kongdian reservoir in the deep subsag zone of the Cangdong Sag, Bohai Bay Basin, China
- Investigation of velocity profile in rock–ice avalanche by particle image velocimetry measurement
- Optimizing 3D seismic survey geometries using ray tracing and illumination modeling: A case study from Penobscot field
- Sedimentology of the Phra That and Pha Daeng Formations: A preliminary evaluation of geological CO2 storage potential in the Lampang Basin, Thailand
- Improved classification algorithm for hyperspectral remote sensing images based on the hybrid spectral network model
- Map analysis of soil erodibility rates and gully erosion sites in Anambra State, South Eastern Nigeria
- Identification and driving mechanism of land use conflict in China’s South-North transition zone: A case study of Huaihe River Basin
- Evaluation of the impact of land-use change on earthquake risk distribution in different periods: An empirical analysis from Sichuan Province
- A test site case study on the long-term behavior of geotextile tubes
- An experimental investigation into carbon dioxide flooding and rock dissolution in low-permeability reservoirs of the South China Sea
- Detection and semi-quantitative analysis of naphthenic acids in coal and gangue from mining areas in China
- Comparative effects of olivine and sand on KOH-treated clayey soil
- YOLO-MC: An algorithm for early forest fire recognition based on drone image
- Earthquake building damage classification based on full suite of Sentinel-1 features
- Potential landslide detection and influencing factors analysis in the upper Yellow River based on SBAS-InSAR technology
- Assessing green area changes in Najran City, Saudi Arabia (2013–2022) using hybrid deep learning techniques
- An advanced approach integrating methods to estimate hydraulic conductivity of different soil types supported by a machine learning model
- Hybrid methods for land use and land cover classification using remote sensing and combined spectral feature extraction: A case study of Najran City, KSA
- Streamlining digital elevation model construction from historical aerial photographs: The impact of reference elevation data on spatial accuracy
- Analysis of urban expansion patterns in the Yangtze River Delta based on the fusion impervious surfaces dataset
- A metaverse-based visual analysis approach for 3D reservoir models
- Late Quaternary record of 100 ka depositional cycles on the Larache shelf (NW Morocco)
- Integrated well-seismic analysis of sedimentary facies distribution: A case study from the Mesoproterozoic, Ordos Basin, China
- Study on the spatial equilibrium of cultural and tourism resources in Macao, China
- Urban road surface condition detecting and integrating based on the mobile sensing framework with multi-modal sensors
- Application of improved sine cosine algorithm with chaotic mapping and novel updating methods for joint inversion of resistivity and surface wave data
- The synergistic use of AHP and GIS to assess factors driving forest fire potential in a peat swamp forest in Thailand
- Dynamic response analysis and comprehensive evaluation of cement-improved aeolian sand roadbed
- Rock control on evolution of Khorat Cuesta, Khorat UNESCO Geopark, Northeastern Thailand
- Gradient response mechanism of carbon storage: Spatiotemporal analysis of economic-ecological dimensions based on hybrid machine learning
- Comparison of several seismic active earth pressure calculation methods for retaining structures
- Mantle dynamics and petrogenesis of Gomer basalts in the Northwestern Ethiopia: A geochemical perspective
- Study on ground deformation monitoring in Xiong’an New Area from 2021 to 2023 based on DS-InSAR
- Paleoenvironmental characteristics of continental shale and its significance to organic matter enrichment: Taking the fifth member of Xujiahe Formation in Tianfu area of Sichuan Basin as an example
- Equipping the integral approach with generalized least squares to reconstruct relict channel profile and its usage in the Shanxi Rift, northern China
- InSAR-driven landslide hazard assessment along highways in hilly regions: A case-based validation approach
- Attribution analysis of multi-temporal scale surface streamflow changes in the Ganjiang River based on a multi-temporal Budyko framework
- Maps analysis of Najran City, Saudi Arabia to enhance agricultural development using hybrid system of ANN and multi-CNN models
- Hybrid deep learning with a random forest system for sustainable agricultural land cover classification using DEM in Najran, Saudi Arabia
- Long-term evolution patterns of groundwater depth and lagged response to precipitation in a complex aquifer system: Insights from Huaibei Region, China
- Remote sensing and machine learning for lithology and mineral detection in NW, Pakistan
- Spatial–temporal variations of NO2 pollution in Shandong Province based on Sentinel-5P satellite data and influencing factors
- 10.1515/geo-2025-0901
- Numerical modeling of geothermal energy piles with sensitivity and parameter variation analysis of a case study
- Review Articles
- Humic substances influence on the distribution of dissolved iron in seawater: A review of electrochemical methods and other techniques
- Applications of physics-informed neural networks in geosciences: From basic seismology to comprehensive environmental studies
- Ore-controlling structures of granite-related uranium deposits in South China: A review
- Shallow geological structure features in Balikpapan Bay East Kalimantan Province – Indonesia
- A review on the tectonic affinity of microcontinents and evolution of the Proto-Tethys Ocean in Northeastern Tibet
- Special Issue: Natural Resources and Environmental Risks: Towards a Sustainable Future - Part II
- Depopulation in the Visok micro-region: Toward demographic and economic revitalization
- Special Issue: Geospatial and Environmental Dynamics - Part II
- Advancing urban sustainability: Applying GIS technologies to assess SDG indicators – a case study of Podgorica (Montenegro)
- Spatiotemporal and trend analysis of common cancers in men in Central Serbia (1999–2021)
- Minerals for the green agenda, implications, stalemates, and alternatives
- Spatiotemporal water quality analysis of Vrana Lake, Croatia
- Functional transformation of settlements in coal exploitation zones: A case study of the municipality of Stanari in Republic of Srpska (Bosnia and Herzegovina)
- Hypertension in AP Vojvodina (Northern Serbia): A spatio-temporal analysis of patients at the Institute for Cardiovascular Diseases of Vojvodina
- Regional patterns in cause-specific mortality in Montenegro, 1991–2019
- Spatio-temporal analysis of flood events using GIS and remote sensing-based approach in the Ukrina River Basin, Bosnia and Herzegovina
- Flash flood susceptibility mapping using LiDAR-Derived DEM and machine learning algorithms: Ljuboviđa case study, Serbia
- Geocultural heritage as a basis for geotourism development: Banjska Monastery, Zvečan (Serbia)
- Assessment of groundwater potential zones using GIS and AHP techniques – A case study of the zone of influence of Kolubara Mining Basin
- Impact of the agri-geographical transformation of rural settlements on the geospatial dynamics of soil erosion intensity in municipalities of Central Serbia
- Where faith meets geomorphology: The cultural and religious significance of geodiversity explored through geospatial technologies
- Applications of local climate zone classification in European cities: A review of in situ and mobile monitoring methods in urban climate studies
- Complex multivariate water quality impact assessment on Krivaja River
- Ionization hotspots near waterfalls in Eastern Serbia’s Stara Planina Mountain
- Shift in landscape use strategies during the transition from the Bronze age to Iron age in Northwest Serbia
- Assessing the geotourism potential of glacial lakes in Plav, Montenegro: A multi-criteria assessment by using the M-GAM model
- Flash flood potential index at national scale: Susceptibility assessment within catchments