Cross-dimensional adaptivity research on a 3D earth observation data cube model
-
Jinsongdi Yu
 ,
Zhanying Cui
,
Zhanying Cui

Abstract
Earth observation (EO) data cubes have gained significance for their potential in providing comprehensive insights into dynamic earth phenomena. However, a significant challenge in their utilization is the interoperability among EO data cubes with varying dimensionalities. Existing efforts have primarily focused on enhancing analysis ready data cubes, yet cross-dimensional adaptivity remains relatively unexplored. This study proposes a novel approach to address this issue. The proposed method is based on a 3D adaptive data cube model constructed in a 3D adaptive space. The main objective is to achieve interoperability between EO data cubes of different dimensions while adhering to common geospatial standards. The core methodology involves cross-dimensional mapping, considering a 3D adaptive space containing spatial axes and adaptive axes. Importantly, the method applies to data cubes with the same coordinate reference system, resolution, and data type. To enable cross-dimensional mapping, a key requirement is the existence of a mapping function between the multidimensional space domain and the 3D adaptive space domain. When these conditions are met, data cubes with three or more dimensions can be interoperable. This becomes feasible by applying suitable serialization algorithms. This study demonstrates that data cubes can be successfully mapped into the proposed 3D adaptive data cube, achieving interoperability under specific conditions. This finding has significant implications in the field of EO data analysis, enabling seamless interaction between data cubes with different dimensions. The method not only facilitates cross-dimensional adaptability but also aligns with mainstream geospatial service standards. It is particularly suitable for multidimensional geospatial raster services based on the OGC WCS 2.0 standard. In conclusion, this study addresses a critical challenge in EO data analysis by proposing a 3D adaptive data cube model that promotes interoperability between data cubes of varying dimensions.
1 Introduction
Earth observation (EO) is essential for a wide range of applications, from environmental monitoring to urban planning and agriculture. However, the potential of EO data is often underutilized due to challenges in data processing and accessibility. The complexity arises from the diversity of data sources, formats, and resolutions, which contribute to the high cost and complexity of integrating these data into actionable insights. To overcome these obstacles, various approaches and technologies have been developed, including EO data cubes [1–3]. These cubes encapsulate vast and diverse EO datasets within a multi-dimensional framework, specifically designed to integrate, manage, and share massive and heterogeneous EO data. Examples of data cube implementations include EarthServer [4], the Open Data Cube initiative [5], the Google Earth Engine [6], the Euro Data Cube [7], the Swiss Data Cube [8], and the Brazil Data Cube [9], each aiming to enhance the understanding and utilization of EO data [1,10]. Other related platforms and services, while not implementing data cubes themselves, can also play a significant role in the broader ecosystem of EO data management and analysis. They provide the foundational data that can be organized and analyzed within data cube frameworks. For instance, the e-sensing platform [11] and the JRC Earth Observation Data and Processing Platform [12] offer valuable tools and services for processing and analyzing EO data, which can enhance the capabilities of data cube frameworks when integrated with them. Similarly, the Copernicus Data Space Ecosystem [13] provide vast amounts of satellite data, serving as a vital resource that can be ingested into data cube structures to facilitate advanced analytics and time-series analysis. This integration can be achieved through various tools, such as openEO [13], which offers access to satellite data and processing capabilities.
Despite the advancements in data cube implementations, a pivotal challenge persists: the absence of interoperability among these systems. Interoperability is tentatively defined as the ability of different data cube infrastructures to connect and communicate in a coordinated way, providing a rich experience to users [10]. The root of this issue does not lie solely in the lack of interoperability itself, but rather in the diverse and frequently incompatible approaches employed to structure and administer these data cubes. This incompatibility poses a barrier to seamlessly amalgamating data across various platforms, which is indispensable for conducting exhaustive analyses and informed decision-making. To address this challenge, there is a pressing need for the standardization of data cube structures and management methods, thereby fostering greater compatibility and enabling seamless data integration across disparate systems.
In this research, we introduce a solution to the prevailing interoperability challenge by presenting the 3D adaptive data cube model. The model incorporates a serialization function for the adaptive axis, which serves to model the intricate combination of axes embodying multiple variables. This strategic approach facilitates the integration of data originating from diverse dimensions into a cohesive and unified framework, thereby enhancing data interoperability and paving the way for more comprehensive and seamless data analysis. To clarify the problem and the solution, consider the scenario where a researcher seeks to analyze climate change impacts by integrating EO data on temperature, precipitation, and vegetation indices. Current data cube systems would require extensive preprocessing to align these variables, which are stored in different formats and resolutions. The proposed 3D Adaptive Data Cube model simplifies this process by providing a standardized method to serialize and integrate these variables into a single, coherent data structure.
This manuscript specifically explores data cube interoperability in terms of the exchange and utilization of information from different data services, with a focus on cross-dimensional adaptivity. The remainder of this work is organized as follows: Section 2 provides a detailed review of the related research and the current state-of-the-art. Section 3 introduces the 3D adaptive data cube model in depth. Section 4 demonstrates how our model can be adapted to achieve cross-dimensional interoperability. Section 5 presents a standard-based case study that exemplifies the practical application of our model. Finally, Section 6 concludes the findings and discusses the potential for future developments.
2 State-of-the-art
Normally, data cubes manage multidisciplinary imagery and gridded data in multidimensional arrays, ranging from 2D to nD, including complex structures like 3D x/y/t time series and 4 x/y/v/t EO data [14]. The primary challenge in this domain is developing a generic cube model that ensures cross-dimensional interoperability, allowing for the seamless integration of data across various dimensions and platforms.
A robust Data Cube model consistently maintains coherence across multiple axes, including spatial, temporal, and variable axes, which can exhibit significant variation in their attributes and resolutions. While harmonizing data cubes with matching axis extents is often feasible through interpolation, semantic gaps can emerge due to differences in desired levels of detail or when combining data from disparate sources. To address these, a 3D spatial-variable data cube has been proposed, enabling analysis across both spatial axes (latitude and longitude) and variable axes [15]. This model supports the arrangement of variables in sequence, with each coordinate on the variable axis represented by an integer referring to a variable description. However, existing models are yet to provide a comprehensive solution for adapting to data cubes of unlimited dimensions, which is essential for achieving globally adaptive interoperability.
A generic cube model is pivotal for advancing global data cube interoperability, which would significantly benefit from the widespread adoption of commonly available geospatial standards. To promote Analysis Ready Data Cube programs and ensure the seamless interoperability of imagery or gridded data services, several standard-based conformance testing approaches have been employed. These approaches validate whether a product or system complies with commonly available geospatial standards. One such approach is the OGC’s Test, Evaluation, and Measurement (TEAM) Engine [16], which executes an executable test suite to evaluate the implementation of imagery or gridded data services. It verifies that the services adhere to declared standards. Another notable tool is the INSPIRE Reference Validator [17], which assesses data, metadata, and web services against defined specifications or technical guidelines. These tests rely heavily on data cube standards, such as the ISO 19123-x series for fundamental models and OGC WCS 2.0 [18] for service interfaces. These standards facilitate standardized solutions up to n dimensions, encompassing the standardization of axes and multiple attributes, commonly referred to as bands or variables. Additionally, the Discrete global grid systems (DGGS) offer yet another novel framework for managing and analyzing geospatial data [19]. DGGS divides the earth into a multi-scale, hierarchical grid system, providing a unique approach to data integration that can potentially complement or integrate with existing data cube models. However, it has inherent limitations in terms of supporting an unlimited number of dimensions.
The interoperability of data cubes with different dimensionalities remains an open challenge. Current methods, such as domain variable identification [15] via a standardized resolver approach [20], support the modeling of multi-variable data cubes for multidisciplinary applications. However, these do not fully address the complexity of interoperation among variables with different dimensionalities. For instance, integrating a 3D x/y/t image time-series with 4D x/y/z/t ocean and climate dataset requires a sophisticated variable serialization function to stack variables on the same spatial surface effectively. The stacking results tend to be undecidable without a proper variable serialization function.
3 Methods
3.1 3D adaptive data cube model
3.1.1 Basic concepts
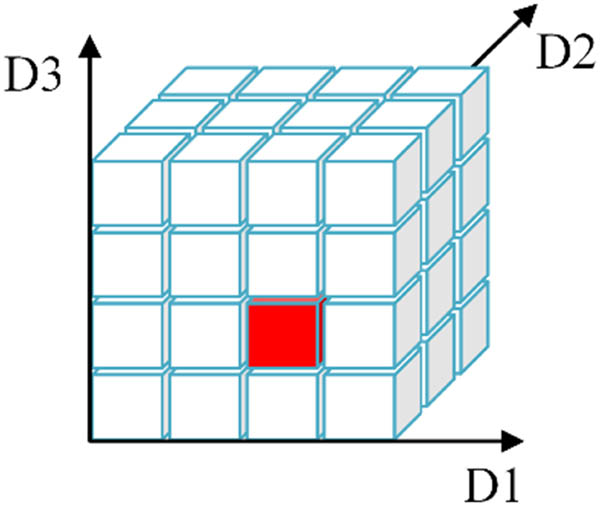
The 3D adaptive data cube model is a novel approach designed to address the challenges of interoperability and integration among multidimensional EO data. This section provides a detailed explanation of the model, including its key components, the adaptive nature of the model, and its practical application. The model is defined on basic concepts. Specifically, these include variable, dimension, axis, and data cube. Variables are the different measurable quantities or attributes that are recorded or observed in a dataset. In the context of our data cube, variables represent the different types of environmental data, such as temperature or salinity. Dimensions represent the different aspects or characteristics of a variable. Common dimensions in EO data include spatial dimensions (latitude and longitude), temporal dimensions (time), and thematic dimensions (different variables). In the context of data cubes, an axis represents a dimension along which data are organized. For instance, the x and y axes typically represent spatial dimensions, while additional axes can represent time or different variables. A data cube is a multi-dimensional array of data points that are defined by a set of axes. Each point in the cube represents a single data value at the intersection of the dimensions.
3.1.2 Adaptive axis
An adaptive axis is a conceptual framework used to organize variables within a data structure. In the context of this study, an adaptive axis is defined based on a variable axis [15], which sequentially arranges each variable while ensuring that each variable shares the same spatial coordinate reference system (CRS), resolution and data type [15]. A variable on an adaptive axis encompasses ordered dimensions such as depth, time, and/or other information. Formally, an adaptive axis can be specified as:
where A is an adaptive axis, and each
For example, a 3D adaptive space is used to analyze deep ocean data, where the

Schematic of 3D adaptive data cube.
3.1.3 3D adaptive space
The 3D adaptive space in this study is constructed by integrating latitude and longitude spatial axes with an adaptive axis, creating a multi-dimensional space. This space is mathematically denoted as
where
3.1.4 3D adaptive data cube
A 3D adaptive data cube is a formal data structure defined as a function representing the 3D adaptive space domain
where AS represents the 3D adaptive space domain, consisting of bounded axes and containing a set of one or more cube cell primitives. R specifies the range of values that can be associated with data cube locations, and
3.2 Cross-dimensional adaptivity
3.2.1 Cross-dimensionality mapping
The cross-dimensionality investigated in this study is under the condition that data cubes share the same spatial domain. Consequently, only data cubes with a dimensionality equal or lager than 3 is considered as interoperation input. A 2D single-band spatial imagery or gridded data are treated as a special 3D spatial-variable data cube in this study, where the band is arranged as a coordinate on the variable axis.
A data cube can be mapped to the proposed adaptive 3D data cube if there exists a mapping function between the corresponding multi-dimensional space domain and 3D adaptive space domain. The mapping process can be expressed as
where
where
To illustrate the above serialization formula, a 5D data cube, with domain
A case study of transformation from 5D data cube to 3D data cube.
3.2.2 Cross-dimensionality combination
Two data cubes of dimensionality equal to or lager than 3 can be interoperated as long as they share the same spatial domain. The transformation allows for combining data cubes across dimensionalities.
Let
Then,
where
then
In this way, more data cubes can be concatenated. The methodology transcends the limitations of static data cube manipulation by introducing a dynamic framework that enables cross-dimensional interoperability among data cubes of equal or greater than 3D, provided they share the same spatial domain. This framework is designed to be inherently flexible, allowing for the continuous integration of data cubes as they are generated or updated. The dynamic transformation process leverages advanced algorithms that properly align and serialize the variables within each data cube, regardless of their dimensionality.
3.2.3 Standard-based adaption
The transformation allows us to set up a 3D spatial-variable data cube, which permits arbitrary combinations of trim or slice operations on the data cube using standardized operations, e.g. the operations defined in OGC WCS 2.0 [18], as long as the constructed data cube follows the corresponding coverage standards [21]. Retrieval functions of 3D spatial-variable data cube based on OGC WCS 2.0 is provided in Table 1.
Retrieval functions of 3D spatial-variable data cube based on OGC WCS 2.0
| Operation | Function | Sample WCS 2.0 request |
|---|---|---|
| Trim | Let,
|
http://{service entry}? |
| &service=WCS | ||
| &version=2.0 | ||
| &request=GetCoverage | ||
|
|
&coverageId=datacubeId | |
| &subset=x(lo, hi) | ||
| &subset=y(lo, hi) | ||
| &subset=order(lo, hi) | ||
| Slice | Let
|
http://{service entry}? |
| &service=WCS | ||
| &version=2.0 | ||
| &request=GetCoverage | ||
|
|
||
| &coverageId=datacubeId | ||
| &subset=x
|
||
| &subset=y
|
||
| &subset=order
|
4 Case study
4.1 Scenario
Species distribution modeling predicts the potential distribution of species using environmental variables. It plays a crucial role in understanding the current potential distribution of species and predicting how it might change in response to different climate change scenarios in the future [22–24]. Species distribution modeling is frequently utilized in conservation planning, invasive species management, and identifying areas that are vital for preserving biodiversity, which is particularly important for marine species due to their remoteness [25,26]. The environmental datasets used in modeling frequently originate from diverse sources with varying dimension, such as SRTM 15+V2 (the gridded seabed bathymetry) and Bio-ORACLE V 2.1 (the environmental dataset of bottom layer and surface layer for benthic species distribution modeling). This study demonstrates how a 3D adaptive data cube can be used to organize and manage cross-dimensional cubes to support variable retrieval and online analytics for species distribution modeling, using modeling of benthic species cold-water coral Desmophyllum pertusum as a case study. To demonstrate the approach, this research employs three datasets of various dimensions, including relevant variables, such as depth, temperature, and water chemistry factors, sourced from published papers and public databases, detailed in Table 2.
Environmental variables used in the case study. Salinity, temperature, and current velocity of Bio-ORACLE v2.1 are variables of three time periods, including present, 2040–2050, and 2090–2100, under the Representative Concentration Pathway 4.5 (RCP4.5) scenario
| Environment variables of bottom layer | Dataset | Resolution | |
|---|---|---|---|
| SRTM 15+ v2 | SRTM 15+ v2 [27] | 15″ × 15″ | |
| Aragonite saturation states, calcite saturation states, chlorophyll a, dissolved oxygen, silicate, particulate organic carbon | Davies & Guinotte (2011) [28] | 30″ × 30″ | |
| Salinity, temperature, current velocity | Bio-ORACLE v2.1 [29,30] | 5′ × 5′ |
SRTM 15+ v2, Davies & Guinotte (2011) dataset, and Bio-ORACLE v2.1 dataset were used to construct a 2D space data cube, a 3D variable data cube, and a 4D space-variable-time data cube, respectively, with a resolution of 500 m, data type Float 32, and coordinate system EPSG 6933, using Geospatial Data Abstraction Library (GDAL) and netCDF Operator (NCO), as shown in Figure 3. Specifically, the 2D data cube represents a spatial data cube in (latitude, longitude) coordinates, the 3D data cube is a space-variable data cube in (X, Y, V) coordinates, and the 4D data cube is a space-variable-time data cube in (X, Y, V, time) coordinates. Within the context of Bio-ORACLE v2.1, the variables include salinity, temperature, and current velocity, each of which are associated with three different time periods: the present, 2040–2050, and 2090–2100, all under the RCP4.5 scenario. Then, these data cubes were transformed into the 3D adaptive data cube by employing the serialization algorithm and the tools GDAL and NCO, as depicted in Figure 4. Finally, the result is imported to Rasdaman, a OGC WCS 2.0 reference implementation, as a OGC Coverage Implementation Schema (CIS) as an online 3D variable cube [31].

(a–c) 2D–4D data cube sketches.

Transformation of 2D–4D data cubes into 3D adaptive data cube.
4.2 Standard-based solution
The 3D adaptive data cube is implemented as a standardized coverage, leveraging mainstream geospatial information sharing and interoperability standards, concretely, ISO TC211 and OGC coverage related standards. The data cube structure is implemented based on ISO 19123-2:2018 [32], also known as OGC CIS 1.0, which is designed to provide a consistent structure for encoding and sharing geospatial data in various formats, including potential support for spatial and variable domains [14]. The corresponding metadata for the data cube is described in Numerical Thematic Data following ISO 19163-2:2020 [21], which is an implementation schema based on content models for imagery and gridded data [33]. These metadata are embedded in CIS using a modular approach [18], as illustrated in Figure 5, to construct a interoperable coverage. This coverage is then published through OGC WCS 2.0 to support standardized sharing applications, as demonstrated in Figure 6. OGC WCS 2.0 offers three key operations, specifically, GetCapabilities, DescribeCoverage, and GetCoverage, which return service description, coverage data description, and coverage itself, respectively. Furthermore, the integration of WCS-T [34], an extension of the OGC WCS 2.0 standard, into this experiment via Rasdaman, facilitates transactions on the data cube. This enables support for updates, insertions, and deletions of geospatial data, enhancing the flexibility and dynamicity of data management within the system. QGIS supports the OGC WCS 2.0 through its QgsWcsClient2 [35] plugin, which allows users to send WCS2.0 queries to OGC WCS 2.0 server, Rasdaman and loading the returned results in QGIS.

Interoperate ISO 19163-2:2020 metadata together with ISO 19123-2:2018 (taking numerical thematic data as an example).

Request and response of the 3D adaptive data cube by OGC WCS 2.0.
The implemented 3D adaptive data cube in OGC WCS 2.0 was tested using OGC Team Engine [16], and ISO 19163-2:2020 metadata validation in XML schema. In this way, the approach ensures that the 3D adaptive data cube can be shared and used by different software applications and systems that support the main stream geospatial standards.
4.3 Demonstration
Based on the 3D adaptive data cube constructed in this study, Rasdaman [36] is used to provide prototype service for the cube testing, supporting access, and retrieval of data along spatial and variable dimensions. For instance, the environmental variable calcite saturation states can be obtained by selecting the corresponding coordinates on the variable dimension using GetCoverage, returning the calcite saturation states grid data from the 3D adaptive data cube.
In this way, 16 variables in present time in the 3D adaptive data cube, including SRTM 15+ v2, eleven variables from Davies & Guinotte (2011) dataset, and four variables from Bio-ORACLE v2.1 were retrieved through multiple GetCoverage operations, Figure 7. The images were retrieved by QGIS.

Retrieval of environmental variables from the constructed 3D adaptive data cube using GetCoverage operations of WCS 2.0.
Correlation of the 16 variables were investigated using VIF. Eleven environmental variables with a VIF < 10 [37,38], including regional current velocity, vertical current velocity, aspect, bathymetric position index 9, slope, plane curvature, profile curvature, particulate organic carbon, salinity, chlorophyll a, and dissolved oxygen, were retrieved for further predictive modeling, Figure 8.

A case study – variables retrieved for the predictive modeling.
Then, we used the often used species distribution prediction method Random Forest (RF) of Biomod2 package, to construct the predictive model, as shown in Figure 9. NOAA (NOAA Deep Sea Coral Data Portal) [39], ICES (ICES Vulnerable Marine Ecosystems data portal) [40], and OBIS (Ocean Biogeographic Information System) [41] are all public datasets, from which we obtain geographic presence record data of cold-water corals. The same number of remaining records to the presence are randomly selected as background points. Then, the 11 retrieved target environmental variables, species presence, and background points were used to predict the potential distribution of scleractinian cold-water coral Desmophyllum pertusum in the Bay of Biscay. The statistical method area under the receiver operating characteristic curve (AUC) was calculated to evaluate the model performance, with a value range of [0, 1], and a larger value indicates a better prediction performance, Figure 10, the image is made using QGIS. The model evaluation showed that the model performed well with AUC 0.987.

A case study – cold-water coral distribution prediction using raster data from 3D adaptive data cube combined with coral occurrence records.

Predicted habitat suitability for reef-forming scleractinian cold-water coral Desmophyllum pertusum in the Bay of Biscay.
5 Results
This research provides an elaborated account of the results obtained from the implementation and testing of the 3D adaptive data cube model. The primary objective of our study was to achieve interoperability among EO data cubes with varying dimensionalities, adhering to common geospatial standards. Our approach involves the use of a 3D adaptive data cube model that facilitates cross-dimensional mapping and integration of data from different sources and formats.
To demonstrate the practical application of our model, we conducted a case study focusing on species distribution prediction, specifically the cold-water coral Desmophyllum pertusum. This case study allowed us to test the model's ability to integrate and analyze data from various dimensions, including spatial, variable, and temporal axes.
5.1 Data integration and serialization
This research successfully integrated data from three different datasets, each with varying dimensions, into our 3D adaptive data cube. The datasets included:
SRTM 15+ v2: A 2D spatial dataset providing seabed bathymetry information.
Davies & Guinotte (2011): A 3D dataset offering variables such as aragonite saturation states, calcite saturation states, and chlorophyll a.
Bio-ORACLE v2.1: A 4D dataset with variables like salinity, temperature, and current velocity for different time periods.
Using our serialization algorithm, these datasets were transformed into a unified 3D adaptive data cube, enabling seamless data retrieval and analysis across different dimensions.
5.2 Cross-dimensional interoperability
The results confirmed that our model can achieve cross-dimensional interoperability among EO data cubes, provided they share the same spatial CRS, resolution, and data type. This finding is crucial as it demonstrates the potential for integrating diverse EO data sources into a single, coherent framework.
5.3 Standard-based implementation
The proposed 3D adaptive data cube was implemented as a standardized coverage, leveraging ISO 19123-2:2018, also known as OGC CIS 1.0. This ensures compatibility with mainstream geospatial information sharing and interoperability standards. The metadata for the data cube was described using ISO 19163-2:2020, embedded within CIS, to construct an interoperable coverage. This demonstration relies on Rasdaman to demonstrate the cross-dimensional interoperability. The interoperability achieved is based on relevant OGC and ISO TC211 standards, which can be implemented by systems that successfully complete the corresponding standard-based conformance testing [16].
5.4 Case study outcomes
The case study on cold-water coral distribution prediction yielded promising results. By integrating environmental variables from our 3D adaptive data cube with species presence records, this research was able to predict the potential distribution of Desmophyllum pertusum in the Bay of Biscay. The model’s performance was evaluated using the AUC, with a value of 0.987, indicating excellent predictive accuracy.
5.5 Finding validation
To further validate our findings, this research conducted a statistical analysis of the variables used in the case study. The VIF was used to assess the multicollinearity among the variables. Variables with a VIF less than 10 were selected for the predictive model, ensuring that the model’s predictions were not overly influenced by any single variable.
6 Discussion and conclusion
This research introduced a 3D adaptive data cube model designed to enhance the interoperability of EO data cubes with varying dimensionalities. The model was developed with the aim of aligning with mainstream geospatial standards, thereby facilitating seamless data interaction and analysis across different platforms.
The primary contribution of this research is the development and validation of a 3D adaptive data cube model that enables cross-dimensional interoperability among EO data cubes. First, the model successfully integrates data from diverse sources into a unified framework, allowing for comprehensive data analysis and retrieval across different dimensions. Second, the variable serialization method proposed in this study effectively orders and manages variables across data cubes, ensuring data alignment and consistency. Third, the case study on species distribution prediction demonstrated the practical applicability of our model in environmental data analysis, contributing to a high predictive accuracy for the potential distribution of the cold-water coral Desmophyllum pertusum. Fourth, the model aligns with geospatial standards such as ISO 19123-2:2018, also known as OGC CIS 1.0, ensuring compatibility with mainstream geospatial information sharing and interoperability standards.
While the proposed methodology for achieving cross-dimensional interoperability among EO data cubes is generalizable and can be applied to various scenarios where data integration across different dimensions is required, the development and implementation of our 3D adaptive data cube model may also be influenced by several factors, including data quality, data sharing policies, technological advancements, and computational resources. Furthermore, this study focuses on EO data and the static nature of the case study data, with untested scalability for various fields, including environmental monitoring, urban planning, and agriculture.
Despite demonstrating the potential of the 3D adaptive data cube model, there are several areas that warrant further investigation, such as expanding data sources, real-time data processing, scalability and performance assessment, and the incorporation of advanced analytics.
In conclusion, this study presents a significant step forward in addressing the interoperability challenge among multidimensional EO data cubes. The 3D adaptive data cube model, with its adherence to geospatial standards and dynamic framework, offers a robust solution for integrating and analyzing complex EO data. We envision that this research will inspire further developments in data cube modeling and contribute to the broader field of geospatial data analysis and applications.
Acknowledgement
This work is supported by the National Key R&D Program of China (No. 2019YFE0127100) and National Natural Science Foundation of China (No. 42006140).
-
Funding information: This work is supported by the National Key R&D Program of China (No. 2019YFE0127100) and National Natural Science Foundation of China (No. 42006140).
-
Author contributions: Conception and design: J.Y. and P.B.; analysis and interpretation of the data: Z.C., D.W., R.T., and Y.L.; drafting of the article, revising it critically for intellectual content: J.Y. and Z.C.; and the final approval of the version to be published: J.Y. and P.B. All authors agreed to be accountable for all aspects of the work.
-
Conflict of interest: The authors have no conflicts of or competing interests to declare that are relevant to the content of this article.
-
Data availability statement: The data associated with this study are listed in Table 2, which come from existing publication. The data will be provided on request.
References
[1] Baumann P. Standardizing big earth datacubes. 2017 IEEE International Conference on Big Data (Big Data), Boston, MA, USA; 2017. 10.1109/BigData.2017.8257912.Search in Google Scholar
[2] Baumann P, Misev D, Merticariu V, Huu BP. Datacubes: Towards space/time analysis-ready data. In: Döllner J, Jobst M, Schmitz P, editors. Service-oriented mapping: Changing paradigm in map production and geoinformation management. Cham: Springer International Publishing; 2019. p. 269–99. 10.1007/978-3-319-72434-8_14.Search in Google Scholar
[3] Catavei A, Faur D, Datcu M, Baumann P. Insight earth observation data cubes: AI driven information visualisation. Proc. IEEE Geoscience and Remote Sensing Society (IGARSS). Pasadena, USA: 2023.Search in Google Scholar
[4] Baumann P, Mazzetti P, Ungar J, Barbera R, Barboni D, Beccati A, et al. Big data analytics for earth sciences: The earthserver approach. Int J Digit Earth. 2016;9(1):3–29. 10.1080/17538947.2014.1003106.Search in Google Scholar
[5] Killough B. Overview of the open data cube initiative. IGARSS 2018 – 2018 IEEE International Geoscience and Remote Sensing Symposium, Valencia, Spain; 2018. 10.1109/IGARSS.2018.8517694.Search in Google Scholar
[6] Gorelick N, Hancher M, Dixon M, Ilyushchenko S, Thau D, Moore R. Google earth engine: Planetary-scale geospatial analysis for everyone. Remote Sens Env. 2017;202:18–27. 10.1016/j.rse.2017.06.031.Search in Google Scholar
[7] Euro Data Cube Consortium Euro Data Cube, 2023. https://eurodatacube.com.Search in Google Scholar
[8] Giuliani G, Chatenoux B, De Bono A, Rodila D, Richard J, Allenbach K, et al. Building an earth observations data cube: Lessons learned from the Swiss Data Cube (SDC) on generating Analysis Ready Data (ARD). Big Earth Data. 2017;1(1–2):100–17. 10.1080/20964471.2017.1398903.Search in Google Scholar
[9] Ferreira K, Queiroz G, Vinhas L, Marujo R, Simoes R, Picoli M, et al. Earth observation data cubes for Brazil: Requirements, methodology and products. Remote Sens-Basel. 2020;12(24):4033. 10.3390/rs12244033.Search in Google Scholar
[10] Giuliani G, Masó J, Mazzetti P, Nativi S, Zabala A. Paving the way to increased interoperability of earth observations data cubes. Data. 2019;4(3):113. 10.3390/data4030113.Search in Google Scholar
[11] Câmara G, Assis L, Ribeiro G, Ferreira K, Llapa E, Vinhas L. Big earth observation data analytics: Matching requirements to system architectures. 5th ACM SIGSPATIAL International Workshop on Analytics for Big Geospatial, San Francisco, CA, USA; 2016. 10.1145/3006386.3006393.Search in Google Scholar
[12] Soille P, Burger A, Hasenohr P, Kempeneers P, Rodriguez Aseretto D, Syrris V, et al. The JRC earth observation data and processing platform. Proceeding of the 2017 conference on Big Data from Space (BiDS 17), Toulouse, France; 2017. 10.2760/383579.Search in Google Scholar
[13] Milcinski G, Bojanowski J, Clarijs D, de la Mar J. Copernicus data space ecosystem – Platform that enables federated earth observation services and applications. 2024 IEEE International Geoscience and Remote Sensing Symposium, Athens, Greece; 2024. 10.5194/egusphere-egu24-4942.Search in Google Scholar
[14] Yu J, Mi P, Wei D, Cui Z, Tong R, Fan Y. Thematic tile set organization and updating based on global subdivision grid model. J Imaging Sci Technol. 2024;68(5):1–11. 10.2352/J.ImagingSci.Technol.2024.68.5.050402.Search in Google Scholar
[15] Yang Y, Yu J, Tong R. Research on domain variable identification among different data cubes. 2021 28th International Conference on Geoinformatics, Nanchang, China; 2021. 10.1109/IEEECONF54055.2021.9687644.Search in Google Scholar
[16] Compliance test engine interoperability program report, 2007. https://www.ogc.org/standards/discussion-papers/.Search in Google Scholar
[17] INSPIRE test framework – Design report, 2016. https://joinup.ec.europa.eu/collection/are3na/document/are3na-inspire-test-framework-design-report.Search in Google Scholar
[18] OGC WCS 2.0 Interface standard – Core, version 2.0.1, 2012. https://www.ogc.org/standard/wcs/.Search in Google Scholar
[19] Purss M, Peterson P, Strobl P, Dow C, Sabeur Z, Gibb R, et al. Datacubes: A discrete global grid systems perspective. Cartogr: Int J Geogr Inf Geovisualization. 2019;54(1):63–71. 10.3138/cart.54.1.2018-0017.Search in Google Scholar
[20] Misev D, Rusu M, Baumann P. A semantic resolver for coordinate reference systems. International Symposium on Web and Wireless Geographical Information Systems, Berlin, Heidelberg; 2012. 10.1007/978-3-642-29247-7_5.Search in Google Scholar
[21] ISO/TS 19163-2:2020 Geographic information — Content components and encoding rules for imagery and gridded data — Part 2: Implementation schema, 2020. https://www.iso.org/standard/74930.html.Search in Google Scholar
[22] Khosravifard S, Skidmore A, Toxopeus B, Niamir A. Potential invasion range of raccoon in Iran under climate change. EUR J Wildl Res. 2020;66(6):110. 10.1007/s10344-020-01438-2.Search in Google Scholar
[23] Morato T, González-Irusta J, Dominguez-Carrió C, Wei C, Davies A, Sweetman A, et al. Climate-induced changes in the suitable habitat of cold-water corals and commercially important deep-sea fishes in the North Atlantic. Glob Change Biol. 2020;26(4):2181–202. 10.1111/gcb.14996 Search in Google Scholar PubMed PubMed Central
[24] Lee C, Lee D, Kwon T, Athar M, Park Y. Predicting the global distribution of Solenopsis geminata (Hymenoptera: Formicidae) under climate change using the MaxEnt model. Insects. 2021;12(3):229. 10.3390/insects12030229.Search in Google Scholar PubMed PubMed Central
[25] Barbosa RV, Davies AJ, Sumida PYG. Habitat suitability and environmental niche comparison of cold-water coral species along the Brazilian continental margin. Deep Sea Res Part I: Oceanogr Res Pap. 2020;155:103–47. 10.1016/j.dsr.2019.103147.Search in Google Scholar
[26] Sundahl H, Buhl-Mortensen P, Buhl-Mortensen L. Distribution and suitable habitat of the cold-water corals Lophelia pertusa, Paragorgia arborea, and Primnoa resedaeformis on the Norwegian Continental Shelf. Front Mar Sci. 2020;7:213. 10.3389/fmars.2020.00213.Search in Google Scholar
[27] Shuttle Radar Topography Mission (SRTM), 2023 https://www.earthdata.nasa.gov/sensors/srtm.Search in Google Scholar
[28] Davies A, Guinotte J. Global habitat suitability for framework-forming cold-water corals. PLoS One. 2011;6(4):e18483. 10.1371/journal.pone.0018483.Search in Google Scholar PubMed PubMed Central
[29] Tyberghein L, Verbruggen H, Pauly K, Troupin C, Mineur F, De Clerck O. Bio-ORACLE: A global environmental dataset for marine species distribution modelling. Glob Ecol Biogeogr. 2012;21(2):272–81. 10.1111/j.1466-8238.2011.00656.x.Search in Google Scholar
[30] Assis J, Tyberghein L, Bosch S, Verbruggen H, Serrão EA, De Clerck O. Bio-ORACLE v2.0: Extending marine data layers for bioclimatic modelling. Glob Ecol Biogeogr. 2018;27(3):277–84. 10.1111/geb.12693.Search in Google Scholar
[31] Georgian S, Anderson O, Rowden A. Ensemble habitat suitability modeling of vulnerable marine ecosystem indicator taxa to inform deep-sea fisheries management in the South Pacific Ocean. Fish Res. 2019;211:256–74. 10.1016/j.fishres.2018.11.020.Search in Google Scholar
[32] ISO 19123-2:2018 Geographic information — Schema for coverage geometry and functions — Part 2: Coverage implementation schema, 2018. https://www.iso.org/standard/70948.html.Search in Google Scholar
[33] ISO/TS 19163-1:2016 Geographic information — Content components and encoding rules for imagery and gridded data — Part 1: Content model, 2016. https://www.iso.org/standard/32581.html.Search in Google Scholar
[34] OGC 13-057r1 OGC Web Coverage Service Interface Standard – Transaction Extension, 2016. https://docs.ogc.org/is/13-057r1/13-057r1.html.Search in Google Scholar
[35] QgsWcsClient2, 2023. https://plugins.qgis.org/plugins/QgsWcsClient2/.Search in Google Scholar
[36] Baumann P, Misev D, Merticariu V, Huu BP, Bell B. Rasdaman: Spatio-temporal datacubes on steroids. Proceedings of the 26th ACM SIGSPATIAL International Conference on Advances in Geographic Information, Seattle, Washington; 2018. 10.1145/3274895.3274988.Search in Google Scholar
[37] Yesson C, Bedford F, Rogers A, Taylor M. The global distribution of deep-water Antipatharia habitat. Deep Sea Res Part II: Topical Stud Oceanogr. 2017;145:79–86. 10.1016/j.dsr2.2015.12.004.Search in Google Scholar
[38] Yesson C, Bush LE, Davies AJ, Maggs CA, Brodie J. The distribution and environmental requirements of large brown seaweeds in the British Isles. J Mar Biol Assoc UK. 2015;95:669–80. 10.1017/S0025315414001453.Search in Google Scholar
[39] NOAA Deep-Sea Coral & Sponge Map Portal, 2023. https://www.ncei.noaa.gov/maps/deep-sea-corals/mapSites.htm.Search in Google Scholar
[40] ICES Vulnerable Marine Ecosystems data portal, 2023. https://www.ices.dk/data/data-portals/Pages/vulnerable-marine-ecosystems.aspx.Search in Google Scholar
[41] Ocean Biogeographic Information System, 2023. https://obis.org/taxon/1245747.Search in Google Scholar
© 2025 the author(s), published by De Gruyter
This work is licensed under the Creative Commons Attribution 4.0 International License.
Articles in the same Issue
- Research Articles
- Seismic response and damage model analysis of rocky slopes with weak interlayers
- Multi-scenario simulation and eco-environmental effect analysis of “Production–Living–Ecological space” based on PLUS model: A case study of Anyang City
- Remote sensing estimation of chlorophyll content in rape leaves in Weibei dryland region of China
- GIS-based frequency ratio and Shannon entropy modeling for landslide susceptibility mapping: A case study in Kundah Taluk, Nilgiris District, India
- Natural gas origin and accumulation of the Changxing–Feixianguan Formation in the Puguang area, China
- Spatial variations of shear-wave velocity anomaly derived from Love wave ambient noise seismic tomography along Lembang Fault (West Java, Indonesia)
- Evaluation of cumulative rainfall and rainfall event–duration threshold based on triggering and non-triggering rainfalls: Northern Thailand case
- Pixel and region-oriented classification of Sentinel-2 imagery to assess LULC dynamics and their climate impact in Nowshera, Pakistan
- The use of radar-optical remote sensing data and geographic information system–analytical hierarchy process–multicriteria decision analysis techniques for revealing groundwater recharge prospective zones in arid-semi arid lands
- Effect of pore throats on the reservoir quality of tight sandstone: A case study of the Yanchang Formation in the Zhidan area, Ordos Basin
- Hydroelectric simulation of the phreatic water response of mining cracked soil based on microbial solidification
- Spatial-temporal evolution of habitat quality in tropical monsoon climate region based on “pattern–process–quality” – a case study of Cambodia
- Early Permian to Middle Triassic Formation petroleum potentials of Sydney Basin, Australia: A geochemical analysis
- Micro-mechanism analysis of Zhongchuan loess liquefaction disaster induced by Jishishan M6.2 earthquake in 2023
- Prediction method of S-wave velocities in tight sandstone reservoirs – a case study of CO2 geological storage area in Ordos Basin
- Ecological restoration in valley area of semiarid region damaged by shallow buried coal seam mining
- Hydrocarbon-generating characteristics of Xujiahe coal-bearing source rocks in the continuous sedimentary environment of the Southwest Sichuan
- Hazard analysis of future surface displacements on active faults based on the recurrence interval of strong earthquakes
- Structural characterization of the Zalm district, West Saudi Arabia, using aeromagnetic data: An approach for gold mineral exploration
- Research on the variation in the Shields curve of silt initiation
- Reuse of agricultural drainage water and wastewater for crop irrigation in southeastern Algeria
- Assessing the effectiveness of utilizing low-cost inertial measurement unit sensors for producing as-built plans
- Analysis of the formation process of a natural fertilizer in the loess area
- Machine learning methods for landslide mapping studies: A comparative study of SVM and RF algorithms in the Oued Aoulai watershed (Morocco)
- Chemical dissolution and the source of salt efflorescence in weathering of sandstone cultural relics
- Molecular simulation of methane adsorption capacity in transitional shale – a case study of Longtan Formation shale in Southern Sichuan Basin, SW China
- Evolution characteristics of extreme maximum temperature events in Central China and adaptation strategies under different future warming scenarios
- Estimating Bowen ratio in local environment based on satellite imagery
- 3D fusion modeling of multi-scale geological structures based on subdivision-NURBS surfaces and stratigraphic sequence formalization
- Comparative analysis of machine learning algorithms in Google Earth Engine for urban land use dynamics in rapidly urbanizing South Asian cities
- Study on the mechanism of plant root influence on soil properties in expansive soil areas
- Simulation of seismic hazard parameters and earthquakes source mechanisms along the Red Sea rift, western Saudi Arabia
- Tectonics vs sedimentation in foredeep basins: A tale from the Oligo-Miocene Monte Falterona Formation (Northern Apennines, Italy)
- Investigation of landslide areas in Tokat-Almus road between Bakımlı-Almus by the PS-InSAR method (Türkiye)
- Predicting coastal variations in non-storm conditions with machine learning
- Cross-dimensional adaptivity research on a 3D earth observation data cube model
- Geochronology and geochemistry of late Paleozoic volcanic rocks in eastern Inner Mongolia and their geological significance
- Spatial and temporal evolution of land use and habitat quality in arid regions – a case of Northwest China
- Ground-penetrating radar imaging of subsurface karst features controlling water leakage across Wadi Namar dam, south Riyadh, Saudi Arabia
- Rayleigh wave dispersion inversion via modified sine cosine algorithm: Application to Hangzhou, China passive surface wave data
- Fractal insights into permeability control by pore structure in tight sandstone reservoirs, Heshui area, Ordos Basin
- Debris flow hazard characteristic and mitigation in Yusitong Gully, Hengduan Mountainous Region
- Research on community characteristics of vegetation restoration in hilly power engineering based on multi temporal remote sensing technology
- Identification of radial drainage networks based on topographic and geometric features
- Trace elements and melt inclusion in zircon within the Qunji porphyry Cu deposit: Application to the metallogenic potential of the reduced magma-hydrothermal system
- Pore, fracture characteristics and diagenetic evolution of medium-maturity marine shales from the Silurian Longmaxi Formation, NE Sichuan Basin, China
- Study of the earthquakes source parameters, site response, and path attenuation using P and S-waves spectral inversion, Aswan region, south Egypt
- Source of contamination and assessment of potential health risks of potentially toxic metal(loid)s in agricultural soil from Al Lith, Saudi Arabia
- Regional spatiotemporal evolution and influencing factors of rural construction areas in the Nanxi River Basin via GIS
- An efficient network for object detection in scale-imbalanced remote sensing images
- Effect of microscopic pore–throat structure heterogeneity on waterflooding seepage characteristics of tight sandstone reservoirs
- Environmental health risk assessment of Zn, Cd, Pb, Fe, and Co in coastal sediments of the southeastern Gulf of Aqaba
- A modified Hoek–Brown model considering softening effects and its applications
- Evaluation of engineering properties of soil for sustainable urban development
- The spatio-temporal characteristics and influencing factors of sustainable development in China’s provincial areas
- Application of a mixed additive and multiplicative random error model to generate DTM products from LiDAR data
- Gold vein mineralogy and oxygen isotopes of Wadi Abu Khusheiba, Jordan
- Prediction of surface deformation time series in closed mines based on LSTM and optimization algorithms
- 2D–3D Geological features collaborative identification of surrounding rock structural planes in hydraulic adit based on OC-AINet
- Spatiotemporal patterns and drivers of Chl-a in Chinese lakes between 1986 and 2023
- Land use classification through fusion of remote sensing images and multi-source data
- Nexus between renewable energy, technological innovation, and carbon dioxide emissions in Saudi Arabia
- Analysis of the spillover effects of green organic transformation on sustainable development in ethnic regions’ agriculture and animal husbandry
- Factors impacting spatial distribution of black and odorous water bodies in Hebei
- Large-scale shaking table tests on the liquefaction and deformation responses of an ultra-deep overburden
- Impacts of climate change and sea-level rise on the coastal geological environment of Quang Nam province, Vietnam
- Reservoir characterization and exploration potential of shale reservoir near denudation area: A case study of Ordovician–Silurian marine shale, China
- Seismic prediction of Permian volcanic rock reservoirs in Southwest Sichuan Basin
- Application of CBERS-04 IRS data to land surface temperature inversion: A case study based on Minqin arid area
- Geological characteristics and prospecting direction of Sanjiaoding gold mine in Saishiteng area
- Research on the deformation prediction model of surrounding rock based on SSA-VMD-GRU
- Geochronology, geochemical characteristics, and tectonic significance of the granites, Menghewula, Southern Great Xing’an range
- Hazard classification of active faults in Yunnan base on probabilistic seismic hazard assessment
- Characteristics analysis of hydrate reservoirs with different geological structures developed by vertical well depressurization
- Estimating the travel distance of channelized rock avalanches using genetic programming method
- Landscape preferences of hikers in Three Parallel Rivers Region and its adjacent regions by content analysis of user-generated photography
- New age constraints of the LGM onset in the Bohemian Forest – Central Europe
- Characteristics of geological evolution based on the multifractal singularity theory: A case study of Heyu granite and Mesozoic tectonics
- Soil water content and longitudinal microbiota distribution in disturbed areas of tower foundations of power transmission and transformation projects
- Oil accumulation process of the Kongdian reservoir in the deep subsag zone of the Cangdong Sag, Bohai Bay Basin, China
- Investigation of velocity profile in rock–ice avalanche by particle image velocimetry measurement
- Optimizing 3D seismic survey geometries using ray tracing and illumination modeling: A case study from Penobscot field
- Sedimentology of the Phra That and Pha Daeng Formations: A preliminary evaluation of geological CO2 storage potential in the Lampang Basin, Thailand
- Improved classification algorithm for hyperspectral remote sensing images based on the hybrid spectral network model
- Map analysis of soil erodibility rates and gully erosion sites in Anambra State, South Eastern Nigeria
- Identification and driving mechanism of land use conflict in China’s South-North transition zone: A case study of Huaihe River Basin
- Evaluation of the impact of land-use change on earthquake risk distribution in different periods: An empirical analysis from Sichuan Province
- A test site case study on the long-term behavior of geotextile tubes
- An experimental investigation into carbon dioxide flooding and rock dissolution in low-permeability reservoirs of the South China Sea
- Detection and semi-quantitative analysis of naphthenic acids in coal and gangue from mining areas in China
- Comparative effects of olivine and sand on KOH-treated clayey soil
- YOLO-MC: An algorithm for early forest fire recognition based on drone image
- Earthquake building damage classification based on full suite of Sentinel-1 features
- Potential landslide detection and influencing factors analysis in the upper Yellow River based on SBAS-InSAR technology
- Assessing green area changes in Najran City, Saudi Arabia (2013–2022) using hybrid deep learning techniques
- An advanced approach integrating methods to estimate hydraulic conductivity of different soil types supported by a machine learning model
- Hybrid methods for land use and land cover classification using remote sensing and combined spectral feature extraction: A case study of Najran City, KSA
- Streamlining digital elevation model construction from historical aerial photographs: The impact of reference elevation data on spatial accuracy
- Analysis of urban expansion patterns in the Yangtze River Delta based on the fusion impervious surfaces dataset
- A metaverse-based visual analysis approach for 3D reservoir models
- Late Quaternary record of 100 ka depositional cycles on the Larache shelf (NW Morocco)
- Integrated well-seismic analysis of sedimentary facies distribution: A case study from the Mesoproterozoic, Ordos Basin, China
- Study on the spatial equilibrium of cultural and tourism resources in Macao, China
- Urban road surface condition detecting and integrating based on the mobile sensing framework with multi-modal sensors
- Application of improved sine cosine algorithm with chaotic mapping and novel updating methods for joint inversion of resistivity and surface wave data
- The synergistic use of AHP and GIS to assess factors driving forest fire potential in a peat swamp forest in Thailand
- Dynamic response analysis and comprehensive evaluation of cement-improved aeolian sand roadbed
- Rock control on evolution of Khorat Cuesta, Khorat UNESCO Geopark, Northeastern Thailand
- Gradient response mechanism of carbon storage: Spatiotemporal analysis of economic-ecological dimensions based on hybrid machine learning
- Comparison of several seismic active earth pressure calculation methods for retaining structures
- Mantle dynamics and petrogenesis of Gomer basalts in the Northwestern Ethiopia: A geochemical perspective
- Study on ground deformation monitoring in Xiong’an New Area from 2021 to 2023 based on DS-InSAR
- Paleoenvironmental characteristics of continental shale and its significance to organic matter enrichment: Taking the fifth member of Xujiahe Formation in Tianfu area of Sichuan Basin as an example
- Equipping the integral approach with generalized least squares to reconstruct relict channel profile and its usage in the Shanxi Rift, northern China
- InSAR-driven landslide hazard assessment along highways in hilly regions: A case-based validation approach
- Attribution analysis of multi-temporal scale surface streamflow changes in the Ganjiang River based on a multi-temporal Budyko framework
- Maps analysis of Najran City, Saudi Arabia to enhance agricultural development using hybrid system of ANN and multi-CNN models
- Hybrid deep learning with a random forest system for sustainable agricultural land cover classification using DEM in Najran, Saudi Arabia
- Long-term evolution patterns of groundwater depth and lagged response to precipitation in a complex aquifer system: Insights from Huaibei Region, China
- Remote sensing and machine learning for lithology and mineral detection in NW, Pakistan
- Spatial–temporal variations of NO2 pollution in Shandong Province based on Sentinel-5P satellite data and influencing factors
- Numerical modeling of geothermal energy piles with sensitivity and parameter variation analysis of a case study
- Stability analysis of valley-type upstream tailings dams using a 3D model
- Variation characteristics and attribution analysis of actual evaporation at monthly time scale from 1982 to 2019 in Jialing River Basin, China
- Investigating machine learning and statistical approaches for landslide susceptibility mapping in Minfeng County, Xinjiang
- Investigating spatiotemporal patterns for comprehensive accessibility of service facilities by location-based service data in Nanjing (2016–2022)
- A pre-treatment method for particle size analysis of fine-grained sedimentary rocks, Bohai Bay Basin, China
- Study on the formation mechanism of the hard-shell layer of liquefied silty soil
- Comprehensive analysis of agricultural CEE: Efficiency assessment, mechanism identification, and policy response – A case study of Anhui Province
- Simulation study on the damage and failure mechanism of the surrounding rock in sanded dolomite tunnels
- Towards carbon neutrality: Spatiotemporal evolution and key influences on agricultural ecological efficiency in Northwest China
- High-frequency cycles drive the cyclical enrichment of oil in porous carbonate reservoirs: A case study of the Khasib Formation in E Oilfield, Mesopotamian Basin, Iraq
- Reconstruction of digital core models of granular rocks using mathematical morphology
- Spatial–temporal differentiation law of habitat quality and its driving mechanism in the typical plateau areas of the Loess Plateau in the recent 30 years
- A machine-learning-based approach to predict potential oil sites: Conceptual framework and experimental evaluation
- Effects of landscape pattern change on waterbird diversity in Xianghai Nature Reserve
- Research on intelligent classification method of highway tunnel surrounding rock classification based on parameters while drilling
- River morphology and tectono-sedimentary analysis of a shallow river delta: A case study of Putaohua oil layer in Saertu oilfield (L. Cretaceous), China
- Review Articles
- Humic substances influence on the distribution of dissolved iron in seawater: A review of electrochemical methods and other techniques
- Applications of physics-informed neural networks in geosciences: From basic seismology to comprehensive environmental studies
- Ore-controlling structures of granite-related uranium deposits in South China: A review
- Shallow geological structure features in Balikpapan Bay East Kalimantan Province – Indonesia
- A review on the tectonic affinity of microcontinents and evolution of the Proto-Tethys Ocean in Northeastern Tibet
- Advancements in machine learning applications for mineral prospecting and geophysical inversion: A review
- Special Issue: Natural Resources and Environmental Risks: Towards a Sustainable Future - Part II
- Depopulation in the Visok micro-region: Toward demographic and economic revitalization
- Special Issue: Geospatial and Environmental Dynamics - Part II
- Advancing urban sustainability: Applying GIS technologies to assess SDG indicators – a case study of Podgorica (Montenegro)
- Spatiotemporal and trend analysis of common cancers in men in Central Serbia (1999–2021)
- Minerals for the green agenda, implications, stalemates, and alternatives
- Spatiotemporal water quality analysis of Vrana Lake, Croatia
- Functional transformation of settlements in coal exploitation zones: A case study of the municipality of Stanari in Republic of Srpska (Bosnia and Herzegovina)
- Hypertension in AP Vojvodina (Northern Serbia): A spatio-temporal analysis of patients at the Institute for Cardiovascular Diseases of Vojvodina
- Regional patterns in cause-specific mortality in Montenegro, 1991–2019
- Spatio-temporal analysis of flood events using GIS and remote sensing-based approach in the Ukrina River Basin, Bosnia and Herzegovina
- Flash flood susceptibility mapping using LiDAR-Derived DEM and machine learning algorithms: Ljuboviđa case study, Serbia
- Geocultural heritage as a basis for geotourism development: Banjska Monastery, Zvečan (Serbia)
- Assessment of groundwater potential zones using GIS and AHP techniques – A case study of the zone of influence of Kolubara Mining Basin
- Impact of the agri-geographical transformation of rural settlements on the geospatial dynamics of soil erosion intensity in municipalities of Central Serbia
- Where faith meets geomorphology: The cultural and religious significance of geodiversity explored through geospatial technologies
- Applications of local climate zone classification in European cities: A review of in situ and mobile monitoring methods in urban climate studies
- Complex multivariate water quality impact assessment on Krivaja River
- Ionization hotspots near waterfalls in Eastern Serbia’s Stara Planina Mountain
- Shift in landscape use strategies during the transition from the Bronze age to Iron age in Northwest Serbia
- Assessing the geotourism potential of glacial lakes in Plav, Montenegro: A multi-criteria assessment by using the M-GAM model
- Flash flood potential index at national scale: Susceptibility assessment within catchments
- SWAT modelling and MCDM for spatial valuation in small hydropower planning
- Disaster risk perception and local resilience near the “Duboko” landfill: Challenges of governance, management, trust, and environmental communication in Serbia