Early Permian to Middle Triassic Formation petroleum potentials of Sydney Basin, Australia: A geochemical analysis
-
 ,
,

Abstract
The organic geochemical and petrological analyses of calculated vitrinite reflectance of the Early Permian to Middle Triassic Formation section of the Sydney Basin in Australia have revealed the source for the widely distributed oil and gas shows in the basin. The coal formations of the Permian in the Sydney Basin have a higher hydrogen index with much higher TOC extracts than the non-coal formations of the Permian in the same basin. Some source-specific parameters attained from biomarkers, such as n-alkanes, regular isoprenoids, terpanes, diasteranes, and steranes, show that oil was generated and expelled mainly from organic matter derivatives of higher plants deposited in the oxic environment. The biomarkers associated with maturity, source, and aromatic hydrocarbon are mostly from coal core samples. However, extracts from non-coal samples have an organic geochemical signature, indicative of mixed terrestrial and prokaryotic organic matter deposited in a suboxic environment. Significantly, it is different from the coal extracts. Still, the molecular signature of some of the coal samples shows prokaryotic organic matter present in the extracts, indicating a thin section of possibly a calcareous lithology interbedded within the coal measure formation. Genetically, the coal extracts of the Permian in the Sydney Basin, Australia, provide a new insight into the generation and expulsion of oil from coal, which might be responsible for the widespread oil and gas shows in the basin. This raises the possibility of commercial oil accumulation in the early Permian coals to Middle Triassic sandstones, perhaps in the deeper part of the offshore basin.
1 Introduction
The Sydney Basin has undergone various research activities over the past several years. However, the basin’s ambiguity is mainly in terms of its hydrocarbon potential and, consequently, its prospectivity. The Early Permian to Middle Triassic Formation of the Sydney Basin has not been researched in detail regarding its hydrocarbon prospectivity (Figure 1).

Map of the Sydney Basin showing the study area in yellow surrounded by the basement rocks.
Several petroleum wells and methane borehole drainage have been drilled in the basin’s northern and southern portions, showing many oil and gas shows. However, these shows have yet to be translated into a prospect. Virtually, all the stratigraphic units in the basin have shown oil shows and seeping. Can these shows be taken as potential for petroleum systems in the basin?
Concrete indication of the expulsion of liquid petroleum from coal is scarce. Still, only a handful of lucrative oil discoveries have been reliably linked to coal deposits with such a high degree of confidence [1]. Predominantly regarded as gas-prone are the coals of the Upper Carboniferous era [2], whereas coal deposits that exhibit more significant potential for liquid hydrocarbon formation and expulsion are younger [1,3]. Liu et al. [4] published findings from FTIRS and high-resolution transmission electron microscopy of vitrinite-rich coals of varying ages, which exhibited comparable Rock-Eval hydrogen index (HI) and confirmed the existence of significant quantities of aliphatic chains in the C15–C19 range. The concentrations of aliphatic chains in Permian coals are negligible [5].
In contrast, Paleogene and Neogene coals and lesser quantity Triassic and Cretaceous coals exhibit more significant similar structures [4]. Nonetheless, Australia exhibits substantial exceptions to the general trend of diminishing oil affinity in coals with increasing age. For example, the Cooper–Eromanga Basin comprises a combination of liquid petroleum produced and released from the Permian, alongside its limited oil generation potential. An increased interest in petroleum potential in the Sydney Basin has prompted an exploration program in the offshore area of the Northern Sydney Basin.
Several researchers have focused on numerous aspects of the basin, some concentrating on the southern portion of the basin’s coal measure [1]. In contrast, others have focused on the northern part of the basin coal measure, particularly the Newcastle coal measure; little has been said of the western and central coal measure. However, all these studies need to integrate the findings into a broader perspective on what the basin holds in hydrocarbon potential and the best possible ways to explore it.
The report summarises the geochemical analysis of the Early Permian to Middle Triassic Formation petroleum potentials of the Sydney Basin, mainly relying on aromatic compounds to show the viability of the basin’s formation.
Consequently, this research article addresses issues identified, such as whether oil and gas shows in the basin can be taken as potential candidates for commercial oil exploration and suggests a possible correlation between the basin’s onshore and offshore synthesis.
1.1 Sydney Basin geology
The central longitudinal basinal system, which stretches over 150 km from Bowen in Queensland South through the Gunnedah and Sydney Basin (Figure 2), is a part of the Sydney Basin. A Middle Permian to Triassic foredeep Bowen-Sydney basinal system runs laterally through the entire New England Fold Belt length. According to Scheibner [6], who conducted a thorough review of 11 different tectonic models proposed by recent researchers, the history of the Early Permian is still unknown. The basin was a tensional volcanic rift between the Lachlan and New England Fold Belts [6,7,8]. This rift parallels the meander’s gravity ridge within the Sydney Basin (Figure 2) [6]. Powell and Boreham [8] asserted that the rifting and associated volcanism began in the Late Carboniferous over the earlier fore-arc of an Andean-type magmatic arc as an initially advanced reaction to descending westerly subduction beneath the Lachlan Fold Belt. As a result, subduction and the New England Fold Belt’s convergence were related. The cessation of subduction and its movement towards an area further east coincide with this margin. After the most westerly and south-westerly over-thrusting New England Orogenic terranes, it later controlled the Permian deposition, which resulted in the basin becoming a foredeep depression. The locally common petroleum source rock of the coal-bearing facies of the Late Permian Tomago, Newcastle, and Illawarra coal measures was deposited into a marginal non-marine environment during this foredeep stacking incident (Figure 3). While the Early Permian still primarily featured marine deposition, the Middle to Late Permian experienced a regressive clastic fill as a result of the arc-associated, acid in-between to essential in-between, volcaniclastic sands exuviated from the New England Fold Belt, which was going through episodic uplift at that time.
![Figure 2
Sydney Basin’s stratigraphy (modified from ref. [9]).](/document/doi/10.1515/geo-2022-0750/asset/graphic/j_geo-2022-0750_fig_002.jpg)
Sydney Basin’s stratigraphy (modified from ref. [9]).
![Figure 3
A section showing the geological structure of the Sydney Basin (modified after Branagan and Packham [15]).](/document/doi/10.1515/geo-2022-0750/asset/graphic/j_geo-2022-0750_fig_003.jpg)
A section showing the geological structure of the Sydney Basin (modified after Branagan and Packham [15]).
In contrast, quartz-rich sand deposits expelled from the western Lachlan Fold served as a reminder of the previous periods of structural dormancy and protuberant foreland. The Triassic-dominated fluvial deposition, marine retraction, and onshore regions experienced widespread uplift at the Permian’s end. The Bowen-Sydney portion of Eastern Gondwana’s basinal complex was near the South Pole throughout the Permian. The Early Permian is marked by and subject to glaciation, and Tillie and Varves suggest a significant portion of the Late Permian glacial-related deposition [10]. However, as the Permian period progressed, the climate began to warm [11]. With the earliest preservation, the Middle Triassic sediment from the Sydney Basin dates back to 223 Ma. However, maturity tendencies and burial history studies suggest a sizable accumulation of 2–3 km of Jurassic-aged sediments and Cretaceous material occurred following a pause in the Late Triassic [12,13]. The Sydney Basin’s history during this time is mainly unrecorded, but it is now widely acknowledged after the ongoing sedimentation of the Jurassic to Cretaceous. Between the Early Cretaceous and Middle Cretaceous period (100 Ma), the basin’s condition is stable, possibly with minor erosion. The basin quickly underwent uplift and erosion due to seafloor spreading in the Tasman Sea. The majority of workers were modelling Basin-wide maturation trends.
While the onshore portion of the basin’s boundaries is distinct and uses the structural margins of the Hunter-Mooki Thrust and the Lachlan Fold Belt to the south and west, the basin’s initial easterly (offshore) magnitude is speculative. The continental slope currently lops off the eastern edge of the basin. Due to rifting, the easternmost portions of the basin remained divided throughout the Late Cretaceous, and the seafloor spreading began next to the Tasman Sea Basin. On the Dampier Ridge or perhaps the Lord Howe Rise on the eastern flank of the Tasman Sea Basin, fragments of the highly tectonised core of the Currarong Orogen are currently located. Grab samples from the Middle Permian period contained granitic materials [14]. They validated the continental nature of the Dampier Ridge and its proximity to Permian magmatism [8]. From an exploration perspective, the practical easterly limit of the potential Sydney Basin coincides with the continental slope east of the shelf-break.
1.2 Samples used
Table 1 lists the samples used, which include core and core-coal samples. Figures 1 and 2 show the sampling distribution and the general location of the formation.
Details of the studied samples from the Basin
| Sample name | Depth (m) | Well | Formation (age) | Description |
|---|---|---|---|---|
| core/coal | ||||
| DM Cook 1 | 566.45–0.50 | Cook DDH-1 | Bulli Seam, Late Permian | The sandstone off-white, light grey, fine to coarse lithic quartz, gradational base, very thick bedding (>100 cm) fining upwards |
| DM Nepean 1 | 493 | Nepean DDH-1 | Bulli Seam, Late Permian | Sandstone light grey-brown, off-white, fine to very coarse, sharp planar base, coarsening upwards |
| DM Nepean 1 | 558.3 | Nepean DDH-1 | Bulli Seam, Late Permian | Sandstone light grey-brown, medium and very coarse, lithic quartz, massive, coarsening upwards, diffused bedding (indistinct). Common silty lenticular clasts in the lower half |
| DM Nepean 1 | 681.9 | Nepean DDH-1 | Bulli Seam, Late Permian | Sandstone and Sandstone: thickly interbedded (coarse) 50:50 sandstone: light grey, medium and coarse fracture type bedding planes, blocky, sharp base, common carbonaceous grains: sandstone light grey, very fine and medium |
| DM Nepean 1 | 623.5 | Nepean DDH-1 | Narrabeen Group Clifton Subgroup, Early Triassic | Claystone: grey, grey-brown, silty fretting, sharp base |
| DM Nepean 1 | 513.8 | Nepean DDH-1 | Narrabeen Group, Clifton Subgroup, Early Triassic | Granule conglomerate and sandstone: thickly interbedded (coarse) 35:65. Granule conglomerate: light grey-brown off-white, blocky, distinct base, cross-bedding (medium angle) sparse coaly fragments, secondary siderite nodules. Sandstone light grey-brown off-white fine to coarse pebbly granular, massive, cross-bedding (medium angle) cross-bedding (low angle). Silty thin laminae define bedding |
| DM Picton 1 | 432.75–0.83 | Picton DDH-1 | Colo Vale, Early Triassic | Sandstone: light grey, medium, and very coarse grain. Lithic quartz. Pebbly, erosional base: medium angle cross-bedding very thin bedding, unit showed yellow drown oil sparse from coarse phases |
| DM Picton 2 | 306.4–0.45 | Picton DDH-2 | Colo Vale, Early Triassic | Sandstone and claystone: very thinly interbedded (fine) 95:05 Sandstone: light grey, fine to very coarse-grained, quartz lithic, massive, sharp irregular base, thick bedding (30–1,000 cm), cross-bedding (medium angle). Claystone: Dark grey, silty, thinly laminated |
| DM Picton 2 | 438.35–0.40 | Picton DDH-2 | Wombarra Claystone, Early Triassic | Claystone: Dark grey, silty, hard, fracture type, bedding planes, flaggy, gradational base, thinly laminated |
| DM Picton 3 | 348.4–0.45 | Picton DDH-3 | Colo Vale, Early Triassic | Sandstone: Off-white, medium, and coarse-grained, quartzose, erosional base, laminated, cross-bedding (low angle). 0.05 m pebbly lag at the base |
| DM Picton 3 | 554.05–0.10 | Picton DDH-3 | Wombarra Claystone, Early Triassic | Claystone: light grey-brown ripple bedding, secondary siderite replacement zone |
| DM Picton 3 | 795.95–0.95 | Picton DDH-3 | Woonan Coal, Late Permian | Mudstone: dark, grey, claystone, coaly shale |
| DM WhyBrow 2 | 550.70–0.80 | WhyBrow DDH-2 | Bulga Coal, Late Permian | Coal: Interbedded bright and dull, very broken, irregular base broken |
| DM WhyBrow 2 | 562.35–0.45 | WhyBrow DDH-2 | Scarborough Sandstone, Early Triassic | Sandstone: Light grey-yellow brown friable, distinct base, cross-bedding (low angle), very thin bedding (1–3 cm), common thin carbonaceous laminae. The unit is stained by yellowish hydrocarbons |
| DM WhyBrow 2 | 569.05–0.17 | WhyBrow DDH-2 | Bulga Coal, Late Permian | Coal: Brights with dull bands, sharp wavy base, broken |
2 Applied method
2.1 Extractions and fractionations
A dichloromethane and methanol mixture in a ratio of 93:7 left to stand for 72 h in the Soxhlet apparatus was used to obtain extracts from the core-coal samples. Asphaltene extracts were vapourised using a minimum of 0.1 and 4 mL of n-pentane, and the excess n-pentane was precipitated. The extract’s aliphatic fraction was separated using column chromatography and silica gel in a 60:60–210 m less alumina ratio. The aromatic hydrocarbon fraction was increased by elution with a 4:1 mixture of DCM + petroleum ether, the aliphatic hydrocarbon fraction through elution of petroleum ether at 40–600°C, and the polar compounds by elution with a 1:1 mixture of DCM + MeOH. The gravity produced was calculated by evaporating 1/10th portions of the aliphatic and aromatic hydrocarbon fractions, respectively, and the entire polar fractions. The preliminary work was conducted with necessary care to prevent drying any 9/10th aliquot of the hydrocarbon fractions, thereby preventing any loss of other volatile hydrocarbons [16].
2.2 Gas chromatography–mass spectrometry (GC–MS)
A 50–550 amu full scan, single ion monitoring, and metastable reaction monitoring were done by GC–MS. The GC oven with a DB-5ms was programmed in two different ways for different runs: (i) a primary temperature of 40°C for 2 min, followed by heating at 4°C min−1 to 310°C (held for 30 min) and (ii) a primary temperature of 40°C for 2 min, followed by heating at 20°C min−1 to 200°C and then a second heating ramp at 2°C min−1 to 310°C (retained for 30 min). Most biomarkers were analysed using the GC program (ii), whereas the aliphatic and aromatic hydrocarbons were analysed using the GC program (i).
2.3 Vitrinite reflectance equivalent (VRE)
The VRE was calculated for all the samples by using biomarker isomer parameters such as C29 ααα 20S/20R [17], where Ro is the vitrinite reflectance and C29 ααα 20S is the orientation of the methyl group at the 20th carbon atom of the sterane ring. The 20S and 20R orientations have methyl groups below and above the plane of the ring, respectively [5]. The calculated values are given in Table 2.
Distribution of petrological and geochemical data
| Sample ID | Depth | VRE% | Ro% | Vitrinite | Inertinite | Liptinite | Minerals | Tmax | S1 | S2 | S1 + S2 | PI | TOC | HI | OI |
|---|---|---|---|---|---|---|---|---|---|---|---|---|---|---|---|
| Cook-1 | 566.45 | 1.4 | 1.21 | 34 | 14 | 0.4 | 55 | 480 | 3.8 | 143 | 146.8 | 0.026 | 20.34 | 703 | 156 |
| Nepean-1 | 493 | 1.2 | 0.81 | 82 | 16 | 2.6 | 2.2 | 403 | 1.7 | 54 | 55.7 | 0.031 | 18 | 300 | 118 |
| Nepean-1 | 558.3 | 1.3 | 1.06 | 46 | 50 | 1.4 | 5.2 | 461 | 1.04 | 133 | 134.04 | 0.008 | 19.5 | 682 | 222 |
| Picton-1 | 432.75 | 1.3 | 1.34 | 0.52 | 8.6 | 0.2 | 2.4 | 476 | 3.7 | 104 | 107.7 | 0.034 | 16 | 650 | 104 |
| Picton-2 | 205.15 | 1.3 | 3.34 | 0.3 | 3.4 | 0.3 | 5.3 | 460 | 0.14 | 6.8 | 8.8 | 0.016 | 4.5 | 151 | 75 |
| Picton-2 | 435.35 | 1.5 | 1.02 | 0.52 | 16 | 2.6 | 5.2 | 468 | 2.0 | 6.8 | 8.8 | 0.23 | 3.35 | 194 | 48 |
| Picton-3 | 346.4 | 1.4 | 1.71 | 34 | 14 | 0.2 | 0.2 | 450 | 1.20 | 0.60 | 1.80 | 0.67 | 3.65 | 16.4 | 220 |
| Picton-3 | 554.05 | 1.3 | 1.63 | 68 | 3.4 | 1.4 | 0.2 | 402 | 2.0 | 0.62 | 2.62 | 0.76 | 2.66 | 24 | 120 |
| Picton-3 | 796.0 | 1.2 | 1.71 | 82 | 29 | 0.3 | 2.4 | 445 | 3.6 | 2.4 | 6.0 | 0.6 | 2.35 | 102 | 150 |
| WhyBrow-2 | 550.7 | 1.4 | 1.44 | 46 | 5.4 | 1.4 | 2.3 | 460 | 1.6 | 1.2 | 2.8 | 0.57 | 3.75 | 32 | 200 |
| WhyBrow-2 | 562.35 | 1.3 | 1.98 | 27 | 0.54 | 2.6 | 1.2 | 440 | 3.8 | 102 | 105.8 | 0.036 | 12.5 | 816 | 130 |
VRE = Vitrinite reflectance equivalent (calculated), Ro% = vitrinite reflectance (mean maximum), Tmax = maximum temperature of S2, TOC = total organic carbon (wt% of sample), S1 = volatile hydrocarbon (mg/g sample), S2 = hydrocarbon generating potential (mg/g sample), S1 + S2 = potential yield (mg/g sample), PI = production index (S1/S1 + S2), HI = hydrogen index (mg hydrocarbon/g TOC), and OI = oxygen index (mg CO2/g TOC).
3 Results and discussion
3.1 Presentation of data and analysis
The Sydney Basin coals of the Permian age are said to have a very high HI of 135–180 mg hydrocarbon/g TOC, a liptinite content of 2.6%, and a significantly higher total extraction yield of 6,000–11,000 ppm rocks than those linked to Permo-Triassic sediments other than coal (Tables 2 and 3). Compared to other sediments in Table 3, the coal has a lower TOC. Given the coals’ lower hydrogen content of 4–5% and peak to late oil window maturity (VR = 1.0–1%; Tmax = 440–480°C), the uplift and erosion event that began in the Aptian may have produced a significant amount of oil. This is because coals have a high amount of asphaltenes derived from organic materials at a rate of 40–60%. The extracts’ low level of total hydrocarbons is consistent with their representation of residual hydrocarbons. The generated hydrocarbons’ maturity is likely to have been released because the maturity levels were reached. The samples’ original HI with hydrogen content has decreased due to hydrocarbon generation [18]. Vitrinite, in addition to liptinite, may have been the cause of oil production in the samples. Hartgers et al. [19] asserted that sub-microscopic constituents, like microbes, can have an improved aliphatic chain in vitrinite, which may increase generation potentials [1,8,20,21]. Ahmed and Powell claim that significant aliphatic components in vitrinite studies support the oil-generating potentials of Permian coal samples to Cainozoic coal samples of Australia. The HI values for the coal samples from the Sydney Basin that were examined up to 183 mg/g TOC are comparable to those of the Permian coal samples of the Cooper Basin that were examined (up to 244 mg/g TOC Curry [22], which Powell and Boreham [8] held that is the primary source of oil being present in the Jurassic, including older reservoirs. Curry [22] noted that most aliphatic chains found in the Cooper Basin coal samples may be derived from microbial biomass.
Compositional data of the studied samples
| Samples | Extract yield (mg of rock) EOM/kg | Extract yield (mg EOM/g of TOC) | Asphaltene (% of EOM) | Group Compositional data | Ali/Aro ratio | Total | HC/polar ratio | |||
|---|---|---|---|---|---|---|---|---|---|---|
| Ali | Aro | Polars | ||||||||
| Coals/coas | ||||||||||
| DM Cook 1 | 63.6 | 37.7 | 28.3 | 117.5 | 618 | 21 | 0.1901 | 735.5 | 35.0 | |
| DM Nepean 1 | 99.0 | 48.5 | 36.5 | 118.5 | 167.4 | 22 | 0.7079 | 285.9 | 13.0 | |
| DM Nepean 1 | 69.7 | 10.0 | 82.5 | 1258.2 | 216.4 | 14 | 5.814 | 1474.6 | 105.3 | |
| DM Nepean 1 | 82.5 | 97.0 | 97.8 | 1284.3 | 718.6 | 11 | 1.787 | 2002.3 | 182.0 | |
| DM Nepean 1 | 97.6 | 8.2 | 82.5 | 1268.3 | 816.5 | 212.4 | 1.553 | 2084.3 | 9.80 | |
| DM Nepean 1 | 97.9 | 10.2 | 50.7 | 1278.2 | 718 | 213.4 | 1.780 | 1996.2 | 9.35 | |
| DM Picton 1 | 62.8 | 1779.7 | 75.6 | 1284.3 | 169.7 | 211.0 | 7.568 | 1454.0 | 6.89 | |
| DM Picton 2 | 50.0 | 2070.8 | 71.9 | 591.2 | 437.4 | 799.6 | 1.352 | 1028.6 | 1.29 | |
| DM Picton 2 | 71.8 | 864.7 | 95.8 | 601.5 | 110.0 | 76.6 | 5.468 | 711.5 | 9.29 | |
| DM Picton 3 | 75.1 | 13.3 | 135 | 501.5 | 223.5 | 217.7 | 2.244 | 725 | 3.33 | |
| DM Picton 3 | 48.5 | 319.4 | 215.4 | 228.7 | 30.9 | 57.7 | 7.401 | 259.6 | 4.50 | |
| DM Picton 3 | 83.7 | 445.4 | 316.8 | 114.6 | 83.6 | 115.8 | 1.371 | 198.2 | 1.71 | |
| DM Picton 3 | 61.0 | 60.6 | 610 | 116.8 | 117.8 | 316.5 | 0.992 | 234.6 | 0.74 | |
| DM Picton 3 | 88.1 | 63.6 | 98.6 | 238.6 | 218.3 | 216.6 | 1.093 | 456.9 | 2.11 | |
| DM WhyBrow 2 | 95.7 | 26.1 | 105 | 115.7 | 318.4 | 618.6 | 0.363 | 434.1 | 0.70 | |
| DM WhyBrow 2 | 67.4 | 2960.4 | 96.4 | 1533.6 | 550.4 | 700.0 | 2.786 | 2084.0 | 2.98 | |
| DM WhyBrow 2 | 93.4 | 16.1 | 216.5 | 1652.4 | 305.3 | 808.5 | 5.412 | 1957.7 | 2.43 | |
EOM = extractable organic matter, Ali = aliphatic hydrocarbons, Aro =aAromatic hydrocarbon, HCs = hydrocarbons, and Polars = polar compounds.
3.2 Alkanes and isoprenoids
For extracts of core samples from the Sydney Basin, the TIC fraction of saturated hydrocarbons exhibits a significant difference in the distribution pattern of isoprenoids and n-alkanes (Figure 4). However, there are some similarities in the n-alkane distribution of the extract from Cook-1 core samples and WhyBrow 2 core samples and the core sample extract from Picton 1 samples. There is bimodal distribution of n-C13–C15 n-alkanes for the Cook-1 samples, with the maximum along C20 and extending out to C31. The bimodal envelope indicates two phases of hydrocarbons, with the lighter compounds C12 to C17+ possibly characteristic of drilling additives, and the higher molecular weight compounds (Table 4 and Figure 5), with their slight to even odd predominance, possibly reflecting natural hydrocarbons. The predominant n-C18-n-C22 n-alkanes in Picton 1 extract are characterised by the absence of compounds up to C15, and the presence of predominance in the C23+ range indicates input from higher plant waxes [23]. Low molecular weight compounds may have been excluded explicitly from Picton-1 extracts through loss due to storage time and conditions that may have caused the more volatile compound to evaporate rather than the hydrocarbon’s original characteristics. Except for having a tendency to have a high abundance of n-C8 (possibly contamination signs), the extract from Picton 2 samples and the extract from Picton 1 samples show a similar pattern of n-alkane distribution, and they are thought to be genetically related. C12–C32 n-alkanes are visible in extracts from Picton 3 core and Picton 2 core samples, with the highest concentrations at C22 and C24, respectively. The core samples of these two extracts, in particular, exhibit a baseline hump (with exclusion of low molecular weight n-alkanes).

TICs of aliphatic hydrocarbon fractionations which show the pattern of n-alkane distribution.
Regular isoprenoid and n-alkane parameters for the studied samples
| Parameters | Core/coaly shale | Core/coaly shale | Core/coaly shale | Core/coaly shale | |||||||||
|---|---|---|---|---|---|---|---|---|---|---|---|---|---|
| Cook 1 | Nepean 1 | WhyBrow 2 | WhyBrow 2 | Picton 1 | Picton 2 | Picton 2 | Picton 3 | Picton 3 | Picton 3 | Picton 3 | |||
| 566.45–566.50 | 493.0 | 558.3 | 681.9 | 550.7–550.8 | 569.05–569.17 | 432.75–432.83 | 306.4–306.45 | 438.35–438.4 | 346.4–346.45 | 554.05–554.1 | 709.75–709.80 | 795.95–796 | |
| Pr/Ph | 1.86 | 1.09 | 0.67 | 0.94 | 1.23 | 0.97 | 3.53 | 1.85 | 3.16 | 3.29 | 4.29 | 2.62 | 5.55 |
| Pr/n-C17 | 0.36 | 0.67 | 0.31 | 0.60 | 0.68 | 0.58 | 0.43 | 0.52 | 0.33 | 0.40 | 0.41 | 0.24 | 0.45 |
| Ph/n-C18 | 0.16 | 1.14 | 0.46 | 0.60 | 0.64 | 0.67 | 0.09 | 0.34 | 0.09 | 0.10 | 0.10 | 0.16 | 0.14 |
| CPI22–32 | 1.26 | 1.32 | 1.31 | 1.22 | 1.42 | 1.26 | 1.42 | 1.35 | 1.97 | 1.38 | 1.39 | 1.41 | 1.33 |
| CPI 226–28 | 1.27 | 1.22 | 1.33 | 1.21 | 1.23 | 1.57 | 1.08 | 1.07 | 1.07 | 1.09 | 1.07 | 1.39 | 1.12 |
| CPI 220–22 | 1.21 | 1.31 | 1.41 | 1.22 | 1.29 | 1.41 | 1.08 | 1.06 | 1.06 | 1.09 | 1.06 | 1.39 | 1.11 |
| Wax index, (n-C21 + 22/n-C28 + 29) | 4.54 | 1.42 | 1.32 | 1.36 | 1.93 | 2.25 | 5.04 | 5.18 | 2.36 | 5.27 | 5.14 | 7.89 | 2.80 |
CPI = Carbon preference index CPI22–32 =

Cross plot of dibenzothiophene/phenanthrene against the pristane/phytane ratio.
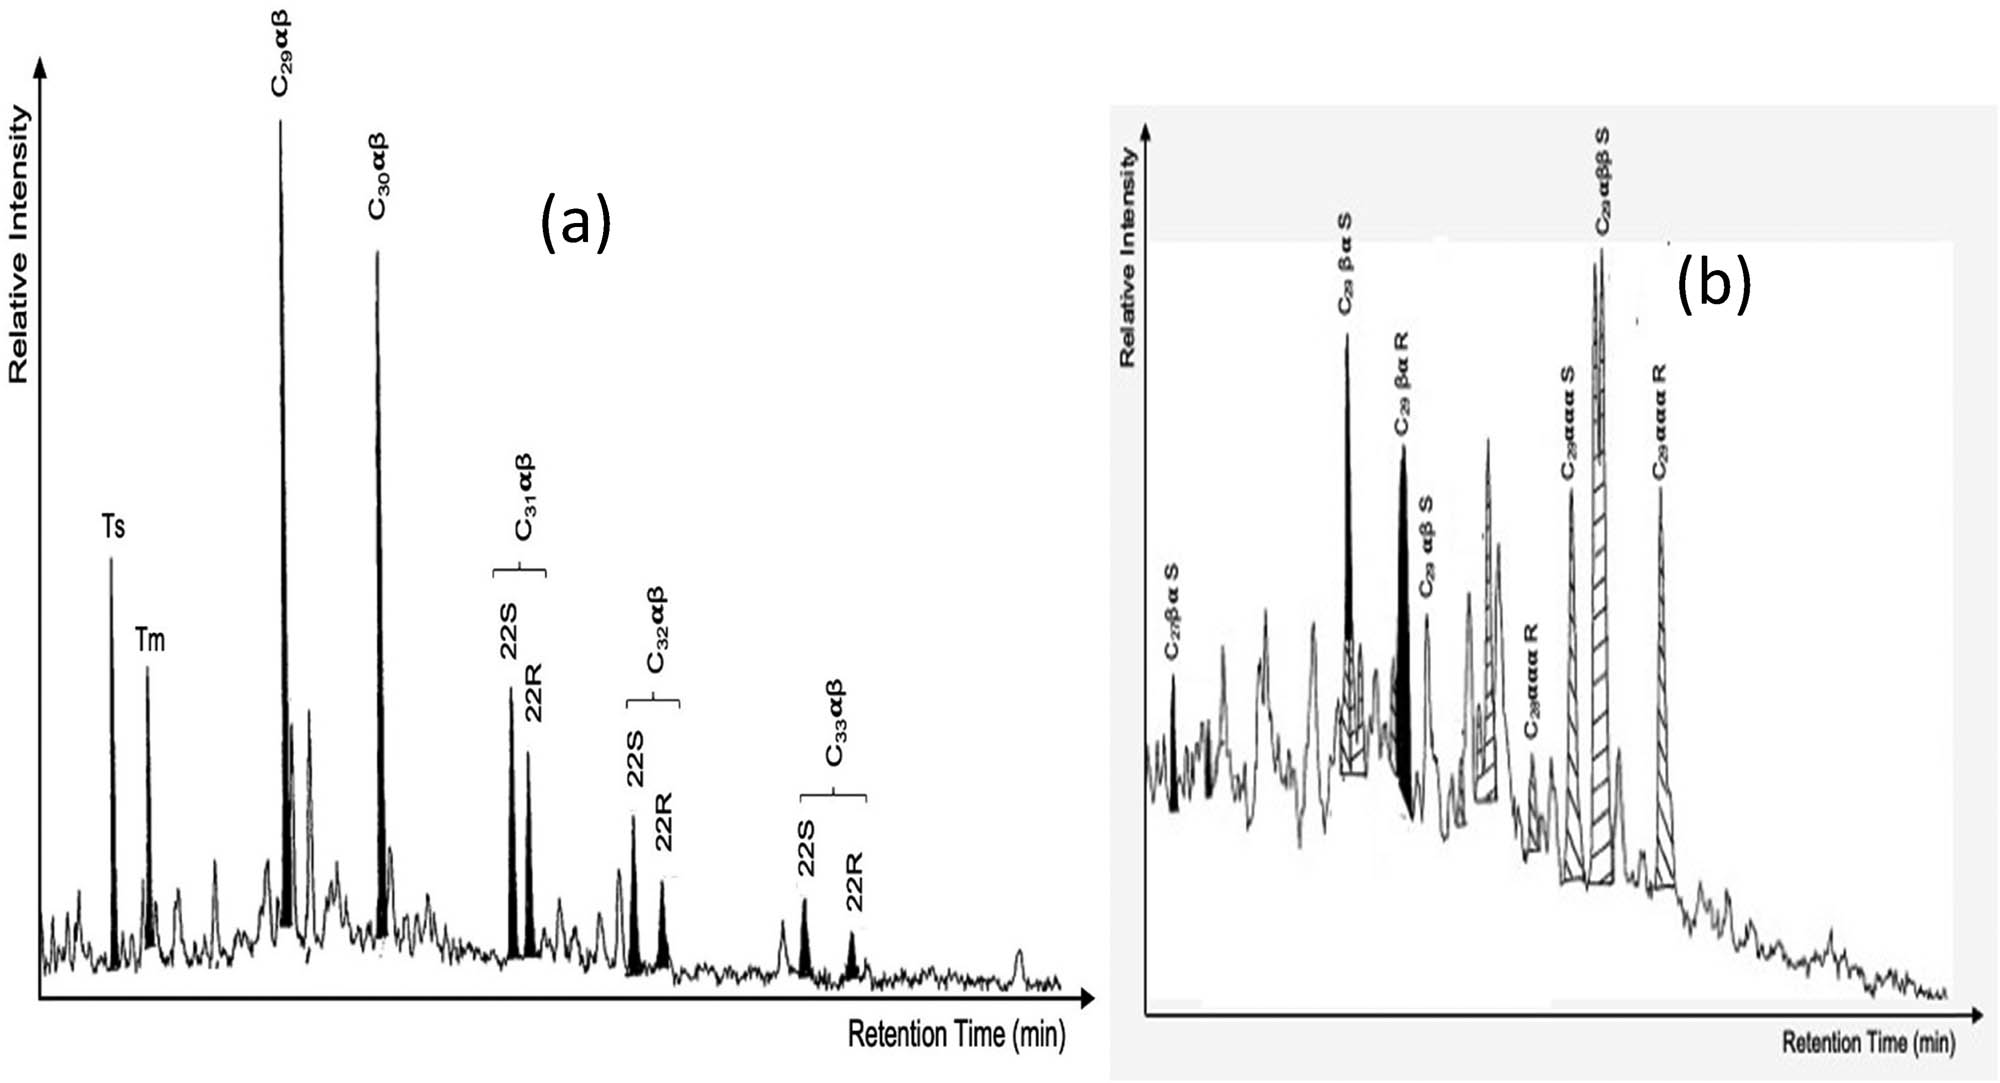
3.3 Biomarkers
The corresponding samples’ terpene, sterane, and diasterane distributions are displayed in the m/z 191 and 217 chromatograms, along with various parameters derived from the biomarkers (Figures 6 and 7; Tables 5 and 6). The MRM runs were used to calculate a few terpene parameters (Table 5), allowing the production of high-quality data free from interference from co-eluted compounds. The ratio of C26 tricyclic terpenes to C25 tricyclic terpenes in the extracts of Picton 1, Picton 3, WhyBrow 2, and Nepean 1 is below 0.071–0.86 (Table 5), which is not in unity range and suggests that the environment in which the source rocks were deposited was not lacustrine [17,24]. The ratio is higher at 1–1.5 (Figure 4), indicating that the environment for deposition is partially lacustrine. The Picton 2 extract also exhibits a ratio of C26 tricyclic terpene/C25 tricyclic terpene to unity at 1.5, demonstrating the lacustrine origin of the core samples. Preston and Edwards [25] suggests a significant terrigenous source rock input for this extract. In contrast to this core extract, these biomarkers are more prevalent in the coal extract [26] (Figure 8a, Table 5), suggesting that coal is probably the source of the Sydney Basin oil shows. The majority of oils, except for Cook 1 and Nepean 1 samples, and extracts from Picton 2 samples, except for WhyBrow 2 and Picton 1 samples, have lower abundances of C23 tricyclic terpene, 29,30-bisnorhopanes, and C29 αβ hopane than samples (493 and 550.9) (Figure 8b and c), demonstrating a genetic interaction between a number of these samples [27]. The absence of gammacerane in the extracts suggests that hypersalinity does not constrain the depositional environment [28]. In the samples taken from Cook-1 and Nepean-1 samples, there is a high concentration of 29,30-bisnorhopanes and C30 30-norhopanes (Table 4), and the ratio of C29 αβ-hopane to C30 αβ-hopane is 1. It is widely believed that some of the rock samples extracted and studied are likely associated with prokaryotic organic matter occurring within calcareous interbedded rocks because calcareous rocks are known to contain a high abundance of 30-norhopanes, which have prokaryotic organic matter [29]. However, the abundance of C29 αβ-hopane relative to its C30 and C31 hopane homologues is typically found in source rocks associated with coal, so it is not a definitive indicator of source rock lithology of calcareous origin [30]. The prevalence of 2-methyl hopanes provides additional support for the contributions made by calcareous rock extracts. Generally derived from calcareous source rocks (Table 5), phanerozoic oils frequently have high abundance of 2-methylhopane [31]. The carbon number distribution for steranes and diasteranes refers to coal-associated oils (Table 6). The extracts were more abundant in C29 steranes and diasteranes and contained fewer C27 homologues (Figure 9a, Table 6), indicating that the organic matter comes from higher plant components. Figure 9b shows the total regular steranes of C27/C28 plotted against C29 αβ-hopane/C30 αβ-hopane. The abundance of C27 sterane and diasterane in samples from WhyBrow 2 may have resulted from source’s high thermal maturity, according to Ahmed et al. [1], which shows oils related to coals. The equal or higher abundance of C27 homologues in comparison to that of C29 homologues is indicative of mixed terrigenous and aquatic source organic matter input (Table 6). About 0.5–0.61% C30 sterane, which indicates marine algal input, is a sign of these [32]. This is consistent with other rock sample extracts from this study that demonstrate the significant presence of C29 αβ-hopane, 28,30-bisnorhopane, and 2α-methylhopanes. Drimane and homodrimane ratios are present in significant abundance in the extracts (Table 5). Coniferous organic material [33,34] is present in varying amounts in the extracts, as shown in the 19NIP/C30 hopane and IP/C30 hopane ratios or 4(H)-19-nor-isopimarane (19NIP) and isopimarane (IP) ratios (Table 5).
(a) and (b) are fractional m/z 217 mass chromatograms of tri- and tetracyclic terpanes distribution for the studied samples.
(a) Fractional m/z 217 mass chromatograms of the hopane distributions for the formation under study. (b) Distribution of steranes and diasteranes of the Permian to Middle Triassic Formations of the Sydney Basin.
Parameters for terpanes for the studied samples
| Parameters | Core/coaly shale | Core/coaly shale | Core/coaly shale | Core/coaly shale | Core/coaly shale | Core/coaly shale | Core/coaly shale | Core/coaly shale | Core/coaly shale | Core/coaly shale | Core/coaly shale | Core/coaly shale | |
|---|---|---|---|---|---|---|---|---|---|---|---|---|---|
| Cook 1 | Nepean1 | Nepean1 | Nepean1 | WhyBrow2 | WhyBrow2 | Picton 1 | Picton 2 | Picton 2 | Picton 3 | Picton 3 | Picton 3 | Picton 3 | |
| Depth | 566.45 | 493 | 558.3 | 681.9 | 550.7 | 562.05 | 432.75 | 306.4 | 438.35 | 346.4 | 554.05 | 709.75 | 795.95 |
| Drimane/homodrimanea | 2.35 | 3.10 | 0.132 | 0.132 | 1.40 | 1.75 | 6.29 | 6.56 | 3.76 | 2.6 | 2.68 | 1.40 | 1.31 |
| 19NIP/C30 αβ hopaneb | 0.122 | 0.123 | 0.132 | 0.124 | 0.127 | 0.132 | 0.126 | 0.131 | 0.123 | 0.132 | 0.122 | 0.122 | 0.121 |
| IP/C30 αβ hopaneb | 0.222 | 0.24 | 0.31 | 0.51 | 0.24 | 0.34 | 0.36 | 0.42 | 0.56 | 0.41 | 1.87 | 0.132 | 0.211 |
| C26 tricyclic terpanes/C25 tricyclic terpanesb | 1 | 0.50 | 0.73 | 0.72 | 0.60 | 0.33 | 0.86 | 1.50 | 0.34 | 0.071 | 0.32 | 0.31 | 0.32 |
| C24 tetracyclic/C23 tricyclic terpanesb | 0.8 | 0.37 | 1.0 | 0.8 | 0.91 | 0.36 | 0.81 | 0.63 | 2.67 | 0.78 | 1.12 | 0.68 | 1.06 |
| C24 tetracyclic terpane/C30 αβ hopaneb | 0.8 | 0.32 | 0.59 | 0.81 | 0.34 | 0.085 | 1.40 | 1.0 | 2.67 | 0.51 | 1.27 | 1.40 | 2.38 |
| C23/C21 tricyclic terpanesb | 4.5 | 3.5 | 4.2 | 0.21 | 3.7 | 0.22 | 1.6 | 1.0 | 2.7 | 0.21 | 5.7 | 0.22 | 1.3 |
| (C19 tricyclic terpane + C20 tricyclic terpane)/C23 tricyclic terpanesb | 0.11 | 0.23 | 0.053 | 0.22 | 1.17 | 0.24 | 4.53 | 8.38 | 9.33 | 0.23 | 2.7 | 1.20 | 2.46 |
| C24 tetracyclic terpane/(C24 tetracyclic terpane + C23 tricyclic terpane)b | 0.44 | 0.35 | 0.50 | 0.48 | 0.48 | 1.0 | 0.45 | 0.53 | 0.73 | 0.44 | 0.53 | 0.42 | 0.51 |
| C19 tricyclic terpane/(C19 tricyclic terpane + C23 tricyclic terpane)b | 0.10 | 0.16 | 0.22 | 0.10 | 0.33 | 0.15 | 0.56 | 0.83 | 0.83 | nd | 0.50 | 0.17 | 0.51 |
| C19 tricyclic terpane/(C19 tricyclic terpane + C23 tricyclic terpane)b | 0.50 | 0.50 | 0.60 | 0.51 | 0.40 | 0.30 | 0.80 | 0.20 | 0.20 | 0.50 | 0.60 | 0.50 | 0.60 |
| Ts/(Ts + Tm) | 0.20 | 0.45 | 0.47 | 0.38 | 0.12 | 0.11 | 0.19 | 0.18 | 0.23 | 0.22 | 0.15 | 0.24 | 0.27 |
| C29Ts/(C29Ts + C29 αβ hopane) | 0.022 | 0.06 | 0.014 | 0.08 | 0.07 | 0.09 | 0.07 | 0.17 | 0.09 | 0.11 | 0.031 | 0.16 | 0.08 |
| C29*/C29 αβ hopane | 0.26 | 0.14 | 0.03 | 0.016 | 0.13 | 0.10 | 0.32 | 6.0 | 0.4 | 0.13 | 0.05 | 0.14 | 0.11 |
| C30*/C30 αβ hopane | 0.9 | 0.94 | 0.99 | 0.68 | 0.93 | 0.92 | 0.94 | 0.86 | 0.92 | 0.90 | 0.97 | 0.08 | 0.92 |
| C29 αβ/(αβ + βα) hopanes | 5.5 | 6.1 | 6.0 | 3.5 | 5.5 | 7.3 | 1.2 | 1.4 | 2.8 | 3.2 | 0.6 | 0.10 | 0.1 |
| C30 αβαβ + βα hopanes | 0.59 | 0.58 | 0.58 | 0.48 | 0.6 | 0.59 | 0.67 | 0.5 | 0.6 | 0.59 | 0.5 | 0.6 | 0.5 |
| C31 αβ 22S/(22S + 22R) hopanes | 0.63 | 0.61 | 0.61 | 0.61 | 0.61 | 0.61 | 0.5 | 0.48 | 0.5 | 0.6 | 0.61 | 0.8 | 0.5 |
| C32 αβ 22S/(22S + 22R) Hopanes | 59 | 58 | 58 | 50 | 60 | 59 | 67 | 50 | 60 | 59 | 50 | nd | 50 |
| % C31 of total αβ homohopanes | 63 | 61 | 50 | 60 | 61 | 61 | 50 | 61 | 50 | 60 | 63 | 60 | 61 |
| % C32 of total αβ homohopanes | 0.221 | 0.216 | 0.145 | 0.231 | 0.241 | 0.136 | 0.245 | 0.127 | 0.126 | 0.122 | 0.123 | 0.124 | 0.122 |
| Homohopanes/C30 αβ hopaneb | 0.080 | 0.161 | 0.153 | 0.114 | 0.115 | 0.111 | 0.211 | 8 | 0.12 | 0.121 | 0.057 | 0.124 | 0.122 |
| C30 30-norhopane/C30 αβ Hopane | 0.126 | 0.114 | 0.112 | 029 | 0.211 | 0.132 | 0.222 | 0.212 | 0.162 | 0.123 | 0.142 | 0.126 | 0.122 |
| 28,30-BNH/C30 αβ hopane | 0.127 | 0.118 | 0.33 | 0.14 | 0.117 | 0.113 | 0.112 | 0.114 | 0.113 | 0.112 | 0.221 | 0.211 | 0.212 |
| 29,30-BNH/C30 αβ hopane | 0.068 | 0.11 | 0.12 | 0.13 | 0.082 | 0.022 | 0.62 | 3 | 0.34 | 0.011 | 0.19 | 0.011 | 0.221 |
| C29 αβ hopane/C30 αβ hopaneb | 1.03 | 1.38 | 1.19 | 1.0 | 1.1 | 0.51 | 0.79 | 6.0 | 0.44 | 1.15 | 1.52 | 1.42 | 1.33 |
| C31 αβ hopane/C30 αβ hopaneb | 0.33 | 0.34 | 0.29 | 0.28 | 0.33 | 0.20 | 0.16 | 1.0 | 0.16 | 0.35 | 1.0 | 0.17 | 0.11 |
| C31 2α Me/(C31 2α Me + C30 αβ hopane) | 0.31 | 0.33 | 0.27 | 0.38 | 0.34 | 0.22 | 0.21 | nd | 0.20 | 0.33 | 0.28 | 0.31 | 0.32 |
| C32 2α Me/(C32 2α Me + C31 αβ hopanes) | 0.39 | 0.33 | 0.37 | 0.32 | 0.32 | 0.35 | nd | 0.32 | 0.38 | 0.31 | 0.34 | 0.36 | 0.31 |
| C29 steranesc/C29 αβ hopanea | 0.59 | 0.55 | 0.73 | 0.38 | 0.90 | 1.57 | 2.87 | 7.5 | 4.1 | 3.2 | 1.22 | 1.56 | 0.55 |
IP = Isopimarane, NIP = norisopimarane, and BNH = bisnorhopane. Ratios are calculated from MRM 191 except for (a) = m/z 123, (b) = m/z 191, (c) = m/z 217 SIM data.
Distribution of steranes and diasteranes in the studied samples
| Parameters | Core/coaly shales | Core/Coaly Sh | Core/coaly Sh | Picton 1 | Picton 2 | Picton 2 | Picton 3 | Picton 3 | Picton 3 | Picton 3 | ||||
|---|---|---|---|---|---|---|---|---|---|---|---|---|---|---|
| WhyBrow 2 | 566.45 | 493 | Nepean 1 | Nepean 1 | 432.75–432.83 | 306.4–306.45 | 438.35–438.4 | 366.4–346.45 | 554.05–554.1 | 709.75–709.8 | 795.95–796 | |||
| 550.7 | 567.05 | 558.3 | 681.9 | |||||||||||
| C27 ααα 20R (% of total C27–C29 ααα | 5.2 | 0.9 | 5.5 | 4.4 | 4.5 | 1.8 | 1.5 | 1.7 | 1.2 | 2.0 | 1.5 | 1.0 | 2.0 | |
| 20R steranes) | ||||||||||||||
| C28 ααα 20R (% of total C27–C29 ααα | 1.9 | 1.8 | 3.2 | 1.8 | 2.1 | 1.6 | 1.5 | 1.6 | 1.1 | nd | 1.2 | nd | 1.1 | |
| 20R steranes) | ||||||||||||||
| C29 ααα 20R (% of total C27–C29 ααα | 6.0 | 7.0 | 5.4 | 4.2 | 5.1 | 3.2 | 4.3 | 4.5 | 4.5 | 2.0 | 3.9 | 2.0 | nd | |
| 20R steranes) | ||||||||||||||
| C29 ααα 20R/C27 ααα 20Rsteranes | 0.5 | 0.61 | 0.49 | 0.48 | 0.46 | 0.38 | 0.32 | 0.52 | 0.45 | 0.32 | 0.42 | 0.55 | 0.32 | |
| C30/(C27 + C28 + C29) ααα20R steranes | 0.53 | 0.5 | 0.53 | 0.59 | 0.56 | 0.48 | 0.7 | 0.59 | 0.58 | 0.39 | 0.61 | 0.5 | 0.39 | |
| (%) | ||||||||||||||
| C27 αββ steranes 20S + R (% of total | 50 | 48 | 53 | 44 | 51 | 42 | 51 | 53 | 50 | 42 | 48 | 57 | 42 | |
| C27–C29 αββ 20R steranes) | ||||||||||||||
| C28 αββ steranes 20S + R (% of total | 42 | 20 | 43 | 45 | 46 | 20 | 24 | 23 | 20 | 28 | 22 | 38 | 20 | |
| C27–C29 αββ 20R steranes) | ||||||||||||||
| C29 αββ steranes 20S + R (% of total C27 | 49.5 | 48.6 | 50 | 48.1 | 51 | 50 | 50.3 | 49.5 | 49.2 | nd | 50.4 | 48 | 49.5 | |
| to C29 αββ 20R steranes) | ||||||||||||||
| C27 steranes (% of total C27–C29 regular | 7.0 | 7.0 | 19 | 4.0 | 3.0 | 5.0 | 3.0 | 9.0 | 52 | 23 | 26 | 4.0 | 12 | |
| steranes) | ||||||||||||||
| C28 steranes (% of total C27–C29 regular | 9.0 | 5.0 | 13 | nd | 2.0 | 4.0 | 21 | 6.0 | 40 | 16 | 18 | 2.0 | 9.0 | |
| steranes) | ||||||||||||||
| C29 steranes (% of total C27–C29 regular | 9.0 | 11 | 13 | 16 | nd | 9.0 | 16 | 5.0 | 32 | 13 | 13 | 3.0 | 9.0 | |
| steranes) | ||||||||||||||
| C27 βα diasterane 20S + R (% of total | 9.4 | nd | 5.8 | 6.1 | 6.0 | 4.8 | 2.4 | 2.0 | 2.4 | 1.5 | 6.9 | 9.4 | 6.9 | |
| C27–C29 βα 20S + R diasteranes) | ||||||||||||||
| C28 βα diasterane 20S + R (% of total | −38 | 38 | −4 | −4 | 1.41 | −26 | 52 | 21 | 25 | 20 | 42 | 20 | 20 | |
| C27–C29 βα 20S + R diasteranes) | ||||||||||||||
| C29 βα diasterane 20S + R (% of total | 8.7 | 10 | 5.3 | 6.5 | 4.3 | 4.3 | 8.8 | 8.5 | 7.5 | 43 | 7.0 | 4.7 | 7.5 | |
| C27–C29 βα 20S + R diasteranes) | ||||||||||||||
| C29/C27 βα diasteranes | 0.92 | 10 | 0.91 | 1.1 | 0.72 | 1.1 | 3.7 | 4.3 | 3.13 | 4.3 | 4.7 | 0.68 | 9.4 | |
| C27 + C28 + C29 βα diasteranes/ | 11.2 | 2.8 | 11 | 10.1 | 8.6 | nd | 2.3 | 11.1 | 2.4 | 11.1 | 2.8 | 2.4 | 2.8 | |
| (ααα + αββsteranes) | ||||||||||||||
| C29 ααα 20S/(20S + 20R) steranes | 11.5 | 13.8 | 9.4 | 7.1 | 8.4 | 6.1 | 8.6 | 9.4 | 8.9 | 8.6 | 7.8 | 3.9 | 3.9 | |
| Vitrinite reflectance equivalent from | ||||||||||||||
| C29 ααα 20S/20R (Sofer et al.(1993)) | 0.92 | 0.86 | 0.74 | 0.69 | 0.65 | 0.69 | 1.1 | 1.1 | 1.0 | 1.1 | 1.1 | 1.1 | 1.0 | |
| C29 αββαββ + ααα steranes | 11.9 | 16.6 | 12 | 9.9 | 10.2 | 9.9 | 11.2 | 11.1 | 11.3 | 11.2 | 9.6 | nd | 9.9 | |
| C29 βα diasterane 20S/(20S + 20R) | 0.62 | 0.50 | 0.34 | 0.65 | 0.58 | 0.65 | 0.47 | 0.45 | 0.45 | 0.47 | 0.37 | 0.49 | 0.37 | |
The ratios are all calculated from MRM data 217.

Cross plots showing the distribution of (a) C19 Tricyclic/C19 Tricyclic + C23 Tricyclic Terpanes against C24 Tetracyclic/C23 Tricyclic Terpanes. (b) 29, 30-BNH/30αβ-Hopanes against C23/C21-TricyclicTerpane, and (c) C29 αβ-Hopane/C30-αβ-Hopane against C27/C28 total regular steranes.

Ternary diagrams showing the variations in total regular steranes (C27, C28, and C29) and a variation in C29-, C30-, and C31-hopanes.
These compounds are either scarce or absent in some samples (Np1 and Ck1). Tables 5 and 6 show that the extracts’ sensitivity-maturity stereoisomers of steranes, diasteranes, and hopanoids are close to the samples’ thermal equilibrium. The C30/(++)-hopane ratios are at equilibrium values of 0.56–0.97, indicating either the oil window has peaked or thermal maturities are higher. The abundance of moretane is low in comparison to that of C30 hopane. This outcome follows the diasteranes 20S/(20S + 20R) ratios, which reached their predicted thermal endpoints at around 0.65 at the start of oil generation [35].
Additionally, for C29 sterane, the 20S/(20S + 20R) ratios near the end of their empirical range give a calculated VRE value of roughly 0.65–1.1%, in agreement with the correlation of Sofer [17]. The variation of the C29/(++)-sterane ratio ranges from 0.48 to 0.67, which is below their theoretical endpoint of 0.65% [36,37]. However, at high thermal maturities, reversed sterane maturity ratios are possible [38]. In conclusion, the distribution of biomarkers points to a genetic connection between oils and primarily coal extracts. Most specific maturity biomarker signatures indicate similarities with molecular maturities related to coal (e.g., 0.65 to 1.10% VRE). However, these maturity levels are significantly lower than the measured VRE of 1 to 1.3%, indicating that the maturity levels of the Sydney Basin samples’ extracted samples are much more advanced than the calculated VRE range, which is where the parameters reach their experiential endpoint.
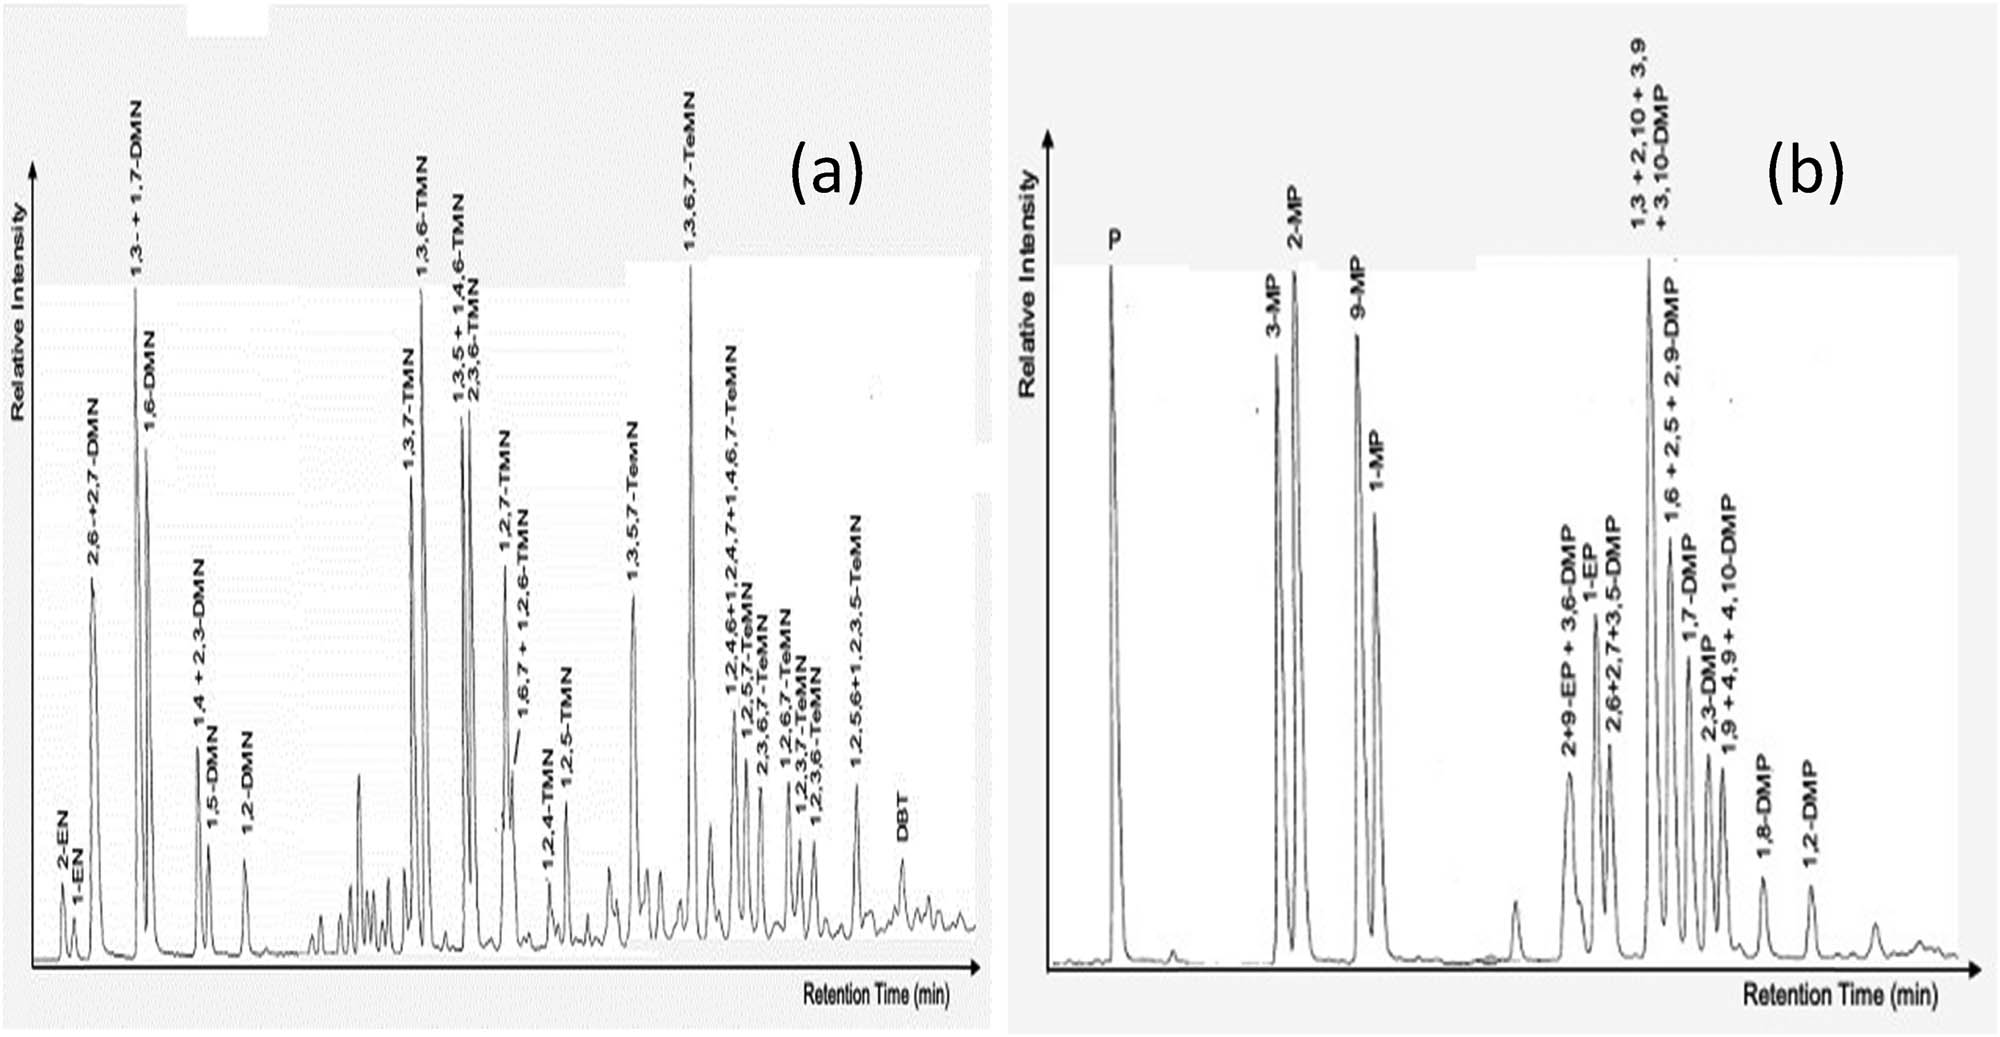
3.4 Aromatic hydrocarbons
The source-specific distribution of aromatic compounds in the extracts and the saturated biomarkers shares similarities. Dibenzothiophene/phenanthrene ratios, for instance, are low in extracts, indicating a lower abundance of organic sulphur compounds (Figure 5, Table 7). The source parameters of aromatic hydrocarbons (Table 7) are derived from plant compounds 1,2,7- with 1,2,5-trimethylnaphthalenes, 1-methylphenanthrene, 1,2-dimethylphenanthrene, and retene [39,40]. Due to their pre-Jurassic nature and derivation, these parameters appear to be the same for Permo-Triassic sediments and coals. The sensitivity maturity of aromatic hydrocarbons shows different molecular maturities for the samples. The maturity parameters for methylnaphthalene ratio, ethylnaphthalene ratio, dimethylnaphthalene 1 ratio, trimethylnaphthalenes 2 ratio, and trimethylnaphthalene ratio with tetrimethylnaphthalene are derived from the alkylnaphthalene distributions and show maturity at the peak to late levels of the oil generation window (Table 7, Figure 9).
Parameters for aromatic hydrocarbon for the studied samples
| Coals/coaly shales | Coals/coaly shales | Coals/coaly shales | Core/coaly Shale | Coals/coaly shales | Coals/coaly shales | Coals/coaly shales | Coals/coaly shales | Coals/coaly shales | Coals/coaly shales | ||
|---|---|---|---|---|---|---|---|---|---|---|---|
| WhyBrow 2 | Cook 1 | Nepean 1 | Nepean 1 | Picton 1 | Picton 2 | Picton 2 | Picton 3 | Picton 3 | Picton 3 | ||
| 550.7 | 567.05 | 566.45 | 493 | 558.3 | 432.75–432.83 | 306.4–306.45 | 438.35–438.4 | 346.4–346.45 | 554.05–10 | 795.95–796 | |
| Methylnaphthalene ratio (MNR: 2-MN/1-MN), Radke et al. [45] | 1.26 | 2.32 | 1.23 | 2.12 | 2.32 | 3.24 | 1.86 | 2.33 | 3.44 | 2.45 | 1.86 |
| R c (%) from MNR = (0.17 × MNR + 0.82) from Radke et al. [41] | 2.22 | 1.36 | 1.48 | 1.46 | 2.40 | 3.25 | 2.28 | 1.86 | 2.28 | 3.24 | 2.32 |
| Ethylnaphthalene ratio (ENR: 2-EN/1-EN), Radke et al. [45] | 1.26 | 1.68 | 2.46 | 1.64 | 3.25 | 4.23 | 2.24 | 3.34 | 1.56 | 2.36 | 1.15 |
| Dimethylnaphthalene ratio (DNR-1: [2,6- + 2,7- DMN]/1,5-DMN), Radke et al. [45] | 1.83 | 2.33 | 2.75 | 1.83 | 3.76 | 6.46 | 1.94 | 3.38 | 5.6 | 3.83 | 5.5 |
| DNR-x ([2,6- + 2,7-DMN]/1,6-DMN) | 0.52 | 0.69 | 0.70 | 0.62 | 0.94 | 1.45 | 0.70 | 0.83 | 1.38 | 0.82 | 0.96 |
| Trimethylnaphthalene ratio (TNR-1: 2,3,6-TMN/[1,4,6- + 1,3,5-TMN]), Alexander et al. [46] | 0.63 | 0.62 | 0.95 | 0.82 | 1.31 | 1.02 | 0.76 | 1.07 | 1.05 | 0.98 | 0.80 |
| Trimethylnaphthalene ratio (TNR-2: [2,3,6- + 1,3,7- TMN]/[1,4,6- + 1,3,5- + 1,3,6-TMN]), Radke et al. [47] | 0.67 | 0.67 | 0.81 | 0.78 | 0.90 | 0.90 | 0.76 | 0.86 | 0.86 | 0.87 | 0.75 |
| R c (%) from TNR-2 = (0.4 + (0.6 × TNR-2)), from Radke et al. [48] | 0.802 | 0.802 | 0.886 | 0.462 | 0.94 | 0.94 | 0.856 | 0.916 | 0.916 | 0.922 | 0.85 |
| Log (1,2,5-TMN/1,3,6-TMN) | −0.0063 | −0.2268 | −0.3837 | −0.2268 | −0.9087 | −0.6936 | −0.3575 | −0.6198 | −0.1591 | −0.7552 | −0.9208 |
| Log (1,2,7-TMN/1,3,7-TMN) | −0.5229 | −0.4772 | −0.4455 | −0.1884 | −0.4346 | −0.5948 | −0.5882 | −0.1115 | −0.1884 | −0.5283 | −0.2139 |
| Trimethylnaphthalene ratio (TMNr: 1,3,7-TMN/[1,3,7- + 1,2,5-TMN]), van Aarssen et al. [49] | 0.42 | 0.55 | 0.63 | 0.73 | 0.8 | 0.79 | 0.63 | 0.75 | 0.52 | 0.81 | 0.86 |
| Tetramethylnaphthalene ratio (TeMNr: 1,3,6,7- TeMN/[1,3,6,7 + 1,2,5,6 z-TeMN]), van Aarssen et al. [49] | 0.54 | 0.45 | 0.74 | 0.61 | 0.85 | 0.82 | 0.80 | 0.79 | 0.44 | 0.86 | 0.79 |
| Methylphenanthrene index (MPI-1: 1.5*[3-MP + 2- MP]/[P + 9-MP + 1-MP]), Radke et al. [50] | 0.59 | 0.71 | 1.1 | 0.93 | 0.81 | 1.26 | 1.36 | 1.0 | 0.75 | 1.0 | 1.0 |
| R c (%) from MPI – 1 = 0.6 × MPI-1 + 0.4 (for R o < 1.35), from Radke and Welte [51] | 0.754 | 0.826 | 1.06 | 0.958 | 0.886 | 1.156 | 0.4 | 1.0 | 0.85 | 1.0 | 1.0 |
| Methylphenanthrene distribution fraction (MPDF: (3-MP + 2-MP)/∑MPs), Kvalheim et al. [52] | 0.41 | 0.45 | 0.55 | 0.46 | 0.49 | 0.53 | 0.35 | 0.48 | 0.47 | 0.51 | 0.55 |
| Log 1 – MP)/9-MP)HCA | 1.53 | 2.28 | 2.93 | 2.12 | 2.24 | 2.9 | 2.42 | 2.38 | 1.93 | 2.5 | 3.26 |
| Methylphenanthrene ratio (MPR: 2-MP/1-MP), Radke et al. [45] | 1.1229 | 1.2944 | 1.4022 | 1.2630 | 1.2862 | 1.3978 | 0.94 | 1.3128 | 1.2227 | 1.3339 | 1.1229 |
| Dimethylphenanthrene ratio (DPR: (3,5- + 2,6-DMP + 2,7-DMP)/(1,3- + 3,9- + 2,10- + 3,10-DMP + 1,6- + 2,9- + 2,5-DMP), Radke et al. [45] | 0.28 | 0.38 | 0.58 | 0.36 | 0.38 | 0.40 | 0.80 | 0.34 | 0.43 | 0.39 | 0.40 |
| Log (1,7-DMP/1,3- + 3,9- + 2,10- + 3,10-DMP)HCA | −0.2518 | −2.2291 | −0.3448 | −1.4685 | −0.2804 | −0.4494 | −0.2734 | −0.3310 | −0.3565 | −0.4126 | −0.3310 |
| Log (Retene/9-MP)HCA | −0.1367 | −0.0185 | −0.1280 | −0.3438 | −0.2803 | −0.3442 | −0.3210 | −0.1658 | −0.1568 | −0.1768 | −0.2446 |
| Methylbiphenyl ratio (MBpR: 3-MBp/2-MBp), Alexander et al. [53] | 75 | 24.3 | 26.7 | 25.2 | 15 | 76 | 12.5 | 75 | 75 | 76 | 36 |
| Dimethylbiphenyl ratio (DMBpR-x: 3,5-DMBp/2,5- DMBp), Cumbers et al. [54] | 18 | 6.8 | 14.7 | 5.1 | 2.9 | 9.7 | 4.14 | 4.3 | 4.7 | 16.5 | 7.3 |
| Dimethylbiphenyl ratio (DMBpR-y: 3,3ˊ-DMBp/2,3ˊ- DMBp), Cumbers et al. [54] | 44 | 10.3 | 9.4 | 5.2 | 8.8 | 75 | 18.3 | 76 | 25 | 75 | 37 |
| Dibenzothiophene/phenanthreneHCA | 0.79 | 1.25 | 0.98 | 0.96 | 1.0 | 1.0 | 5.2 | 0.35 | 0.81 | 0.49 | 0.65 |
| Methyldibenzothiophene ratio (MDR: 4-MDBT/1-MDBT), Radke et al. [47] | 1.43 | 0.7 | 4.69 | 4.3 | 1.87 | 2.2 | 2.58 | 1.62 | 1.16 | 1.09 | 1.5 |
R c (%) = Calculated vitrinite reflectance, MN = methylnaphthalene, EN = ethylnaphthalene, TMN = trimethylnaphthalene, P = phenanthrene, MP = methylphenanthrene, DMP = dimethylphenanthrene, MBp = methylbiphenyl, DMBp = dimethylbiphenyl, DBT = dibenzothiophene, and DMDBT = dimethyldibenzothiophene.
According to Radke et al. [41], a calibrated trimethylnaphthalenes 2 ratio will result in an approximately 1–2% VRE maturity (Table 7). These maturities are consistent with none of the samples containing 1,8-dimethylnaphthalene, the least thermally stable, alkylated dimethylnaphthalene isomer. However, the ratios of methylnaphthalene, dimethylnaphthalene 1, trimethylnaphthalenes, and tetrimethylnaphthalene in one sample of Cook-1 and two samples of Picton 1, 2, and 3 are moderately low, possibly as a result of biodegradation. Isomers that are alkylated in nature along with those that have undergone substitution and those that have – substitution with replacement patterns of 1,6 – are less favoured by biodegradation, but fur is an aromatic hydrocarbon [42–44]. As a result, the more resilient aromatic hydrocarbon compounds for the Cook 1 sample, such as alkyl phenanthrenes and alkylbiphenyls with alkyl dibenzothiophene, are undifferentiated in maturities. The methylbiphenyl and dimethylbiphenyl ratios, which alkyl biphenyls attained, indicate that the oil window’s molecular maturities are at their peak to late stages (Figure 10a and b). The alkyl naphthalene distributions show that these samples (Figures 10 and 11, Table 7) are similar to the set of Nepean-1 samples. Still, they exhibit abnormally high maturation, with the ratios being weakly correlated throughout the study region (Sydney Basin) (Figure 11b). On the other hand, maturity ratios and parameters found in the biomarkers, along with the majority of the aromatics’ maturity ratios, indicate peak oil window to late oil window maturities, which is consistent with the samples’ calculated VRE.

Cross plot of (a) DNR-1 against DNR-x, (b) TMN against TeMNr, and (c) MPDF against MPI-1 that show variations in molecular maturities and what it meant for the samples.

Cross plot of (a) MPR against DPR, (b) MDR against DMDR, and (c) MBpR against DMBpR-y which show the molecular maturity variations.
4 Construal of analysed data
4.1 Tributary alteration
The distribution patterns of aliphatic and aromatic hydrocarbons reveal a constant in their secondary alteration of some samples by either weathering or biodegradation/water washing [20,55–57]. Since evaporation through weathering occurred naturally, the cook 1 sample has a lower abundance of higher molecular weight n-alkanes (Figure 12). But there is a baseline hump present, and low molecular weight n-alkanes are not present.

Cross plot of (a) Pr/n-C17 against Ph/n-C18, (b) 1,2,4-TMN/1,6,7-TMN against 1,2,7-TNM/1,3,6-TMN, and (c) BBR (1,6-DMN/1,5-DMN) against TBR (1,3,6-TMN/1,2,4-TMN) evidence of biodegradation. Note: CK-1 = cook-1.
4.2 Maturity
The samples analysed from the Sydney Basin averagely reached a level of maturity of 1.0–1.3% VR parameters derived from branched/cyclic and aromatic distribution. Their carbon preference index values are close to unity, and the measured maturities determined from the distribution of alkyl naphthalene and alkyl phenanthrene aromatic hydrocarbon maturity parameters (Table 2) are consistent with this. Because these maturity parameters are inflexible from the peak to the late oil window, the ratio of specific maturities derived from hopane, diasteranes, and steranes is primarily either at thermal equilibrium or close to thermal equilibrium [58]. The CPI values for the 12 core samples (Table 4) show values close to unity, consistent with their formation as mature source rocks. However, the aromatic hydrocarbon maturity parameters for methylnaphthalene ratio, trimethylnaphthalene ratio 2, methylphenatharene index 1, and methylphenatharene ratio indicate a molecular maturity of 1.0–1.4% VR (Table 7), which is consistent across all samples.
4.3 Correlation of oil source
Permian coals may be the primary source of oils in the Sydney Basin, according to the prokaryotic signatures of the extracts, which may have come from a thin layer of interbedded calcareous shale in the Sydney Basin’s coal measures. On the other hand, they might have originated from siltstone or shales of the Permo-Triassic basin sections, primarily made of higher plant organic matter and finely interbedded rocks, possibly calcareous ones.
Geological and geochemical data consistently support oil production from coals of Permian origin in the basin. The oil produced by the Permian coals and its expulsion may have moved to the basin’s Triassic sandstones via faults and fractures caused by the Tasman Sea’s opening, which occurred in the Late Cretaceous and Early Tertiary periods [15,59]. Evidence from numerous gaseous flows in the Narrabeen Group, which is Triassic overlying the late Permian coal measures [60], clearly demonstrates that the late Permian coals significantly contributed to the source of gaseous hydrocarbon in the basin. Despite prokaryotic organic matter, which is indirect evidence of most likely a calcareous source rock containing prokaryotic organic matter, these samples have no geological evidence of calcareous intercalation.
The coal samples from the basin produced molecular maturities well within the window for late oil generation; as this study has shown, they could have produced significant amount of oil. The oil and gas deposits in the basin are genetically related to Permian coals, as was already mentioned. These exhibit similarities with different source-specific biomarkers and aromatic hydrocarbons. However, a good deal of the correlation is muddled by the extracts’ variability; as a result, there is no constant source-to-source correlation because both the lateral and vertical sources of rapid energy vary. Oil production and expulsion from Permian coals and their subsequent migration to the Triassic, which overlies the Permian in the basin, are demonstrated by the correlation of oil genetically within the basin. Despite the extensive exploration activities onshore in the Sydney Basin, no known oil accumulation has been found there; this may be due to the loss of coal-derived oils produced during uplift and erosion periods. However, it is possible the gas was caused by cracked oil. However, the deeper portion of offshore basins, where oil may have been better preserved due to less uplift and erosion, is less explored. In this region of the basin, there is a chance that commercial-scale oil accumulation will occur. The sourced rock might also be used as a reservoir rock.
5 Conclusions
Evidence of liquid hydrocarbon source rocks has been found in the Sydney Basin. The following conclusions were reached in this study using petroleum potentials from the Sydney Basin’s Early Permian to Middle Triassic Formation: 1. The extracts of the samples collected and analysed in the basin reveal a terrigenous higher plant dominant organic matter deposited under oxic conditions, and the thermal maturity levels of the source rocks range from 1 to 1.3% of the VRE, a reflection of late oil generation window to peak oil generation window. 2. High organic matter extract yields and moderate hydrogen indices are characteristics of the Early Permian to Middle Triassic sediments. 3. Prokaryotic and highly plant-rich organic matter can be seen in the Permo-Triassic core sediments that have been analysed and studied. 4. The interbedded calcareous rocks within the Permian coal layers may have been the source of prokaryotic organic matter and its molecular signature. 5. The genetic association between the oil shows and Permian coals is similar to the organic matter, the palaeoenvironment of deposition, and the molecular maturity of source rocks. These similarities are seen in the organic geochemical analysis. 6. Oil production that started in the Early Permian was effectively expelled in the Late Permian and then moved to Early Triassic to Middle Triassic sandstones that were on top of Permian coal measures. 7. Most potential source rocks appear to be coals rather than shales and their associates, but further analysis is needed to determine whether coals and shales are inextricably linked as the source of oil. 8. The study’s conclusions – which suggest that there may be an oil accumulation of commercial significance in the basin’s deeper offshore region – increase the basin’s prospectivity. Seismic data are currently being used to study this offshore area, and the results will be released soon. 9. It has been noted that some samples are biodegrading, particularly Cook-1 and WhyBrow-2, which have been studied.
Acknowledgements
We want to acknowledge the profound support from the NSW Geological Survey Agency, Geoscience Australia, for providing the geochemical data. We thank the University of Malaya’s geology department for making the environment possible for this research work. We also appreciate the Integrated Geochemical Interpretation (IGI) Ltd. for providing an academic license for their software P: IGI, which was used to plot all the geochemical data for this research work and, consequently, interpretation of the plotted data. We also acknowledge the comprehensive support received from their colleagues Lanre Asiwaju, Ann James, Nadzmi Ghoufor, Nura Yelwa, Gerald Ejiga, and many others.
-
Funding information: The authors declare that there was no funding for this research work.
-
Author contributions: Terfa Elijah Garba conceptualised the research, developed the technique, prepared the original draft, and led the study framework design, considerably contributed to the composition of the original manuscript, ensuring that the research aims and findings were well expressed. Additionally, Terfa Elijah Garba was engaged in laboratory analysis and interpretation of the results from the examined samples. Khairul Azlan Mustapha reviewed and edited the manuscript and oversaw the research activities to guarantee quality, employ suitable methodologies, and analyse the findings. Terfa Elijah Garba and Khairul Azlan Mustapha played a crucial role in reading and revising the manuscript, offering essential suggestions to improve the clarity and coherence of the final piece. Lanre Asiwaju prepared the samples for laboratory work, analysed the samples, and assessed certain outcomes of the analyses. Terfa Elijah Garba, Khairul Azlan Mustapha, and Lanre Asiwaju played a pivotal role in the effective execution of the project. Lawal Mutari and Lanre Asiwaju had the same responsibilities and contributed considerably to the practical completion of the project.
-
Conflict of interest: The authors declare that there is no conflict of interest.
-
Data availability statement: Data will only be available on reasonable request. It can be accessed through https://www.resources.nsw.gov.au.
References
[1] Ahmed M, Volk H, George SC, Faiz M, Stalker L. Generation and expulsion of oils from Permian coals of the Sydney Basin, Australia. Org Geochem. 2009;40(7):810–31. 10.1016/j.orggeochem.2009.04.003.Search in Google Scholar
[2] Petersen HI, Nytoft HP. Oil generation capacity of coals as a function of coal age and aliphatic structure. Org Geochem. 2006;37(5):558–83.10.1016/j.orggeochem.2005.12.012Search in Google Scholar
[3] Huang H, di Primio R, Pedersen JH, Silva R, Algeer R, Ma J, et al. On the determination of oil charge history and the practical application of molecular maturity markers. Mar Pet Geol. 2022;139:105586.10.1016/j.marpetgeo.2022.105586Search in Google Scholar
[4] Liu Y, Zhu Y, Liu S, Zhang C. Evolution of aromatic clusters in vitrinite-rich coal during thermal maturation by using high-resolution transmission electron microscopy and fourier transform infrared measurements. Energy Fuels. 2020;34(9):10781–92.10.1021/acs.energyfuels.0c01891Search in Google Scholar
[5] Faiz M, Saghafi A, Sherwood N, Wang I. The influence of petrological properties and burial history on coal seam methane reservoir characterisation, Sydney Basin, Australia. Int J Coal Geol. 2007;70(1–3):193–208.10.1016/j.coal.2006.02.012Search in Google Scholar
[6] Scheibner E. Tectonic setting: The Gunnedah Basin, New South Wales. Geol Surv N South Wales Mem Geol. 1993;12:33–46.Search in Google Scholar
[7] Murray CG. Tectonic evolution and metallogenesis of the Bowen Basin. Proceedings of Bowen Basin Symposium. Bowen Basin Symposium. 1990. p. 201–12.Search in Google Scholar
[8] Powell TG, Boreham CJ. Terrestrially sourced oils: where do they exist and what are our limits of knowledge? – a geochemical perspective. Geol Soc, Lond, Spec Publ. 1994;77(1):11–29.10.1144/GSL.SP.1994.077.01.02Search in Google Scholar
[9] Fielding CR, Trueman JD, Alexander J. Holocene depositional history of the Burdekin River Delta of northeastern Australia: a model for a low-accommodation, highstand delta. J Sediment Res. 2006;76(3):411–28.10.2110/jsr.2006.032Search in Google Scholar
[10] Packham GH. The geology of New South Wales. J Geol Soc Aust. 1969;16:654.10.1080/14400956985270031Search in Google Scholar
[11] Archbold N, Dickins J. Australian phanerozoic timescale 6. Permian. A standard for the Permian system in Australia. Aust Bur Min Resour Rec. 1991;6:36.Search in Google Scholar
[12] Mayne S, Nicholas E, Bigg-Wither A. Geology of the Sydney Basin-A review. Vol. 8. Australia: Australia. Bureau of Mineral Resources, Geology Geophysics; 1975.Search in Google Scholar
[13] Sullivan PB, Coyle DA, Gleadow AJ, Kohn BP. Late Mesozoic to early Cenozoic thermotectonic history of the Sydney Basin and the eastern Lachlan fold belt, Australia. Paper presented at the Geological Society of Australia Abstracts. 1995.Search in Google Scholar
[14] Mcdougall I, Maboko MA, Symonds P, McCulloch MT, Williams I, Kudrass H. Dampier Ridge, Tasman Sea, as a stranded continental fragment. Aust J Earth Sci. 1994;41(5):395–406.10.1080/08120099408728150Search in Google Scholar
[15] Branagan DF, Packham GH. Field geology of New South Wales. Vol. 418. Australia: Department of Mineral Resources New South Wales Sydney; 2000.Search in Google Scholar
[16] Ahmed M, George SC. Changes in the molecular composition of crude oil during their preparation for GC and GC–MS analyses. Org Geochem. 2004;35(2):137–55.10.1016/j.orggeochem.2003.10.002Search in Google Scholar
[17] Sofer Z. Distribution of genetic oil families in West Africa based on biomarker ratios. In Latin American Congress on Organic Geochemistry, 3rd, Manaus, Brazil, Extended abstracts. 1993. p. 134–7.Search in Google Scholar
[18] Sykes R, Snowdon LR. Guidelines for assessing the petroleum potential of coaly source rocks using Rock-Eval pyrolysis. Org Geochem. 2002;33(12):1441–55.10.1016/S0146-6380(02)00183-3Search in Google Scholar
[19] Hartgers WA, Sinninghe Damste JS, de Leeuw JW, Ling Y, Dyrkacz GR. Molecular characterisation of flash pyrolyzates of two Carboniferous coals and their constituting maceral fractions. Energy Fuels. 1994;8(5):1055–67.10.1021/ef00047a008Search in Google Scholar
[20] Ahmed M, Smith JW, George SC. Effects of biodegradation on Australian Permian coals. Org Geochem. 1999;30(10):1311–22.10.1016/S0146-6380(99)00104-7Search in Google Scholar
[21] Powell T, Boreham C, Smyth M, Russell N, Cook A. Petroleum source rock assessment in non-marine sequences: Pyrolysis and petrographic analysis of Australian coals and carbonaceous shales. Org Geochem. 1991;17(3):375–94.10.1016/0146-6380(91)90101-OSearch in Google Scholar
[22] Curry DJ, Emmett JK, Hunt JW. The geochemistry of aliphatic-rich coals in the Cooper Basin, Australia and Taranaki Basin, New Zealand: Implications for the occurrence of potentially oil-generative coals. Geol Soc, Lond, Spec Publ. 1994;77(1):149–81.10.1144/GSL.SP.1994.077.01.09Search in Google Scholar
[23] Didyk BM, Simoneit BRT, Brassell ST, Eglinton G. Organic geochemical indicators of palaeoenvironmental conditions of sedimentation. Nature. 1978;272(5650):216–22.10.1038/272216a0Search in Google Scholar
[24] Schiefelbein CF, Zumberge JE, Cameron NR, Brown SW. Petroleum systems in the South Atlantic margins. Geol Soc, Lond, Spec Publ. 1999;153(1):169–79.10.1144/GSL.SP.1999.153.01.11Search in Google Scholar
[25] Preston JC, Edwards DS. The petroleum geochemistry of oils and source rocks from the northern Bonaparte Basin, offshore northern Australia. APPEA J. 2000;40(1):257–82.10.1071/AJ99014Search in Google Scholar
[26] Manzur A, Volk H, Tony A, David H. Origin of oils in the eastern Papuan basin, Papua New Guinea. Org Geochem. 2012;53:137–52.10.1016/j.orggeochem.2012.06.002Search in Google Scholar
[27] Moldowan JM, Seifert WK, Gallegos EJ. Identification of an extended series of tricyclic terpanes in petroleum. Geochim Cosmochim Acta. 1983;47(8):1531–4.10.1016/0016-7037(83)90313-7Search in Google Scholar
[28] Damsté JSS, Kenig F, Koopmans MP, Köster J, Schouten S, Hayes JM, et al. Evidence for gammacerane as an indicator of water column stratification. Geochim Cosmochim Acta. 1995;59(9):1895–900.10.1016/0016-7037(95)00073-9Search in Google Scholar PubMed
[29] Subroto EA, Alexander R, Kagi RI. 30-Norhopanes: Their occurrence in sediments and crude oils. Chem Geol. 1991;93(1–2):179–92.10.1016/0009-2541(91)90071-XSearch in Google Scholar
[30] Pancost RD, Farrimond P. Editorial organic geochemistry. Editor Org Geochem. 2008;39(8):897–8.10.1016/j.orggeochem.2008.06.003Search in Google Scholar
[31] Summons RE, Jahnke LL. Identification of the methylhopanes in sediments and petroleum. Geochim Cosmochim Acta. 1990;54(1):247–51.10.1016/0016-7037(90)90212-4Search in Google Scholar PubMed
[32] Moldowan JM, Fago FJ, Lee CY, Jacobson SR, Watt DS, Slougui NE, et al. Sedimentary 12-n-propylcholestanes, molecular fossils diagnostic of marine algae. Science. 1990;247(4940):309–12.10.1126/science.247.4940.309Search in Google Scholar PubMed
[33] Noble RA, Alexander R, Kagi RI, Knox J. Tetracyclic diterpenoid hydrocarbons in some Australian coals, sediments and crude oils. Geochim Cosmochim Acta. 1985;49(10):2141–7.10.1016/0016-7037(85)90072-9Search in Google Scholar
[34] Noble RA, Alexander R, Kagi RI, Nox JK. Identification of some diterpenoid hydrocarbons in petroleum. Org Geochem. 1986;10(4–6):825–9.10.1016/S0146-6380(86)80019-5Search in Google Scholar
[35] Mackenzie AS, Patience RL, Maxwell JR, Vandenbroucke M, Durand B. Molecular parameters of maturation in the Toarcian shales, Paris Basin, France – I. Changes in the configurations of acyclic isoprenoid alkanes, steranes and triterpenes. Geochim Cosmochim Acta. 1980;44(11):1709–21.10.1016/0016-7037(80)90222-7Search in Google Scholar
[36] Seifert WK, Moldowan JM. Use of biological markers in petroleum exploration. Methods Geochem Geophys. 1986;24:261–90.Search in Google Scholar
[37] Seifert WK, Moldowan JM. The effect of biodegradation on steranes and terpanes in crude oils. Geochim Cosmochim Acta. 1979;43(1):111–26.10.1016/0016-7037(79)90051-6Search in Google Scholar
[38] Farrimond P, Taylor A, TelnÆs N. Biomarker maturity parameters: the role of generation and thermal degradation. Org Geochem. 1998;29(5–7):1181–97.10.1016/S0146-6380(98)00079-5Search in Google Scholar
[39] Alexander R, Larcher AV, Kagi RI, Price PL. Plant-derived biomarkers for the correlation of oils with source rocks in the Cooper/Eromanga Basin System, Australia. APPEA J. 1988;28(1):310–24.10.1071/AJ87024Search in Google Scholar
[40] Strachan MG, Alexander R, Kagi RI. Trimethylnaphthalenes in crude oils and sediments: effects of source and maturity. Geochim Cosmochim Acta. 1988;52(5):1255–64.10.1016/0016-7037(88)90279-7Search in Google Scholar
[41] Radke M, Rullkötter J, Vriend SP. Distribution of naphthalenes in crude oils from the Java Sea: source and maturation effects. Geochim Cosmochim Acta. 1994;58(17):3675–89.10.1016/0016-7037(94)90158-9Search in Google Scholar
[42] Fisher RV. Submarine volcaniclastic rocks. Geol Soc, Lond, Spec Publ. 1984;16(1):5–27.10.1144/GSL.SP.1984.016.01.02Search in Google Scholar
[43] Fisher SJ, Alexander R, Kagi RI. Biodegradation of alkylnaphthalenes in sediments adjacent to an offshore petroleum production platform. Polycycl Aromat Compds. 1995;1(4):35–42.10.1080/10406639608544647Search in Google Scholar
[44] Fisher SJ, Alexander R, Kagi RI, Oliver GA. Aromatic hydrocarbons as indicators of biodegradation in North Western Australian reservoirs. In: Purcell PG, Purcell RR, editors. The sedimentary basins of Western Australia 2: Proceedings of Petroleum Exploration Society of Australia Symposium. Perth, War; 1998. p. 185–94.Search in Google Scholar
[45] Radke M, Welte DH, Willsch H. Geochemical study on a well in the Western Canada Basin: relation of the aromatic distribution pattern to maturity of organic matter. Geochim Cosmochim Acta. 1982;46(1):1–10.10.1016/0016-7037(82)90285-XSearch in Google Scholar
[46] Alexander R, Kagi RI, Rowland SJ, Sheppard PN, Chirila TV. The effects of thermal maturity on distributions of dimethylnaphthalenes and trimethylnaphthalenes in some ancient sediments and petroleums. Geochim Cosmochim Acta. 1985;49(2):385–95.10.1016/0016-7037(85)90031-6Search in Google Scholar
[47] Radke M, Welte DH, Willsch H. Maturity parameters based on aromatic hydrocarbons: Influence of the organic matter type. Org Geochem. 1986;10(1–3):51–63.10.1016/0146-6380(86)90008-2Search in Google Scholar
[48] Radke M, Leythaeuser D, Teichmüller M. Relationship between rank and composition of aromatic hydrocarbons for coals of different origins. Org Geochem. 1984;6:423–30.10.1016/0146-6380(84)90065-2Search in Google Scholar
[49] van Aarssen BG, Bastow TP, Alexander R, Kagi RI. Distributions of methylated naphthalenes in crude oils: indicators of maturity, biodegradation and mixing. Org Geochem. 1999;30(10):1213–27.10.1016/S0146-6380(99)00097-2Search in Google Scholar
[50] Radke M, Willsch H, Leythaeuser D, Teichmüller M. Aromatic components of coal: relation of distribution pattern to rank. Geochim Cosmochim Acta. 1982;46(10):1831–48.10.1016/0016-7037(82)90122-3Search in Google Scholar
[51] Radke M, Welte DH, Yükler MA, Leythaeuser D, Mann U, Ritter U. Organic geochemistry and basin modelling – important tools in petroleum exploration. Geol Soc London Spec Publ. 1983;12(1);237–52.10.1144/GSL.SP.1983.012.01.24Search in Google Scholar
[52] Kvalheim OM, Christy AA, Telnæs N, Bjørseth A. Maturity determination of organic matter in coals using the methylphenanthrene distribution. Geochim Cosmochim Acta. 1987;51(7):1883–8.10.1016/0016-7037(87)90179-7Search in Google Scholar
[53] Alexander R, Strachan MG, Kagi RI, Van Bronswijk W. Heating rate effects on aromatic maturity indicators. Org Geochem. 1986;10(4–6):997–1003.10.1016/S0146-6380(86)80038-9Search in Google Scholar
[54] Cumbers KM, Alexander R. Methylbiphenyl, ethylbiphenyl and dimethylbiphenyl isomer distributions in some sediments and crude oils. Geochim Cosmochim Acta. 1987;51(12):3105–11.10.1016/0016-7037(87)90121-9Search in Google Scholar
[55] Ahmed M, Smith JW. Biogenic methane generation in the degradation of eastern Australian Permian coals. Org Geochem. 2001;32(6):809–16.10.1016/S0146-6380(01)00033-XSearch in Google Scholar
[56] Connan J. The biodegradation of crude oils in reservoirs. Adv Pet Geochem. 1984;1:229–335.10.1016/B978-0-12-032001-1.50011-0Search in Google Scholar
[57] Reed WE. Molecular compositions of weathered petroleum and comparison with its possible source. Geochim Cosmochim Acta. 1977;41(2):237–47.10.1016/0016-7037(77)90231-9Search in Google Scholar
[58] Van Graas GW. Biomarker maturity parameters for high maturities: calibration of the working range up to the oil/condensate threshold. Org Geochem. 1990;16(4–6):1025–32.10.1016/0146-6380(90)90139-QSearch in Google Scholar
[59] Hakimi MH, Abdullah WH, Ahmed AF. Organic geochemical characteristics of oils from the offshore Jiza-Qamar Basin, Eastern Yemen: New insight on coal/coaly shale source rocks. J Pet Sci Eng. 2017;153:23–35.10.1016/j.petrol.2017.03.022Search in Google Scholar
[60] Stewart RO, Alder DA. New South Wales petroleum potential. Vol. 188, Sydney: New South Wales Department of Mineral Resources. 1995.Search in Google Scholar
© 2025 the author(s), published by De Gruyter
This work is licensed under the Creative Commons Attribution 4.0 International License.
Articles in the same Issue
- Research Articles
- Seismic response and damage model analysis of rocky slopes with weak interlayers
- Multi-scenario simulation and eco-environmental effect analysis of “Production–Living–Ecological space” based on PLUS model: A case study of Anyang City
- Remote sensing estimation of chlorophyll content in rape leaves in Weibei dryland region of China
- GIS-based frequency ratio and Shannon entropy modeling for landslide susceptibility mapping: A case study in Kundah Taluk, Nilgiris District, India
- Natural gas origin and accumulation of the Changxing–Feixianguan Formation in the Puguang area, China
- Spatial variations of shear-wave velocity anomaly derived from Love wave ambient noise seismic tomography along Lembang Fault (West Java, Indonesia)
- Evaluation of cumulative rainfall and rainfall event–duration threshold based on triggering and non-triggering rainfalls: Northern Thailand case
- Pixel and region-oriented classification of Sentinel-2 imagery to assess LULC dynamics and their climate impact in Nowshera, Pakistan
- The use of radar-optical remote sensing data and geographic information system–analytical hierarchy process–multicriteria decision analysis techniques for revealing groundwater recharge prospective zones in arid-semi arid lands
- Effect of pore throats on the reservoir quality of tight sandstone: A case study of the Yanchang Formation in the Zhidan area, Ordos Basin
- Hydroelectric simulation of the phreatic water response of mining cracked soil based on microbial solidification
- Spatial-temporal evolution of habitat quality in tropical monsoon climate region based on “pattern–process–quality” – a case study of Cambodia
- Early Permian to Middle Triassic Formation petroleum potentials of Sydney Basin, Australia: A geochemical analysis
- Micro-mechanism analysis of Zhongchuan loess liquefaction disaster induced by Jishishan M6.2 earthquake in 2023
- Prediction method of S-wave velocities in tight sandstone reservoirs – a case study of CO2 geological storage area in Ordos Basin
- Ecological restoration in valley area of semiarid region damaged by shallow buried coal seam mining
- Hydrocarbon-generating characteristics of Xujiahe coal-bearing source rocks in the continuous sedimentary environment of the Southwest Sichuan
- Hazard analysis of future surface displacements on active faults based on the recurrence interval of strong earthquakes
- Structural characterization of the Zalm district, West Saudi Arabia, using aeromagnetic data: An approach for gold mineral exploration
- Research on the variation in the Shields curve of silt initiation
- Reuse of agricultural drainage water and wastewater for crop irrigation in southeastern Algeria
- Assessing the effectiveness of utilizing low-cost inertial measurement unit sensors for producing as-built plans
- Analysis of the formation process of a natural fertilizer in the loess area
- Machine learning methods for landslide mapping studies: A comparative study of SVM and RF algorithms in the Oued Aoulai watershed (Morocco)
- Chemical dissolution and the source of salt efflorescence in weathering of sandstone cultural relics
- Molecular simulation of methane adsorption capacity in transitional shale – a case study of Longtan Formation shale in Southern Sichuan Basin, SW China
- Evolution characteristics of extreme maximum temperature events in Central China and adaptation strategies under different future warming scenarios
- Estimating Bowen ratio in local environment based on satellite imagery
- 3D fusion modeling of multi-scale geological structures based on subdivision-NURBS surfaces and stratigraphic sequence formalization
- Comparative analysis of machine learning algorithms in Google Earth Engine for urban land use dynamics in rapidly urbanizing South Asian cities
- Study on the mechanism of plant root influence on soil properties in expansive soil areas
- Simulation of seismic hazard parameters and earthquakes source mechanisms along the Red Sea rift, western Saudi Arabia
- Tectonics vs sedimentation in foredeep basins: A tale from the Oligo-Miocene Monte Falterona Formation (Northern Apennines, Italy)
- Investigation of landslide areas in Tokat-Almus road between Bakımlı-Almus by the PS-InSAR method (Türkiye)
- Predicting coastal variations in non-storm conditions with machine learning
- Cross-dimensional adaptivity research on a 3D earth observation data cube model
- Geochronology and geochemistry of late Paleozoic volcanic rocks in eastern Inner Mongolia and their geological significance
- Spatial and temporal evolution of land use and habitat quality in arid regions – a case of Northwest China
- Ground-penetrating radar imaging of subsurface karst features controlling water leakage across Wadi Namar dam, south Riyadh, Saudi Arabia
- Rayleigh wave dispersion inversion via modified sine cosine algorithm: Application to Hangzhou, China passive surface wave data
- Fractal insights into permeability control by pore structure in tight sandstone reservoirs, Heshui area, Ordos Basin
- Debris flow hazard characteristic and mitigation in Yusitong Gully, Hengduan Mountainous Region
- Research on community characteristics of vegetation restoration in hilly power engineering based on multi temporal remote sensing technology
- Identification of radial drainage networks based on topographic and geometric features
- Trace elements and melt inclusion in zircon within the Qunji porphyry Cu deposit: Application to the metallogenic potential of the reduced magma-hydrothermal system
- Pore, fracture characteristics and diagenetic evolution of medium-maturity marine shales from the Silurian Longmaxi Formation, NE Sichuan Basin, China
- Study of the earthquakes source parameters, site response, and path attenuation using P and S-waves spectral inversion, Aswan region, south Egypt
- Source of contamination and assessment of potential health risks of potentially toxic metal(loid)s in agricultural soil from Al Lith, Saudi Arabia
- Regional spatiotemporal evolution and influencing factors of rural construction areas in the Nanxi River Basin via GIS
- An efficient network for object detection in scale-imbalanced remote sensing images
- Effect of microscopic pore–throat structure heterogeneity on waterflooding seepage characteristics of tight sandstone reservoirs
- Environmental health risk assessment of Zn, Cd, Pb, Fe, and Co in coastal sediments of the southeastern Gulf of Aqaba
- A modified Hoek–Brown model considering softening effects and its applications
- Evaluation of engineering properties of soil for sustainable urban development
- The spatio-temporal characteristics and influencing factors of sustainable development in China’s provincial areas
- Application of a mixed additive and multiplicative random error model to generate DTM products from LiDAR data
- Gold vein mineralogy and oxygen isotopes of Wadi Abu Khusheiba, Jordan
- Prediction of surface deformation time series in closed mines based on LSTM and optimization algorithms
- 2D–3D Geological features collaborative identification of surrounding rock structural planes in hydraulic adit based on OC-AINet
- Spatiotemporal patterns and drivers of Chl-a in Chinese lakes between 1986 and 2023
- Land use classification through fusion of remote sensing images and multi-source data
- Nexus between renewable energy, technological innovation, and carbon dioxide emissions in Saudi Arabia
- Analysis of the spillover effects of green organic transformation on sustainable development in ethnic regions’ agriculture and animal husbandry
- Factors impacting spatial distribution of black and odorous water bodies in Hebei
- Large-scale shaking table tests on the liquefaction and deformation responses of an ultra-deep overburden
- Impacts of climate change and sea-level rise on the coastal geological environment of Quang Nam province, Vietnam
- Reservoir characterization and exploration potential of shale reservoir near denudation area: A case study of Ordovician–Silurian marine shale, China
- Seismic prediction of Permian volcanic rock reservoirs in Southwest Sichuan Basin
- Application of CBERS-04 IRS data to land surface temperature inversion: A case study based on Minqin arid area
- Geological characteristics and prospecting direction of Sanjiaoding gold mine in Saishiteng area
- Research on the deformation prediction model of surrounding rock based on SSA-VMD-GRU
- Geochronology, geochemical characteristics, and tectonic significance of the granites, Menghewula, Southern Great Xing’an range
- Hazard classification of active faults in Yunnan base on probabilistic seismic hazard assessment
- Characteristics analysis of hydrate reservoirs with different geological structures developed by vertical well depressurization
- Estimating the travel distance of channelized rock avalanches using genetic programming method
- Landscape preferences of hikers in Three Parallel Rivers Region and its adjacent regions by content analysis of user-generated photography
- New age constraints of the LGM onset in the Bohemian Forest – Central Europe
- Characteristics of geological evolution based on the multifractal singularity theory: A case study of Heyu granite and Mesozoic tectonics
- Soil water content and longitudinal microbiota distribution in disturbed areas of tower foundations of power transmission and transformation projects
- Oil accumulation process of the Kongdian reservoir in the deep subsag zone of the Cangdong Sag, Bohai Bay Basin, China
- Investigation of velocity profile in rock–ice avalanche by particle image velocimetry measurement
- Optimizing 3D seismic survey geometries using ray tracing and illumination modeling: A case study from Penobscot field
- Sedimentology of the Phra That and Pha Daeng Formations: A preliminary evaluation of geological CO2 storage potential in the Lampang Basin, Thailand
- Improved classification algorithm for hyperspectral remote sensing images based on the hybrid spectral network model
- Map analysis of soil erodibility rates and gully erosion sites in Anambra State, South Eastern Nigeria
- Identification and driving mechanism of land use conflict in China’s South-North transition zone: A case study of Huaihe River Basin
- Evaluation of the impact of land-use change on earthquake risk distribution in different periods: An empirical analysis from Sichuan Province
- A test site case study on the long-term behavior of geotextile tubes
- An experimental investigation into carbon dioxide flooding and rock dissolution in low-permeability reservoirs of the South China Sea
- Detection and semi-quantitative analysis of naphthenic acids in coal and gangue from mining areas in China
- Comparative effects of olivine and sand on KOH-treated clayey soil
- YOLO-MC: An algorithm for early forest fire recognition based on drone image
- Earthquake building damage classification based on full suite of Sentinel-1 features
- Potential landslide detection and influencing factors analysis in the upper Yellow River based on SBAS-InSAR technology
- Assessing green area changes in Najran City, Saudi Arabia (2013–2022) using hybrid deep learning techniques
- An advanced approach integrating methods to estimate hydraulic conductivity of different soil types supported by a machine learning model
- Hybrid methods for land use and land cover classification using remote sensing and combined spectral feature extraction: A case study of Najran City, KSA
- Streamlining digital elevation model construction from historical aerial photographs: The impact of reference elevation data on spatial accuracy
- Analysis of urban expansion patterns in the Yangtze River Delta based on the fusion impervious surfaces dataset
- A metaverse-based visual analysis approach for 3D reservoir models
- Late Quaternary record of 100 ka depositional cycles on the Larache shelf (NW Morocco)
- Integrated well-seismic analysis of sedimentary facies distribution: A case study from the Mesoproterozoic, Ordos Basin, China
- Study on the spatial equilibrium of cultural and tourism resources in Macao, China
- Urban road surface condition detecting and integrating based on the mobile sensing framework with multi-modal sensors
- Application of improved sine cosine algorithm with chaotic mapping and novel updating methods for joint inversion of resistivity and surface wave data
- The synergistic use of AHP and GIS to assess factors driving forest fire potential in a peat swamp forest in Thailand
- Dynamic response analysis and comprehensive evaluation of cement-improved aeolian sand roadbed
- Rock control on evolution of Khorat Cuesta, Khorat UNESCO Geopark, Northeastern Thailand
- Gradient response mechanism of carbon storage: Spatiotemporal analysis of economic-ecological dimensions based on hybrid machine learning
- Comparison of several seismic active earth pressure calculation methods for retaining structures
- Mantle dynamics and petrogenesis of Gomer basalts in the Northwestern Ethiopia: A geochemical perspective
- Study on ground deformation monitoring in Xiong’an New Area from 2021 to 2023 based on DS-InSAR
- Paleoenvironmental characteristics of continental shale and its significance to organic matter enrichment: Taking the fifth member of Xujiahe Formation in Tianfu area of Sichuan Basin as an example
- Equipping the integral approach with generalized least squares to reconstruct relict channel profile and its usage in the Shanxi Rift, northern China
- InSAR-driven landslide hazard assessment along highways in hilly regions: A case-based validation approach
- Attribution analysis of multi-temporal scale surface streamflow changes in the Ganjiang River based on a multi-temporal Budyko framework
- Maps analysis of Najran City, Saudi Arabia to enhance agricultural development using hybrid system of ANN and multi-CNN models
- Hybrid deep learning with a random forest system for sustainable agricultural land cover classification using DEM in Najran, Saudi Arabia
- Long-term evolution patterns of groundwater depth and lagged response to precipitation in a complex aquifer system: Insights from Huaibei Region, China
- Remote sensing and machine learning for lithology and mineral detection in NW, Pakistan
- Spatial–temporal variations of NO2 pollution in Shandong Province based on Sentinel-5P satellite data and influencing factors
- Numerical modeling of geothermal energy piles with sensitivity and parameter variation analysis of a case study
- Stability analysis of valley-type upstream tailings dams using a 3D model
- Variation characteristics and attribution analysis of actual evaporation at monthly time scale from 1982 to 2019 in Jialing River Basin, China
- Investigating machine learning and statistical approaches for landslide susceptibility mapping in Minfeng County, Xinjiang
- Investigating spatiotemporal patterns for comprehensive accessibility of service facilities by location-based service data in Nanjing (2016–2022)
- A pre-treatment method for particle size analysis of fine-grained sedimentary rocks, Bohai Bay Basin, China
- Study on the formation mechanism of the hard-shell layer of liquefied silty soil
- Comprehensive analysis of agricultural CEE: Efficiency assessment, mechanism identification, and policy response – A case study of Anhui Province
- Simulation study on the damage and failure mechanism of the surrounding rock in sanded dolomite tunnels
- Towards carbon neutrality: Spatiotemporal evolution and key influences on agricultural ecological efficiency in Northwest China
- High-frequency cycles drive the cyclical enrichment of oil in porous carbonate reservoirs: A case study of the Khasib Formation in E Oilfield, Mesopotamian Basin, Iraq
- Reconstruction of digital core models of granular rocks using mathematical morphology
- Spatial–temporal differentiation law of habitat quality and its driving mechanism in the typical plateau areas of the Loess Plateau in the recent 30 years
- A machine-learning-based approach to predict potential oil sites: Conceptual framework and experimental evaluation
- Effects of landscape pattern change on waterbird diversity in Xianghai Nature Reserve
- Research on intelligent classification method of highway tunnel surrounding rock classification based on parameters while drilling
- River morphology and tectono-sedimentary analysis of a shallow river delta: A case study of Putaohua oil layer in Saertu oilfield (L. Cretaceous), China
- Dynamic change in quarterly FVC of urban parks based on multi-spectral UAV images: A case study of people’s park and harmony park in Xinxiang, China
- Review Articles
- Humic substances influence on the distribution of dissolved iron in seawater: A review of electrochemical methods and other techniques
- Applications of physics-informed neural networks in geosciences: From basic seismology to comprehensive environmental studies
- Ore-controlling structures of granite-related uranium deposits in South China: A review
- Shallow geological structure features in Balikpapan Bay East Kalimantan Province – Indonesia
- A review on the tectonic affinity of microcontinents and evolution of the Proto-Tethys Ocean in Northeastern Tibet
- Advancements in machine learning applications for mineral prospecting and geophysical inversion: A review
- Special Issue: Natural Resources and Environmental Risks: Towards a Sustainable Future - Part II
- Depopulation in the Visok micro-region: Toward demographic and economic revitalization
- Special Issue: Geospatial and Environmental Dynamics - Part II
- Advancing urban sustainability: Applying GIS technologies to assess SDG indicators – a case study of Podgorica (Montenegro)
- Spatiotemporal and trend analysis of common cancers in men in Central Serbia (1999–2021)
- Minerals for the green agenda, implications, stalemates, and alternatives
- Spatiotemporal water quality analysis of Vrana Lake, Croatia
- Functional transformation of settlements in coal exploitation zones: A case study of the municipality of Stanari in Republic of Srpska (Bosnia and Herzegovina)
- Hypertension in AP Vojvodina (Northern Serbia): A spatio-temporal analysis of patients at the Institute for Cardiovascular Diseases of Vojvodina
- Regional patterns in cause-specific mortality in Montenegro, 1991–2019
- Spatio-temporal analysis of flood events using GIS and remote sensing-based approach in the Ukrina River Basin, Bosnia and Herzegovina
- Flash flood susceptibility mapping using LiDAR-Derived DEM and machine learning algorithms: Ljuboviđa case study, Serbia
- Geocultural heritage as a basis for geotourism development: Banjska Monastery, Zvečan (Serbia)
- Assessment of groundwater potential zones using GIS and AHP techniques – A case study of the zone of influence of Kolubara Mining Basin
- Impact of the agri-geographical transformation of rural settlements on the geospatial dynamics of soil erosion intensity in municipalities of Central Serbia
- Where faith meets geomorphology: The cultural and religious significance of geodiversity explored through geospatial technologies
- Applications of local climate zone classification in European cities: A review of in situ and mobile monitoring methods in urban climate studies
- Complex multivariate water quality impact assessment on Krivaja River
- Ionization hotspots near waterfalls in Eastern Serbia’s Stara Planina Mountain
- Shift in landscape use strategies during the transition from the Bronze age to Iron age in Northwest Serbia
- Assessing the geotourism potential of glacial lakes in Plav, Montenegro: A multi-criteria assessment by using the M-GAM model
- Flash flood potential index at national scale: Susceptibility assessment within catchments
- SWAT modelling and MCDM for spatial valuation in small hydropower planning
- Disaster risk perception and local resilience near the “Duboko” landfill: Challenges of governance, management, trust, and environmental communication in Serbia