GIS-based frequency ratio and Shannon entropy modeling for landslide susceptibility mapping: A case study in Kundah Taluk, Nilgiris District, India
-
Harithaa Senthilkumar

 and
Evany Nithya Selvaraj
and
Evany Nithya Selvaraj

Abstract
In the Nilgiris district of the Western Ghats, landslides pose a recurrent threat, necessitating accurate landslide susceptibility mapping (LSM) to designate high-risk zones and mitigate the potential loss of lives and property. Kundah taluk in the Nilgiris has witnessed an increasing number of landslide events in recent years, primarily attributed to heavy monsoon rainfall, steep terrain and human-induced factors. This highlights the necessity for mapping landslide susceptibility and effective planning. Two bivariate statistical models were employed to evaluate the landslide susceptibility: Frequency ratio (FR) and Shannon entropy (SE). A comprehensive database of past landslides was compiled using satellite imagery and surveying the study region. In total, 581 landslide locations were identified. Two datasets containing 407 landslides (70% of the total) for model development and 174 landslides (30%) for validation were randomly selected from the total number of landslides using GIS. Slope, aspect, soil, elevation, land use and land cover, drainage density, normalized difference vegetation index, geomorphology, road, lineament density and rainfall patterns were the 11 landslide conditioning elements considered for the modeling process. Validation of the FR and SE models using the receiver operating characteristic curve yielded prediction accuracies of 81.6 and 82%, respectively. The SE model was the most realistic and reliable for landslide identification and prediction, followed by the FR model. The derived LSMs for the area can enhance decision-making in landslide management and guide strategic planning for the Kundah taluk in the Nilgiris, ultimately helping to prevent future landslide events.
1 Introduction
Natural disasters pose a continual threat to people and their possessions, often manifesting unexpectedly and causing widespread damage. Consequently, individuals and communities have consistently strived to reduce the impacts and spatial occurrence of these risks. Landslides are among the most destructive natural calamities, leading to significant loss of life and property damage. Natural disasters such as earthquakes and rainfall can trigger them [1]. The cutting of slope bases, deforestation, tourism, poor drainage systems and vibrations on unstable and steep slopes are some of the human activities that contribute to landslides.
Landslides are natural hazards responsible for numerous casualties and substantial property losses worldwide [2]. Although it is impossible to eliminate the risks posed by natural catastrophes such as landslides, earthquakes, floods and severe droughts, their impacts can be mitigated by implementing effective processes and measures. Landslides are among the most prevalent geological events that can happen anywhere in the region. They occur because of natural or man-made events that cause massive volumes of rock, dirt or debris to slide down a slope [3].
In India, landslides are more frequent in the southern Ghats, the northern Himalayas and the northeastern mountain ranges. Landslides are primarily triggered by seismic events and precipitation in North India, while high rainfall is the primary cause in the Western Ghats. Rainfall-induced landslides typically manifest as flow and slide-type movements, which can be extremely dangerous, unpredictable and rapid [4]. Fine soil can generate earth flows or creep in flow-type landslides, while coarse soil can produce debris flows [5]. Landslides are unforeseeable events that occur suddenly and leave little time for preparation. Thus, mapping landslide susceptibility is essential for locating areas vulnerable to landslides.
Landslides and their impact pose a significant challenge for many countries, especially developing countries. In recent decades, landslides have accounted for nearly 9% of the global natural hazards [6]. In India, they are persistent in the Western Ghats and region of the Himalayas. With snow-covered areas excluded, landslide threats affect around 0.42 million km2 or 12.6% of India’s total geographical area. Of this, about 0.09 million km2 are found in the Konkan Hills and Western Ghats (GSI, 2023).
India ranks fourth globally in terms of landslide risk, with casualty rates exceeding one death per 100 km2. This is largely due to its diverse geography, varying climate and seismic activity, which have contributed to numerous significant landslides in recent years. The Himalayan region, with its young and fragile mountains, experiences frequent landslides, particularly in states such as Uttarakhand, Himachal Pradesh and Sikkim during the monsoon season. About 15% of the Indian Himalayas are extremely vulnerable to landslides, leading to considerable loss of life and infrastructure, as exemplified by the 2013 Kedarnath disaster, which resulted in over 6,000 fatalities. In 2020, heavy rains triggered landslides in Rudraprayag and Tehri Garhwal, while the 2021 Chamoli disaster caused widespread damage, affecting Kinnaur and Nainital. Landslides continued in 2022 in Chamoli and Joshimath and the trend worsened in 2023 with intensified rainfall in Kullu-Manali and Kinnaur. By 2024, monsoon-triggered landslides disrupted transportation in Shimla and Mandi.
The Northeastern region, including Assam, Mizoram, Meghalaya and Manipur, is susceptible to frequent landslides triggered by heavy monsoon rains. In 2020, landslides affected communities and infrastructure in Mizoram and Assam, with repeated incidents occurring in 2021, especially in Meghalaya. In 2022 and 2023, Assam and Manipur were severely impacted, resulting in significant casualties, particularly in Noney, Manipur. The frequency of landslides persisted in 2024, with Assam and Meghalaya continuing to experience disruptions that further impacted transportation and local infrastructure.
The Western Ghats experienced severe landslides across Maharashtra, Kerala, Karnataka and Tamil Nadu, impacting key areas like Raigad, Idukki and the Nilgiris. In 2020, landslides in Raigad and Idukki resulted in fatalities, followed by major incidents in 2021 in Kavalappara, Kerala and Taliye, Maharashtra. In 2022, landslides in the Nilgiris and Idukki blocked roads and displaced residents. This trend persisted, with monsoon-triggered landslides reported in Raigad, Wayanad and other regions in 2023 and continuing into 2024, particularly in the hilly terrains of Idukki, Kannur, Wayanad, Coorg and Kodagu. The Geological Survey of India reported an increase in vulnerable locations in the Nilgiris from 101 in 2001 to over 300 by 2019, underscoring the escalating landslide risk in the region.
Kundah Taluk, in the Nilgiris District, is particularly vulnerable to landslides, owing to its steep terrain, clay-based soil and heavy monsoon rains. The region has witnessed significant landslide events including the 2,000 incident that blocked NH-67 and the fatal landslide in Kinnakorai in 2005. Monsoon seasons in 2019 and 2020 saw severe landslides, including the one near the TNEB colony in Emerald, triggered by 34.6 cm of rainfall in just 24 h, which disrupted infrastructure and displaced residents. Other incidents, such as those in Manjoor and Burliar Villages, have also caused property damage and loss of life. Ongoing construction activities, particularly those related to the Sillahalla hydroelectric initiative, have further exacerbated this situation. In December 2022, a major slide occurred near Uyilatti Falls in Kotagiri, cutting off access to ten villages around Kukkalthorai. And the Mettupalayam-Coonoor route disrupted transport in July 2023. In November 2023, slides near Kunjappanai blocked the Kotagiri-Mettupalayam road, leading to school closures in Kundah. In early 2024, landslides in the Hillgrove and Kallar areas temporarily suspended the Nilgiris toy train. Rapid urbanization and expanding infrastructure, especially transportation networks, have intensified landslide occurrences in the densely populated Western Ghats of southern India, heightening the vulnerability of local communities compared to those in the northern and northeastern regions [7].
It is crucial to study the susceptibility to landslides in that area to understand its severe impacts on human life and economic resources [8]. Few researchers have investigated the Nilgiris district, yielding promising results. However, this study differs from that by incorporating more causative factors. Landslides are highly complex phenomena shaped by various natural factors, including terrain, rainfall, earthquakes, lithology, geologic structure and human activity [9]. Consequently, some regions are more susceptible to landslides than other disasters.
Landslide inventory and susceptibility maps serve as crucial decision-making tools, providing essential data to inform disaster prevention and mitigation strategies. A widely used method to mitigate landslide damage is to create landslide susceptibility maps (LSMs) by employing appropriate models and identifying effective conditioning variables [10,11]. Landslide susceptibility reflects the spatial likelihood of landslides based on the regional topography [12].
In recent decades, numerous studies have contributed to the advancement of mapping landslide susceptibility using quantitative and qualitative methodologies. These methods include the frequency ratio (FR) model [2,13–17], logistic regression [8,17,18], decision and regression tree models [19], knowledge-based techniques [20], discriminant and factor analysis [21], multi-criteria decision-making methods [22,23] or analytic hierarchy process [24–27], deterministic methods [28], slope stability assessment [29] and safety factor analysis [30]. More advanced approaches include neural networks [31], Shannon entropy (SE) models [15,32–34], certainty factor [8,26], FR coupled with random forest [35], fuzzy logic approach [16,18,36], weight of evidence model [37–39], information value models [9,14,40] and random forest [19,41]. Recent advancements in remote sensing (RS), computational science, space-borne technology and GIS have made susceptibility mapping and its evaluation significantly more accessible and efficient.
The Nilgiris District, a part of the Western Ghats, frequently experiences landslides due to intense monsoon rainfall, leading to significant property and infrastructure damage. Rajakumar et al. [42] showed how overlay analysis can identify landslide-prone locations by mapping landslide susceptibility in hilly terrain using geospatial technology and spatial analysis. Nithya et al. used fuzzy logic to map landslide susceptibility at Kundahpallam Watershed in the Nilgiris, effectively addressing data uncertainties to produce a risk zonation map [43]. Ganapathy & Rajawat and Thennavan et al. discussed severe landslide events in the Nilgiris with approximately 300 landslides reported within 48 h, resulting in 42 fatalities and extensive damage, including road and railway blockages [36,44]. Guru et al. [45] conducted a study on landslide susceptibility in the Nilgiris District evaluating the effectiveness of probabilistic models in identifying areas prone to landslides. Saranaathan et al. [46] employed the FR approach and GIS to develop a landslide susceptibility zonation map, identifying critical landslide-prone areas along the SH 37 Ghat Road in Nilgiris. Thennavan et al. [47] developed probabilistic rainfall thresholds for predicting shallow landslide initiation in the Nilgiris District, to better understand the hazards associated with rainfall-induced landslides. Yuvaraj and Dolui [48] used binary logistic regression and FR to produce an LSM of the Nilgiris. To improve the precision of risk assessment, Jennifer et al. [49] investigated the accuracy of FR and logistic regression models in mapping the likelihood of landslides in the Nilgiris District. Sujatha and Sridhar identified important landslide-inducing factors in Coonoor, India, using a logistic regression model for a landslide susceptibility study [17]. A spatial pattern study of the Nilgiris District’s landscape by Aswinth et al. provided insight into the dynamics of land use and their implications for environmental management [50].
Suraj et al. [51] developed a highly accurate LSM for the middle highland region of Kerala’s Chaliyar River Basin, by integrating FR and SE methods. Sarkar et al. [33] employed satellite imagery and GIS-based statistical techniques in Himachal Pradesh’s Kullu District, revealing that FR and SE techniques were the most effective methods for identifying landslide-prone areas.
The hilly areas of Kundah Taluk have a history of numerous landslides along steep slopes and road cuttings. The complex interaction of delicate geomorphology, rugged terrain, heavy rainfall and human infrastructure, such as roads built in steep mountainous areas, has led to landslides in the Kundah taluk highlands. It is essential to assess and map areas prone to landslides using various techniques to plan sustainable land use [20]. Such mapping efforts can significantly reduce the economic losses caused by landslides and promote sustainable economic development. Moreover, these maps are vital for managing roadside disasters and facilitating well-planned sustainable development projects.
Kundah Taluk is currently facing a serious landslide risk owing to its steep topography, fragile geology and heavy monsoonal rainfall. Increased land use, tourism and urbanization exacerbate this vulnerability. The mapping of landslides in this area is a vital management strategy. This proactive approach helps to protect communities, amenities and the surroundings from the impacts of natural calamities, ensuring better preparedness and response efforts. In comparison with previous studies, we have chosen eleven prominent factors and compared the FR and SE techniques, which were not previously utilized for this study area and the obtained results show promise for disaster mitigation strategies.
The aim of this study is to create a comprehensive LSM for Kundah Taluk, Nilgiris District, India, using a GIS-based methodology incorporating FR and SE approaches to support disaster risk reduction and management efforts. By employing these statistical techniques, this study addresses the limitations of conventional deterministic approaches, which often overlook parameter variability and uncertainty. Kundah taluk currently lacks a dedicated LSM. Recent landslides have highlighted the need for region-specific mapping to enhance preparedness and mitigation measures. This study provides critical and accurate risk assessments to support local authorities in landslide-prone areas, enabling effective risk management and mitigation. Additionally, this study provides a valuable resource and reference for further studies on landslide susceptibility assessments in other regions, highlighting its practical significance.
2 Materials
2.1 Study area description
The mountainous Kundah Taluk, located in the Nilgiris district of Tamil Nadu, lies within the vulnerable Western Ghats range. The elevation ranges from 740 to 2,625 m above the mean sea level at the Doddabetta peak. Geographically, Kundah Taluk is positioned at a longitude of 76.6482°E and a latitude of 11.2810°N, covering an area of 331 km2. The taluk’s climatic characteristics include wind speeds fluctuating between 5 and 5.4 km/h, with an average relative humidity of approximately 77%. Rainfall varies from 400 to 417 mm. The region’s geology is shaped by tectonic forces, rolling hills, weathering, erosion, valleys and plateaus, predominantly underlain by charnockite associated with granite and gneisses. Colluvial fills, shallow pediments and deep pediments are identified as landslide-prone geomorphological areas. The taluk features diverse land uses, including water bodies, tea plantations, settlements, open forests and agro-horticultural plantations. However, the area is structurally prone to disturbance and faulting, leading to frequent landslides. Consequently, the region experiences property damage, loss of life and regular disruptions in road networks and communication. The location map of the study area is shown in Figure 1.
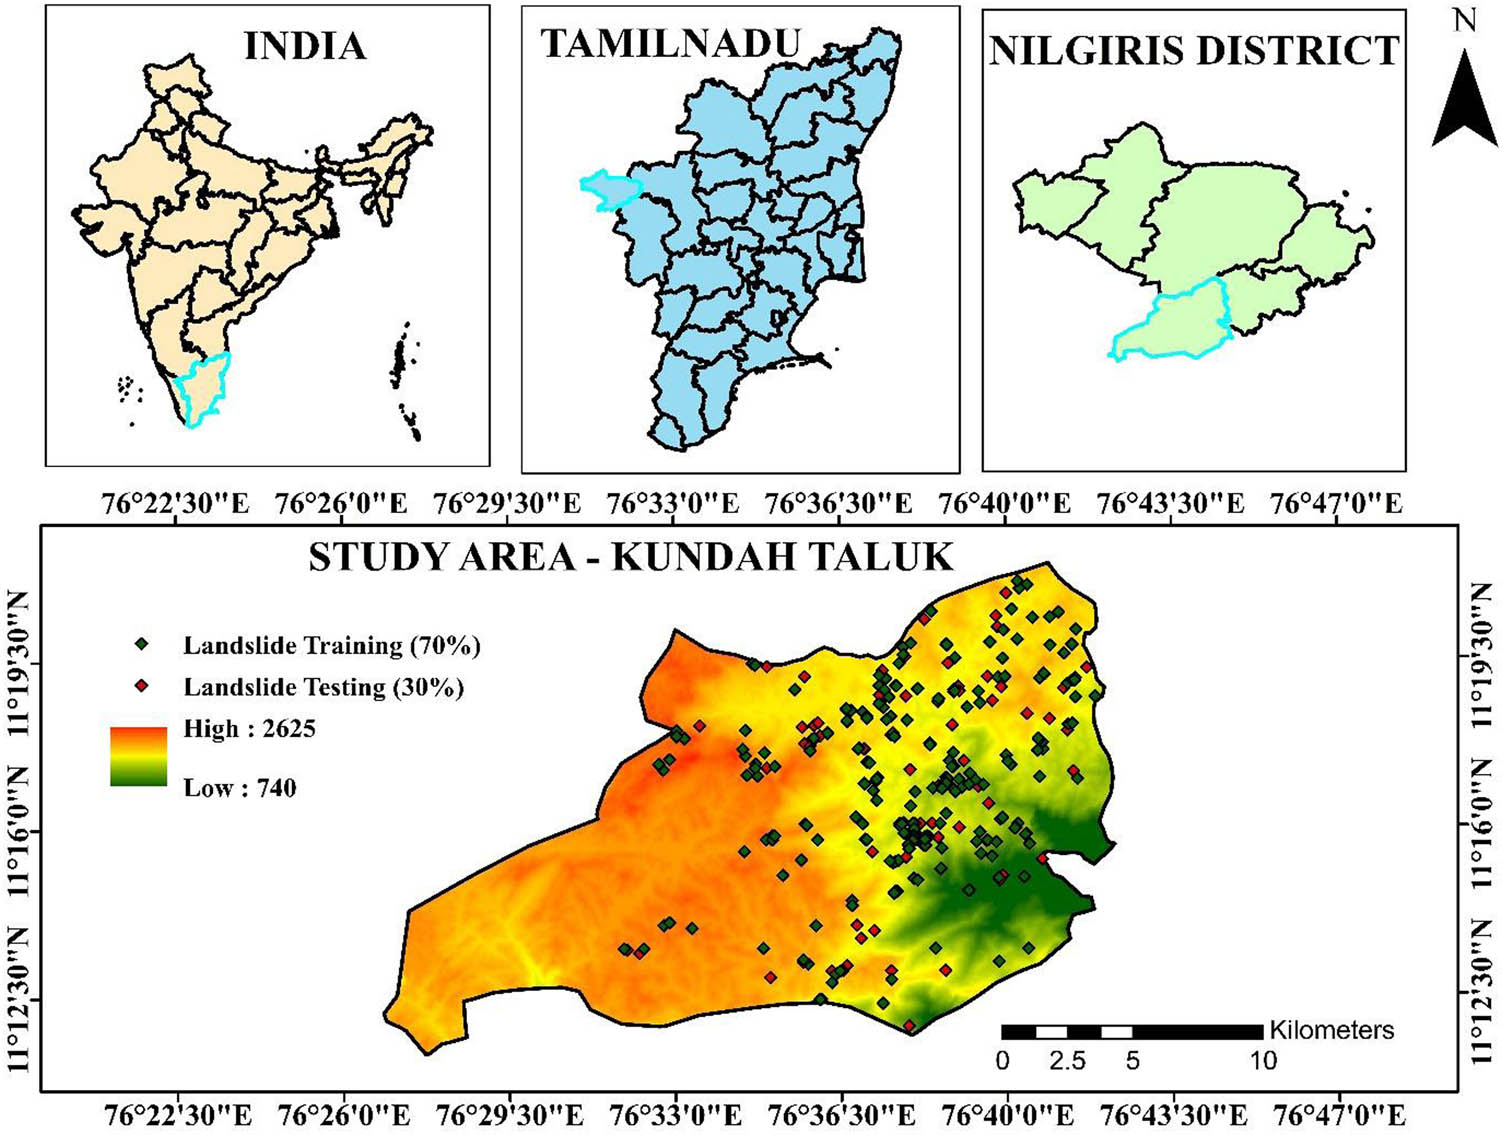
Location map of the study area.
2.2 Landslide inventory map
Landslide events in a region, including their distribution, distortion patterns, repetition, dominant type and quantitative characteristics associated with slope failures, were assessed using landslide inventory maps. Furthermore, the evaluation of the geographical possibility of landslide initiation and runoff, along with the likelihood of possible landslide sizes for a specific return duration, is made possible using landslide inventory maps [52]. A visual inspection of Google Earth imagery, in-depth field surveys, a review of previous landslide records in pertinent literature, the analysis of satellite photos, technical and scientific papers and databases maintained by the government were all included in creating a landslide inventory. In this study, 581 landslide locations were found and mapped as point features on the inventory map, which were split into datasets for training and testing as depicted in Figure 1. Utilizing the subset features tool in ArcGIS 10.8.2, this study systematically partitions the landslide inventory data into training and testing sets while preserving multipart features, facilitating model development and accuracy assessment. Although there is no universal standard for partitioning landslide occurrences into training and testing datasets, it is common practice in many research studies to allocate 70% (407) of the landslide events for training datasets, which are used to build the weight system for the contributing factor for generating a LSM and 30% (174) of past landslides are reserved for the model’s validation and performance evaluation [53]. Figure 2 shows a flowchart of the methodology.
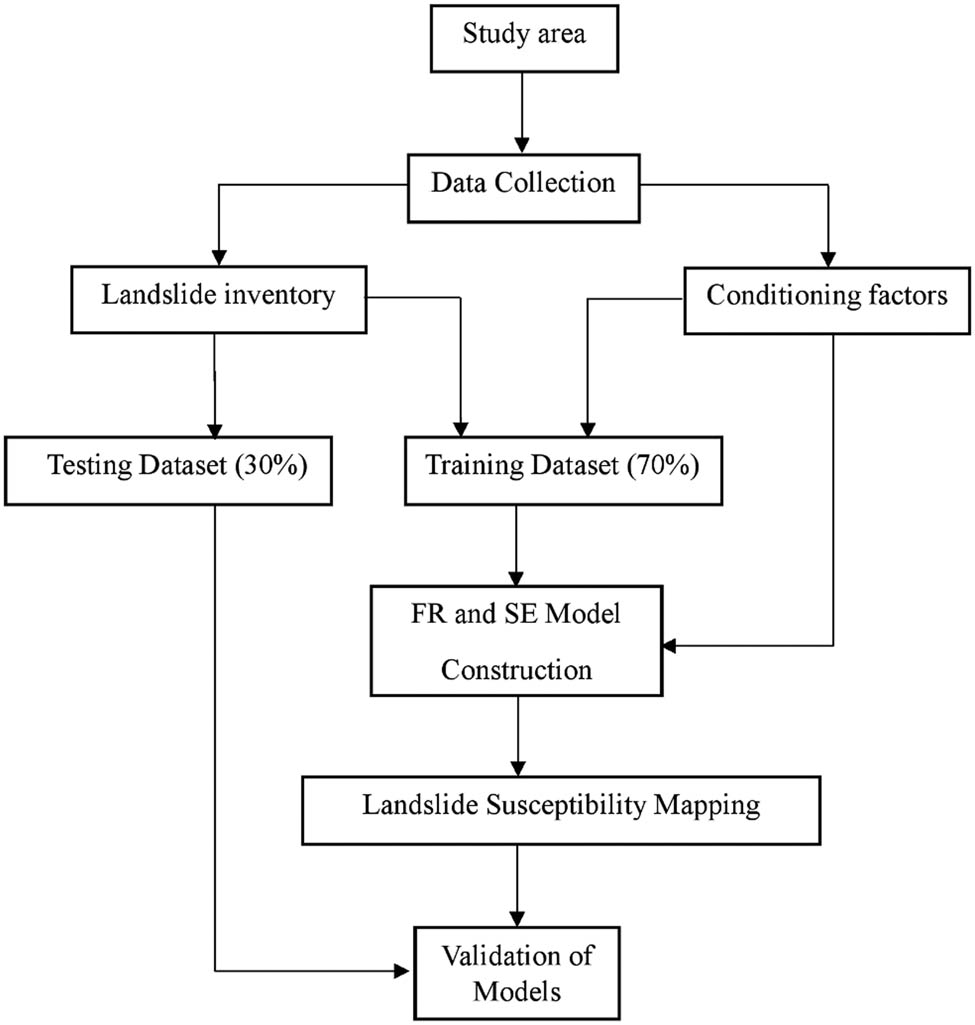
Methodology flow chart.
2.3 Landslide conditioning influencing factors
A crucial stage in mapping landslide susceptibility is selecting the conditioning factors that will serve as input variables in the model. The accuracy, resolution and reliability of the input data substantially influence the outcomes of the statistical models. Slope, elevation, soil, aspect, Normalized difference vegetation index (NDVI), lineament density, rainfall, land use and land cover (LULC), drainage density, geomorphology and road are the conditioning elements listed in Table 1 used in this study [34].
Details of causative factors and their sources utilized in the study area
| Factors | Description | Type | Scale/resolution | Source |
|---|---|---|---|---|
| DEM | Shuttle radar topography mission DEM | Continuous | 30 m | USGS Earth Explorer https://earthexplorer.usgs.gov |
| Slope | Derived from DEM | Continuous | 30 m | USGS Earth Explorer https://earthexplorer.usgs.gov |
| Elevation | Derived from DEM | Continuous | 30 m | USGS Earth Explorer https://earthexplorer.usgs.gov |
| Aspect | Derived from DEM | Continuous | 30 m | USGS Earth Explorer https://earthexplorer.usgs.gov |
| Soil | FAO World Soil Map | Discrete | 30 m | www.fao.org |
| Lineament density | Bhuvan-ISRO Geo-portal | Continuous | 1:50,000 | Bhuvan NRSC https://bhuvan.nrsc.gov.in/ |
| Drainage density | Derived from DEM | Continuous | 30 m | USGS Earth Explorer https://earthexplorer.usgs.gov |
| NDVI | Derived from Landsat 8 Satellite imagery | Continuous | 30 m | USGS Earth Explorer https://earthexplorer.usgs.gov |
| LULC | Derived from Landsat 8 Satellite imagery | Continuous | 30 m | USGS Earth Explorer https://earthexplorer.usgs.gov |
| Geomorphology | Bhuvan- ISRO Geo-portal | Discrete | 1:50,000 | Bhuvan NRSC https://bhuvan.nrsc.gov.in/ |
| Road | Digitized | Continuous | Polyline Data | Google Earth |
| Rainfall | Indian meteorological department | Continuous | In millimeters | http://www.imd.pune.gov.in |
2.4 Slope
The slope exerts a substantial impact on landslide incidence and significantly influences the water flow on the surface, which directly affects the surface runoff and penetration [54]. The risk of landslides escalates with steeper slopes due to increased shearing stress and gravitational forces. For this investigation, a slope angle map was produced from a digital elevation model (DEM) and categorized into four subclasses: nearly level (0°–3°), moderate slope (3°–10°), steep (10°–35°) and very steep (>35°) (Figure 3a).
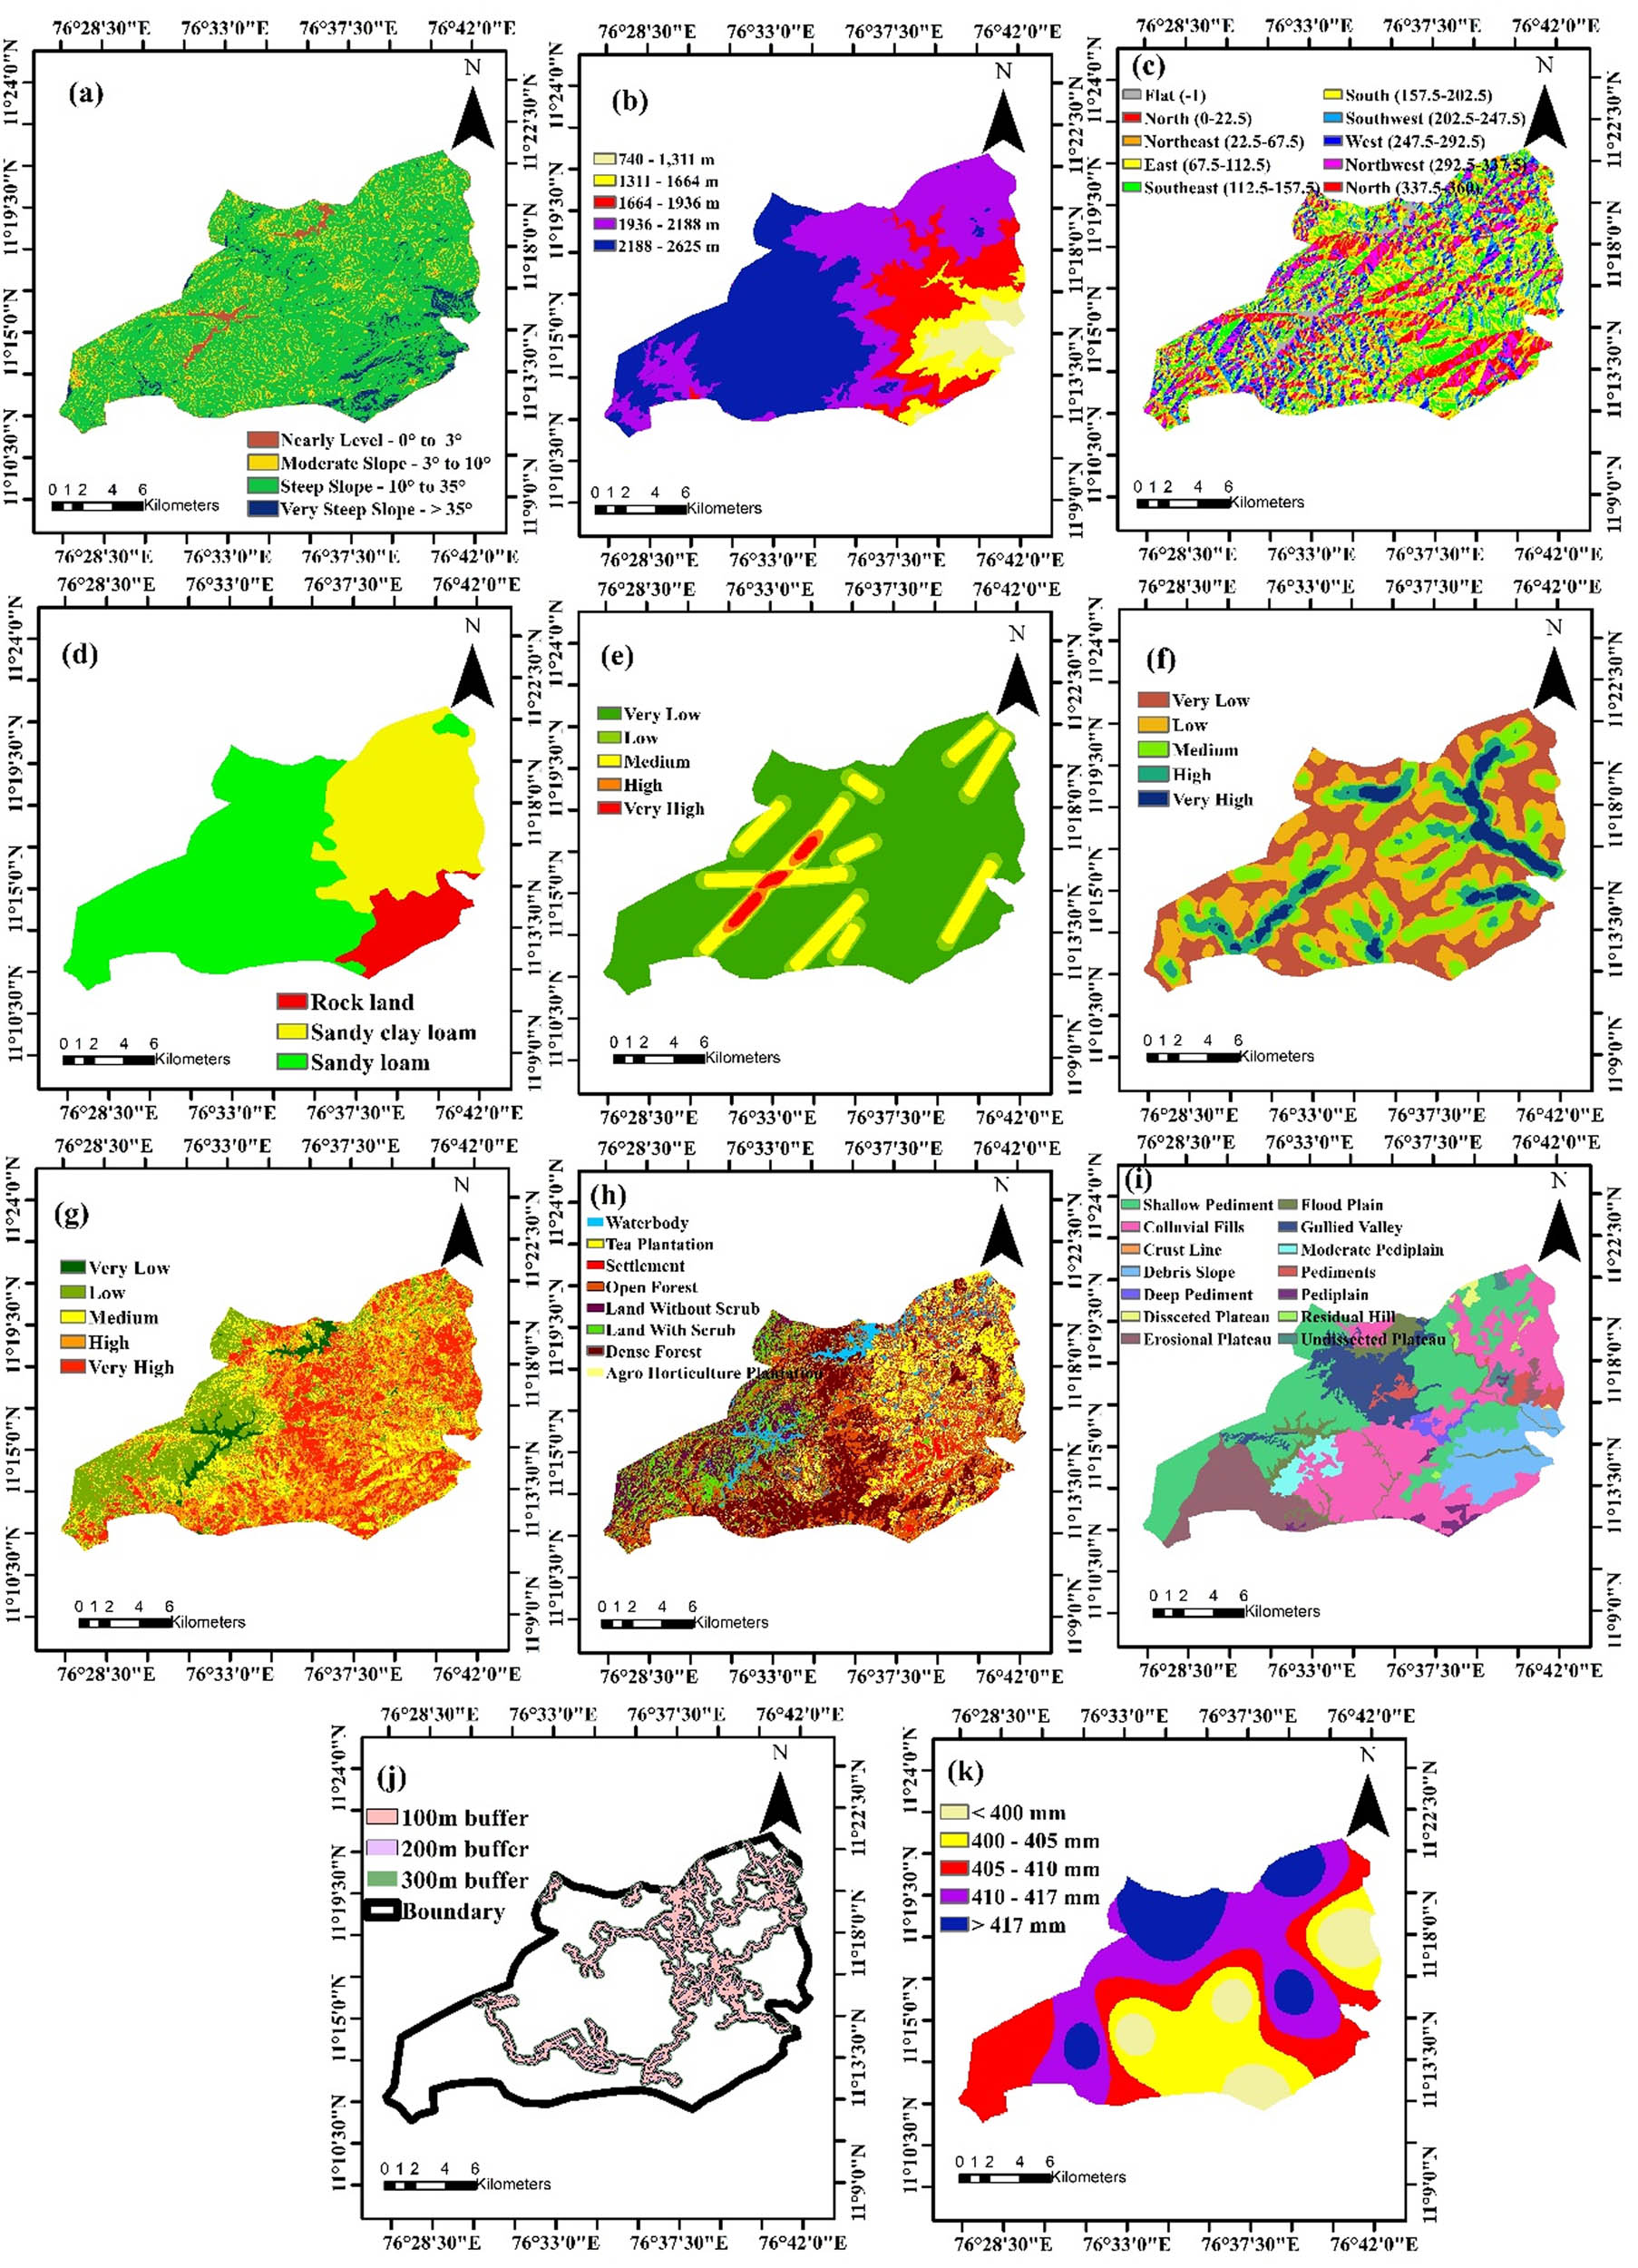
Distribution of Landslide evaluative factors: (a) Slope, (b) elevation, (c) aspect, (d) soil, (e) lineament density, (f) drainage density, (g) NDVI, (h) LULC, (i) geomorphology, (j) road and (k) rainfall.
2.5 Elevation
Elevation measures a landscape’s height above sea level, with landslides more likely to occur at higher elevations than lower ones. Soil strength at higher elevations may be less robust than at lower elevations [8]. Moreover, the elevation of the region affects rock weathering and the effects of snow and rain. Landslide occurrences are influenced by elevation, especially in hilly regions characterized by moderate to steep slopes, abundant rainfall and limited vegetation cover [10]. The elevation map of Kundah Taluk shows values ranging from 740 to 2,625 m (Figure 3b).
2.6 Aspect
Aspect significantly influences a location’s susceptibility to landslides due to the effects of the sun, wind and precipitation [55]. The slope aspect also indirectly impacts soil moisture and vegetation. For this study, the aspect map generated from a DEM was classified into ten directional categories: flat, east, north, south, northwest, southwest, north, southeast, northeast and west (Figure 3c).
2.7 Soil
Soil is a fundamental factor in landslide events, primarily due to its composition and texture. Soil texture, combined with erosion affects properties such as permeability and cohesion, which influence the nature and intensity of slope movement and have a significant impact on landslide susceptibility [56–58]. Due to the region’s steep slopes and heavy rainfall, landslides are common in the sandy clay loam, sandy loam and rock land soil types (Figure 3d). Studies have indicated that soil erosion, particularly in regions with fine-textured soils, accelerates the initiation of landslides. Removing topsoil, particularly in locations where structural integrity is compromised by fractures, exacerbates the landslide risk [59]. Consequently, understanding the interaction between soil texture and erosion is essential for effective landslide mapping and risk assessment in Kundah Taluk.
2.8 Lineament density
Lineament density is a key factor in assessing landslide susceptibility. Lineaments, often associated with fault zones, fractures and other structural features, influence slope stability by creating weak zones. They indicate the surface indicators of underlying structural elements, revealing areas of faulting and fracturing [60]. Elevated lineament densities often correspond to areas with increased geological disturbances, making these regions more prone to landslides [61]. A lineament density map, prepared using the ArcGIS spatial analysis tool, highlights the concentration of linear structural features that influence landslide susceptibility. The map is categorized into five classes, namely, very high, high, medium, low and very low (Figure 3e).
2.9 Drainage density
The drainage density was determined by dividing the cumulative stream length by the total area under study. Regions with high drainage density usually have more intense drainage networks, accompanied by erosion along drainage lines, which increases the risk of landslides [62]. Inadequate drainage systems near roads and infrastructure also elevate landslide risk by increasing water absorption and weakening soil strength. Five drainage density classes were identified as very low, low, medium, high and very high (Figure 3f).
2.10 NDVI
In this study, the NDVI was derived from Landsat 8 imagery collected in August 2023. This period aligns with the region’s growing season, characterized by peak vegetation due to the southwest monsoon rains, providing optimal conditions for accurate NDVI analysis. The NDVI effectively reflects the influence of plant cover on soil stability and slope hydrology, making it a valuable indicator for assessing landslide susceptibility [63] (equation (1)).
The NDVI map of Kundah Taluk was created for this study using the following calculation formula:
where R stands for the electromagnetic spectrum’s red bands and NIR is the Earth’s surface reflectance in the near-infrared channel. The categorization of NDVI is shown in Figure 3g.
2.11 LULC
The LULC is a critical factor in determining the occurrence of landslides. They significantly influence the durability of slope materials and control the water content within the slopes. For instance, plant roots help to stabilize sandy slopes and are generally considered to reinforce them. The land use map for Kundah Taluk was produced through data collection, RS and GIS analysis. Initial data were gathered from Landsat 8 satellite imagery followed by field surveys. The collected information was used to perform supervised classification of the images into distinct land use categories, such as agro-horticulture plantations, open forest, land without scrub, settlements, dense forest, land with scrub, tea plantations and water bodies (Figure 3h). Using GIS software, the data were processed to create land use patterns and their implications for disaster risk management in the region.
2.12 Geomorphology
The geomorphological map offers valuable insights into the processes of lithology, constructions and geographical elements that influence landslide susceptibility by highlighting critical geomorphic units, landforms and fundamental geological features. In Kundah, shallow pediments comprise 20% of the region, whereas colluvial fills make up 50% of the overall area. Some of the distinctive features observed in Kundah Taluk are dissected plateaus, undissected plateaus, residual hills, debris slopes, pediments, shallow pediments, floodplains, deep pediments, moderate pediplains, colluvial fills, crust lines, gullied valleys, pediplain and erosional plateaus (Figure 3i).
2.13 Road
Landslides frequently occur near and along road slopes. Particularly in hilly areas, uncontrolled road excavation weakens the surrounding rock mass. An important human component to consider when assessing a site’s susceptibility to landslides is its proximity to roads. The existence or lack of road networks in an area influences the probability of landslides [64]. Roadside excavation and vegetation removal during road construction can trigger landslides. Consequently, proximity to the roads is a significant factor in landslide studies [8]. The road proximity was categorized into three buffer distances: <100 m, 100–200 m and 200–300 m with intervals of 100 m (Figure 3j).
2.14 Rainfall
Rainfall triggers landslides. Excessive rainfall saturates the soil, increasing its weight and reducing shear strength owing to higher pore water pressure within the slope materials [3]. Rainfall is the primary trigger of landslides on hilly slopes. Rainfall quantity and intensity are influenced by topographical features, which vary across space and time, thus impacting landslide susceptibility in the region [65]. Monthly rainfall data for Kundah Taluk were obtained from rain gauge stations (Kil Kundah, Kil Kundah 2, Balacola 2, Ithalar and Ithalar 2) provided by the Indian Meteorological Department’s database. Five different categories were created from the data by applying the inverse distance weighted approach (Figure 3k) to map the amount of rainfall.
2.15 LSM
LSM involves the creation of maps that identify areas at risk of landslides based on a range of influencing factors. The two bivariate models used in this study are the FR and the SE models. The resulting LSM is used to pinpoint high-risk regions for focused intervention and mitigation measures. Both models aim to enhance land use planning and disaster risk reduction strategies.
2.16 FR model
The FR model was used to quantify the likelihood of a relationship between several influencing factors. This technique helps to predict the development of landslide trends and better identify the key factors contributing to their occurrence [23]. A ratio greater than 1 indicates a strong relationship between the factors, while a ratio less than 1 suggests a moderate correlation. For each contributing factor, the FR is computed for every subclass of causative factors by dividing the percentage of landslide occurrences by the percentage of pixel area occupied [66,67], as shown in equation (2).
Following equation (3), the FRs of all causative factors considered were added to determine the landslide susceptibility index (LSI).
A higher LSI value indicates a greater susceptibility to landslide, while a lower value signifies a reduced likelihood of landslide occurrence.
2.17 SE model
Shannon’s entropy has been widely applied in evaluating landslide susceptibility, utilizing knowledge-based weightings for various parameter subcategories to account for regional variations [8,15]. This method provides a quantitative measure of a system’s instability, inequality and unpredictability, while also offering insights into the future trends of specific systems.
To evaluate the environmental dissimilarity and examine the potential impact of each element on landslide occurrence, the present study has employed Shannon’s entropy technique. Higher values of the entropy index indicate that a factor has a larger effect on landslides [68].
Entropy values are instrumental in analyzing natural hazards such as landslides. Specifically, entropy values indicate environmental dissimilarities, highlighting factors that are potential triggers for landslides. The entropy index calculation involves the following steps to determine the weighting of the causative factors:
where
3 Results and discussion
3.1 Assessment of FR
Landslide incidences and the 11 causative factor components were mapped and analyzed spatially using a FR model. The following variables were included: slope, soil, elevation, aspect, drainage density, NDVI, LULC, geomorphology, rainfall, lineament density and road. The FR of each class of landslide conditioning factor was calculated. According to Pradhan [69], values greater than 1 imply a higher risk of landslide events, whereas values below 1 indicate a lower likelihood. Table 2 presents the FRs of all classes and their subclasses which can effectively assess the correlation between the landslide spatial distribution and their triggering factors in a study region [18].
Spatial relationship between causative factors and landslide prediction by FR and SE models
| Conditioning factors | Classes | Landslides (%) | Pixel (%) | FR | SE | ||||
|---|---|---|---|---|---|---|---|---|---|
|
|
|
|
|
|
|||||
| Slope (degrees) | 0–3 | 0.0123 | 0.0286 | 0.4295 | 0.1434 | 1.669 | 2 | 0.165 | 0.1236 |
| 3–10 | 0.2088 | 0.1480 | 1.4107 | 0.4711 | |||||
| 10–35 | 0.7715 | 0.7781 | 0.9915 | 0.3311 | |||||
| >35 | 0.0074 | 0.0452 | 0.1630 | 0.0544 | |||||
| Elevation (m) | 740–1,311 | 0.0197 | 0.0469 | 0.4188 | 0.0721 | 1.582 | 2.322 | 0.318 | 0.3698 |
| 1,311–1,664 | 0.0467 | 0.0709 | 0.6582 | 0.1134 | |||||
| 1,664–1,936 | 0.6192 | 0.1627 | 3.8053 | 0.6555 | |||||
| 1,936–2,188 | 0.2187 | 0.3203 | 0.6826 | 0.1176 | |||||
| 2,188–2,625 | 0.0958 | 0.3991 | 0.2401 | 0.0414 | |||||
| Aspect (direction) | Flat (−1) | 0.0000 | 0.0112 | 0.0000 | 0.0000 | 2.976 | 3.322 | 0.103 | 0.0839 |
| North (0–22.5) | 0.0295 | 0.0627 | 0.4701 | 0.0583 | |||||
| North East (22.5–67.5) | 0.0737 | 0.1101 | 0.6692 | 0.0829 | |||||
| East (67.5–112.5) | 0.1572 | 0.1293 | 1.2164 | 0.1508 | |||||
| South East (112.5–157.5) | 0.2850 | 0.1686 | 1.6901 | 0.2095 | |||||
| South (157.5–202.5) | 0.2383 | 0.1540 | 1.5471 | 0.1917 | |||||
| South West (202.5–247.5) | 0.0565 | 0.1099 | 0.5143 | 0.0637 | |||||
| West (247.5–292.5) | 0.0860 | 0.0852 | 1.0097 | 0.1251 | |||||
| North West (292.5–337.5) | 0.0319 | 0.1042 | 0.3066 | 0.0380 | |||||
| North (337.5–360) | 0.0418 | 0.0647 | 0.6452 | 0.0800 | |||||
| Soil | Sandy clay loam | 0.8526 | 0.3373 | 2.5277 | 0.8715 | 0.675 | 1.585 | 0.574 | 0.5550 |
| Sandy loam | 0.1351 | 0.5729 | 0.2359 | 0.0813 | |||||
| Rock land | 0.0123 | 0.0898 | 0.1368 | 0.0472 | |||||
| Lineament density | Very low | 0.8600 | 0.7474 | 1.1505 | 0.4208 | 1.887 | 2.322 | 0.187 | 0.1025 |
| Low | 0.0442 | 0.0859 | 0.5148 | 0.1883 | |||||
| Medium | 0.0909 | 0.0117 | 0.6475 | 0.2368 | |||||
| High | 0.0049 | 0.0859 | 0.4211 | 0.1540 | |||||
| Very High | 0.0000 | 0.0146 | 0.0000 | 0.0000 | |||||
| Drainage density | Very Low | 0.0467 | 0.0624 | 0.7480 | 0.1642 | 2.253 | 2.322 | 0.029 | 0.0269 |
| Low | 0.0491 | 0.1016 | 0.4835 | 0.1062 | |||||
| Medium | 0.2531 | 0.1977 | 1.2798 | 0.2810 | |||||
| High | 0.2948 | 0.2845 | 1.0363 | 0.2275 | |||||
| Very high | 0.3563 | 0.3537 | 1.0073 | 0.2211 | |||||
| NDVI | Very low | 0.0098 | 0.0274 | 0.3584 | 0.0790 | 2.192 | 2.322 | 0.055 | 0.0506 |
| Low | 0.3219 | 0.2103 | 1.5308 | 0.3375 | |||||
| Medium | 0.2039 | 0.2093 | 0.9741 | 0.2148 | |||||
| High | 0.2629 | 0.2912 | 0.9028 | 0.1990 | |||||
| Very high | 0.2015 | 0.2618 | 0.7696 | 0.1697 | |||||
| LULC | Water body | 0.0025 | 0.0124 | 0.1986 | 0.0236 | 2.016 | 3 | 0.328 | 0.3457 |
| Tea plantation | 0.1671 | 0.1029 | 1.6232 | 0.1925 | |||||
| Settlement | 0.5111 | 0.1083 | 4.7188 | 0.5596 | |||||
| Open forest | 0.1646 | 0.2553 | 0.6448 | 0.0765 | |||||
| Land without scrub | 0.0123 | 0.0987 | 0.1244 | 0.0148 | |||||
| Land with scrub | 0.0344 | 0.1016 | 0.3385 | 0.0401 | |||||
| Dense forest | 0.0565 | 0.2236 | 0.2527 | 0.0300 | |||||
| Agro horticulture plantation | 0.0516 | 0.0972 | 0.5311 | 0.0630 | |||||
| Geomorphology | Colluvial fills | 0.4324 | 0.2875 | 1.5041 | 0.0628 | 1.219 | 3.807 | 0.679 | 1.1618 |
| Pediments | 0.0025 | 0.0209 | 0.1176 | 0.0049 | |||||
| Debris slope | 0.0319 | 0.0869 | 0.3675 | 0.0154 | |||||
| Shallow pediment | 0.2506 | 0.3013 | 0.8318 | 0.0348 | |||||
| Erosional plateau | 0.0000 | 0.0988 | 0.0000 | 0.0000 | |||||
| Gullied valley | 0.0713 | 0.0901 | 0.7905 | 0.0330 | |||||
| Residual hill | 0.0000 | 0.0044 | 0.0000 | 0.0000 | |||||
| Undissected plateau | 0.0025 | 0.0098 | 0.2516 | 0.0105 | |||||
| Dissected plateau | 0.0000 | 0.0049 | 0.0000 | 0.0000 | |||||
| Deep pediment | 0.1941 | 0.0100 | 19.362 | 0.8090 | |||||
| Moderate pediplain | 0.0049 | 0.0229 | 0.2145 | 0.0090 | |||||
| Floodplain | 0.0049 | 0.0497 | 0.0987 | 0.0041 | |||||
| Pediplain | 0.0049 | 0.0125 | 0.3938 | 0.0165 | |||||
| Crust line | 0.0000 | 0.0003 | 0.0000 | 0.0000 | |||||
| Road (m) | 100 | 0.7746 | 0.4453 | 1.7397 | 0.6844 | 1.212 | 1.585 | 0.235 | 0.1991 |
| 200 | 0.1380 | 0.3114 | 0.4432 | 0.1744 | |||||
| 300 | 0.0873 | 0.2433 | 0.3589 | 0.1412 | |||||
| Rainfall (mm) | <400 | 0.0541 | 0.1214 | 0.4453 | 0.0997 | 2.186 | 2.322 | 0.058 | 0.0522 |
| 400–405 | 0.1302 | 0.1948 | 0.6686 | 0.1497 | |||||
| 405–410 | 0.4079 | 0.2595 | 1.5715 | 0.3519 | |||||
| 410–417 | 0.3120 | 0.2632 | 1.1856 | 0.2655 | |||||
| >417 | 0.0958 | 0.1611 | 0.5947 | 0.1332 | |||||
Slopes with angles between 0° and 3° had a very low impact on landslide occurrence. However, with an increasing slope between 3° and 10°, the FR (1.4107) increased suddenly, indicating a higher likelihood of landslides. Most landslides in this study occurred in areas with 3°–10° slopes. The FR for 10°–35° was also high (0.9915) [12,70]. Elevated slope values intensify gravitational pull and escalate shear stress, thereby exacerbating the risk of landslides. Elevation ranges of 2,625–1,439 m and 740–1,311 m, have respective FR values of 0.2401 and 0.4188, indicating a low likelihood of landslides. The greatest FR value is 3.8053 for the elevation range of 1,664–1,936 m, followed by 0.6826 for 1,936–2,188 m and 0.6582 for 1,311–1,664 m [26].
Landslide occurrences were more heavily influenced by the southeast, south, east and west aspects than any other direction. The southeast aspect exhibited the highest FR of 1.6901, then the south, east and west aspects with FRs of 1.5471, 1.2164 and 1.0097, respectively. These areas are subject to increased erosion and rainfall, which increase the risk of landslides. FR values are below 1 for other aspect classes, on the other hand, indicating a reduced likelihood of landslides.
As for soil factors, sandy clay loam has a high FR value (2.5277), indicating an increased likelihood of landslide events. The soil classes with sandy loam and rock land had the lowest FR values (0.1368 and 0.2359), indicating low odds of landslides in the region. Areas most affected by landslides, with a low NDVI range (0.107783–0.20765), exhibited the highest FR of 1.5308.
The results show that for land use, the areas with the settlement, tea plantations and open forests had FR values of 4.1788, 1.6232 and 0.6488, suggesting a varying likelihood of highest landslide occurrence. According to Solaimani et al. [71], exposure to soil moisture and erosion causes this increased sensitivity. Regarding geomorphology, the classes of colluvial fills, shallow pediments and deep pediments had the greatest FR values (19.3626, 1.5041 and 0.8391) highlighting the high likelihood of landslide events. Low FR values of 0.0988 and 0.1176 for floodplains and pediments, respectively, imply that landslides are unlikely to occur in these regions [72].
Furthermore, road distance classes of 100–200 m and 200–300 m had a negligible impact on landslide occurrence (FR values of 0.4432 and 0.3589), whereas distances less than 100 m had a substantially higher influence (FR = 1.7397). This suggests that landslide occurrence is more likely along shorter routes.
The maximum FR (1.2798) for drainage density occurred in the medium range (1.61382–2.87488), implying a high chance of landslides, while the minimum FR value (0.4835) for drainage density in the low range (0.64538–1.61382) suggests a lower probability for landslide occurrence [73]. According to the correlation between lineament density and landslide probabilities, the very low range exhibited the maximum FR value of 1.1505. Conversely, the extremely high range showed the minimum FR value of 0.4211 [74].
Precipitation is a key triggering factor for landslides, with higher FR values observed in areas with higher rainfall. The greatest FR values, 1.5715 and 1.1856, were found in locations with rainfall in the range of 405–410 mm and 410–417 mm, respectively [12,75]. Generally, the most significant factors influencing landslide occurrence include slope classes of 3°–10°, elevation ranging from 1,664 to 1,936 m, south-eastern facing aspects, soil composed of sandy clay loam, extremely low density of lineaments, moderate drainage density, low NDVI classification, land use categories such as settlement, tea plantations and open forests, geomorphological features like deep pediments and colluvial fills, proximity to roads within 100 m and precipitation levels between 405 and 410 mm, resulting in a high susceptibility to landslides in the region. The LSI values of the FR model range from 3.38656 to 40.1292. The zonation of the LSM (Figure 4) was generated in ArcGIS using the Jenks natural breaks classification method [27]. These zones indicate areas with very low, low, moderate, high and very high susceptibility to landslides. It is noted that 31.10% of the region falls within the low susceptibility class, while 4.729% is classified under the extremely low susceptibility category. A total of 34.70% of the area is categorized as having moderate susceptibility category. Furthermore, Table 3 illustrates that 29.46% of the taluk is highly prone to landslides.
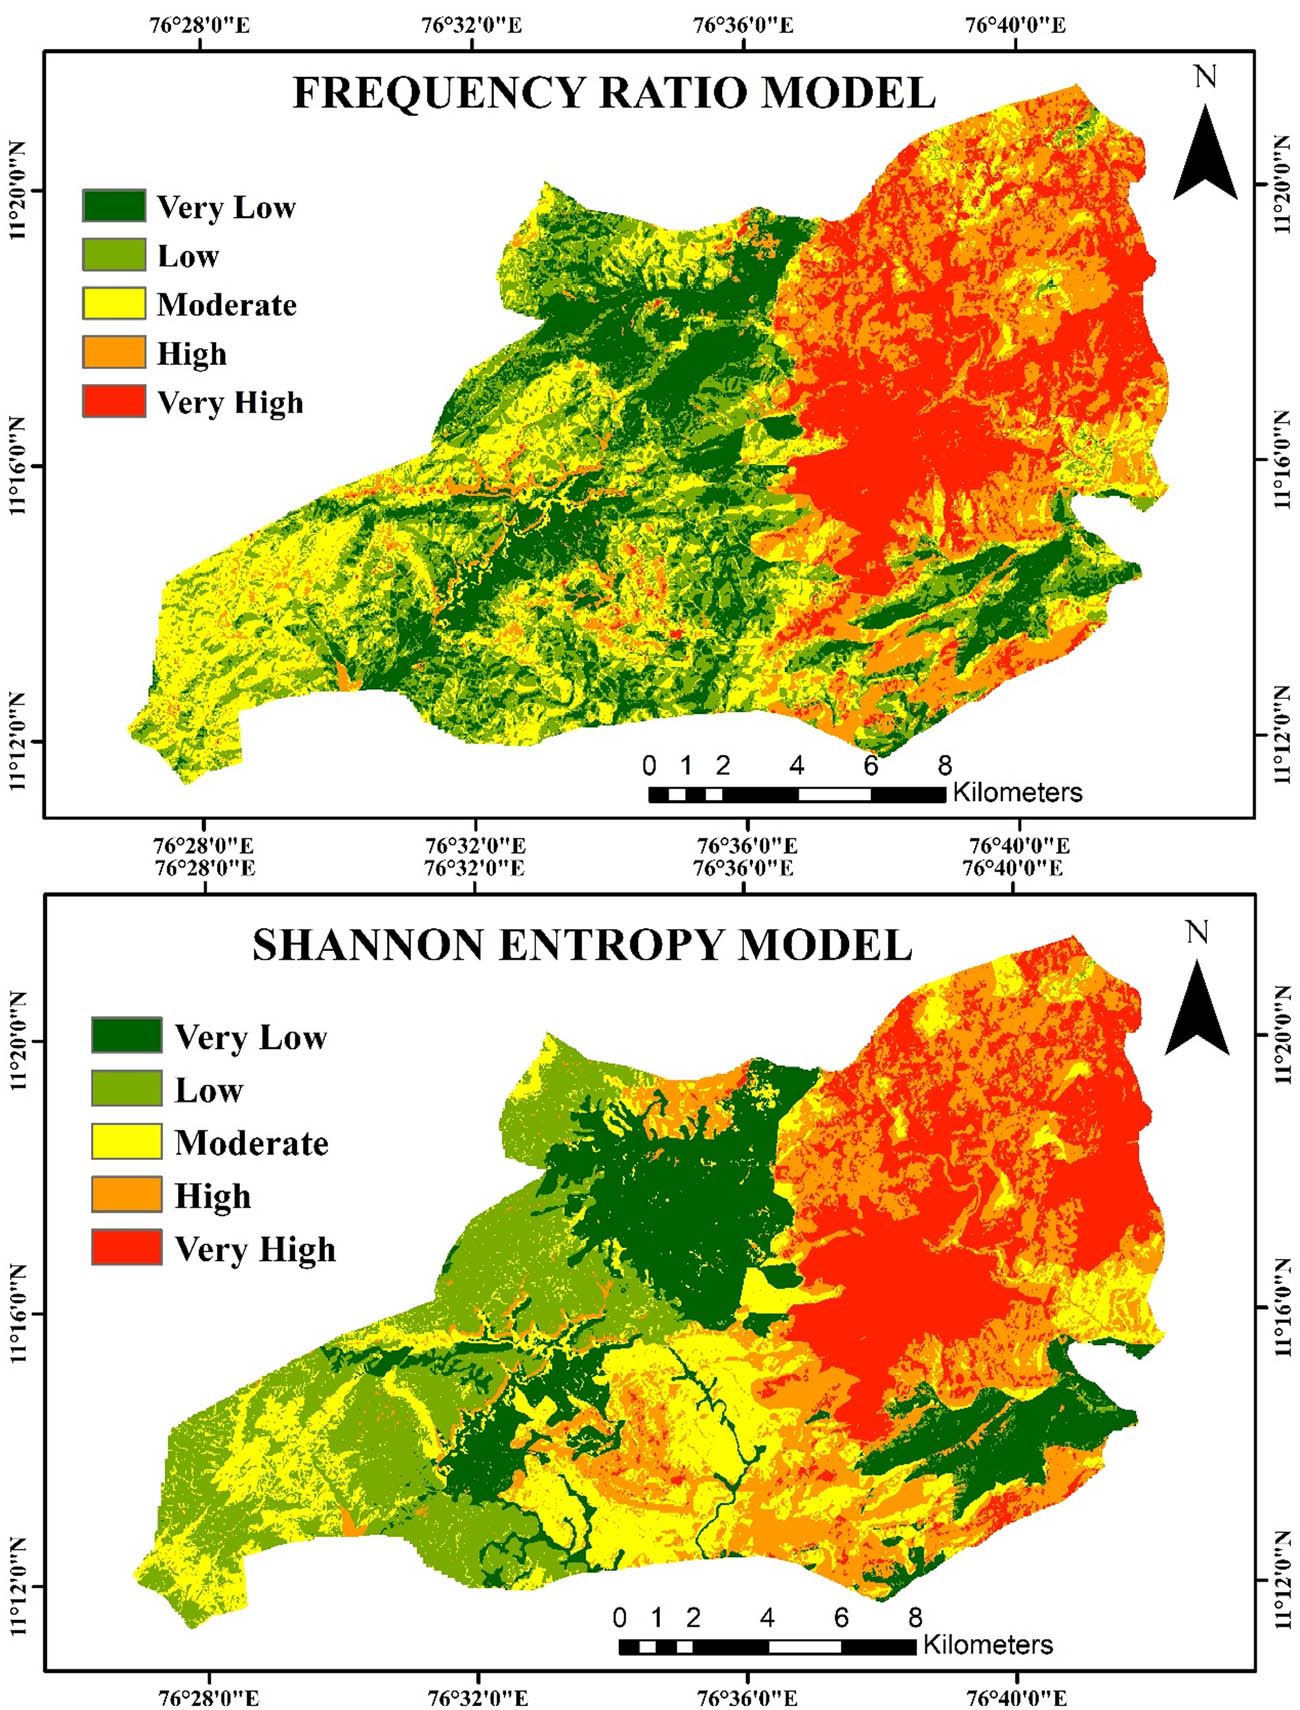
LSMs of FR and SE models.
Distribution of landslide susceptible classes and area coverage of FR model and SE model
| Landslide susceptible classes | FR model | SE model | ||
|---|---|---|---|---|
| Area covered (km2) | Area covered (%) | Area covered (km2) | Area covered (%) | |
| Very low | 15.652 | 4.729 | 54.793 | 16.55 |
| Low | 102.950 | 31.10 | 64.366 | 19.44 |
| Moderate | 114.857 | 34.70 | 84.199 | 25.43 |
| High | 65.832 | 19.88 | 69.427 | 20.97 |
| Very high | 31.699 | 9.577 | 58.203 | 17.58 |
3.2 Assessment of SE
The results of Shannon’s entropy model are listed in Table 2, which presents the weighted contribution of each causative element to landslide susceptibility. According to the
The most likely soil types for landslides are sandy loam and sandy clay loam, the probability of landslides on rock land is often lower. Landslide occurrences are significantly affected by lineament density, as seen by the highest
Regarding LULC, tea plantations and settlements have the highest possibility of experiencing landslides, whereas water bodies have the lowest chance [79]. The habitat area was found to be the primary concentration in the landslide-prone area. The geomorphological analysis reveals high
Similarly, the 405–410 mm rainfall class has the highest
3.3 Assessment and comparison of model results
In risk prediction modeling, validation is crucial, as data quality and model selection substantially influence the reliability of outcomes. This study developed statistical models incorporating various causative factors and validated using the receiver operating characteristic (ROC) method’s area under the curve (AUC) [83]. The ROC curve effectively illustrates the LSI, with the Y-axis displaying the downward-ordered index and the X-axis indicating the overall percentage of landslide occurrences relative to the prediction rate [84,85]. Models with higher AUC values, ranging from 50 to 100%, are considered more accurate for prediction. The study utilized a test dataset (30% or 174 sites) to generate the prediction rate using LSMs created by the FR and SE models, as depicted in Figure 5. The AUC analysis revealed that the SE model achieved an AUC value of 0.82, indicating good accuracy.
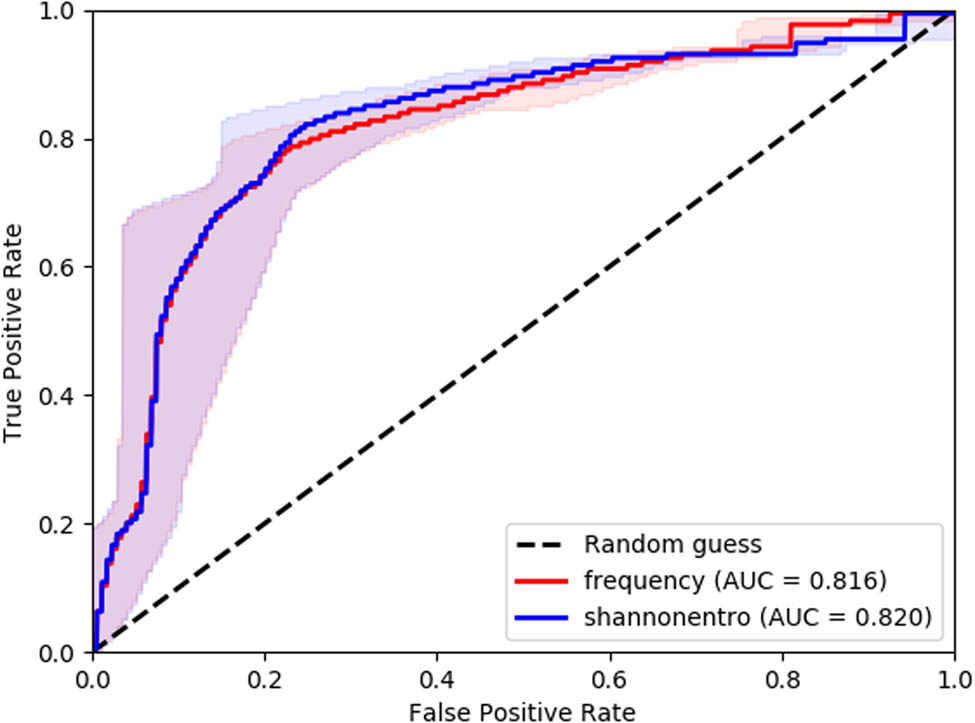
ROC curve for FR and SE models.
In comparison, the FR model demonstrated lower accuracy with an AUC of 0.816. Both models consistently identified landslide susceptibility zones within the study area, with the SE model showing a notable advantage in overall predictive accuracy. These AUC values align with numerous studies conducted in various landslide-affected regions, including Karnataka [32], Kerala [51], Morocco [85], Western Ghats [32], Himalayas [86], Meghalaya [34,65], Ethiopia [15,53] and the Union Territory of Jammu and Kashmir [87].
4 Conclusion
This study focuses on mapping and modeling landslide-susceptible areas in Kundah Taluk, Nilgiris District, Tamil Nadu. The methodology employed in this study highlights the importance of satellite imagery and GIS in evaluating landslide risk. A detailed investigation of hillside instability factors was performed, utilizing the findings as input for FR and SE models to predict landslide susceptibility. Eleven factors influencing landslides were identified: slope, aspect, elevation, soil type, LULC, NDVI, lineament density, geomorphology, roads, drainage density and rainfall. These factors were incorporated into a GIS platform for analysis. The two landslide vulnerability models categorized the study area into five levels of susceptibility: very low, low, moderate, high and very high. Model validation involved comparing the generated maps with an inventory of recorded landslides using ROC/AUC techniques. The validation results accurately map landslide risk zones in the study area. Assessment of prediction performance using AUC revealed that the SE model surpassed the FR model, achieving an AUC value of 82%. The resulting LSMs highlight elevated susceptibility in the southern cliff, southeastern region and hillsides adjacent to roads. This study underscores the consequential impact of landslides on intra- and inter-taluk/district connectivity, potentially causing severe economic losses, road disruptions and fatalities among residents. The LSM is a valuable resource for authorities and decision-makers, facilitating strategic planning and the development of hazard reduction plans for potential landslide events. Furthermore, insights from the LSM can guide the development of resilient and sustainable infrastructure in the Kundah region, minimizing landslide-related disruptions to connectivity and local inhabitants.
Acknowledgements
We want to express our appreciation to all the participants who generously volunteered their time to take part in this study.
-
Funding information: No funding was obtained for this study.
-
Author contributions: All authors contributed to the study conception and design. Material preparation, data collection and analysis were performed by Harithaa Senthilkumar and Evany Nithya Selvaraj. All authors read and approved the final manuscript.
-
Conflict of interest: The authors declare that they have no known competing financial interests or personal relationships that could have appeared to influence the work reported in this article.
-
Ethics approval and consent to participate: The authors declare that they are ready to give ethics approval and consent to participate in this research work.
-
Ethical responsibilities of authors: All authors have read, understood and have complied as applicable with the statement on “Ethical responsibilities of Authors” as found in the Instructions for Authors.
-
Data availability statement: The datasets used and/or analyzed during the current study are available from the corresponding author upon reasonable request.
References
[1] Panchal S, Shrivastava AK. A comparative study of frequency ratio, Shannon’s entropy and analytic hierarchy process (AHP) models for landslide susceptibility assessment. ISPRS Int J Geo-Inf. 2021 Sep;10(9):603. 10.3390/ijgi10090603.Search in Google Scholar
[2] Pal SC, Chowdhuri I. GIS-based spatial prediction of landslide susceptibility using frequency ratio model of Lachung River basin, North Sikkim, India. SN Appl Sci. 2019 May;1:1–25. 10.1007/S42452-019-0422-7.Search in Google Scholar
[3] Addis A. Landslide susceptibility mapping using GIS and bivariate statistical models in Chemoga Watershed, Ethiopia. Adv Civ Eng. 2024;2024(1):6616269. 10.1155/2024/6616269.Search in Google Scholar
[4] Mathangi B, Zaalishvili VB, Ganapathy GP. Study of substrata of a slope susceptible to landslide in hilly environment using a geophysical method in the Nilgiris, India. Env Sci Pollut Res. 2023 Dec;30(59):123966–82. 10.1007/s11356-023-30809-w.Search in Google Scholar PubMed
[5] Varnes DJ. Slope Movement Types and Processes: Transportation Research Board Special Report 176; 1978. 10.1007/s10346-013-0436-y.Search in Google Scholar
[6] Mallick J, Alqadhi S, Talukdar S, AlSubih M, Ahmed M, Khan RA, et al. Risk assessment of resources exposed to rain fall induced landslide with the development of GIS and RS based ensemble metaheuristic machine learning algorithms. Sustainability. 2021;13(2):457. 10.3390/su13020457.Search in Google Scholar
[7] Jain N, Roy P, Martha TR, Jalan P, Nanda A. Landslide Atlas of India (Mapping, monitoring and advance techniques using space-based inputs). NRSC special publication. NRSC/ISRO. Document number: NRSC-RSA-GSG-GMED-FEB; 2023. https://www.isro.gov.in/Landslide_Atlas_India.html.Search in Google Scholar
[8] Devkota KC, Regmi AD, Pourghasemi HR, Yoshida K, Pradhan B, Ryu IC, et al. Landslide susceptibility mapping using certainty factor, index of entropy and logistic regression models in GIS and their comparison at Mugling–Narayanghat road section in Nepal Himalaya. Nat Hazards. 2013 Jan;65:135–65. 10.1007/s11069-012-0347-6.Search in Google Scholar
[9] Mandal SP, Chakrabarty A, Maity P. Comparative evaluation of information value and frequency ratio in landslide susceptibility analysis along national highways of Sikkim Himalaya. Spat Inf Res. 2018 Apr;26:127–41. 10.1007/s41324-017-0160-0.Search in Google Scholar
[10] Dam ND, Amiri M, Al-Ansari N, Prakash I, Le HV, Nguyen HB, et al. Evaluation of Shannon entropy and weights of evidence models in landslide susceptibility mapping for the Pithoragarh district of Uttarakhand state, India. Adv Civ Eng. 2022;2022(1):6645007. 10.1155/2022/6645007.Search in Google Scholar
[11] Anis Z, Wissem G, Vali V, Smida H, Mohamed Essghaier G. GIS-based landslide susceptibility mapping using bivariate statistical methods in North-western Tunisia. Open Geosci. 2019 Oct;11(1):708–26. 10.1515/geo-2019-0056.Search in Google Scholar
[12] Biswas B, KS V, Ranjan R. Landslide susceptibility mapping using integrated approach of multi-criteria and geospatial techniques at Nilgiris district of India. Arab J Geosci. 2021 Jun;14(11):980. 10.1007/s12517-021-07341-7.Search in Google Scholar
[13] Zhang YX, Lan HX, Li LP, Wu YM, Chen JH, Tian NM. Optimizing the frequency ratio method for landslide susceptibility assessment: A case study of the Caiyuan Basin in the southeast mountainous area of China. J Mt Sci. 2020 Feb;17(2):340–57. 10.1007/s11629-019-5702-6.Search in Google Scholar
[14] Genene A, Meten M. Landslide susceptibility mapping using GIS-based information value and frequency ratio methods in Gindeberet area, West Shewa Zone, Oromia Region, Ethiopia. SN Appl Sci. 2020;2:807. 10.1007/s42452-020-2563-0.Search in Google Scholar
[15] Melese T, Belay T, Andemo A. Application of analytical hierarchal process, frequency ratio and Shannon entropy approaches for landslide susceptibility mapping using geospatial technology: The case of Dejen district, Ethiopia. Arab J Geosci. 2022 Mar;15(5):424. 10.1007/s12517-022-09672-5.Search in Google Scholar
[16] Klai A, Katlane R, Haddad R, Rabia MC. Landslide susceptibility mapping by Frequency Ratio and Fuzzy logic approach: A case study of Mogods and Hedil (Northern Tunisia). Appl Geomat. 2024 Mar;16(1):91–109. 10.21203/rs.3.rs-3015671/v1.Search in Google Scholar
[17] Sujatha ER, Sridhar V. Landslide susceptibility analysis: A logistic regression model case study in Coonoor, India. Hydrology. 2021 Mar;8(1):41. 10.3390/hydrology8010041.Search in Google Scholar
[18] Zheng H, Ding M, Huang T, He Y, Gao Z, Duan Y. Integrating the frequency ratio and index of entropy with an extreme learning machine to map post-earthquake landslide susceptibility: a case study in Xingwen County, China. Stoch Environ Res Risk Assess. 2024 Oct;1–23. 10.1007/s00477-024-02833-w.Search in Google Scholar
[19] Chowdhury MS, Rahaman MN, Sheikh MS, Sayeid MA, Mahmud KH, Hafsa B. GIS-based landslide susceptibility mapping using logistic regression, random forest and decision and regression tree models in Chattogram District, Bangladesh. Heliyon. 2024 Jan;10(1). 10.1016/j.heliyon.2023.e23424.Search in Google Scholar PubMed PubMed Central
[20] Mosaffaie J, Salehpour Jam A, Tabatabaei M. Comparing the validity of statistical and knowledge-based methods for landslide susceptibility mapping. J Agric Sci Technol. 2024 May;26(3):695–709. 10.22034/JAST.26.3.695.Search in Google Scholar
[21] Hallal N, Hamidatou M, Medjnoun A, Hamai L, Lamali A, Hassan HM, et al. GIS-based statistical and limit equilibrium models in the assessment of slope stability and landslide susceptibility: the case study of the Aomar Miocene basin, Bouira, Algeria. Env Earth Sci. 2024 Oct;83(20):578. 10.1007/s12665-024-11879-6.Search in Google Scholar
[22] Jari A, Khaddari A, Hajaj S, Bachaoui EM, Mohammedi S, Jellouli A, et al. Landslide susceptibility mapping using multi-criteria decision-making (MCDM), statistical and machine learning models in the Aube Department, France. Earth. 2023 Sep;4(3):698–713. 10.3390/earth4030037.Search in Google Scholar
[23] Silalahi FE, Pamela, Arifianti Y, Hidayat F. Landslide susceptibility assessment using frequency ratio model in Bogor, West Java, Indonesia. Geosci Lett. 2019 Nov;6(1):10. 10.1186/s40562-019-0140-4.Search in Google Scholar
[24] Mandal B, Mandal S. Analytical hierarchy process (AHP) based landslide susceptibility mapping of Lish river basin of eastern Darjeeling Himalaya, India. Adv Space Res. 2018 Dec;62(11):3114–32. 10.1016/j.asr.2018.08.008.Search in Google Scholar
[25] Mondal S, Maiti R. Integrating the analytical hierarchy process (AHP) and the frequency ratio (FR) model in landslide susceptibility mapping of Shiv-khola watershed, Darjeeling Himalaya. Int J Disaster Risk Sci. 2013 Dec;4:200–12. 10.1007/s13753-013-0021-y.Search in Google Scholar
[26] Singh S, Dhote PR, Thakur PK, Chouksey A, Aggarwal SP. Identification of flash-floods-prone river reaches in Beas river basin using GIS-based multi-criteria technique: validation using field and satellite observations. Nat Hazards. 2021 Feb;105:2431–53. 10.1007/s11069-020-04406-w.Search in Google Scholar
[27] Jenks GF. The data model concept in statistical mapping. Int Yearb Cartography. 1967;7:186–90, https://cir.nii.ac.jp/crid/1573668925394541312.Search in Google Scholar
[28] Bednarik M, Yilmaz I, Kralovičová L. Deterministic approach to assess landslide susceptibility and landslide activity in the Central-Western Region of Slovakia. Bull Eng Geol Env. 2024 Aug;83(8):327. 10.1007/s10064-024-03795-7.Search in Google Scholar
[29] Gebreyohannes D, Getahun E, Jothimani M. Slope stability assessment in the seismically and landslide-prone road segment of Gerese to Belta, Rift Valley, Ethiopia. PLoS One. 2024 Feb;19(2):e0296807. 10.1371/journal.pone.0296807.Search in Google Scholar PubMed PubMed Central
[30] Zeng Y, Zhang Y, Hu W, Chen M, Hu Q, Liu X, et al. A case study on soil slope landslide failure and parameter analysis of influencing factors for safety factor based on strength reduction method and orthogonal experimental design. PLoS One. 2024 May;19(5):e0300586. 10.1371/journal.pone.0300586.Search in Google Scholar PubMed PubMed Central
[31] He Y, Zhao ZA, Zhu Q, Liu T, Zhang Q, Yang W, et al. An integrated neural network method for landslide susceptibility assessment based on time-series InSAR deformation dynamic features. Int J Digital Earth. 2024 Dec;17(1):2295408. 10.1080/17538947.2023.2295408.Search in Google Scholar
[32] Rahaman A, Venkatesan MS, Ayyamperumal R. GIS-based landslide susceptibility mapping method and Shannon entropy model: a case study on Sakaleshapur Taluk, Western Ghats, Karnataka, India. Arab J Geosci. 2021 Oct;14:1–2. 10.1007/s12517-021-08422-3.Search in Google Scholar
[33] Sarkar R, Sujeewon BC, Pawar A. Landslide susceptibility mapping using satellite images and GIS-based statistical approaches in part of Kullu District, Himachal Pradesh, India. In Geomorphic risk reduction using geospatial methods and tools. Singapore: Springer Nature Singapore; 2024 May. p. 251–87. 10.1007/978-981-99-7707-9_14.Search in Google Scholar
[34] Agrawal N, Dixit J. GIS-based landslide susceptibility mapping of the Meghalaya-Shillong Plateau region using machine learning algorithms. Bull Eng Geol Environ. 2023 May;82(5):170. 10.1007/s10064-023-03188-2.Search in Google Scholar
[35] Xu K, Zhao Z, Chen W, Ma J, Liu F, Zhang Y, et al. Comparative study on landslide susceptibility mapping based on different ratios of training samples and testing samples by using RF and FR-RF models. Nat Hazards Res. 2024 Mar;4(1):62–74. 10.1016/j.nhres.2023.07.004.Search in Google Scholar
[36] Ganapathy GP, Rajawat AS. Use of hazard and vulnerability maps for landslide planning scenarios: a case study of the Nilgiris, India. Nat Hazards. 2015 May;77:305–16. 10.1007/s11069-015-1587-z.Search in Google Scholar
[37] Cao Y, Wei X, Fan W, Nan Y, Xiong W, Zhang S. Landslide susceptibility assessment using the weight of evidence method: A case study in Xunyang area, China. PLoS One. 2021 Jan;16(1):e0245668. 10.1371/journal.pone.0245668.Search in Google Scholar PubMed PubMed Central
[38] Bopche L, Rege PP. Landslide susceptibility mapping: an integrated approach using geographic information value, remote sensing and weight of evidence method. Geotech Geol Eng. 2022 Jun;40(6):2935–47. 10.1007/s10706-022-02070-4.Search in Google Scholar
[39] Getachew N, Meten M. Weights of evidence modeling for landslide susceptibility mapping of Kabi-Gebro locality, Gundomeskel area, Central Ethiopia. Geoenviron Disasters. 2021 Dec;8:1–22. 10.21203/rs.3.rs-45713/v1.Search in Google Scholar
[40] Li B, Wang N, Chen J. GIS‐based landslide susceptibility mapping using information, frequency ratio and artificial neural network methods in Qinghai Province, Northwestern China. Adv Civ Eng. 2021;2021(1):4758062. 10.1155/2021/4758062.Search in Google Scholar
[41] Kaya Topaçli Z, Ozcan AK, Gokceoglu C. Performance comparison of landslide susceptibility maps derived from logistic regression and random forest models in the Bolaman Basin, Türkiye. Nat Hazards Rev. 2024 Feb;25(1):04023054. 10.1061/NHREFO.NHENG-1771.Search in Google Scholar
[42] Rajakumar P, Sanjeevi S, Jayaseelan S, Isakkipandian G, Edwin M, Balaji P, et al. Landslide susceptibility mapping in a hilly terrain using remote sensing and GIS. J Indian Soc Remote Sens. 2007 Mar;35:31–42. 10.1007/BF02991831.Search in Google Scholar
[43] Nithya SE, Prasanna PR, Eswaramoorthi S. Landslide suceptibility zonation using fuzzy logic for Kundahpallam Watershed, Nilgris. Eur J Sci Res. 2012;78(1):48–56, http://www.europeanjournalofscientificresearch.com.Search in Google Scholar
[44] Thennavan E, Ganapathy GP, Chandra Sekaran SS, Rajawat AS. Use of GIS in assessing building vulnerability for landslide hazard in the Nilgiris, Western Ghats, India. Nat Hazards. 2016 Jun;82:1031–50. 10.1007/s11069-016-2232-1.Search in Google Scholar
[45] Guru B, Veerappan R, Sangma F, Bera S. Comparison of probabilistic and expert-based models in landslide susceptibility zonation mapping in part of Nilgiri District, Tamil Nadu, India. Spat Inf Res. 2017 Dec;25:757–68. 10.1007/s41324-017-0143-1.Search in Google Scholar
[46] Saranaathan SE, Mani S, Ramesh V, Prasanna Venkatesh S. Landslide susceptibility zonation mapping using bivariate statistical frequency ratio method and GIS: a case study in part of SH 37 Ghat Road, Nadugani, Panthalur Taluk, The Nilgiris. J Indian Soc Remote Sens. 2021 Feb;49:275–91. 10.1007/s12524-020-01207-3.Search in Google Scholar
[47] Thennavan E, Ganapathy G, Chandrasekaran S, Rajawat A. Probabilistic rainfall thresholds for shallow landslides initiation–A case study from The Nilgiris district, Western Ghats, India. Int J Disaster Risk Manag. 2020 Sep;2(1):1–4. 10.18485/ijdrm.2020.2.1.1.Search in Google Scholar
[48] Yuvaraj RM, Dolui B. Statistical and machine intelligence based model for landslide susceptibility mapping of Nilgiri district in India. Environ Chall. 2021 Dec;5:100211. 10.1016/j.envc.2021.100211.Search in Google Scholar
[49] Jennifer JJ, Saravanan S, Abijith D. Application of frequency ratio and logistic regression model in the assessment of landslide susceptibility mapping for Nilgiris District, Tamilnadu, India. Indian Geotech J. 2021 Aug;51(4):773–87. 10.1007/s40098-021-00520-z.Search in Google Scholar
[50] Aswinth B, Midhun LN, Geetha P, Ramkrishnan R. Landscape spatial pattern analysis for Nilgiris District. In 2022 IEEE 7th International Conference on Recent Advances and Innovations in Engineering (ICRAIE). Vol. 7, IEEE; 2022 Dec. p. 360–6. 10.1109/ICRAIE56454.2022.10054332.Search in Google Scholar
[51] Suraj PR, Babu M, Manoharan AN, Krishnan A, Mayya KS, Niveditha P. Landslide susceptibility modelling of central highland part of Chaliyar River Basin, Kerala, India with integrated algorithms of frequency ratio and Shannon entropy. J Geosci Res. 2024;9(2):100–7. 10.56153/g19088-023-0176-52.Search in Google Scholar
[52] Oliveira SC, Zêzere JL, Garcia RA, Pereira S, Vaz T, Melo R. Landslide susceptibility assessment using different rainfall event-based landslide inventories: advantages and limitations. Nat Hazards. 2024 May;1–39. 10.1007/s11069-024-06691-1.Search in Google Scholar
[53] Addis A. GIS‐based landslide susceptibility mapping using frequency ratio and Shannon entropy models in Dejen District, Northwestern Ethiopia. J Eng. 2023;2023(1):1062388. 10.1155/2023/1062388.Search in Google Scholar
[54] Lee JH, Sameen MI, Pradhan B, Park HJ. Modeling landslide susceptibility in data-scarce environments using optimized data mining and statistical methods. Geomorphology. 2018 Feb;303:284–98. 10.1016/j.geomorph.2017.12.007.Search in Google Scholar
[55] Yu X, Gao H. A landslide susceptibility map based on spatial scale segmentation: A case study at Zigui-Badong in the Three Gorges Reservoir Area, China. PLoS One. 2020 Mar;15(3):e0229818. 10.1371/journal.pone.0229818.Search in Google Scholar PubMed PubMed Central
[56] Okenmuo FC, Ewemoje TA. Estimation of soil water erosion using RUSLE, GIS and remote sensing in Obibia River watershed, Anambra, Nigeria. DYSONA-Appl Sci. 2023 Jan;4(1):6–14. 10.30493/das.2022.349144.Search in Google Scholar
[57] Abdo HG. Evaluating the potential soil erosion rate based on RUSLE model, GIS and RS in Khawabi river basin, Tartous, Syria. DYSONA-Appl Sci. 2021;3:24–32. 10.30493/das.2021.311044.Search in Google Scholar
[58] Richi SM. Integrated RUSLE-GIS modeling for enhancing soil erosion management in Ghamima River Basin, Syria. DYSONA-Applied Sci. 2025 Jan;6(1):104–12. 10.30493/das.2024.479955.Search in Google Scholar
[59] Ghasemian B, Shahabi H, Shirzadi A, Al-Ansari N, Jaafari A, Kress VR, et al. A robust deep-learning model for landslide susceptibility mapping: A case study of Kurdistan Province, Iran. Sensors. 2022 Feb;22(4):1573. 10.3390/s22041573.Search in Google Scholar PubMed PubMed Central
[60] Sonker I, Tripathi JN, Singh AK. Landslide susceptibility zonation using geospatial technique and analytical hierarchy process in Sikkim Himalaya. Quaternary Sci Adv. 2021 Oct;4:100039. 10.1016/j.qsa.2021.100039.Search in Google Scholar
[61] Ghosh S, Kundu S. Fluvial anomaly as indicator of tectonically active landscapes: A study in the Darjeeling Sikkim Himalaya, India. DYSONA-Applied Sci. 2025 Jan;6(1):70–85. 10.30493/das.2024.479536.Search in Google Scholar
[62] Teng F, Mao Y, Li Y, Qian S, Nanehkaran YA. Comparative models of support-vector machine, multilayer perceptron and decision tree predication approaches for landslide susceptibility analysis. Open Geosci. 2024 May;16(1):20220642. 10.1515/geo-2022-0642.Search in Google Scholar
[63] Zhang L, Pu H, Yan H, He Y, Yao S, Zhang Y, et al. A landslide susceptibility assessment method based on auto-encoder improved deep belief network. Open Geosci. 2023 Aug;15(1):20220516. 10.1515/geo-2022-0516.Search in Google Scholar
[64] Liu Z, Gilbert G, Cepeda JM, Lysdahl AO, Piciullo L, Hefre H, et al. Modelling of shallow landslides with machine learning algorithms. Geosci Front. 2021 Jan;12(1):385–93. 10.1016/j.gsf.2020.04.014.Search in Google Scholar
[65] Agrawal N, Dixit J. Assessment of landslide susceptibility for Meghalaya (India) using bivariate (frequency ratio and Shannon entropy) and multi-criteria decision analysis (AHP and fuzzy-AHP) models. All Earth. 2022 Dec;34(1):179–201. 10.1080/27669645.2022.2101256.Search in Google Scholar
[66] Lee S, Talib JA. Probabilistic landslide susceptibility and factor effect analysis. Env Geol. 2005 May;47:982–90. 10.1007/s00254-005-1228-z.Search in Google Scholar
[67] Akter S, Javed SA. GIS-based assessment of landslide susceptibility and inventory mapping using different bivariate models. Geocarto Int. 2022 Dec;37(26):12913–42. 10.1080/10106049.2022.2076907.Search in Google Scholar
[68] Shadman Roodposhti M, Aryal J, Shahabi H, Safarrad T. Fuzzy Shannon entropy: A hybrid GIS-based landslide susceptibility mapping method. Entropy. 2016 Sep;18(10):343. 10.3390/e18100343.Search in Google Scholar
[69] Pradhan B. Landslide susceptibility mapping of a catchment area using frequency ratio, fuzzy logic and multivariate logistic regression approaches. J Ind Soc Remote Sens. 2010 Jun;38:301–20. 10.1007/s12524-010-0020-z.Search in Google Scholar
[70] Chen W, Li W, Chai H, Hou E, Li X, Ding X. GIS-based landslide susceptibility mapping using analytical hierarchy process (AHP) and certainty factor (CF) models for the Baozhong region of Baoji City, China. Environ Earth Sci. 2016 Jan;75:1–4. 10.1007/s12665-015-4795-7.Search in Google Scholar
[71] Solaimani K, Mousavi SZ, Kavian A. Landslide susceptibility mapping based on frequency ratio and logistic regression models. Arab J Geosci. 2013 Jul;6:2557–69. 10.1007/s12517-012-0526-5.Search in Google Scholar
[72] Jaafari A, Najafi A, Pourghasemi HR, Rezaeian J, Sattarian A. GIS-based frequency ratio and index of entropy models for landslide susceptibility assessment in the Caspian forest, northern Iran. Int J Env Sci Technol. 2014 May;11:909–26. 10.1007/s13762-013-0464-0.Search in Google Scholar
[73] Nahayo L, Kalisa E, Maniragaba A, Nshimiyimana FX. Comparison of analytical hierarchy process and certain factor models in landslide susceptibility mapping in Rwanda. Model Earth Syst Env. 2019 Sep;5:885–95. 10.1007/s40808-019-00575-1.Search in Google Scholar
[74] Gopinath G, Jesiya N, Achu AL, Bhadran A, Surendran UP. Ensemble of fuzzy-analytical hierarchy process in landslide susceptibility modeling from a humid tropical region of Western Ghats, Southern India. Environ Sci Pollut Res. 2024 Jun;31(29):41370–87. 10.1007/s11356-023-27377-4.Search in Google Scholar PubMed
[75] Nguyen TT, Liu CC. A new approach using AHP to generate landslide susceptibility maps in the Chen-Yu-Lan Watershed, Taiwan. Sensors. 2019 Jan;19(3):505. 10.3390/s19030505.Search in Google Scholar PubMed PubMed Central
[76] Resmi MR, Achyuthan H. Lower Palar river sediments, southern peninsular, India: geochemistry, source-area weathering, provenance and tectonic setting. J Geol Soc India. 2018 Jul;92:83–91. 10.1007/s12594-018-0956-0.Search in Google Scholar
[77] Ramli MF, Yusof N, Yusoff MK, Juahir H, Shafri HZ. Lineament mapping and its application in landslide hazard assessment: a review. Bull Eng Geol Environ. 2010 May;69:215–33. 10.1007/s10064-009-0255-5.Search in Google Scholar
[78] Sarkar S, Kanungo DP. An integrated approach for landslide susceptibility mapping using remote sensing and GIS. Photogramm Eng Remote Sens. 2004 May;70(5):617–25. 10.14358/PERS.70.5.617.Search in Google Scholar
[79] Pacheco Quevedo R, Velastegui-Montoya A, Montalván-Burbano N, Morante-Carballo F, Korup O, Daleles Rennó C. Land use and land cover as a conditioning factor in landslide susceptibility: a literature review. Landslides. 2023 May;20(5):967–82. 10.1007/s10346-022-02020-4.Search in Google Scholar
[80] Glade T. Landslide occurrence as a response to land use change: a review of evidence from New Zealand. Catena. 2003 Apr;51(3–4):297–314. 10.1016/S0341-8162(02)00170-4.Search in Google Scholar
[81] Rahaman A, Dondapati A, Gupta S, Raj R. Leveraging artificial neural networks for robust landslide susceptibility mapping: A geospatial modeling approach in the ecologically sensitive Nilgiri District, Tamil Nadu. Geohazard Mech. 2024;2(4):258–69.10.1016/j.ghm.2024.07.001Search in Google Scholar
[82] Ayalew L, Yamagishi H. The application of GIS-based logistic regression for landslide susceptibility mapping in the Kakuda-Yahiko Mountains, Central Japan. J Geomorph. 2005 Feb;65(1–2):15–31. 10.1016/j.geomorph.2004.06.010.Search in Google Scholar
[83] Aleksova B, Lukić T, Milevski I, Spalević V, Marković SB. Modelling water erosion and mass movements (wet) by using GIS-based multi-hazard susceptibility assessment approaches: a case study—Kratovska Reka Catchment (North Macedonia). Atmosphere. 2023 Jul;14(7):1139. 10.3390/atmos14071139.Search in Google Scholar
[84] Trigila A, Iadanza C, Esposito C, Scarascia-Mugnozza G. Comparison of logistic regression and random forests techniques for shallow landslide susceptibility assessment in Giampilieri (NE Sicily, Italy). J Geomorph. 2015 Nov;249:119–36. 10.1016/j.geomorph.2015.06.001.Search in Google Scholar
[85] Es-smairi A, Elmoutchou B, Mir RA, Touhami AE, Namous M. Delineation of landslide susceptible zones using Frequency Ratio (FR) and Shannon Entropy (SE) models in northern Rif, Morocco. Geosyst Geoenviron. 2023 Nov;2(4):100195. 10.1016/j.geogeo.2023.100195.Search in Google Scholar
[86] Roy S, Sen S. Landslide vulnerability analysis of tourist spots through Shannon entropy model: a case study on Rudraprayag, Uttarakhand. In Landslide: Susceptibility, risk assessment and sustainability: application of geostatistical and geospatial modeling; 2024 May. p. 381–405. 10.1007/978-3-031-56591-5_14.Search in Google Scholar
[87] Sharma L, Rana NK, Kumar G. Investigating landslide susceptibility in the mountainous area of Union Territory Jammu and Kashmir, India: a comparative perspective. Int J Glob Environ Issues. 2024;23(1):23–46.10.1504/IJGENVI.2024.141607Search in Google Scholar
© 2025 the author(s), published by De Gruyter
This work is licensed under the Creative Commons Attribution 4.0 International License.
Articles in the same Issue
- Research Articles
- Seismic response and damage model analysis of rocky slopes with weak interlayers
- Multi-scenario simulation and eco-environmental effect analysis of “Production–Living–Ecological space” based on PLUS model: A case study of Anyang City
- Remote sensing estimation of chlorophyll content in rape leaves in Weibei dryland region of China
- GIS-based frequency ratio and Shannon entropy modeling for landslide susceptibility mapping: A case study in Kundah Taluk, Nilgiris District, India
- Natural gas origin and accumulation of the Changxing–Feixianguan Formation in the Puguang area, China
- Spatial variations of shear-wave velocity anomaly derived from Love wave ambient noise seismic tomography along Lembang Fault (West Java, Indonesia)
- Evaluation of cumulative rainfall and rainfall event–duration threshold based on triggering and non-triggering rainfalls: Northern Thailand case
- Pixel and region-oriented classification of Sentinel-2 imagery to assess LULC dynamics and their climate impact in Nowshera, Pakistan
- The use of radar-optical remote sensing data and geographic information system–analytical hierarchy process–multicriteria decision analysis techniques for revealing groundwater recharge prospective zones in arid-semi arid lands
- Effect of pore throats on the reservoir quality of tight sandstone: A case study of the Yanchang Formation in the Zhidan area, Ordos Basin
- Hydroelectric simulation of the phreatic water response of mining cracked soil based on microbial solidification
- Spatial-temporal evolution of habitat quality in tropical monsoon climate region based on “pattern–process–quality” – a case study of Cambodia
- Early Permian to Middle Triassic Formation petroleum potentials of Sydney Basin, Australia: A geochemical analysis
- Micro-mechanism analysis of Zhongchuan loess liquefaction disaster induced by Jishishan M6.2 earthquake in 2023
- Prediction method of S-wave velocities in tight sandstone reservoirs – a case study of CO2 geological storage area in Ordos Basin
- Ecological restoration in valley area of semiarid region damaged by shallow buried coal seam mining
- Hydrocarbon-generating characteristics of Xujiahe coal-bearing source rocks in the continuous sedimentary environment of the Southwest Sichuan
- Hazard analysis of future surface displacements on active faults based on the recurrence interval of strong earthquakes
- Structural characterization of the Zalm district, West Saudi Arabia, using aeromagnetic data: An approach for gold mineral exploration
- Research on the variation in the Shields curve of silt initiation
- Reuse of agricultural drainage water and wastewater for crop irrigation in southeastern Algeria
- Assessing the effectiveness of utilizing low-cost inertial measurement unit sensors for producing as-built plans
- Analysis of the formation process of a natural fertilizer in the loess area
- Machine learning methods for landslide mapping studies: A comparative study of SVM and RF algorithms in the Oued Aoulai watershed (Morocco)
- Chemical dissolution and the source of salt efflorescence in weathering of sandstone cultural relics
- Molecular simulation of methane adsorption capacity in transitional shale – a case study of Longtan Formation shale in Southern Sichuan Basin, SW China
- Evolution characteristics of extreme maximum temperature events in Central China and adaptation strategies under different future warming scenarios
- Estimating Bowen ratio in local environment based on satellite imagery
- 3D fusion modeling of multi-scale geological structures based on subdivision-NURBS surfaces and stratigraphic sequence formalization
- Comparative analysis of machine learning algorithms in Google Earth Engine for urban land use dynamics in rapidly urbanizing South Asian cities
- Study on the mechanism of plant root influence on soil properties in expansive soil areas
- Simulation of seismic hazard parameters and earthquakes source mechanisms along the Red Sea rift, western Saudi Arabia
- Tectonics vs sedimentation in foredeep basins: A tale from the Oligo-Miocene Monte Falterona Formation (Northern Apennines, Italy)
- Investigation of landslide areas in Tokat-Almus road between Bakımlı-Almus by the PS-InSAR method (Türkiye)
- Predicting coastal variations in non-storm conditions with machine learning
- Cross-dimensional adaptivity research on a 3D earth observation data cube model
- Geochronology and geochemistry of late Paleozoic volcanic rocks in eastern Inner Mongolia and their geological significance
- Spatial and temporal evolution of land use and habitat quality in arid regions – a case of Northwest China
- Ground-penetrating radar imaging of subsurface karst features controlling water leakage across Wadi Namar dam, south Riyadh, Saudi Arabia
- Rayleigh wave dispersion inversion via modified sine cosine algorithm: Application to Hangzhou, China passive surface wave data
- Fractal insights into permeability control by pore structure in tight sandstone reservoirs, Heshui area, Ordos Basin
- Debris flow hazard characteristic and mitigation in Yusitong Gully, Hengduan Mountainous Region
- Research on community characteristics of vegetation restoration in hilly power engineering based on multi temporal remote sensing technology
- Identification of radial drainage networks based on topographic and geometric features
- Trace elements and melt inclusion in zircon within the Qunji porphyry Cu deposit: Application to the metallogenic potential of the reduced magma-hydrothermal system
- Pore, fracture characteristics and diagenetic evolution of medium-maturity marine shales from the Silurian Longmaxi Formation, NE Sichuan Basin, China
- Study of the earthquakes source parameters, site response, and path attenuation using P and S-waves spectral inversion, Aswan region, south Egypt
- Source of contamination and assessment of potential health risks of potentially toxic metal(loid)s in agricultural soil from Al Lith, Saudi Arabia
- Regional spatiotemporal evolution and influencing factors of rural construction areas in the Nanxi River Basin via GIS
- An efficient network for object detection in scale-imbalanced remote sensing images
- Effect of microscopic pore–throat structure heterogeneity on waterflooding seepage characteristics of tight sandstone reservoirs
- Environmental health risk assessment of Zn, Cd, Pb, Fe, and Co in coastal sediments of the southeastern Gulf of Aqaba
- A modified Hoek–Brown model considering softening effects and its applications
- Evaluation of engineering properties of soil for sustainable urban development
- The spatio-temporal characteristics and influencing factors of sustainable development in China’s provincial areas
- Application of a mixed additive and multiplicative random error model to generate DTM products from LiDAR data
- Gold vein mineralogy and oxygen isotopes of Wadi Abu Khusheiba, Jordan
- Prediction of surface deformation time series in closed mines based on LSTM and optimization algorithms
- 2D–3D Geological features collaborative identification of surrounding rock structural planes in hydraulic adit based on OC-AINet
- Spatiotemporal patterns and drivers of Chl-a in Chinese lakes between 1986 and 2023
- Land use classification through fusion of remote sensing images and multi-source data
- Nexus between renewable energy, technological innovation, and carbon dioxide emissions in Saudi Arabia
- Analysis of the spillover effects of green organic transformation on sustainable development in ethnic regions’ agriculture and animal husbandry
- Factors impacting spatial distribution of black and odorous water bodies in Hebei
- Large-scale shaking table tests on the liquefaction and deformation responses of an ultra-deep overburden
- Impacts of climate change and sea-level rise on the coastal geological environment of Quang Nam province, Vietnam
- Reservoir characterization and exploration potential of shale reservoir near denudation area: A case study of Ordovician–Silurian marine shale, China
- Seismic prediction of Permian volcanic rock reservoirs in Southwest Sichuan Basin
- Application of CBERS-04 IRS data to land surface temperature inversion: A case study based on Minqin arid area
- Geological characteristics and prospecting direction of Sanjiaoding gold mine in Saishiteng area
- Research on the deformation prediction model of surrounding rock based on SSA-VMD-GRU
- Geochronology, geochemical characteristics, and tectonic significance of the granites, Menghewula, Southern Great Xing’an range
- Hazard classification of active faults in Yunnan base on probabilistic seismic hazard assessment
- Characteristics analysis of hydrate reservoirs with different geological structures developed by vertical well depressurization
- Estimating the travel distance of channelized rock avalanches using genetic programming method
- Landscape preferences of hikers in Three Parallel Rivers Region and its adjacent regions by content analysis of user-generated photography
- New age constraints of the LGM onset in the Bohemian Forest – Central Europe
- Characteristics of geological evolution based on the multifractal singularity theory: A case study of Heyu granite and Mesozoic tectonics
- Soil water content and longitudinal microbiota distribution in disturbed areas of tower foundations of power transmission and transformation projects
- Oil accumulation process of the Kongdian reservoir in the deep subsag zone of the Cangdong Sag, Bohai Bay Basin, China
- Investigation of velocity profile in rock–ice avalanche by particle image velocimetry measurement
- Optimizing 3D seismic survey geometries using ray tracing and illumination modeling: A case study from Penobscot field
- Sedimentology of the Phra That and Pha Daeng Formations: A preliminary evaluation of geological CO2 storage potential in the Lampang Basin, Thailand
- Improved classification algorithm for hyperspectral remote sensing images based on the hybrid spectral network model
- Map analysis of soil erodibility rates and gully erosion sites in Anambra State, South Eastern Nigeria
- Identification and driving mechanism of land use conflict in China’s South-North transition zone: A case study of Huaihe River Basin
- Evaluation of the impact of land-use change on earthquake risk distribution in different periods: An empirical analysis from Sichuan Province
- A test site case study on the long-term behavior of geotextile tubes
- An experimental investigation into carbon dioxide flooding and rock dissolution in low-permeability reservoirs of the South China Sea
- Detection and semi-quantitative analysis of naphthenic acids in coal and gangue from mining areas in China
- Comparative effects of olivine and sand on KOH-treated clayey soil
- YOLO-MC: An algorithm for early forest fire recognition based on drone image
- Earthquake building damage classification based on full suite of Sentinel-1 features
- Potential landslide detection and influencing factors analysis in the upper Yellow River based on SBAS-InSAR technology
- Assessing green area changes in Najran City, Saudi Arabia (2013–2022) using hybrid deep learning techniques
- An advanced approach integrating methods to estimate hydraulic conductivity of different soil types supported by a machine learning model
- Hybrid methods for land use and land cover classification using remote sensing and combined spectral feature extraction: A case study of Najran City, KSA
- Streamlining digital elevation model construction from historical aerial photographs: The impact of reference elevation data on spatial accuracy
- Analysis of urban expansion patterns in the Yangtze River Delta based on the fusion impervious surfaces dataset
- A metaverse-based visual analysis approach for 3D reservoir models
- Late Quaternary record of 100 ka depositional cycles on the Larache shelf (NW Morocco)
- Integrated well-seismic analysis of sedimentary facies distribution: A case study from the Mesoproterozoic, Ordos Basin, China
- Study on the spatial equilibrium of cultural and tourism resources in Macao, China
- Urban road surface condition detecting and integrating based on the mobile sensing framework with multi-modal sensors
- Application of improved sine cosine algorithm with chaotic mapping and novel updating methods for joint inversion of resistivity and surface wave data
- The synergistic use of AHP and GIS to assess factors driving forest fire potential in a peat swamp forest in Thailand
- Dynamic response analysis and comprehensive evaluation of cement-improved aeolian sand roadbed
- Rock control on evolution of Khorat Cuesta, Khorat UNESCO Geopark, Northeastern Thailand
- Gradient response mechanism of carbon storage: Spatiotemporal analysis of economic-ecological dimensions based on hybrid machine learning
- Comparison of several seismic active earth pressure calculation methods for retaining structures
- Mantle dynamics and petrogenesis of Gomer basalts in the Northwestern Ethiopia: A geochemical perspective
- Study on ground deformation monitoring in Xiong’an New Area from 2021 to 2023 based on DS-InSAR
- Paleoenvironmental characteristics of continental shale and its significance to organic matter enrichment: Taking the fifth member of Xujiahe Formation in Tianfu area of Sichuan Basin as an example
- Equipping the integral approach with generalized least squares to reconstruct relict channel profile and its usage in the Shanxi Rift, northern China
- InSAR-driven landslide hazard assessment along highways in hilly regions: A case-based validation approach
- Attribution analysis of multi-temporal scale surface streamflow changes in the Ganjiang River based on a multi-temporal Budyko framework
- Maps analysis of Najran City, Saudi Arabia to enhance agricultural development using hybrid system of ANN and multi-CNN models
- Hybrid deep learning with a random forest system for sustainable agricultural land cover classification using DEM in Najran, Saudi Arabia
- Long-term evolution patterns of groundwater depth and lagged response to precipitation in a complex aquifer system: Insights from Huaibei Region, China
- Remote sensing and machine learning for lithology and mineral detection in NW, Pakistan
- Spatial–temporal variations of NO2 pollution in Shandong Province based on Sentinel-5P satellite data and influencing factors
- Numerical modeling of geothermal energy piles with sensitivity and parameter variation analysis of a case study
- Stability analysis of valley-type upstream tailings dams using a 3D model
- Variation characteristics and attribution analysis of actual evaporation at monthly time scale from 1982 to 2019 in Jialing River Basin, China
- Investigating machine learning and statistical approaches for landslide susceptibility mapping in Minfeng County, Xinjiang
- Investigating spatiotemporal patterns for comprehensive accessibility of service facilities by location-based service data in Nanjing (2016–2022)
- A pre-treatment method for particle size analysis of fine-grained sedimentary rocks, Bohai Bay Basin, China
- Study on the formation mechanism of the hard-shell layer of liquefied silty soil
- Comprehensive analysis of agricultural CEE: Efficiency assessment, mechanism identification, and policy response – A case study of Anhui Province
- Simulation study on the damage and failure mechanism of the surrounding rock in sanded dolomite tunnels
- Towards carbon neutrality: Spatiotemporal evolution and key influences on agricultural ecological efficiency in Northwest China
- High-frequency cycles drive the cyclical enrichment of oil in porous carbonate reservoirs: A case study of the Khasib Formation in E Oilfield, Mesopotamian Basin, Iraq
- Reconstruction of digital core models of granular rocks using mathematical morphology
- Spatial–temporal differentiation law of habitat quality and its driving mechanism in the typical plateau areas of the Loess Plateau in the recent 30 years
- A machine-learning-based approach to predict potential oil sites: Conceptual framework and experimental evaluation
- Effects of landscape pattern change on waterbird diversity in Xianghai Nature Reserve
- Research on intelligent classification method of highway tunnel surrounding rock classification based on parameters while drilling
- River morphology and tectono-sedimentary analysis of a shallow river delta: A case study of Putaohua oil layer in Saertu oilfield (L. Cretaceous), China
- Review Articles
- Humic substances influence on the distribution of dissolved iron in seawater: A review of electrochemical methods and other techniques
- Applications of physics-informed neural networks in geosciences: From basic seismology to comprehensive environmental studies
- Ore-controlling structures of granite-related uranium deposits in South China: A review
- Shallow geological structure features in Balikpapan Bay East Kalimantan Province – Indonesia
- A review on the tectonic affinity of microcontinents and evolution of the Proto-Tethys Ocean in Northeastern Tibet
- Advancements in machine learning applications for mineral prospecting and geophysical inversion: A review
- Special Issue: Natural Resources and Environmental Risks: Towards a Sustainable Future - Part II
- Depopulation in the Visok micro-region: Toward demographic and economic revitalization
- Special Issue: Geospatial and Environmental Dynamics - Part II
- Advancing urban sustainability: Applying GIS technologies to assess SDG indicators – a case study of Podgorica (Montenegro)
- Spatiotemporal and trend analysis of common cancers in men in Central Serbia (1999–2021)
- Minerals for the green agenda, implications, stalemates, and alternatives
- Spatiotemporal water quality analysis of Vrana Lake, Croatia
- Functional transformation of settlements in coal exploitation zones: A case study of the municipality of Stanari in Republic of Srpska (Bosnia and Herzegovina)
- Hypertension in AP Vojvodina (Northern Serbia): A spatio-temporal analysis of patients at the Institute for Cardiovascular Diseases of Vojvodina
- Regional patterns in cause-specific mortality in Montenegro, 1991–2019
- Spatio-temporal analysis of flood events using GIS and remote sensing-based approach in the Ukrina River Basin, Bosnia and Herzegovina
- Flash flood susceptibility mapping using LiDAR-Derived DEM and machine learning algorithms: Ljuboviđa case study, Serbia
- Geocultural heritage as a basis for geotourism development: Banjska Monastery, Zvečan (Serbia)
- Assessment of groundwater potential zones using GIS and AHP techniques – A case study of the zone of influence of Kolubara Mining Basin
- Impact of the agri-geographical transformation of rural settlements on the geospatial dynamics of soil erosion intensity in municipalities of Central Serbia
- Where faith meets geomorphology: The cultural and religious significance of geodiversity explored through geospatial technologies
- Applications of local climate zone classification in European cities: A review of in situ and mobile monitoring methods in urban climate studies
- Complex multivariate water quality impact assessment on Krivaja River
- Ionization hotspots near waterfalls in Eastern Serbia’s Stara Planina Mountain
- Shift in landscape use strategies during the transition from the Bronze age to Iron age in Northwest Serbia
- Assessing the geotourism potential of glacial lakes in Plav, Montenegro: A multi-criteria assessment by using the M-GAM model
- Flash flood potential index at national scale: Susceptibility assessment within catchments
- SWAT modelling and MCDM for spatial valuation in small hydropower planning
- Disaster risk perception and local resilience near the “Duboko” landfill: Challenges of governance, management, trust, and environmental communication in Serbia