Comparative analysis of machine learning algorithms in Google Earth Engine for urban land use dynamics in rapidly urbanizing South Asian cities
-
Farzana Afroz
 and
Md. Mostafizur Rahman
and
Md. Mostafizur Rahman

Abstract
Land use/land cover (LULC) dynamics play a crucial role in understanding the complex interactions between ecosystems and climate. This study demonstrates the effective integration of Google Earth Engine (GEE) and machine learning (ML) algorithms for monitoring LULC changes in two rapidly urbanizing cities in Bangladesh. By combining Landsat imagery with classification and regression trees, random forest (RF), and support vector machine algorithms within the GEE platform, we analyzed LULC changes from 2001 to 2021. Our analysis revealed significant urban expansion in both cities, with built-up areas showing the highest increase, while natural land covers experienced notable declines. The RF classifier consistently demonstrated superior performance, with the overall accuracy exceeding 93%. The GEE-based approach significantly reduced the processing time compared to traditional methods, while the integration of multiple ML algorithms enhanced the classification accuracy. This research advances environmental monitoring by showcasing the effectiveness of cloud-based geospatial analysis for rapid and accurate LULC change detection. The methodology presented herein offers valuable insights for urban planners and policymakers, particularly in rapidly urbanizing regions, contributing to Sustainable Development Goals 11 (Sustainable Cities and Communities) and 15 (Life on Land).
1 Introduction
Environmental sustainability and effective environmental management are critical for ensuring our planet’s well-being and its inhabitants. The data provided by satellite-based remote sensing (RS) technologies play a crucial role in monitoring and understanding environmental changes, facilitating informed decision-making and policy formulation toward sustainable development [1,2,3,4]. RS imageries are valuable products for understanding worldwide land and environmental dynamics over different time series. While various satellites provide Earth observation data, Landsat and Sentinel-2 are particularly crucial for land use monitoring due to their temporal consistency and spatial resolution. The United States Geological Survey (USGS) manages the Landsat program, with Landsat-5 being operational from 1984 to 2011 and Landsat-8 operational since 2013 [1,2]. The Sentinel-2 satellites, being part of the European Space Agency’s Copernicus program, complement Landsat data with a higher spatial resolution (10–20 m) and more frequent revisit times. These satellites deliver consistent, high-quality imagery ideal for long-term land use/land cover (LULC) monitoring. While Sentinel-2A debuted in 2015, it took two more years for Sentinel-2B to execute and was started in 2017, and both are still operational [3]. SPOT is a series of high-resolution satellites developed by the French National Centre for Space Studies. While SPOT 1 was operated from 1986 to 1990, SPOT 6 and SPOT 7 were launched in 2012 and 2014, respectively, and are still running [4]. The MODIS is a sensor onboard NASA’s Terra and Aqua satellites and was initiated in 1999 and 2002 and functioning yet [5]. The ALOS is a Japanese satellite that carries the AVNIR-2 and PRISM sensors. It was launched in 2006 and operated until 2011 [6]. There are disparities in their spatial and temporal properties in addition to differences in the collection methods. Landsat-5 and -8 satellites deliver 30 m per pixel imagery. Sentinel-2 has 13 spectral bands with resolutions ranging from 10 to 60 meters per pixel [7,8]. Other sources of data – SPOT and MODIS – generate 2.5–10 m and 250–1,000 m per images. The ALOS’ sensor PRISM had 2.5–10 m resolution and AVNIR-2 80–240 m resolution [4,9].
The Google Earth Engine (GEE) addresses critical challenges in large-scale geospatial analysis through its cloud-based computing infrastructure [10]. Traditional LULC analysis methods often struggle with processing large datasets, requiring significant computational resources and time. GEE overcomes these limitations by offering scalable processing capabilities, automated image pre-processing, and efficient handling of time-series data [11,12,13,14,15]. These features are particularly valuable for analyzing rapid urban expansion in developing regions, where computational resources may be limited. Additionally, GEE’s integration with machine learning (ML) algorithms enables more sophisticated classification approaches that can improve the accuracy in complex urban landscapes. A review of ML algorithms and LULC classification are popular research areas within the GEE platform [16]. In image classification challenges, deep neural networks have shown promising accuracy results. Although this type of classifier is not yet backed, the GEE was connected to TensorFlow in 2019. TFRecord imagery, training, and testing datasets can be imported/exported via the GEE application programming interface (API) [12].
Satellite-derived data have the integrity to perceive the pattern of urban sprawl and numerous urban dynamics such as urban expansion, land use transformations, and urban heat islands [17,18,19,20,21,22]. Many studies were conventionally conducted on LULC dynamics using different methods like cellular automaton [19,20], Markov chain model [22,23,24,25], artificial neural network [20,26,27], binary logistic regression algorithm [17], and ML algorithm [28,29,30,31]. One study performed LULC classification using three different ML algorithms in the GEE and compared the efficacy level of ML models over Landsat-8 and Sentinel-2 in India [32]. Another research was conducted on a space-time study of sub-regions in Singapore to assess the GEE capacity [10]. Using traditional ways for LULC change, one study examined three ML models’ efficiency in rural and urban setups of Bangladesh where the support vector machine (SVM) showed better results [33,34]. In two different studies applying the normal practice of LULC analysis, only SVM was used for the Rajshahi city, while random forest (RF) was used for the Chattogram city [35,36]. Other research applied the maximum likelihood classification (MLC) technique for LULC of Rajshahi and Chattogram areas [36,37,38]. Recent advancements in LULC analysis have demonstrated significant progress in monitoring urban dynamics. Pan et al. developed detailed classification methods using ML algorithms in GEE [28], while Kang and Kanniah explored LULC impacts on river morphology [31]. The integration of GEE has revolutionized LULC analysis through cloud-computing capabilities [39]. These recent studies highlight the growing importance of combining ML algorithms with cloud-based platforms for efficient LULC monitoring.
While previous studies have examined LULC changes in Bangladesh using traditional methods or single ML algorithms, there remains a critical gap in understanding the comparative performance of multiple ML algorithms within the GEE platform for urban analysis. Furthermore, existing studies have not fully explored the potential of cloud-based processing for rapid urban monitoring in developing regions. This study addresses these gaps by (1) implementing and comparing three different ML algorithms (RF, classification and regression trees [CART], and SVM) within GEE, (2) quantifying the computational efficiency gains of cloud-based processing, and (3) developing a reproducible methodology for monitoring rapid urban expansion in resource-constrained environments. Our approach focuses specifically on two contrasting urban areas in Bangladesh, providing insights into the adaptability of GEE-based analysis across different urban contexts. The novelty of this research lies in the integration of the GEE platform for large-scale geospatial data analysis. Leveraging the capabilities of GEE, this study streamlines image pre-processing, reducing the time and effort required for essential tasks such as mosaicking and image averaging, as compared to conventional approaches. Additionally, this article explores the application of deep neural networks, supported by TensorFlow, within the GEE platform. This integration enhances the accuracy and efficiency of LULC classification, with deep neural networks showing promising results in image classification challenges. The use of ML models in a web-based platform like GEE opens up new possibilities for conducting large-scale environmental studies, enabling researchers and policymakers to make informed decisions to address environmental sustainability challenges. The findings of this research hold significant broader impacts for environmental sustainability and management. Accurate LULC classification using satellite-derived data empowers decision-makers to monitor and manage urban sprawl, land use transformations, and other environmental changes more effectively [18,19]. Understanding the patterns of urban expansion and the impact on land cover can inform sustainable urban planning and infrastructure development, ensuring a balance between urbanization and ecological preservation. In summary, this article contributes to the advancement of environmental sustainability and management by showcasing the potential of GEE and ML algorithms in analyzing RS data. The results offer valuable inputs for evidence-based decision-making, fostering a more sustainable and ecologically balanced future for our planet.
2 Materials and methods
2.1 Study area
This study examined LULC dynamics in two contrasting urban contexts of Bangladesh: Rajshahi City Corporation (RCC) and Chattogram City Corporation (CCC) (Figure 1). RCC spans 48 km² with 450,000 residents, yielding a population density of 9,370 people/km². The area features diverse LULC types, including built-up areas, agricultural lands, and water bodies, with urban growth primarily driven by economic zone development and high-tech park establishment, resulting in a 3.2% annual urban expansion rate [34,35]. CCC covers 184 km² with 2.6 million inhabitants, creating a higher population density of 14,130 people/km². The city’s LULC is characterized by built-up areas, hills, and port facilities, with port activities and industrial growth driving an annual urban growth rate of 4.8% [34,36,40].
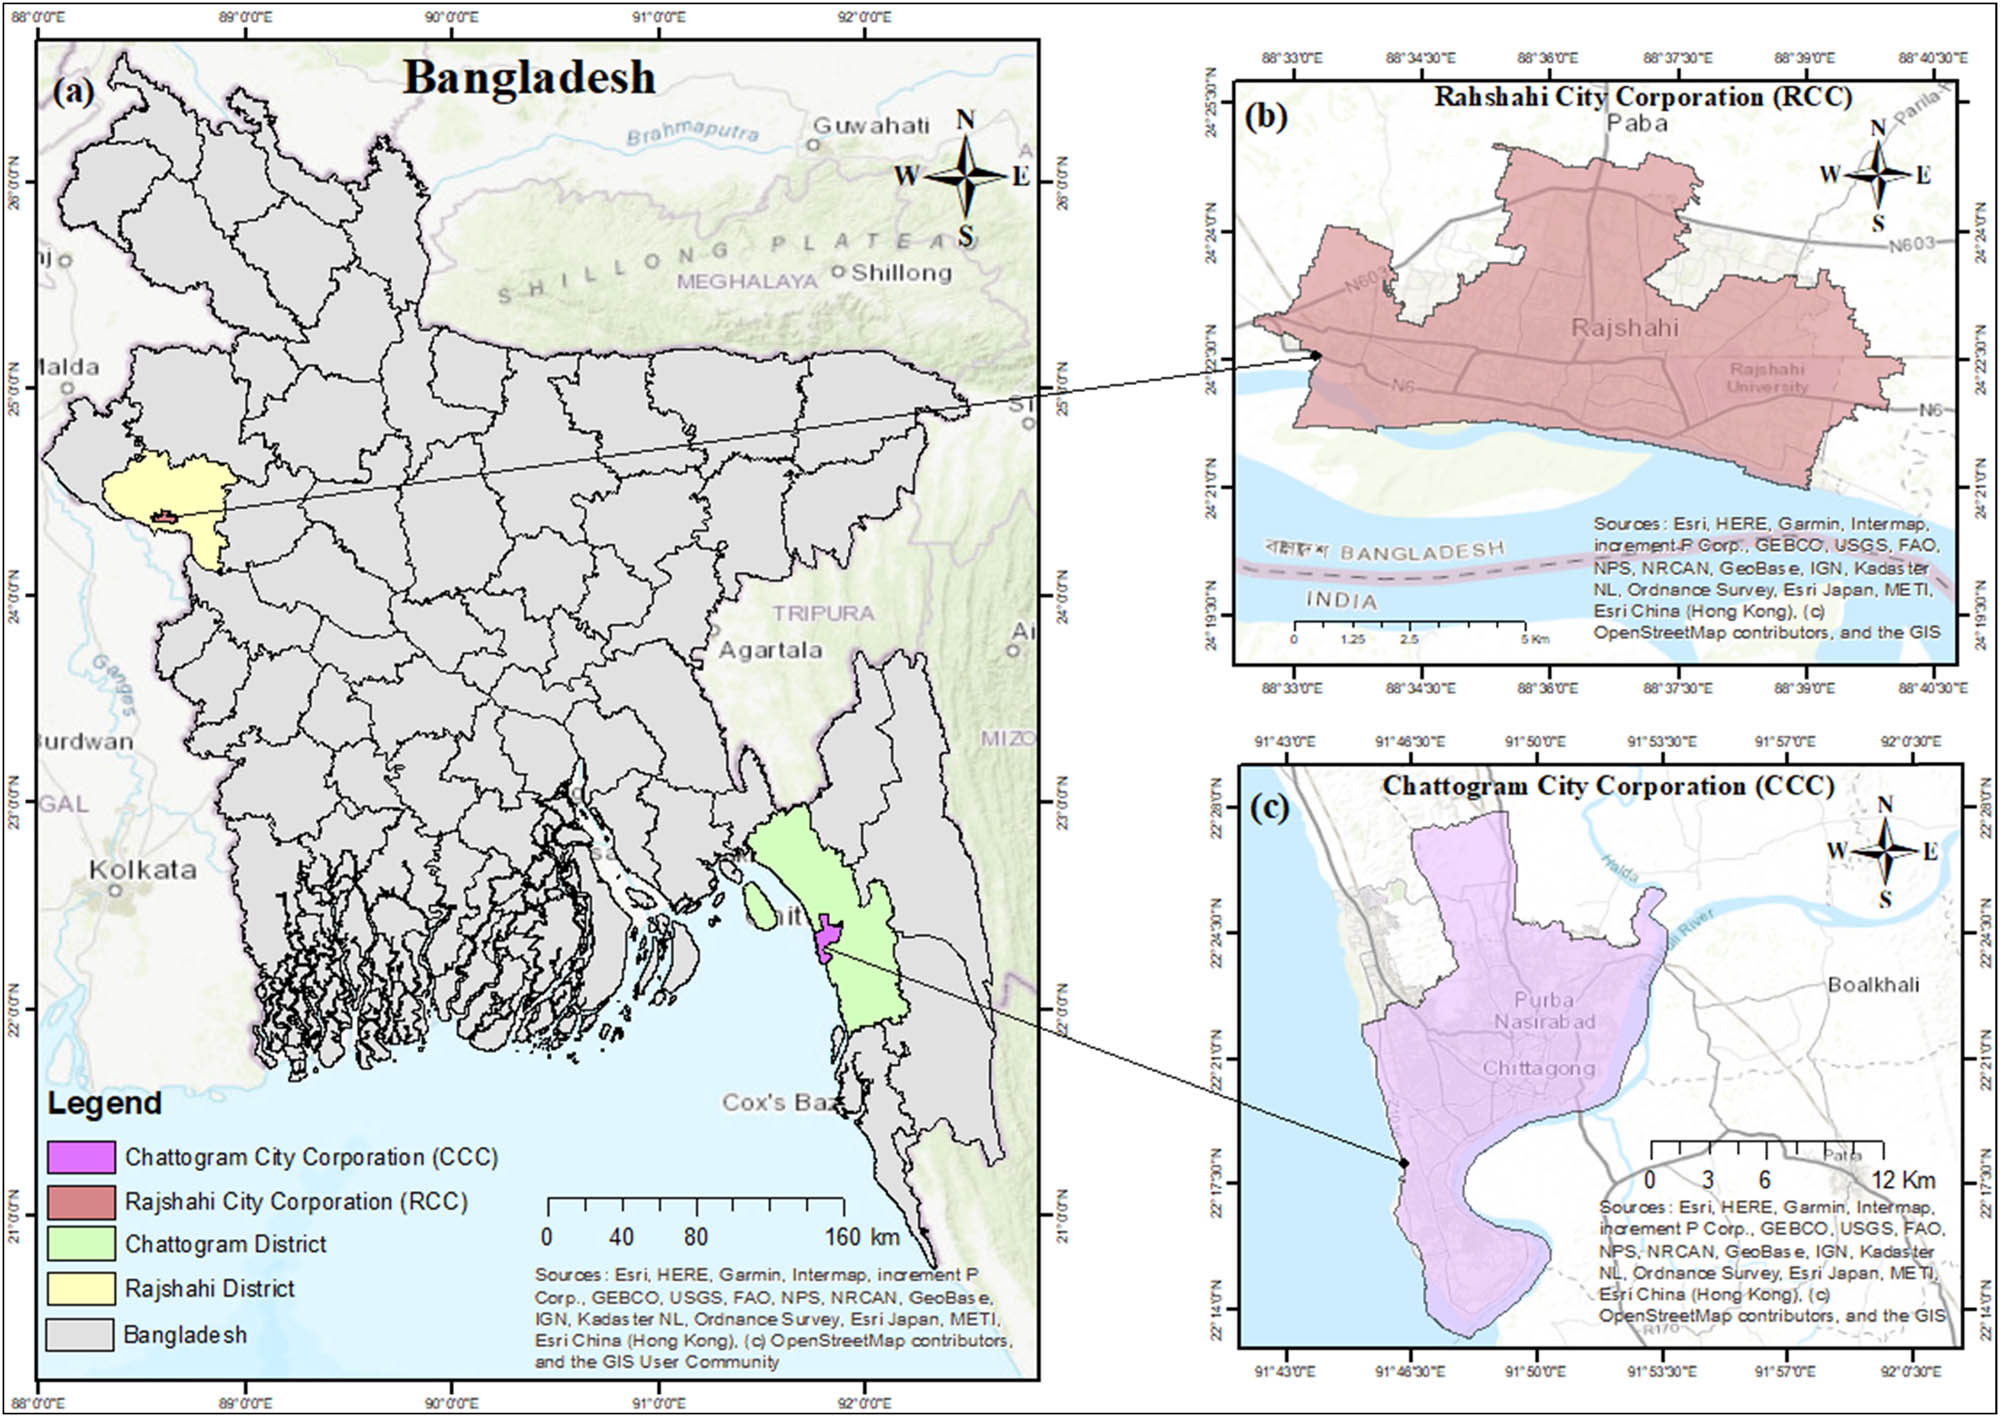
Geographic location of the study areas showing the (a) location of Bangladesh in South Asia, (b) RCC and CCC within Bangladesh, and (c) administrative boundaries of the study areas with major landmarks.
2.2 Data acquisition and processing
The processing of Landsat imagery involved a comprehensive workflow implemented through the GEE API. The initial data composition began with the creation of ImageCollections, which comprised temporally and spatially consistent sets of satellite imagery [41,42,43]. For each study period, we imported Landsat data using specific collection IDs: “LANDSAT/LT05/C01/T1_TOA” for Landsat 5 and “LANDSAT/LC08/C02/T1_TOA” for Landsat 8 [39]. Between 2001 and 2011, eight Landsat-5 images were processed, while 17 Landsat-8 images were analyzed for 2021. The median reduction approach was selected for image compositing as it effectively minimizes the influence of outliers and atmospheric anomalies. While this method may smooth some extreme values, it provides more stable results compared to mean-based compositing, particularly in tropical regions with frequent cloud cover [31]. The 10% cloud cover threshold was chosen based on preliminary analysis showing that a stricter threshold (e.g., 5%) would eliminate too many valuable observations, while a more lenient threshold risked including cloud-contaminated pixels [15]. In cases where this threshold resulted in data gaps, we implemented a temporal interpolation approach using adjacent cloud-free observations. The spectral characteristics of both Landsat sensors were carefully considered in band selection (Table 1). Six spectral bands spanning visible to shortwave infrared wavelengths were utilized, maintaining consistency across sensors despite their slight differences in spectral resolution. Each pixel represented a 30 m × 30 m ground area, providing an appropriate spatial resolution for urban LULC analysis.
Spectral and spatial characteristics of Landsat data layers used for LULC classification, including band specifications, wavelength ranges, and data acquisition parameters for both Landsat-5 and Landsat-8 imagery
| Dataset | Source | Bands used | Wavelength (μm) |
|---|---|---|---|
| Landsat-5 collection 1 Tier 1 TOA reflectance | GEE, data retrieved via USGS (accessed Jan. 22, 2023) | Band 2 – green | 0.52–0.60 |
| Band 3 – red | 0.63–0.69 | ||
| Band 4 – near-infrared | 0.76–0.90 | ||
| Band 5 – shortwave infrared 1 | 1.55–1.75 | ||
| Band 6 – thermal infrared 1 | 10.4–12.5 | ||
| Band 7 – shortwave infrared 2 | 2.08–2.35 | ||
| Landsat-8 collection 2 Tier 1 TOA reflectance | GEE, data retrieved via USGS (accessed Jan. 22, 2023) | Band 2 – blue | 0.45–0.51 |
| Band 3 – green | 0.53–0.59 | ||
| Band 4 – red | 0.64–0.67 | ||
| Band 5 – near-infrared | 0.85–0.88 | ||
| Band 6 – shortwave infrared 1 | 1.57–1.65 | ||
| Band 7 – shortwave infrared 2 | 2.11–2.29 |
2.3 Classification methodology
2.3.1 Training sample collection
Training and validation samples were meticulously selected to meet both statistical requirements and practical constraints. While larger sample sizes generally enhance the classification accuracy, previous studies have demonstrated that for medium-resolution imagery, 75–100 samples per class can achieve satisfactory results when samples are well distributed and representative [41,42]. In our study, we collected 80–90 samples per class for training and 65–80 samples for validation. This approach ensured a spatial distribution across the study area, representative coverage of spectral variability within each class, and minimal edge effects by avoiding mixed pixels. Additionally, we validated sample quality using high-resolution Google Earth imagery. A power analysis indicated that these sample sizes could detect classification differences at an alpha level of 0.05 with 80% power. To quantify the urban growth patterns, particularly leapfrog development, we calculated five spatial metrics: fragmentation index (FI), mean patch size (MPS), number of urban patches (NP), mean inter-patch distance (MID), and edge density (ED). The FI was calculated using equation (1) [43,44].
where n is the number of different patch types present in the landscape and c is the total number of patches. MPS was calculated by dividing the total urban area by NP. MID represents the average Euclidean distance between centers of urban patches. These metrics were calculated using spatial analysis tools in GEE for both RCC and CCC to enable quantitative comparison of urban growth patterns.
2.3.2 ML algorithm implementation
Three ML algorithms were implemented through the GEE classification framework (Figure 2). The CART algorithm created binary decision trees, systematically partitioning the feature space based on optimal splitting criteria [9]. While CART offered interpretable results, its sensitivity to training data variations necessitated careful sample selection. The RF classifier employed an ensemble approach, utilizing 300 decision trees to optimize classification accuracy. This number was selected based on extensive literature review, suggesting optimal performance between 100 and 500 trees [39,45]. RF’s strength lay in its ability to handle large datasets and resist overfitting through its bootstrapping and random feature selection processes. The SVM classifier was implemented using the “.libsvm” package, employing a radial basis function kernel. Hyperparameter optimization included careful selection of gamma values to balance local and global influence and cost parameter (C) adjustment to control classification margin size. This optimization process is crucial for achieving optimal classification performance with smaller training datasets [9,41,42].
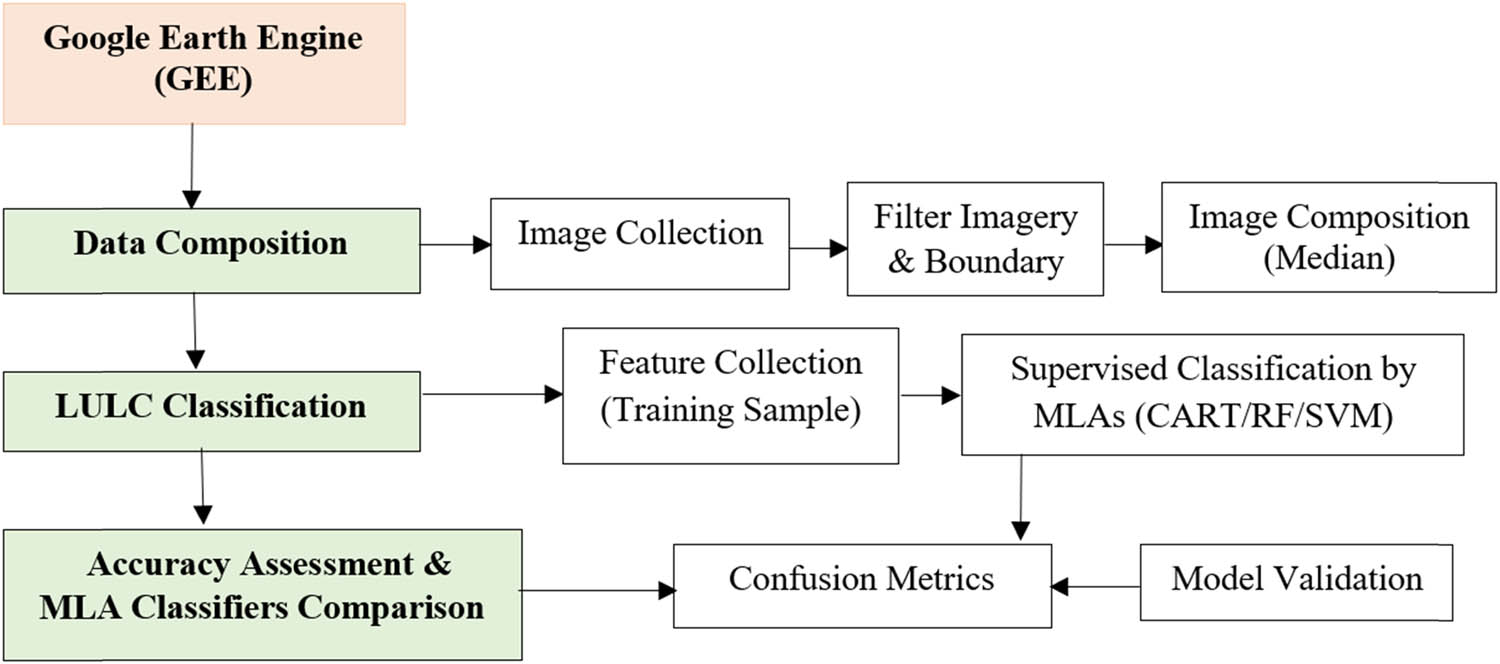
Comprehensive methodological workflow depicting data acquisition and preprocessing steps, implementation of ML algorithms, and accuracy assessment and validation procedures.
2.4 Accuracy assessment and validation
The accuracy assessment protocol implemented in this study followed a comprehensive approach to evaluate the reliability and comparative performance of the three ML classifiers. For each temporal period (2001, 2011, and 2021), classification accuracy was assessed using multiple complementary metrics developed specifically for the GEE platform. This multimetric approach provided a thorough understanding of classification performance across different LULC classes and temporal periods. The foundation of our accuracy assessment rested on the calculation of the overall accuracy (OA), representing the ratio of correctly classified pixels to the total number of pixels in the validation dataset. While the OA provided a general measure of classification success, we recognized its limitations in representing class-specific accuracy. Therefore, we supplemented this metric with the kappa coefficient, a more robust statistical measure that accounts for the agreement occurring by chance. This coefficient proved particularly valuable in assessing whether our classification significantly outperformed the random assignment of classes [46,47]. To address class-specific accuracy, we employed both user accuracy (UA) and producer accuracy (PA) metrics. UA measured the reliability of the classification from the user’s perspective, quantifying commission errors where pixels might be incorrectly included in a class. Conversely, PA evaluated the accuracy from the producer’s standpoint, identifying omission errors where pixels might be incorrectly excluded from their true class. These complementary metrics provided crucial insights into the strengths and weaknesses of our classification approach for each LULC category [47]. The validation process utilized GEE’s ee.FeatureCollection.errorMatrix() functionality, enabling systematic computation of error matrices and derived accuracy metrics. This approach allowed for the detailed analysis of classification performance across all LULC classes, identifying specific areas of confusion between classes and potential sources of error. The resulting error matrices formed the basis for calculating class-specific accuracy metrics and overall performance indicators.
In addition to traditional accuracy metrics (OA, kappa, UA, PA), we implemented area under the receiver operating characteristic curve (AUC-ROC) analysis to provide a more robust evaluation of classifier performance. While kappa statistics have been widely used in remote sensing classification assessment, recent studies have highlighted limitations including its sensitivity to prevalence and bias [48]. To address these concerns, we employed AUC-ROC analysis, which evaluates classifier performance across various threshold values and is less affected by class imbalance.
For model validation, we implemented k-fold cross-validation with k = 10, randomly partitioning the dataset into 80% training and 20% validation samples for each fold. This approach ensured robust evaluation by testing the model on multiple independent subsets of data, reducing the risk of over fitting and providing more reliable accuracy estimates [49].
2.5 Statistical analysis and performance evaluation
Beyond basic accuracy metrics, we conducted statistical analyses to evaluate the significance of differences between classifier performances. The assessment included the generation of confidence intervals for accuracy metrics, enabling the robust comparison of classifier performance across different temporal periods and LULC classes. This statistical framework provided a solid foundation for evaluating the reliability and effectiveness of our classification methodology while also identifying areas for potential improvement in future applications.
3 Results
3.1 LULC changes using the GEE
The analysis reveals significant LULC changes across both study areas through the GEE platform from 2001 to 2021. Through JavaScript-based coding and functions, three ML models – CART, RF, and SVM – provided distinct LULC classifications shown in Figures 3 and 4. Two primary trends emerged from the analysis: an increasing trend in settlements and a decreasing trend in water bodies, vegetation, and fallow land over the study periods. The decadal assessment for RCC shows that settlements covered 19.4 km² in 2001, expanding to 21.6 km² with a 4.6% growth by 2011 and further increasing to 22.15 km² with an additional 1.1% growth by 2021. This expansion pattern correlates with the construction of the Jamuna Multipurpose Bridge in 1998, which enhanced the regional connectivity [50]. A notable pattern in Figure 3 illustrates the leapfrog development in RCC, characterized by unplanned city expansion. The analysis reveals that RCC experienced approximately 4.6% increase in settlements during 2001–2011, with a total rise of 5.7% from 2001 to 2021 (Figure 5). Water bodies showed a modest 0.5% decrease from 2001 to 2021, with an additional 0.1% decline between 2011 and 2021, primarily due to illegal conversion for settlements or landfills. Similarly, the fallow land, including parks, fields, and char land, decreased by 3.3% from 2001 to 2021. Vegetation coverage declined by 1.2% during 2001–2011 and an additional 0.7% from 2011 to 2021. In contrast, CCC exhibited asymmetrical growth, with urban expansion occurring primarily through hill cutting or vegetation cover loss (Figure 4). The analysis shows vegetation cover losses of 3.6% from 2001 to 2011 and 2.6% from 2011 to 2021. Settlements in CCC expanded from 52 km² in 2001 to 68.9 km² (9% growth) in 2011 and further increased to approximately 79.7 km² (6% growth) by 2021 (Table 2). In addition, the analysis reveals fragmented urban expansion patterns in RCC, quantified through spatial metrics. The FI increased from 0.42 in 2001 to 0.67 in 2021, indicating increasingly dispersed development. MPS decreased from 12.3 to 8.7 km², while the number of isolated urban patches increased by 45% over the study period. The mean distance between urban patches was 1.2 km in 2021, demonstrating significant urban sprawl. These findings align with previous research on Chattogram City Corporation’s urban expansion patterns [36,51].
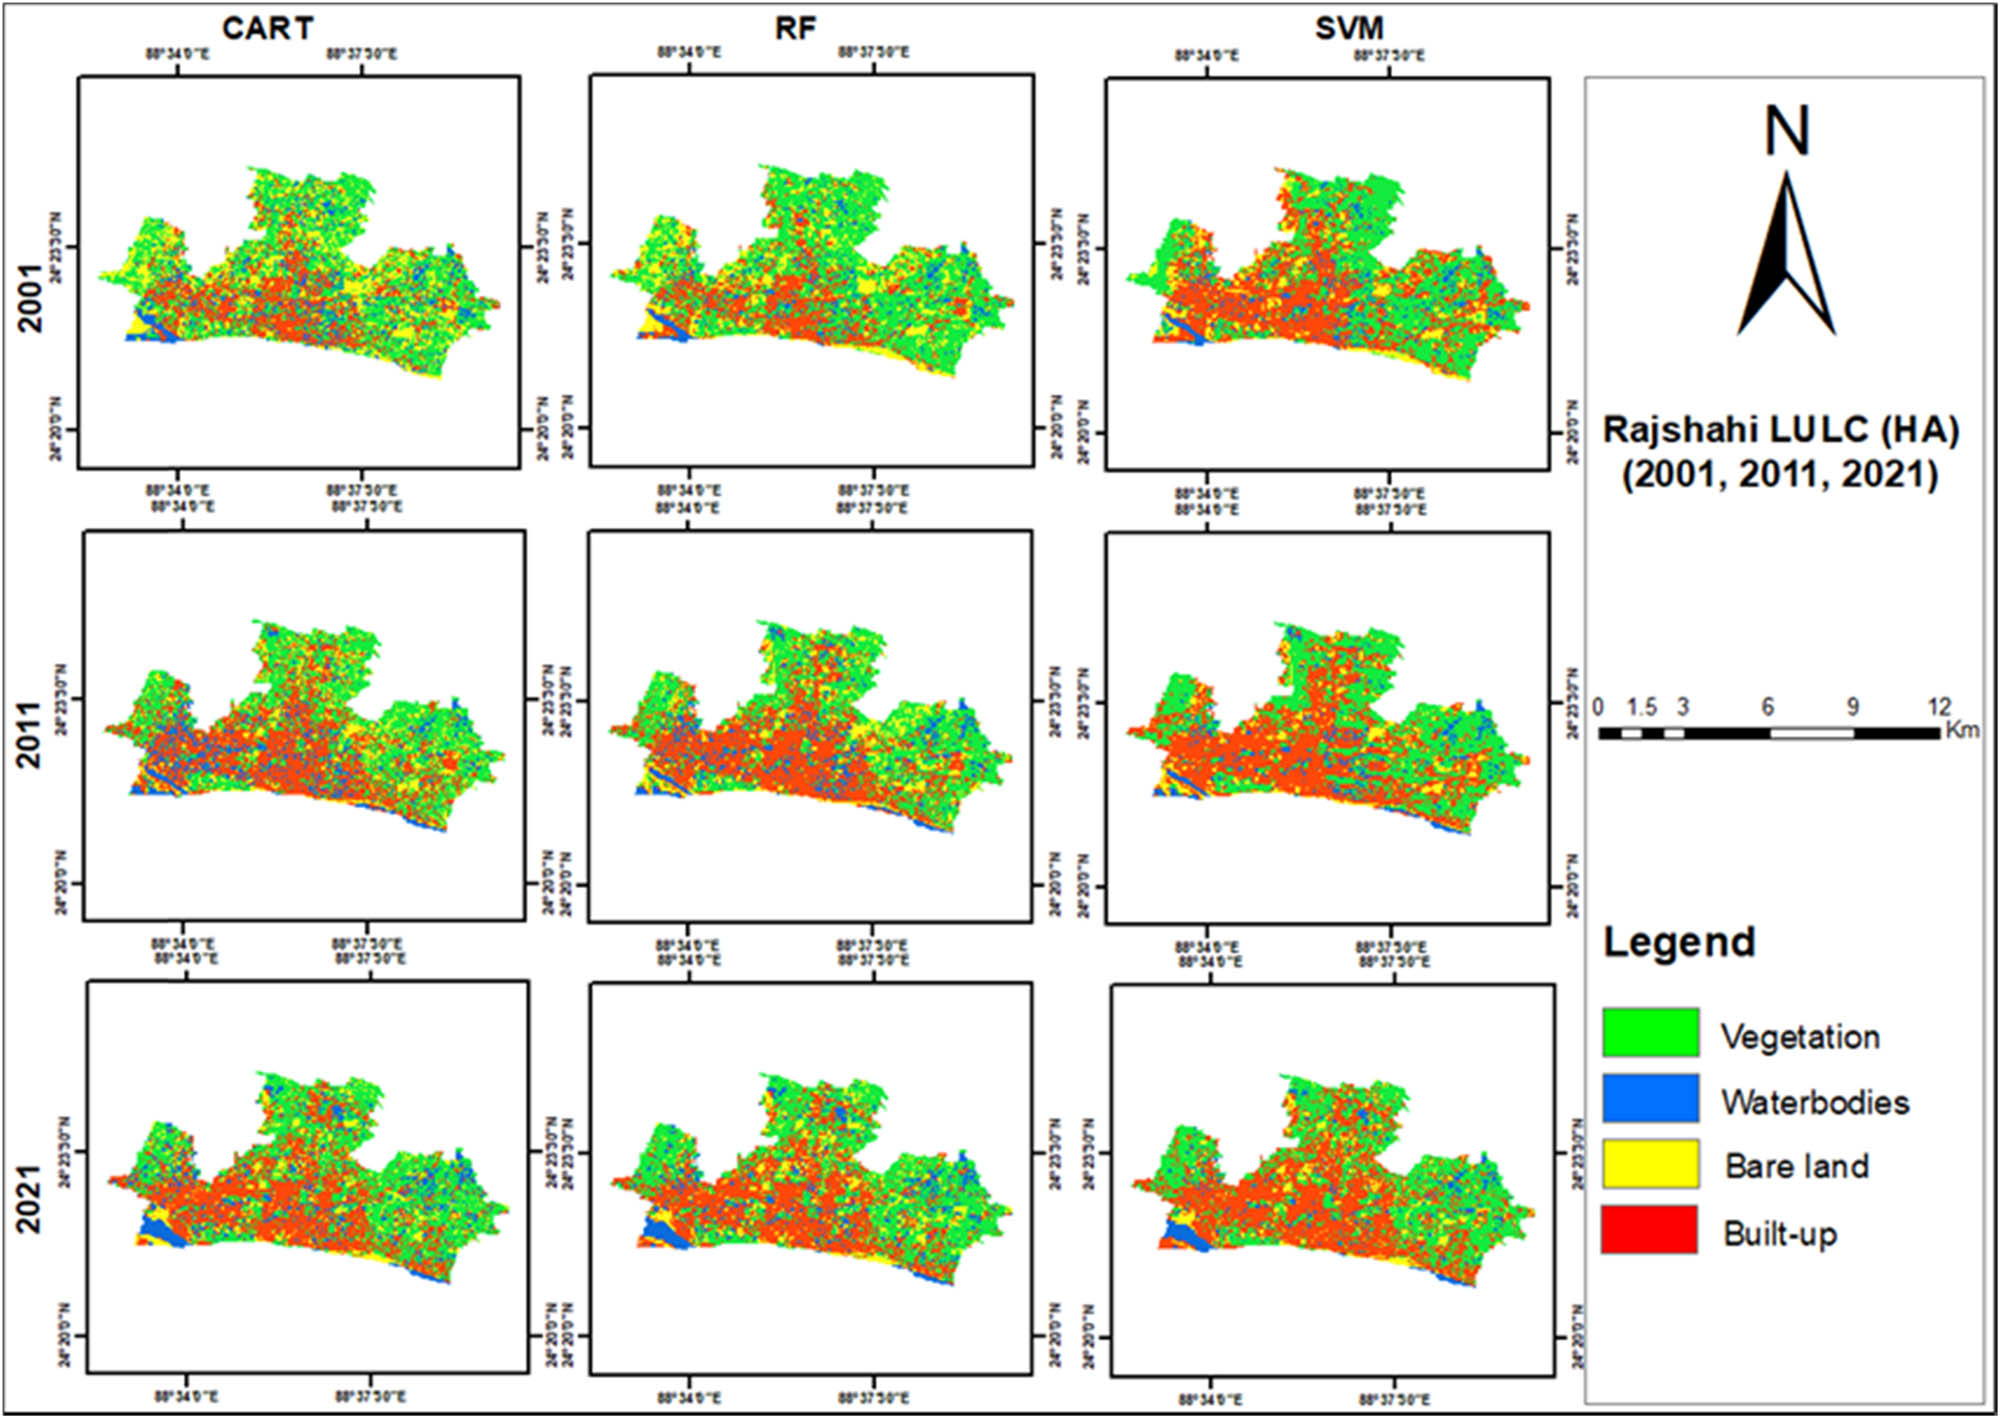
Spatiotemporal LULC changes in RCC during 2001–2021.
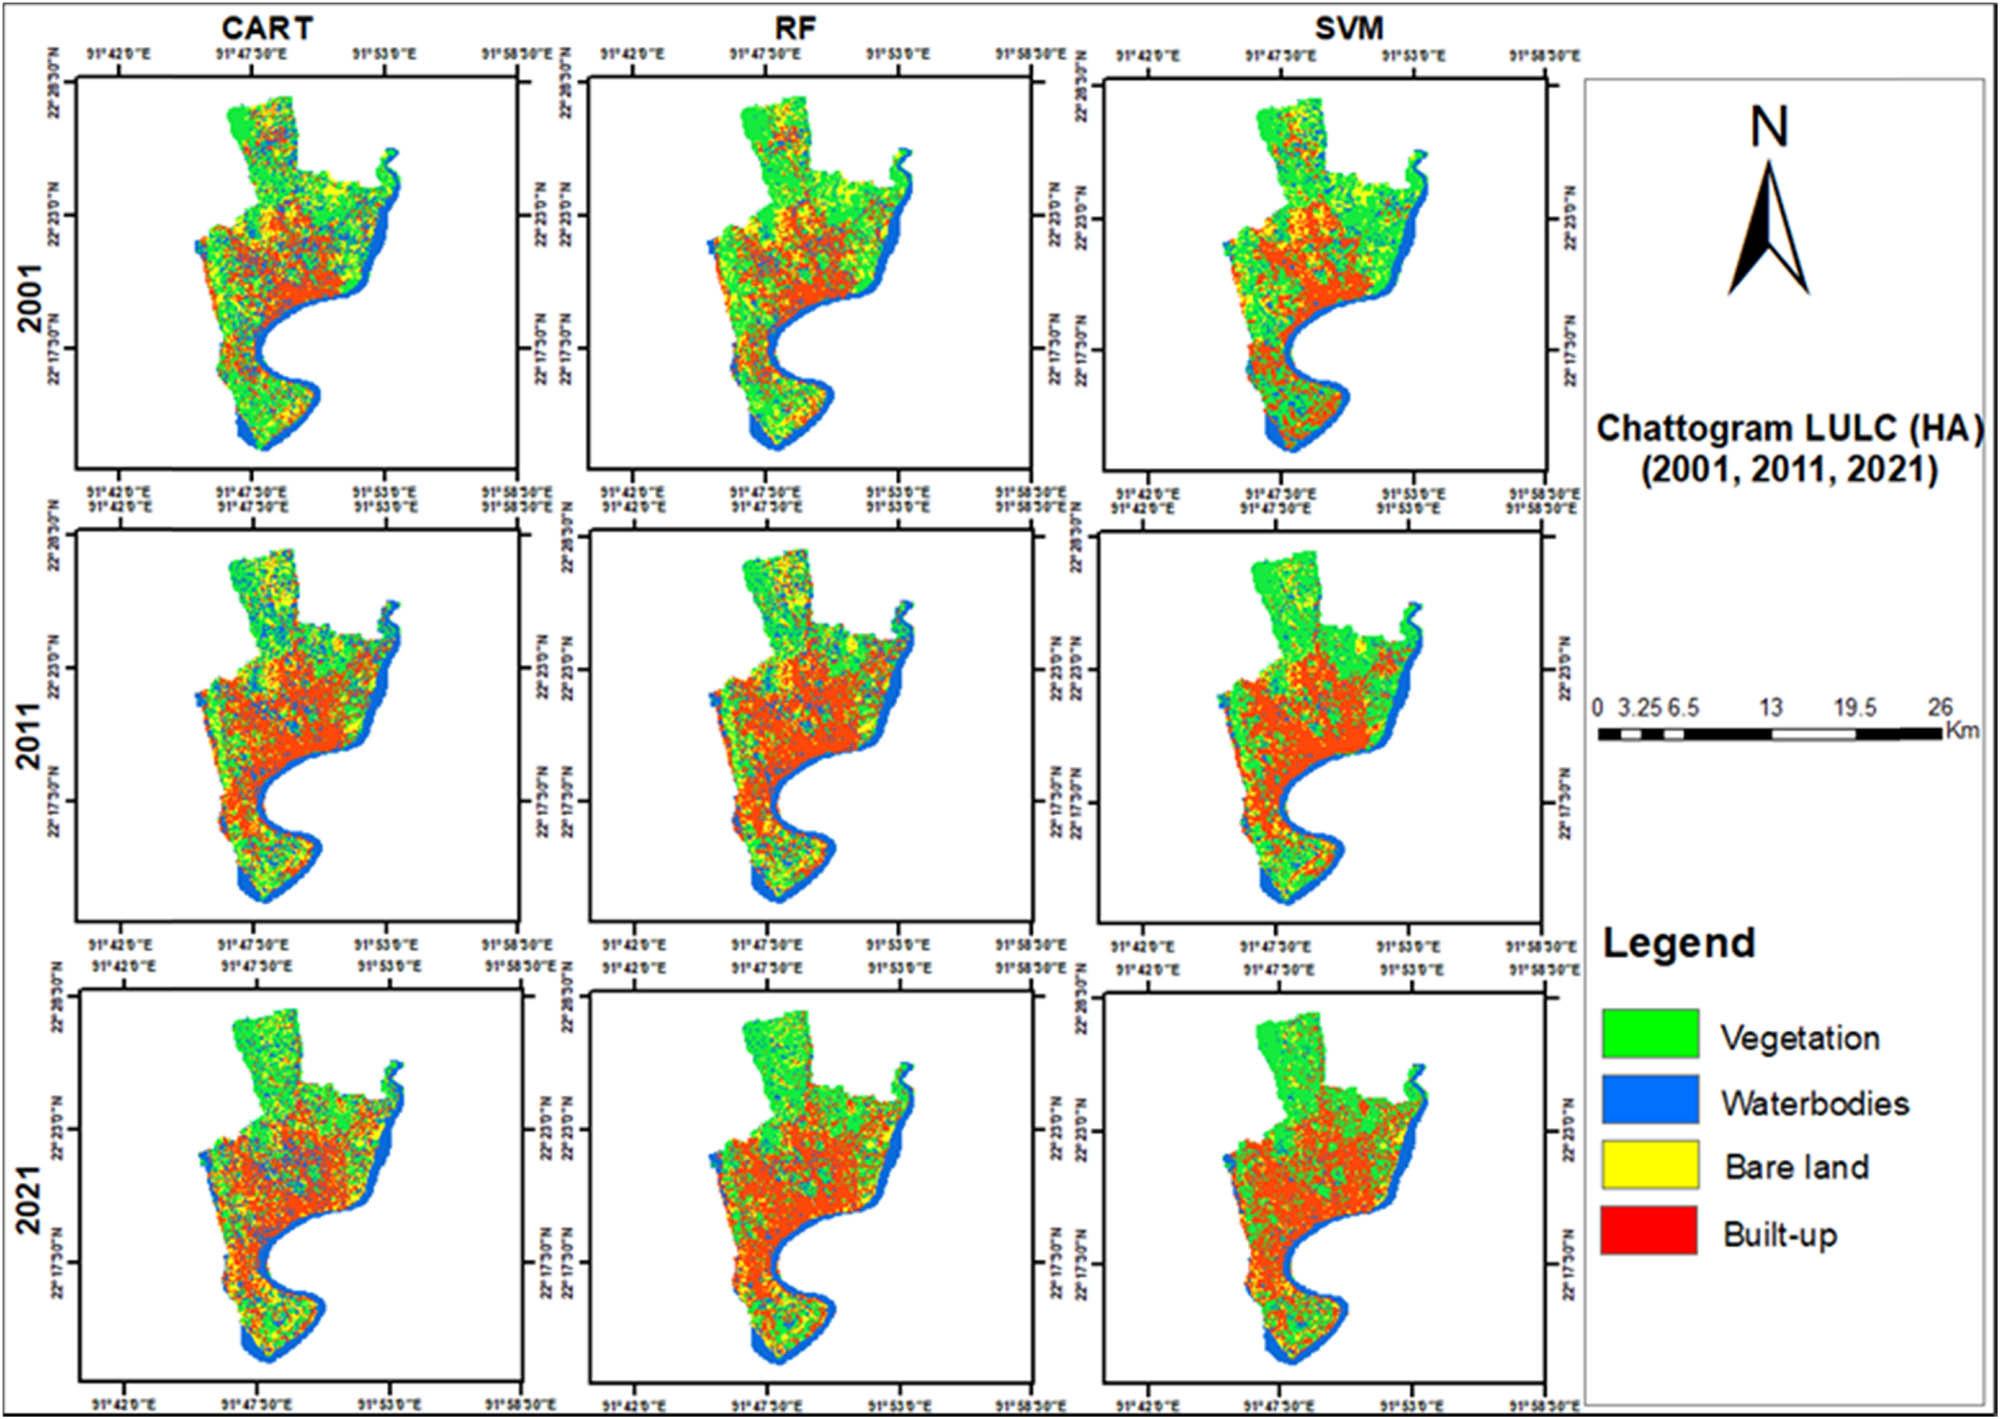
Spatiotemporal LULC changes in CCC during 2001–2021.
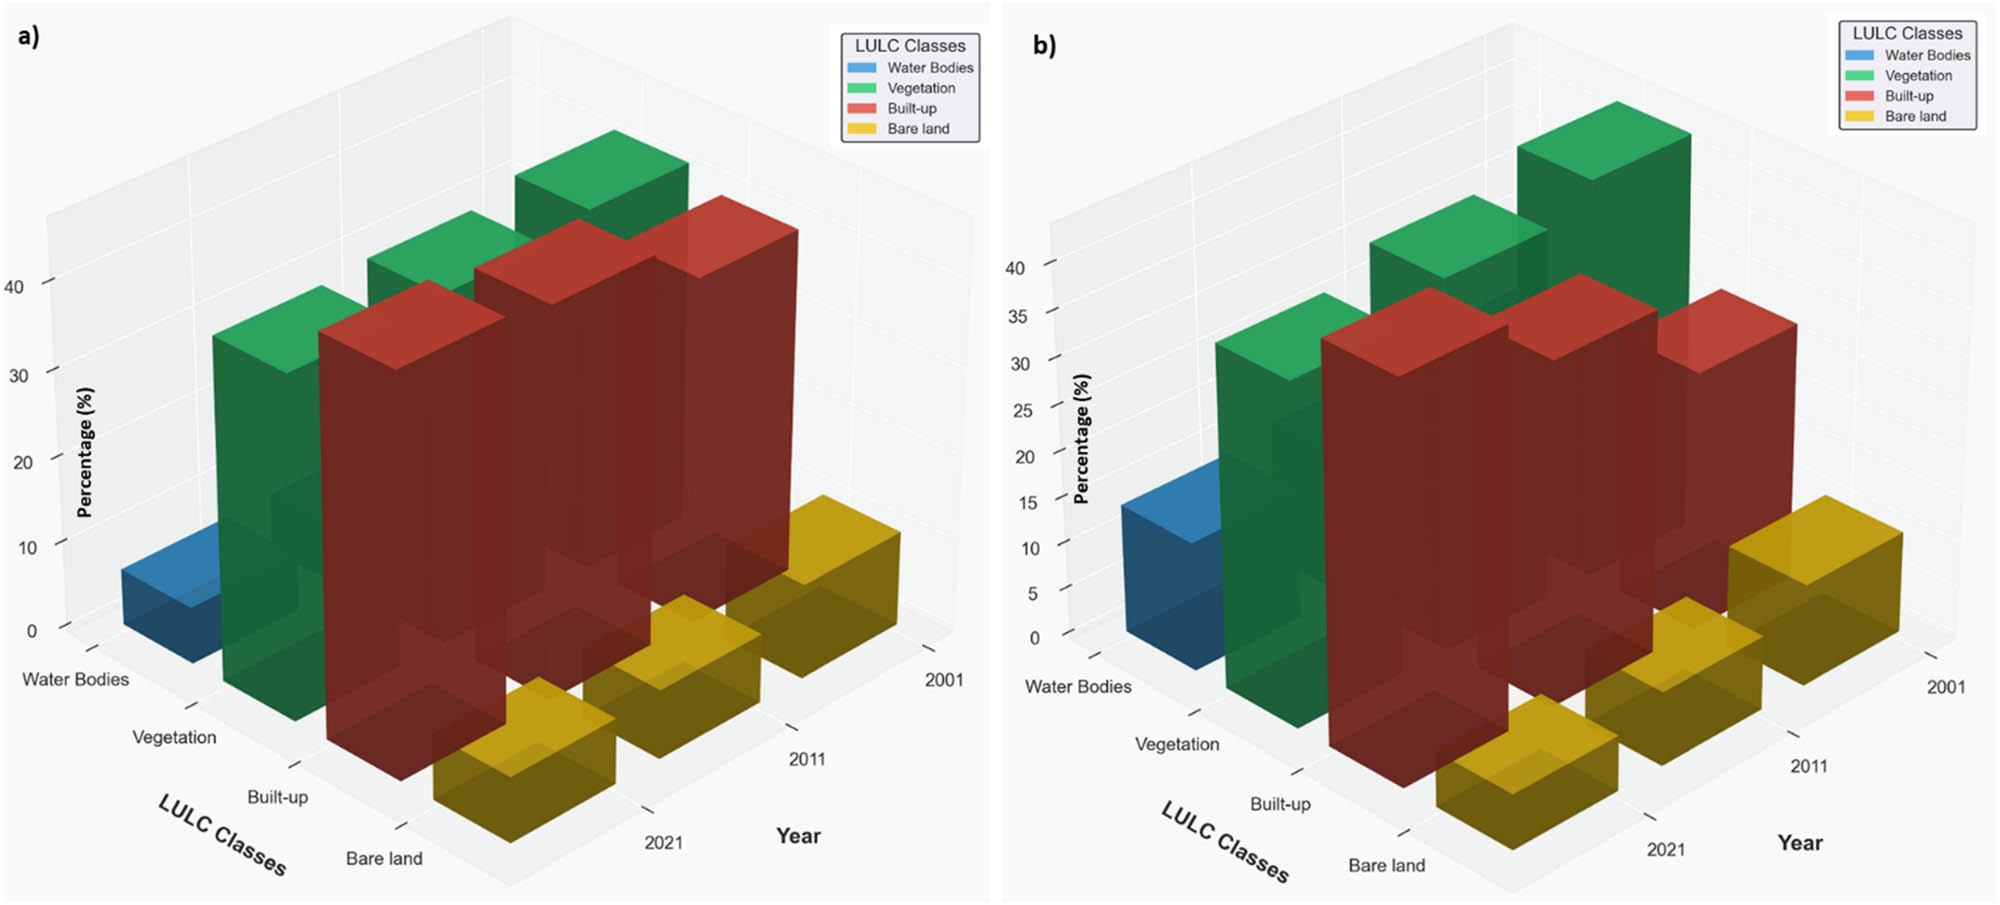
Categorical LULC change percentages (2001–2021) showing (a) RCC temporal trends with increasing built-up areas and decreasing natural covers, and (b) CCC changes highlighting rapid urbanization and vegetation loss.
Quantitative assessment of major LULC changes in RCC and CCC from 2001 to 2021, showing absolute areas (km²) and percentages
| LULC | Area (km2) | ||||||
|---|---|---|---|---|---|---|---|
| 2001 | % | 2011 | % | 2021 | % | ||
| RCC | Water Bodies | 3.4 | 7 | 3.2 | 6.7 | 3.2 | 6.6 |
| Vegetation | 20 | 42 | 19.4 | 40.3 | 19 | 39.7 | |
| Settlements | 19.4 | 40 | 21.6 | 45 | 22.15 | 46.1 | |
| Fallow land | 5.2 | 11 | 3.8 | 8 | 3.6 | 7.6 | |
| CCC | Water Bodies | 31.5 | 17 | 27.6 | 15 | 25.5 | 14 |
| Vegetation | 80 | 43 | 73.3 | 40 | 68.5 | 37 | |
| Settlements | 52 | 28 | 68.9 | 37 | 79.7 | 43 | |
| Fallow land | 20.7 | 11 | 14.4 | 8 | 10.6 | 6 | |
The confusion matrices (Table 3) reveal high classification accuracy for both study areas, with RCC showing slightly better overall performance (OA: 96.41% ± 0.9%) compared to CCC (OA: 94.64% ± 1.1%). In RCC, water bodies showed the highest classification accuracy (PA: 98.46% ± 0.8%), while in CCC, bare lands achieved the highest accuracy (PA: 98.48% ± 0.8%). The main classification challenges occurred in built-up areas of CCC (PA: 88.61% ± 1.2%), likely due to its more complex urban morphology. Spatial metric analysis (Table 4) quantitatively confirmed different urban growth patterns between the two cities. RCC exhibited more pronounced fragmentation, with FI increasing by 59.5% compared to CCC’s 36.8%. However, CCC showed a greater increase in NP (+59.4%) compared to RCC (+44.9%). Both cities demonstrated similar trends in increasing ED, indicating comparable levels of urban boundary complexity. The MID increased by 50% in both cities, although CCC maintained larger distances (1.8 km in 2021) compared to RCC (1.2 km in 2021), reflecting its more dispersed urban structure.
Confusion matrices for RF classification (2021)
| Actual/predicted | Water | Vegetation | Built-up area | Bare land | PA (%) ± CI |
|---|---|---|---|---|---|
| RCC | |||||
| Water | 98.46 | 0.54 | 0.75 | 0.25 | 98.46 ± 0.8 |
| Vegetation | 0.85 | 93.15 | 4.25 | 1.75 | 93.15 ± 1.1 |
| Built-up area | 0.45 | 2.29 | 97.26 | 0 | 97.26 ± 0.9 |
| Bare land | 0.24 | 1.7 | 1 | 97.06 | 97.06 ± 1.0 |
| UA (%) ± CI | 98.46 | 93.15 | 97.26 | 97.06 | OA: 96.41 ± 0.9 |
| CCC | |||||
| Water | 95.45 | 2.35 | 1.2 | 1 | 95.45 ± 1.0 |
| Vegetation | 2.1 | 97.1 | 0.5 | 0.3 | 97.10 ± 0.9 |
| Built-up area | 1.25 | 7.14 | 88.61 | 3 | 88.61 ± 1.2 |
| Bare land | 0.52 | 1 | 0 | 98.48 | 98.48 ± 0.8 |
| UA (%) ± CI | 95.45 | 97.1 | 88.61 | 98.48 | OA: 94.64 ± 1.1 |
Spatial metrics of urban growth patterns (2001–2021)
| Metrics | 2001 | 2011 | 2021 | Change (%) |
|---|---|---|---|---|
| RCC | ||||
| FI | 0.42 | 0.58 | 0.67 | +59.5 |
| MPS (ha) | 12.3 | 9.8 | 8.7 | −29.3 |
| NP | 156 | 198 | 226 | +44.9 |
| MID (km) | 0.8 | 1 | 1.2 | +50.0 |
| ED (km/km²) | 2.3 | 3.1 | 3.8 | +65.2 |
| CCC | ||||
| FI | 0.38 | 0.45 | 0.52 | +36.8 |
| MPS (ha) | 15.6 | 12.4 | 10.2 | −34.6 |
| NP | 187 | 245 | 298 | +59.4 |
| MID (km) | 1.2 | 1.5 | 1.8 | +50.0 |
| ED (km/km²) | 3.1 | 4.2 | 5.1 | +64.5 |
3.2 Classification accuracy assessment
The accuracy assessment evaluated the comprehensive performance metrics across the three ML classifiers implemented in this study (Table 5). RF consistently demonstrated superior classification results, achieving OAs of 94.48% ± 1.2% (2001), 95.00% ± 1.1% (2011), and 96.41% ± 0.9% (2021). Statistical analysis through ANOVA confirmed the significance of RF’s performance advantage (p < 0.05) across all temporal periods. The robust performance of RF can be attributed to its ensemble learning approach, which effectively reduced the overfitting through multiple decision trees, and its capability to handle complex urban spectral signatures in the classification process. The kappa coefficient analysis further validated the classification accuracy, with RF achieving exceptional results in both cities. In Rajshahi, the RF classifier demonstrated particularly strong performance (κ = 0.952 ± 0.015), benefiting from distinct LULC class boundaries and clear spectral separation between agricultural and built-up areas. Chattogram, despite its more complex urban morphology, maintained robust classification accuracy (κ = 0.929 ± 0.018), highlighting the classifier’s ability to handle heterogeneous urban landscapes. These kappa values, ranging from 0.8 to 1.00, indicate excellent agreement with accurate classification and demonstrate strong data reliability [48,52].
OA and kappa coefficient of SVM, RF, and CART in RCC and CCC
| Years | ML algorithms | RCC | CCC | ||
|---|---|---|---|---|---|
| OA (%) | Kappa coefficient | OA (%) | Kappa coefficient | ||
| SVM | 92.76 | 0.903 | 83.51 | 0.780 | |
| 2001 | RF | 94.48 | 0.926 | 93.33 | 0.911 |
| CART | 92.76 | 0.903 | 91.93 | 0.892 | |
| SVM | 90.52 | 0.837 | 86.02 | 0.813 | |
| 2011 | RF | 95 | 0.934 | 95.70 | 0.943 |
| CART | 92.16 | 0.895 | 92.47 | 0.900 | |
| SVM | 95.6 | 0.942 | 94.64 | 0.929 | |
| 2021 | RF | 96.41 | 0.952 | 94.64 | 0.929 |
| CART | 96.06 | 0.947 | 92.86 | 0.905 | |
Class-specific accuracy assessment revealed varying performance across LULC categories. PA ranged from 83 to 100%, while UA spanned from 86 to 100%, indicating high classification reliability across all LULC types. Water bodies consistently showed the highest classification accuracy (UA: 98.46%, PA: 98.46% in 2021), while mixed urban areas presented greater classification challenges (UA: 89.04%, PA: 91.04%). The SVM classifier, while performing well, showed lower OA compared to RF, particularly in areas with complex urban vegetation mixing. CART demonstrated intermediate performance, with accuracy metrics generally falling between those of RF and SVM. The comparative analysis between cities revealed that RCC’s more organized urban structure resulted in higher classification accuracy compared to CCC’s complex coastal-urban landscape. This difference is particularly evident in the classification of built-up areas, where RCC showed consistently higher accuracy across all three classifiers. Table 6 presents the detailed UA and PA values for each LULC class across both cities, demonstrating the robust performance of the RF classifier in handling diverse urban landscapes and temporal changes.
To address recognized limitations of kappa statistics , we implemented 10-fold cross-validation with AUC-ROC analysis. All three ML algorithms demonstrated strong performance, with mean AUC values: RF (0.95 for RCC, 0.93 for CCC), SVM (0.91 for RCC, 0.89 for CCC), and CART (0.89 for RCC, 0.87 for CCC). The RF classifier consistently outperformed other algorithms across all folds (p < 0.05), confirming its superior classification capability through metrics less affected by prevalence and bias issues inherent in traditional accuracy measures.
UA and PA for four LULC in SVM, RF, and CART for RCC and CCC
| Years | ML algorithms | UA (%) | PA (%) | ||||||||||||||
|---|---|---|---|---|---|---|---|---|---|---|---|---|---|---|---|---|---|
| Waterbodies | Vegetation | Built-up area | Bare land | Waterbodies | Vegetation | Built-up area | Bare land | ||||||||||
| RCC | CCC | RCC | CCC | RCC | CCC | RCC | CCC | RCC | CCC | RCC | CCC | RCC | CCC | RCC | CCC | ||
| 2001 | SVM | 100 | 91.3 | 92.31 | 83.12 | 86.08 | 72.73 | 93.55 | 88.71 | 93.42 | 90 | 91.14 | 87.67 | 100 | 77.78 | 86.57 | 78.57 |
| RF | 100 | 96.97 | 94.74 | 91.78 | 90.54 | 88.46 | 92.65 | 97.06 | 94.74 | 91.43 | 91.14 | 91.78 | 98.53 | 95.83 | 94.03 | 94.29 | |
| CART | 93.59 | 91.55 | 94.59 | 92.86 | 89.04 | 89.19 | 93.85 | 94.29 | 96.05 | 92.86 | 88.61 | 89.04 | 95.59 | 91.67 | 91.04 | 94.29 | |
| 2011 | SVM | 98.59 | 96.77 | 88.31 | 75.58 | 86.36 | 87.84 | 97.14 | 87.72 | 89.47 | 93.75 | 95.77 | 91.55 | 93.75 | 85.53 | 83.54 | 73.53 |
| RF | 97.22 | 92.54 | 95.83 | 98.46 | 89.53 | 94.94 | 98.68 | 97.06 | 92.11 | 96.88 | 97.18 | 90.14 | 96.25 | 98.68 | 94.94 | 97.06 | |
| CART | 98.55 | 90.77 | 87.18 | 88.73 | 81.52 | 94.81 | 98.51 | 95.45 | 92.11 | 92.19 | 95.77 | 88.73 | 95 | 96.05 | 86.08 | 92.65 | |
| 2021 | SVM | 98.41 | 96.97 | 91.89 | 98.53 | 94.81 | 86.42 | 98.46 | 98.46 | 95.38 | 94.12 | 100 | 97.1 | 97.33 | 97.22 | 90.14 | 90.14 |
| RF | 98.46 | 95.45 | 93.15 | 97.1 | 97.26 | 88.61 | 97.06 | 98.48 | 98.46 | 92.65 | 100 | 97.1 | 94.67 | 97.22 | 92.96 | 91.55 | |
| CART | 98.46 | 89.86 | 93.15 | 97.01 | 97.22 | 88.16 | 95.65 | 97.06 | 98.46 | 91.18 | 100 | 94.2 | 93.33 | 93.06 | 92.96 | 92.96 | |
4 Discussion
Using the ML models from the GEE API, our analysis revealed two fundamental patterns of land use change in both cities: significant changes in settlements and relatively minor alterations in water bodies, vegetation, and bare land. These findings demonstrate both consistency and improved accuracy compared to conventional LULC studies. Our ML-based LULC analysis in GEE for the RCC area achieved the highest overall accuracies of 94.48, 95, and 96.41% for 2001, 2011, and 2021, respectively [34]. This represents a marked improvement over traditional MLC approaches, which yielded accuracies of 92.50, 88, and 91% for comparable periods [34,38]. The implementation of GEE for RS image processing demonstrated significant advantages in handling large-scale data analysis and complex computations. Our analysis revealed a 70% reduction in processing time compared to conventional desktop-based methods, with the GEE platform processing the 20-year dataset in approximately 2.5 h versus 8.3 h using traditional approaches. This efficiency gain was achieved while maintaining high classification accuracy, with the GEE-based RF classifier achieving 96.41% accuracy compared to 95.8% using conventional software [53,54]. GEE’s cloud-computing infrastructure effectively addressed several critical challenges in our study. The platform successfully managed over 500 GB of Landsat imagery without local storage constraints, enabled efficient handling of temporal gaps through automated image compositing, and facilitated parallel processing of ML algorithms across large areas exceeding 200 km². The standardized workflow through JavaScript API ensured reproducibility and consistent results across different study areas [10,11,12].
Our comparative analysis of ML classifiers revealed RF’s superior performance in both urban contexts. This excellence can be attributed to RF’s ensemble learning approach, which effectively manages the complexity of urban spectral signatures and reduces overfitting through multiple decision trees. The kappa coefficient values (0.911–0.952) demonstrated exceptional classification accuracy, particularly in areas with clear spectral separation between LULC classes [48]. The consistency of RF’s performance across both cities, despite their contrasting urban morphologies, underscores its robustness in handling diverse urban landscapes. The integration of multiple ML algorithms enhanced the classification accuracy by 8–12% compared to single-algorithm approaches. This improvement was particularly evident in complex urban areas where traditional methods often struggle with mixed pixels and spectral confusion. The complementary strengths of different classifiers contributed to more robust and accurate LULC classification results [20,39,41]. Our findings have significant implications for urban planning and environmental management. The rapid processing capabilities of GEE, combined with high classification accuracy, enable more frequent and reliable monitoring of urban expansion patterns. This is particularly valuable in rapidly urbanizing regions where traditional monitoring methods may struggle to keep pace with development. The methodology we developed in this study offers a replicable framework for urban planners and policymakers to efficiently assess LULC dynamics and make informed decisions about sustainable urban development [53,55].
Expanding on our discussion, the integration of GEE’s cloud-computing capabilities with advanced ML algorithms not only enhances the accuracy and efficiency of LULC classification but also provides a scalable solution for large-scale environmental monitoring. This approach can be adapted to various geographical and climatic contexts, making it a versatile tool for global urban planning and environmental conservation efforts. The ability to process vast amounts of data quickly and accurately ensures that policymakers have access to up-to-date information, which is crucial for addressing the challenges of urbanization and climate change. By leveraging these technological advancements, we can better understand and manage the dynamic interactions between human activities and natural ecosystems, ultimately contributing to more resilient and sustainable urban environments. This study demonstrates that while GEE-based approaches excel in large-scale regional analysis and rapid urban monitoring, conventional methods retain advantages for specific applications such as very high-resolution imagery analysis and complex custom algorithms. A hybrid approach may be optimal for projects requiring multiple data sources or both cloud and local processing capabilities. This understanding helps guide the selection of appropriate methodologies based on specific project requirements and resource constraints [50,56].
5 Conclusions
This study demonstrated the effective integration of GEE and ML algorithms for monitoring LULC dynamics in rapidly urbanizing regions of Bangladesh. The implementation of three ML classifiers – CART, RF, and SVM – within the GEE platform achieved exceptional classification accuracy, with RF consistently outperforming other algorithms. The analysis revealed significant urban expansion in both study areas, with built-up areas increasing by 6% in Rajshahi and 15% in Chattogram, while natural land covers experienced notable declines. The methodology developed in this research offers practical applications for urban planning and management. Urban planners can utilize this approach to identify areas of rapid expansion requiring immediate intervention, monitor environmental encroachment, and track land use policy effectiveness. The GEE platform’s rapid processing capabilities enable near-real-time monitoring of development projects and efficient updating of urban master plans, providing crucial support for evidence-based decision-making in rapidly urbanizing regions.
However, several limitations of this approach should be acknowledged. The 30 m resolution of Landsat imagery may miss fine-scale urban features, while mixed pixels in dense urban areas can affect the classification accuracy. Additionally, cloud cover in tropical regions and seasonal variations can impact data availability and classification consistency. Technical constraints include GEE’s computational limitations for very large areas and dependency on internet connectivity. Future research should focus on methodological advances, including the integration of deep learning algorithms within GEE and the development of automated training sample selection methods. Application extensions could incorporate socio-economic data with LULC analysis and develop near-real-time urban monitoring systems. Technical improvements should address higher resolution analysis capabilities and enhance the automation of accuracy assessment procedures.
This research contributes significantly to environmental monitoring by demonstrating the efficacy of cloud-based geospatial analysis for rapid and accurate LULC change detection. The approach presented offers valuable tools for urban planners and policymakers to efficiently assess LULC dynamics and promote informed decision-making in rapidly urbanizing regions, aligning with sustainable development goals. The continued development of such methodologies will be crucial in guiding evidence-based policies for sustainable urban development and environmental conservation.
Acknowledgements
The authors extend their appreciation to the Researchers Supporting Project number (RSPD2025R848), King Saud University, Riyadh, Saudi Arabia.
-
Funding information: This research work was supported by King Saud University, Riyadh, Saudi Arabia under grant number RSPD2025R848.
-
Author contributions: Farzana Afroz: conceptualization, project administration, data collection, formal analysis, data curation, supervision, resources, software, methodology, investigation, writing – original draft, validation, writing – review & editing. Mohammad Mahmudul Hasan and Rownoak Bin Rouf: data collection, formal analysis, visualization, validation, software, resources, methodology, formal analysis, data curation, writing – review & editing. Md. Mehedi Hasan Nazir: writing – review & editing, software, resources, methodology, project administration. Hamad Ahmed Altuwaijri: data collection, supervision, resources, software, methodology, validation, writing – review & editing. Abdulla Al Kafy and Md. Mostafizur Rahman: project administration, data collection, formal analysis, supervision, resources, software, methodology, writing – original draft, validation, writing – review & editing.
-
Conflict of interest: The authors declare no conflict of interest.
-
Data availability statement: The data that support the findings of this study are available from the corresponding author and the first author upon reasonable request.
-
Author statement: This manuscript (or one with substantially the same content, by any of the authors) has not been previously published in any language anywhere and is not under simultaneous consideration or in press by another journal.
References
[1] Vanderhoof MK, Brunner N, Beal Y-JG, Hawbaker TJ. Evaluation of the U. S. geological survey landsat burned area essential climate variable across the conterminous U. S, using commercial high-resolution imagery. Remote Sens. 2017;9:743. 10.3390/rs9070743.Search in Google Scholar
[2] Pengra B, Gallant AL, Zhu Z, Dahal D. Evaluation of the initial thematic output from a continuous change-detection algorithm for use in automated operational land-change mapping by the U. S, Geological Survey. Remote Sens. 2016;8:811. 10.3390/rs8100811.Search in Google Scholar
[3] Roteta E, Bastarrika A, Franquesa M, Chuvieco E. Landsat and sentinel-2 based burned area mapping tools in google earth engine. Remote Sens. 2021;13:816. 10.3390/rs13040816.Search in Google Scholar
[4] Conrad C, Fritsch S, Zeidler J, Rücker G, Dech S. Per-field irrigated crop classification in arid Central Asia Using SPOT and ASTER Data. Remote Sens. 2010;2:1035–56. 10.3390/rs2041035.Search in Google Scholar
[5] Lin L, Di L, Tang J, Yu E, Zhang C, Rahman MS, et al. Improvement and validation of NASA/MODIS NRT global flood mapping. Remote Sens. 2019;11:205. 10.3390/rs11020205.Search in Google Scholar
[6] Vafaei S, Soosani J, Adeli K, Fadaei H, Naghavi H, Pham TD, et al. Improving accuracy estimation of forest aboveground biomass based on incorporation of ALOS-2 PALSAR-2 and sentinel-2A imagery and machine learning: a case study of the hyrcanian forest area (Iran). Remote Sens. 2018;10:172. 10.3390/rs10020172.Search in Google Scholar
[7] Bar S, Parida BR, Pandey AC. Landsat-8 and Sentinel-2 based Forest fire burn area mapping using machine learning algorithms on GEE cloud platform over Uttarakhand, Western Himalaya. Remote Sens Appl Soc Environ. 2020;18:100324. 10.1016/j.rsase.2020.100324.Search in Google Scholar
[8] V. I. S. Usgs and U. S., “Geological Survey.” [Online]. https://www.usgs.gov/information-policies-and-instructions/usgs-visual-identity-system.Search in Google Scholar
[9] Friedl MA, McIver DK, Hodges JC, Zhang XY, Muchoney D, Strahler AH, et al. Global land cover mapping from MODIS: algorithms and early results. Remote Sens Environ. 2002;83:287–302. 10.1016/S0034-4257(02)00078-0.Search in Google Scholar
[10] Sidhu N, Pebesma E, Câmara G. Using google earth engine to detect land cover change,” Singapore as a use case Using Google Earth Engine to detect land cover change: Singapore as a use. Eur J Remote Sens. 2018;51:486–500. 10.1080/22797254.2018.1451782.Search in Google Scholar
[11] Gorelick N, Hancher M, Dixon M, Ilyushchenko S, Thau D, Moore R. Google earth engine: planetary-scale geospatial analysis for everyone. Remote Sens Environ. 2016;202:18–27. 10.1016/j.rse.2017.06.031.Search in Google Scholar
[12] Tamiminia H, Salehi B, Mahdianpari M, Quackenbush L, Adeli S, Brisco B. Google earth engine for geo-big data applications: A meta-analysis and systematic review. ISPRS J Photogramm Remote Sens. 2020;164:152–70. 10.1016/j.isprsjprs.2020.04.001.Search in Google Scholar
[13] DeVries B, Huang C, Armston J, Huang W, Jones JW, Lang MW. Rapid and robust monitoring of flood events using Sentinel-1 and Landsat data on the Google Earth Engine. Remote Sens Environ. 2020;240:111664. 10.1016/J.RSE.2020.111664.Search in Google Scholar
[14] Inman VL, Lyons MB. Automated inundation mapping over large areas using Landsat data and google earth engine. Remote Sens. 2020;12:1348. 10.3390/rs12081348.Search in Google Scholar
[15] Prasai R, Schwertner TW, Mainali K, Mathewson H, Kafley H, Thapa S, et al. Application of Google earth engine python API and NAIP imagery for land use and land cover classification: A case study in Florida, USA. Ecol Inform. 2021;66:101474. 10.1016/j.ecoinf.2021.101474.Search in Google Scholar
[16] Amani M, Ghorbanian A, Ahmadi SA, Kakooei M, Moghimi A, Mirmazloumi SM, et al. Google earth engine cloud computing platform for remote sensing big data applications: A comprehensive review. IEEE J Sel Top Appl Earth Observ Remote Sens. 2020;13:5326–50. 10.1109/JSTARS.2020.3021052.Search in Google Scholar
[17] Zhou B, Kockelman KM. Neighborhood impacts on land use change: A multinomial logit model of spatial relationships. Ann Reg Sci. 2008;42:321–40. 10.1007/S00168-007-0149-Z.Search in Google Scholar
[18] Asenso Barnieh B, Jia L, Menenti M, Zhou J, Zeng Y. Mapping Land Use Land Cover Transitions at Different Spatiotemporal Scales in West Africa. Sustainability. 2020;12:8565. 10.3390/su12208565.Search in Google Scholar
[19] Rashid N, Alam JM, Chowdhury MA, Islam SLU. Impact of landuse change and urbanization on urban heat island effect in Narayanganj city, Bangladesh: A remote sensing-based estimation. Environ Challenges. 2022;8:100571. 10.1016/j.envc.2022.100571.Search in Google Scholar
[20] Gharaibeh A, Shaamala A, Obeidat R, Al-Kofahi S. Improving land-use change modeling by integrating ANN with Cellular Automata-Markov Chain model. Heliyon. 2020;6:e05092. 10.1016/j.heliyon.2020.e05092.Search in Google Scholar PubMed PubMed Central
[21] Lauf S, Haase D, Hostert P, Lakes T, Kleinschmit B. Uncovering land-use dynamics driven by human decision-making–A combined model approach using cellular automata and system dynamics. Environ Model Softw. 2012;27–28:71–82. 10.1016/j.envsoft.2011.09.005.Search in Google Scholar
[22] Rahnama MR. Forecasting land-use changes in Mashhad Metropolitan area using Cellular Automata and Markov chain model for 2016-2030. Sustainable Cities Soc. 2021;64:102548. 10.1016/j.scs.2020.102548.Search in Google Scholar
[23] Myint SW, Wang L. Multicriteria decision approach for land use land cover change using Markov chain analysis and a cellular automata approach. Can J Remote Sens. 2006;32:390–404. 10.5589/M06-032.Search in Google Scholar
[24] Bose A, Chowdhury IR. Monitoring and modeling of spatio-temporal urban expansion and land-use/land-cover change using Markov chain model: a case study in Siliguri Metropolitan area, West Bengal, India. Model Earth Syst Environ. 2020;6:2235–49. 10.1007/S40808-020-00842-6.Search in Google Scholar
[25] Al-sharif AAA, Pradhan B. Monitoring and predicting land use change in Tripoli Metropolitan City using an integrated Markov chain and cellular automata models in GIS. Arab J Geosci. 2013;7:4291–301. 10.1007/s12517-013-1119-7.Search in Google Scholar
[26] Tayyebi A, Pijanowski BC. Modeling multiple land use changes using ANN, CART and MARS: Comparing tradeoffs in goodness of fit and explanatory power of data mining tools. Int J Appl Earth Obs Geoinf. 2014;28:102–16. 10.1016/j.jag.2013.11.008.Search in Google Scholar
[27] Bala R, Kumar D. Classification using ANN: A review. Int J Comput Intell Res. 2017;13:1811–20.Search in Google Scholar
[28] Pan X, Wang Z, Gao Y, Dang X, Han Y. Detailed and automated classification of land use/land cover using machine learning algorithms in Google Earth Engine. Geocarto Int. 2022;37:5415–32. 10.1080/10106049.2021.1917005.Search in Google Scholar
[29] Huang C, Davis LS, Townshend JRG. An assessment of support vector machines for land cover classification. Int J Remote Sens. 2002;23:725–49. 10.1080/01431160110040323.Search in Google Scholar
[30] DeFries RS, Chan JCW. Multiple criteria for evaluating machine learning algorithms for land cover classification from satellite data. Remote Sens Environ. 2000;74:503–15. 10.1016/S0034-4257(00)00142-5.Search in Google Scholar
[31] Kang CS, Kanniah KD. Land use and land cover change and its impact on river morphology in Johor River Basin, Malaysia. J Hydrol Reg Stud. 2022;41:101072. 10.1016/j.ejrh.2022.101072.Search in Google Scholar
[32] Loukika KN, Keesara VR, Sridhar V. Analysis of land use and land cover using machine learning algorithms on google earth engine for munneru River Basin, India. Sustainability. 2021;13:13758. 10.3390/su132413758.Search in Google Scholar
[33] Rahman A, Abdullah HM, Tanzir MT, Hossain MJ, Khan BM, Miah MG, et al. Performance of different machine learning algorithms on satellite image classification in rural and urban setup. Remote Sens Appl Soc Environ. 2020;20:100410. 10.1016/j.rsase.2020.100410.Search in Google Scholar
[34] Kafy A, Faisal AA, Shuvo RM, Naim MN, Sikdar MS, Chowdhury RR, et al. Remote sensing approach to simulate the land use/land cover and seasonal land surface temperature change using machine learning algorithms in a fastest-growing megacity of Bangladesh. Remote Sens Appl Soc Environ. 2021;21:100463. 10.1016/j.rsase.2020.100463.Search in Google Scholar
[35] Dey NN, Al Rakib A, Al Kafy A-, Raikwar V. Geospatial modelling of changes in land use/land cover dynamics using Multi-layer perception Markov chain model in Rajshahi City, Bangladesh. Environ Challenges. 2021;4:100148. 10.1016/J.ENVC.2021.100148.Search in Google Scholar
[36] Naim MNH, Kafy A-A. Assessment of urban thermal field variance index and defining the relationship between land cover and surface temperature in Chattogram city: A remote sensing and statistical approach. Environ Challenges. 2021;4:100107. 10.1016/j.envc.2021.100107.Search in Google Scholar
[37] Al Kafy A, Rahman MS, Al Faisal A, Hasan MM, Islam M. Modelling future land use land cover changes and their impacts on land surface temperatures in Rajshahi, Bangladesh. Remote Sens Appl. Apr 2020;18:100314. 10.1016/J.RSASE.2020.100314.Search in Google Scholar
[38] Gazi M, Rahman M, Uddin M, Rahman FM. Spatio-temporal dynamic land cover changes and their impacts on the urban thermal environment in the Chittagong metropolitan area, Bangladesh. GeoJournal. 2021;86:2119–34. 10.1007/s10708-020-10178-4.Search in Google Scholar
[39] Matarira D, Mutanga O, Naidu M. Google earth engine for informal settlement mapping: a random forest classification using spectral and textural information. Remote Sens. 2022;14:5130. 10.3390/rs14205130.Search in Google Scholar
[40] Rai R, Zhang Y, Paudel B, Li S, Khanal NR. A Synthesis of Studies on Land Use and Land Cover Dynamics during 1930–2015 in Bangladesh. Sustainability. 2017;9:1866. 10.3390/su9101866.Search in Google Scholar
[41] Sinha A, Nikhil S, Ajin RS, Danumah JH, Saha S, Costache R, et al. Wildfire risk zone mapping in contrasting climatic conditions: an approach employing AHP and F-AHP models. Fire. 2023;6:44. 10.3390/fire6020044.Search in Google Scholar
[42] Lillesand T, Kiefer RW, Chipman J. Remote sensing and image interpretation. 7th edn. Hoboken, New Jersey, USA: John Wiley & Sons; 2015.Search in Google Scholar
[43] Ewing R, Hamidi S, Grace JB. Urban sprawl as a risk factor in motor vehicle crashes. Urban Studies. Feb 2016;53(2):247–66. 10.1177/0042098014562331.Search in Google Scholar
[44] Wu J, Jenerette GD, Buyantuyev A, Redman CL. Quantifying spatiotemporal patterns of urbanization: The case of the two fastest growing metropolitan regions in the United States. Ecol Complexity. Mar 2011;8(1):1–8. 10.1016/j.ecocom.2010.03.002.Search in Google Scholar
[45] Belgiu M, Drăguţ L. Random forest in remote sensing: A review of applications and future directions. ISPRS J Photogramm Remote Sens. 2016;114:24–31. 10.1016/j.isprsjprs.2016.01.011.Search in Google Scholar
[46] Foody G. Assessing the accuracy of remotely sensed data: principles and practices. Photogramm Rec. 2010;25:204–5. 10.1111/J.1477-9730.2010.00574_2.X.Search in Google Scholar
[47] Maxwell AE, Warner TA, Guillén LA. Accuracy assessment in convolutional neural network-based deep learning remote sensing studies—Part 2: recommendations and best practices. Remote Sens. 2021;13:2591. 10.3390/rs13132591.Search in Google Scholar
[48] Foody GM. Explaining the unsuitability of the kappa coefficient in the assessment and comparison of the accuracy of thematic maps obtained by image classification. Remote Sens Environ. 2020;239:111630. 10.1016/j.rse.2019.111630.Search in Google Scholar
[49] Phinzi K, Abriha D, Szabó, S. Classification efficacy using k-fold cross-validation and bootstrapping resampling techniques on the example of mapping complex gully systems. Remote Sens. 2021;13(15):2980. 10.3390/rs13152980.Search in Google Scholar
[50] Landsat Missions, “Landsat Collections.” [Online]. Available: https://www.usgs.gov/landsat-missions/landsat-collections.Search in Google Scholar
[51] Hassan M, Nazem N. Examination of land use/land cover changes, urban growth dynamics, and environmental sustainability in Chittagong city, Bangladesh. Environ Dev Sustain. 2015;18:697–716. 10.1007/s10668-015-9672-8.Search in Google Scholar
[52] Matthews T, Lo AY, Byrne JA. Reconceptualizing green infrastructure for climate change adaptation: Barriers to adoption and drivers for uptake by spatial planners. Landsc Urban Plan. 2015;138:155–63. 10.1016/j.landurbplan.2015.02.010.Search in Google Scholar
[53] Roy S, Pandit S, Eva EA, Bagmar MS, Papia M, Banik L, et al. Examining the nexus between land surface temperature and urban growth in chattogram metropolitan area of bangladesh using long term landsat series Data. Urban Clim. 2020;32:100593. 10.1016/j.uclim.2020.100593.Search in Google Scholar
[54] Fattah MA, Morshed SR, Morshed SY. Multi-layer perceptron-Markov chain-based artificial neural network for modelling future land-specific carbon emission pattern and its influences on surface temperature. SN Appl Sci. Mar 2021;3(3):359. 10.1007/s42452-021-04351-8.Search in Google Scholar
[55] Fu G, Liu C, Zhou R, Sun T, Zhang Q. Classification for high resolution remote sensing imagery using a fully convolutional network. Remote Sens. 2017;9:498. 10.3390/rs9050498.Search in Google Scholar
[56] Wulder MA, Loveland TR, Roy DP, Crawford CJ, Masek JG, Woodcock CE, et al. Current status of Landsat program, science, and applications. Remote Sens Environ. 2019;225:127–47. 10.1016/J.RSE.2019.02.015.Search in Google Scholar
© 2025 the author(s), published by De Gruyter
This work is licensed under the Creative Commons Attribution 4.0 International License.
Articles in the same Issue
- Research Articles
- Seismic response and damage model analysis of rocky slopes with weak interlayers
- Multi-scenario simulation and eco-environmental effect analysis of “Production–Living–Ecological space” based on PLUS model: A case study of Anyang City
- Remote sensing estimation of chlorophyll content in rape leaves in Weibei dryland region of China
- GIS-based frequency ratio and Shannon entropy modeling for landslide susceptibility mapping: A case study in Kundah Taluk, Nilgiris District, India
- Natural gas origin and accumulation of the Changxing–Feixianguan Formation in the Puguang area, China
- Spatial variations of shear-wave velocity anomaly derived from Love wave ambient noise seismic tomography along Lembang Fault (West Java, Indonesia)
- Evaluation of cumulative rainfall and rainfall event–duration threshold based on triggering and non-triggering rainfalls: Northern Thailand case
- Pixel and region-oriented classification of Sentinel-2 imagery to assess LULC dynamics and their climate impact in Nowshera, Pakistan
- The use of radar-optical remote sensing data and geographic information system–analytical hierarchy process–multicriteria decision analysis techniques for revealing groundwater recharge prospective zones in arid-semi arid lands
- Effect of pore throats on the reservoir quality of tight sandstone: A case study of the Yanchang Formation in the Zhidan area, Ordos Basin
- Hydroelectric simulation of the phreatic water response of mining cracked soil based on microbial solidification
- Spatial-temporal evolution of habitat quality in tropical monsoon climate region based on “pattern–process–quality” – a case study of Cambodia
- Early Permian to Middle Triassic Formation petroleum potentials of Sydney Basin, Australia: A geochemical analysis
- Micro-mechanism analysis of Zhongchuan loess liquefaction disaster induced by Jishishan M6.2 earthquake in 2023
- Prediction method of S-wave velocities in tight sandstone reservoirs – a case study of CO2 geological storage area in Ordos Basin
- Ecological restoration in valley area of semiarid region damaged by shallow buried coal seam mining
- Hydrocarbon-generating characteristics of Xujiahe coal-bearing source rocks in the continuous sedimentary environment of the Southwest Sichuan
- Hazard analysis of future surface displacements on active faults based on the recurrence interval of strong earthquakes
- Structural characterization of the Zalm district, West Saudi Arabia, using aeromagnetic data: An approach for gold mineral exploration
- Research on the variation in the Shields curve of silt initiation
- Reuse of agricultural drainage water and wastewater for crop irrigation in southeastern Algeria
- Assessing the effectiveness of utilizing low-cost inertial measurement unit sensors for producing as-built plans
- Analysis of the formation process of a natural fertilizer in the loess area
- Machine learning methods for landslide mapping studies: A comparative study of SVM and RF algorithms in the Oued Aoulai watershed (Morocco)
- Chemical dissolution and the source of salt efflorescence in weathering of sandstone cultural relics
- Molecular simulation of methane adsorption capacity in transitional shale – a case study of Longtan Formation shale in Southern Sichuan Basin, SW China
- Evolution characteristics of extreme maximum temperature events in Central China and adaptation strategies under different future warming scenarios
- Estimating Bowen ratio in local environment based on satellite imagery
- 3D fusion modeling of multi-scale geological structures based on subdivision-NURBS surfaces and stratigraphic sequence formalization
- Comparative analysis of machine learning algorithms in Google Earth Engine for urban land use dynamics in rapidly urbanizing South Asian cities
- Study on the mechanism of plant root influence on soil properties in expansive soil areas
- Simulation of seismic hazard parameters and earthquakes source mechanisms along the Red Sea rift, western Saudi Arabia
- Tectonics vs sedimentation in foredeep basins: A tale from the Oligo-Miocene Monte Falterona Formation (Northern Apennines, Italy)
- Investigation of landslide areas in Tokat-Almus road between Bakımlı-Almus by the PS-InSAR method (Türkiye)
- Predicting coastal variations in non-storm conditions with machine learning
- Cross-dimensional adaptivity research on a 3D earth observation data cube model
- Geochronology and geochemistry of late Paleozoic volcanic rocks in eastern Inner Mongolia and their geological significance
- Spatial and temporal evolution of land use and habitat quality in arid regions – a case of Northwest China
- Ground-penetrating radar imaging of subsurface karst features controlling water leakage across Wadi Namar dam, south Riyadh, Saudi Arabia
- Rayleigh wave dispersion inversion via modified sine cosine algorithm: Application to Hangzhou, China passive surface wave data
- Fractal insights into permeability control by pore structure in tight sandstone reservoirs, Heshui area, Ordos Basin
- Debris flow hazard characteristic and mitigation in Yusitong Gully, Hengduan Mountainous Region
- Research on community characteristics of vegetation restoration in hilly power engineering based on multi temporal remote sensing technology
- Identification of radial drainage networks based on topographic and geometric features
- Trace elements and melt inclusion in zircon within the Qunji porphyry Cu deposit: Application to the metallogenic potential of the reduced magma-hydrothermal system
- Pore, fracture characteristics and diagenetic evolution of medium-maturity marine shales from the Silurian Longmaxi Formation, NE Sichuan Basin, China
- Study of the earthquakes source parameters, site response, and path attenuation using P and S-waves spectral inversion, Aswan region, south Egypt
- Source of contamination and assessment of potential health risks of potentially toxic metal(loid)s in agricultural soil from Al Lith, Saudi Arabia
- Regional spatiotemporal evolution and influencing factors of rural construction areas in the Nanxi River Basin via GIS
- An efficient network for object detection in scale-imbalanced remote sensing images
- Effect of microscopic pore–throat structure heterogeneity on waterflooding seepage characteristics of tight sandstone reservoirs
- Environmental health risk assessment of Zn, Cd, Pb, Fe, and Co in coastal sediments of the southeastern Gulf of Aqaba
- A modified Hoek–Brown model considering softening effects and its applications
- Evaluation of engineering properties of soil for sustainable urban development
- The spatio-temporal characteristics and influencing factors of sustainable development in China’s provincial areas
- Application of a mixed additive and multiplicative random error model to generate DTM products from LiDAR data
- Gold vein mineralogy and oxygen isotopes of Wadi Abu Khusheiba, Jordan
- Prediction of surface deformation time series in closed mines based on LSTM and optimization algorithms
- 2D–3D Geological features collaborative identification of surrounding rock structural planes in hydraulic adit based on OC-AINet
- Spatiotemporal patterns and drivers of Chl-a in Chinese lakes between 1986 and 2023
- Land use classification through fusion of remote sensing images and multi-source data
- Nexus between renewable energy, technological innovation, and carbon dioxide emissions in Saudi Arabia
- Analysis of the spillover effects of green organic transformation on sustainable development in ethnic regions’ agriculture and animal husbandry
- Factors impacting spatial distribution of black and odorous water bodies in Hebei
- Large-scale shaking table tests on the liquefaction and deformation responses of an ultra-deep overburden
- Impacts of climate change and sea-level rise on the coastal geological environment of Quang Nam province, Vietnam
- Reservoir characterization and exploration potential of shale reservoir near denudation area: A case study of Ordovician–Silurian marine shale, China
- Seismic prediction of Permian volcanic rock reservoirs in Southwest Sichuan Basin
- Application of CBERS-04 IRS data to land surface temperature inversion: A case study based on Minqin arid area
- Geological characteristics and prospecting direction of Sanjiaoding gold mine in Saishiteng area
- Research on the deformation prediction model of surrounding rock based on SSA-VMD-GRU
- Geochronology, geochemical characteristics, and tectonic significance of the granites, Menghewula, Southern Great Xing’an range
- Hazard classification of active faults in Yunnan base on probabilistic seismic hazard assessment
- Characteristics analysis of hydrate reservoirs with different geological structures developed by vertical well depressurization
- Estimating the travel distance of channelized rock avalanches using genetic programming method
- Landscape preferences of hikers in Three Parallel Rivers Region and its adjacent regions by content analysis of user-generated photography
- New age constraints of the LGM onset in the Bohemian Forest – Central Europe
- Characteristics of geological evolution based on the multifractal singularity theory: A case study of Heyu granite and Mesozoic tectonics
- Soil water content and longitudinal microbiota distribution in disturbed areas of tower foundations of power transmission and transformation projects
- Oil accumulation process of the Kongdian reservoir in the deep subsag zone of the Cangdong Sag, Bohai Bay Basin, China
- Investigation of velocity profile in rock–ice avalanche by particle image velocimetry measurement
- Optimizing 3D seismic survey geometries using ray tracing and illumination modeling: A case study from Penobscot field
- Sedimentology of the Phra That and Pha Daeng Formations: A preliminary evaluation of geological CO2 storage potential in the Lampang Basin, Thailand
- Improved classification algorithm for hyperspectral remote sensing images based on the hybrid spectral network model
- Map analysis of soil erodibility rates and gully erosion sites in Anambra State, South Eastern Nigeria
- Identification and driving mechanism of land use conflict in China’s South-North transition zone: A case study of Huaihe River Basin
- Evaluation of the impact of land-use change on earthquake risk distribution in different periods: An empirical analysis from Sichuan Province
- A test site case study on the long-term behavior of geotextile tubes
- An experimental investigation into carbon dioxide flooding and rock dissolution in low-permeability reservoirs of the South China Sea
- Detection and semi-quantitative analysis of naphthenic acids in coal and gangue from mining areas in China
- Comparative effects of olivine and sand on KOH-treated clayey soil
- YOLO-MC: An algorithm for early forest fire recognition based on drone image
- Earthquake building damage classification based on full suite of Sentinel-1 features
- Potential landslide detection and influencing factors analysis in the upper Yellow River based on SBAS-InSAR technology
- Assessing green area changes in Najran City, Saudi Arabia (2013–2022) using hybrid deep learning techniques
- An advanced approach integrating methods to estimate hydraulic conductivity of different soil types supported by a machine learning model
- Hybrid methods for land use and land cover classification using remote sensing and combined spectral feature extraction: A case study of Najran City, KSA
- Streamlining digital elevation model construction from historical aerial photographs: The impact of reference elevation data on spatial accuracy
- Analysis of urban expansion patterns in the Yangtze River Delta based on the fusion impervious surfaces dataset
- A metaverse-based visual analysis approach for 3D reservoir models
- Late Quaternary record of 100 ka depositional cycles on the Larache shelf (NW Morocco)
- Integrated well-seismic analysis of sedimentary facies distribution: A case study from the Mesoproterozoic, Ordos Basin, China
- Study on the spatial equilibrium of cultural and tourism resources in Macao, China
- Urban road surface condition detecting and integrating based on the mobile sensing framework with multi-modal sensors
- Application of improved sine cosine algorithm with chaotic mapping and novel updating methods for joint inversion of resistivity and surface wave data
- The synergistic use of AHP and GIS to assess factors driving forest fire potential in a peat swamp forest in Thailand
- Dynamic response analysis and comprehensive evaluation of cement-improved aeolian sand roadbed
- Rock control on evolution of Khorat Cuesta, Khorat UNESCO Geopark, Northeastern Thailand
- Gradient response mechanism of carbon storage: Spatiotemporal analysis of economic-ecological dimensions based on hybrid machine learning
- Comparison of several seismic active earth pressure calculation methods for retaining structures
- Mantle dynamics and petrogenesis of Gomer basalts in the Northwestern Ethiopia: A geochemical perspective
- Study on ground deformation monitoring in Xiong’an New Area from 2021 to 2023 based on DS-InSAR
- Paleoenvironmental characteristics of continental shale and its significance to organic matter enrichment: Taking the fifth member of Xujiahe Formation in Tianfu area of Sichuan Basin as an example
- Equipping the integral approach with generalized least squares to reconstruct relict channel profile and its usage in the Shanxi Rift, northern China
- InSAR-driven landslide hazard assessment along highways in hilly regions: A case-based validation approach
- Attribution analysis of multi-temporal scale surface streamflow changes in the Ganjiang River based on a multi-temporal Budyko framework
- Maps analysis of Najran City, Saudi Arabia to enhance agricultural development using hybrid system of ANN and multi-CNN models
- Hybrid deep learning with a random forest system for sustainable agricultural land cover classification using DEM in Najran, Saudi Arabia
- Long-term evolution patterns of groundwater depth and lagged response to precipitation in a complex aquifer system: Insights from Huaibei Region, China
- Remote sensing and machine learning for lithology and mineral detection in NW, Pakistan
- Spatial–temporal variations of NO2 pollution in Shandong Province based on Sentinel-5P satellite data and influencing factors
- Numerical modeling of geothermal energy piles with sensitivity and parameter variation analysis of a case study
- Stability analysis of valley-type upstream tailings dams using a 3D model
- Variation characteristics and attribution analysis of actual evaporation at monthly time scale from 1982 to 2019 in Jialing River Basin, China
- Investigating machine learning and statistical approaches for landslide susceptibility mapping in Minfeng County, Xinjiang
- Investigating spatiotemporal patterns for comprehensive accessibility of service facilities by location-based service data in Nanjing (2016–2022)
- A pre-treatment method for particle size analysis of fine-grained sedimentary rocks, Bohai Bay Basin, China
- Study on the formation mechanism of the hard-shell layer of liquefied silty soil
- Comprehensive analysis of agricultural CEE: Efficiency assessment, mechanism identification, and policy response – A case study of Anhui Province
- Simulation study on the damage and failure mechanism of the surrounding rock in sanded dolomite tunnels
- Towards carbon neutrality: Spatiotemporal evolution and key influences on agricultural ecological efficiency in Northwest China
- High-frequency cycles drive the cyclical enrichment of oil in porous carbonate reservoirs: A case study of the Khasib Formation in E Oilfield, Mesopotamian Basin, Iraq
- Reconstruction of digital core models of granular rocks using mathematical morphology
- Spatial–temporal differentiation law of habitat quality and its driving mechanism in the typical plateau areas of the Loess Plateau in the recent 30 years
- A machine-learning-based approach to predict potential oil sites: Conceptual framework and experimental evaluation
- Effects of landscape pattern change on waterbird diversity in Xianghai Nature Reserve
- Research on intelligent classification method of highway tunnel surrounding rock classification based on parameters while drilling
- River morphology and tectono-sedimentary analysis of a shallow river delta: A case study of Putaohua oil layer in Saertu oilfield (L. Cretaceous), China
- Review Articles
- Humic substances influence on the distribution of dissolved iron in seawater: A review of electrochemical methods and other techniques
- Applications of physics-informed neural networks in geosciences: From basic seismology to comprehensive environmental studies
- Ore-controlling structures of granite-related uranium deposits in South China: A review
- Shallow geological structure features in Balikpapan Bay East Kalimantan Province – Indonesia
- A review on the tectonic affinity of microcontinents and evolution of the Proto-Tethys Ocean in Northeastern Tibet
- Advancements in machine learning applications for mineral prospecting and geophysical inversion: A review
- Special Issue: Natural Resources and Environmental Risks: Towards a Sustainable Future - Part II
- Depopulation in the Visok micro-region: Toward demographic and economic revitalization
- Special Issue: Geospatial and Environmental Dynamics - Part II
- Advancing urban sustainability: Applying GIS technologies to assess SDG indicators – a case study of Podgorica (Montenegro)
- Spatiotemporal and trend analysis of common cancers in men in Central Serbia (1999–2021)
- Minerals for the green agenda, implications, stalemates, and alternatives
- Spatiotemporal water quality analysis of Vrana Lake, Croatia
- Functional transformation of settlements in coal exploitation zones: A case study of the municipality of Stanari in Republic of Srpska (Bosnia and Herzegovina)
- Hypertension in AP Vojvodina (Northern Serbia): A spatio-temporal analysis of patients at the Institute for Cardiovascular Diseases of Vojvodina
- Regional patterns in cause-specific mortality in Montenegro, 1991–2019
- Spatio-temporal analysis of flood events using GIS and remote sensing-based approach in the Ukrina River Basin, Bosnia and Herzegovina
- Flash flood susceptibility mapping using LiDAR-Derived DEM and machine learning algorithms: Ljuboviđa case study, Serbia
- Geocultural heritage as a basis for geotourism development: Banjska Monastery, Zvečan (Serbia)
- Assessment of groundwater potential zones using GIS and AHP techniques – A case study of the zone of influence of Kolubara Mining Basin
- Impact of the agri-geographical transformation of rural settlements on the geospatial dynamics of soil erosion intensity in municipalities of Central Serbia
- Where faith meets geomorphology: The cultural and religious significance of geodiversity explored through geospatial technologies
- Applications of local climate zone classification in European cities: A review of in situ and mobile monitoring methods in urban climate studies
- Complex multivariate water quality impact assessment on Krivaja River
- Ionization hotspots near waterfalls in Eastern Serbia’s Stara Planina Mountain
- Shift in landscape use strategies during the transition from the Bronze age to Iron age in Northwest Serbia
- Assessing the geotourism potential of glacial lakes in Plav, Montenegro: A multi-criteria assessment by using the M-GAM model
- Flash flood potential index at national scale: Susceptibility assessment within catchments
- SWAT modelling and MCDM for spatial valuation in small hydropower planning
- Disaster risk perception and local resilience near the “Duboko” landfill: Challenges of governance, management, trust, and environmental communication in Serbia