Seismic response and damage model analysis of rocky slopes with weak interlayers
-
Yawen Zhao
 ,
Handong Liu
,
Handong Liu

Abstract
A large-scale shaking table test of an anti-dip rock slope with a weak interlayer is conducted based on the Hongshiyan landslide induced by the Ludian earthquake. The dynamic failure mode energy damage identification method is analyzed using the Hilbert–Huang transformation and marginal spectrum theory. The result shows that the weak interlayer under horizontal loading amplifies the 5–10 and 25–30 Hz frequency signal and attenuates the 15–20 Hz signal. Within the hard rock, it amplifies the 5–15 Hz frequency signal and attenuates the 20–30 Hz signal. Under vertical loading, both weak interlayer and hard rock have an amplification effect on 5–30 Hz signal, and the amplification effect of weak interlayer is more significant. The horizontal seismic wave slope damage process can be divided into two stages: internal damage and obvious failure. When the horizontal seismic input amplitude reaches 0.2–0.3 g, internal damage occurs in the slope. The slope damage is primarily concentrated below two-third of the hard rock height and primarily in the shallow and surface regions of the slope. An input amplitude in the range of 0.4–0.5 g corresponds to the obvious failure stage. At this time, the slope first undergoes an obvious rupture in the rock above the weak layer; this rupture then extends upward to the top of the slope. Marginal spectral analysis results are consistent with the field model slope macroscopic rupture phenomenon.
1 Introduction
Earthquakes are accompanied by strong surface deformation and fault dislocation, which is a violent event caused by the movement of the earth medium. Most moderate- and large-magnitude earthquakes trigger landslides, shallow and deep rock slides, and rock collapse. The 2008 Wenchuan earthquake triggered more than 15,000 landslides, collapses, and mudslides, directly killing 20,000 people, with landslides accounting for approximately one-third of the total deaths [1,2,3]. It can be seen that earthquake-induced landslide is a kind of natural disaster with great harm and long potential harm in the world [4,5,6,7,8].
The topic of great interest is the study of the dynamic response and damage mechanism of earthquake-induced rock landslides. The mechanism of action of earthquake-induced landslides is extremely complex and is affected by various parameters [9]. Scholars have combined statistical analysis models, machine learning, and deep learning models to analyze the impact of multiple factors on earthquake-induced landslide damage [10,11,12]. Among them, the lithological factors, especially the weak interlayers, have a greater influence on the stability of slopes under seismic action. The Wenchuan earthquake resulted in damage to a large number of rock slopes with weak interlayers [13,14]. Dynamic analyses of rock slopes with weak interlayers under earthquake action are therefore of great interest. A weak interlayer in a rock slope has a great influence on the dynamic stability of the slope, which leads to a complex dynamic slope response [15,16].
Shaking table test is an effective means to study the dynamic instability law of landslides. However, most of the existing research studies are limited to analyze the acceleration response of the slope and analyze the damage process after the loading of different dynamic waves [17,18]. This analysis method can only study the crack development on the surface of the slope, and it is difficult to achieve a better observation and study of the deformation and damage process within the slope. It is known through the AE monitoring results in a large number of rock mechanics tests that the crack damage inside the rock body is crucial to the overall damage process of the rock body [19]. Carrying out the identification of damage inside the slope body based on seismic energy signal transmission and combining it with the appearance of the slope damage phenomenon can better determine the seismic damage pattern of the weak interlayers slopes.
The propagation of seismic wave signals is the propagation of energy, and an analysis of seismic wave signals can effectively reflect the process of energy transfer and loss within a slope [20,21]. In structural engineering, a large number of damage identification studies based on energy analysis methods have been conducted [22,23]. With further seismic slope research, methods for identifying slope damage via energy analyses have gradually developed, including Hilbert–Huang transform (HHT) damage identification methods, modal analyses, and wavelet transform damage identification methods [24,25,26]. Seismic wave signals are short-time, abruptly changing non-stationary signals. The results of modal and wavelet analyses of seismic signals are highly dependent on the chosen basis functions, which limits the application of these two methods to seismic slope damage. For example, mutant signals at high frequencies are better resolved when wavelet analysis is employed. Because the higher the frequency, the higher the localization of the basic wavelet. If mutant signals occur only in the low-frequency range, the effectiveness of the wavelet analysis will be significantly reduced. Moreover, wavelet analysis has non-adaptive characteristics. Once the basic wavelet is selected, it must be used to analyze all the data. Comparatively, HHT adopts the intrinsic mode functions (IMFs) with strong adaptability, which makes the instantaneous frequency meaningful. This method has excellent time–frequency resolution, so it has advantages in seismic slope damage identification. Song et al. analyzed geological and topographical amplification effects in the time-frequency domain based on the Hilbert spectrum and marginal spectrum [27]. Song et al. also found that the difference in seismic response between the block and the slip layer is the main trigger for landslides by analyzing the Hilbert spectrum and the marginal spectrum [28]. Fan et al. identified the development process of dynamic damage in bedding and anti-dip slopes by analyzing the variation law of marginal spectrum amplitude at different positions in the model slope [29]. Yang et al. analyzed the time–frequency domain characteristics of bedding and anti-dip slopes using the Hilbert spectrum and the marginal spectrum. The marginal spectrum indicated that the seismic damage of the anti-dip slope was primarily concentrated at the shoulder of the slope, while the damage of the bedding slope occurred at the waist of the slope, forming a shear slip surface at that location [30].
On the whole, the research on internal damage identification of slopes based on energy propagation is still at an early stage, and most of the research objects are bedding and anti-dip slopes, and there are fewer studies on damage identification of slopes with weak interlayers. In this article, a shaking table test is performed on an anti-dip rock slope with a weak interlayer using the Hongshiyan landslide as a prototype. The dynamic response characteristics of the weak interlayer, as well as the seismic damage in different parts of the slope and the overall damage process of the slope, were analyzed using the energy damage identification methods of Hilbert spectrum and the marginal spectrum.
2 Overview of the Hongshiyan landslide
The Hongshiyan landslide is located in Ludian County, Yunnan Province, on the right bank of the Niulan River (Figure 1a). The tectonic movement in this area is active, and the Niulan River flows from southeast to northwest. The deepening and lateral erosion of the river is intense, forming a deep “V”-valley landform. On August 3, 2014, a 6.5-magnitude earthquake occurred in Ludian County, Yunnan Province, inducing a giant landslide on the right bank at Hongshiyan. The landslide, together with the front part of an ancient landslide on the left bank, blocked the Niulan River and formed a large barrier with a height of 120 m and a volume of 1,200 × 104 m3.

Hongshiyan landslide: (a) location of Ludian Earthquake, (b) location of Hongshiyan landslide, and (c) overhead view of Hongshiyan landslide (2020.11).
Following the Ludian earthquake, the Hongshiyan slope failure was occurred and the terrain changed significantly. As shown in Figure 1b, the rear edge of the upper sliding bed is a steep cliff, with an estimated maximum height of approximately 350 m. The middle part forms a sloping terrain that is nearly horizontal across the river and tends toward the downstream. Below this slope terrain is a stable body without obvious damage; the new Hongshiyan hydropower station is built on this stable body. The rock mass of the Hongshiyan landslide is soft and hard. Under the action of the self-weight of the upper rock mass, the weak interlayer is continuously compressed and deformed, resulting in pressure-induced tensile deformation of the upper brittle rock mass. Under the action of the earthquake, the slope cracked along unloading fissures along the river and other structural planes (such as the bedding joint), resulting in a large-scale collapse and downstream sliding along the weak interlayer.
The slope had a pre-earthquake gradient of 54–61°, a top elevation of 1,860 m, a slope toe elevation of 1,100 m, and a relative height difference of 760 m. The upper part of the slope is thick-bedded with massive thick-bedded Permian limestone and dolomite (P1q + m). The middle part consists of Permian quartz sandstone, gray shale with limestone, glutenite, and an inferior coal seam (P11). The lower part consists of Devonian gray–black dolomite, argillaceous dolomite with dolomite mudstone, and sand shale (D2q). The slope structure is an anti-dip rock slope with a weak interlayer in the middle. The specific distribution of the slope is shown in Figure 2a.

Lithology and structural surface characteristics of the Hongshiyan landslide: (a) lithologic distribution of the Hongshiyan landslide, (b) statistical map of the structural surfaces of the Hongshiyan landslide.
The main structural surface statistics of the slope are shown in Figure 2b. Three main groups of joints are developed on the slope. The first group consists of plane joints, with an occurrence of 300° ∠ 10–30°. The plane joints are gently inclined to the right bank in the downstream direction and are mostly closed, with a large extension length and a local muddy interlayer. The second group of joints is along the river with occurrences of 180° ∠ 80°. This group of joints is subjected to unloading, with the joints being more open in the shallow part of the slope. The joint surfaces are undulating and rough, and their extension length is large. The third group of joints are transverse river joints, with an occurrence of 60° ∠ 80°; these joints are mostly open, and their surface consists of a wide dissolution crack filled with secondary mud.
3 Shaking table test design and HHT
3.1 Generalizations of the physical model
According to the lithology and structural characteristics of the Hongshiyan landslide, the slope was generalized as being an anti-dip slope with a weak interlayer. The slope of the physical model test was set to 60°, the dip angle of the plane joints was 30°, and the slope height was 2.0 m. The upper hard rock of the slope was masoned with staggered joints using blocks. Each block measured 20 cm × 10 cm × 8 cm and was pressed from a similar material to hard rock. The central weak interlayer was compacted using a soft rock similar material. The lower stable area was compacted with hard rock similar material in layers. Figure 3 shows the model of the slope after the masonry was completed.

Model of the Hongshiyan landslide (unit: meter).
3.2 Similarity relationships and physical and mechanical parameters of the materials
When designing a physical model of the shaking table test, the similarity between the model slope and the prototype slope is determined according to the similarity theory [31,32,33,34]. The theory of similarity in dynamic modelling includes similarity in geometry, mass, loading, and physics. In the specific similarity design, the similarity relationship between different physical and mechanical parameters can be obtained by dimensional analysis. The similarity relationships of the design model slope according to similarity theory are shown in Table 1. Based on the field investigation results, triaxial and uniaxial compression tests, and geological investigation reports [35], the physical and mechanical parameters of each rock layer of the Hongshiyan landslide were determined. The slope model was simplified into two rock types: hard rock and weak interlayers. The specific physical and mechanical indicators of the two rock types are shown in Table 2. According to the similarity ratio of density, stress, and elastic modulus, the physical and mechanical properties of similar materials of weak interlayers and hard rock are designed, and a similar material ratio test is carried out. Finally, the similar material ratio of weak interlayer to hard rock is determined, so that the physical and mechanical parameters of the two are similar to the design values. The hard rock material was composed of barite, quartz sand, iron powder, and rosin alcohol. The ratio between iron powder, barite powder, quartz sand, rosin, and alcohol was 10:24:15:1:3. The weak interlayer material was prepared using clay, quartz sand, water, and gypsum. The ratio of the similar materials was 13:2:1:2. According to the requirements of the model construction, the blocks need to be masoned into the side slopes, therefore, the structural surface of similar materials of the model needs to have fluidity and bonding properties. The hard rock material was used as a base and the alcohol content was readjusted to make the similar material into a viscous slurry see. The shear strength of the structural surface was measured, and the structural surface ratio was determined to be: iron powder:barite powder:quartz sand:gypsum:rosin:alcohol as 21:112:12:8:1:32.
Main similarity constants for the model tests
| Physical quantities | Similarities | Similar constants | Remarks |
|---|---|---|---|
| Length | CL | 350 | Control volume |
| Acceleration | Ca | 1 | Control volume |
| Density | Cρ | 1 | Control volume |
| Modulus of elasticity | CE = CρCL | 350 | |
| Cohesion | CC = CE | 350 | |
| Angle of internal friction | Cψ | 1 | |
| Poisson’s ratio | Cμ | 1 | |
| Time | Ct = Cρ1/2CE−1/2CL | 18 | |
| Speed | Cv = CE1/2Cρ−1/2 | 18 |
Physical and mechanical parameters of the materials
| Lithology type | Parameters | Density | Tensile strength (MPa) | Modulus of elasticity (MPa) | Poisson’s ratio | Cohesion (kPa) | Internal friction angle (°) |
|---|---|---|---|---|---|---|---|
| (g/cm3) | |||||||
| Hard Rock | Prototype | 2.65 | 4.2 | 34,700 | 0.22 | 8,200 | 37.7 |
| Models | 2 | 0.35 | 240 | 0.21 | 711 | 49 | |
| Soft rock | Prototype | 2.35 | 1.60 | 18,600 | 0.17 | 3,600 | 25.3 |
| Models | 1.89 | 0.08 | 74 | 0.19 | 158 | 28 | |
| Structural surfaces (masonry joints) | Prototype | — | — | — | — | — | — |
| Models | — | — | — | — | 100 | 25 |
3.3 Monitoring point setup
Considering the size of the model and the completeness of the monitoring data, three-way acceleration sensors were placed on the slope surface, in the vertical and horizontal directions within the slope, near the weak interlayer, at the interface between the hard rock and weak interlayer, and on the vibration table to determine the acceleration response values. To reduce the influence of the lateral boundaries on both sides, the sensors were all arranged in the middle of the model in the longitudinal section; the specific locations of the acceleration sensors are shown in Figure 4. The acceleration sensor model is a Donghua three-way piezoelectric sensor type 1A314E, with a range of ±50 g, a sensitivity of 98 mV/g, a frequency response of 0.5–7,000 Hz, and a minimum resolution can reach 0.0005 g.

Monitoring point layout.
3.4 Test equipment and model boundaries
The test was performed on a 3 m × 3 m three-way six-degree-of-freedom shaking table. The model box was made of organic glass and had a size of 2.1 m × 1.3 m × 2.1 m. Referring to the relevant shaking table test design, to eliminate the influence of the model box boundaries on the test results, a 5-cm-thick sponge pad was pasted on the box wall at both ends in the vibration direction to reduce the rigid reflection of the seismic wave on the side wall of the model box [36,37,38]. A smooth plastic film was pasted on the inner wall of the model box in the parallel-vibration direction to reduce the friction resistance between the box wall and the model material. The bottom of the model box was welded with a 1-m-long steel bar to increase the friction resistance on the contact surface, so as to avoid relative displacement between the model and the bottom plate during vibration loading. The boundary of the model box is shown in Figure 5.

Model box boundary conditions.
3.5 Loading options
During the test, the input waves primarily consisted of white noise, sine waves, and actual seismic waves in the north–south (horizontal) and vertical directions recorded at the town of Longtoushan during the Ludian earthquake (Figure 6). At the beginning of the test and before each amplitude increase, a white random noise wave with acceleration (0.03–0.05 g) in the horizontal direction of the model and lasting not less than 30 s was input to test the dynamic characteristics of the model slope. The sine waves and actual seismic waves were loaded horizontally, vertically, and as biaxial waves. The sine wave had a frequency of 5–30 Hz and was loaded from low to high frequency. Seismic waves with high a compression factor (six times more) are difficult to apply due to the limitations of the shaker loading function. Therefore, the seismic wave input was the original seismic wave with three and six times compression, and the amplitude was input from low to high, with a preference for loading the seismic wave with a high compression and short loading time. The specific loading scheme is shown in Table 3.
Loading scheme
| Working conditions | Serial number | Waveform | Amplitude (g) | Frequency (Hz) | Loading direction | Loading time |
|---|---|---|---|---|---|---|
| 1 | 1 | Sine wave | 0.06 | 5–30 | Vertical | 10 s |
| 2 | Sine wave | 0.1 | Level | |||
| 3 | Sine wave | Horizontal 0.1/vertical 0.06 | Two directions | |||
| 2 | 1 | Lutian UD | 0.06 | Compressions 6–3 times | Vertical | 10–20 s |
| 2 | Lutian NS | 0.1 | Level | |||
| 3 | Lutian UD + NS | Horizontal 0.1/vertical 0.06 | Two directions | |||
| 3 | 1 | Lutian UD | 0.13 | Compressions 6–3 times | Vertical | 10–20 s |
| 2 | Lutian NS | 0.2 | Level | |||
| 3 | Lutian UD + NS | Horizontal 0.2/Vertical 0.13 | Two directions | |||
| 4 | 1 | Sine wave | 0.1 | 5–30 | Vertical | 10 s |
| 2 | Sine wave | 0.15 | Level | |||
| 3 | Sine wave | 0.15 horizontal/0.1 vertical | Two directions | |||
| 5 | 1 | Lutian UD | 0.2 | Compressions 6–3 times | Vertical | 10–20 s |
| 2 | Lutian NS | 0.3 | Level | |||
| 3 | Lutian UD + NS | Horizontal 0.3/Vertical 0.2 | Two directions | |||
| 6 | 1 | Sine wave | 0.13 | 5–30 | Vertical | 10 s |
| 2 | Sine wave | 0.20 | Level | |||
| 3 | Sine wave | Horizontal 0.2/Vertical 0.13 | Two directions | |||
| 7 | 1 | Lutian UD | 0.27 | Compressions 3 times | Vertical | 10 s |
| 2 | Lutian NS | 0.4 | Level | |||
| 3 | Lutian UD + NS | Horizontal 0.4/Vertical 0.27 | Two directions | |||
| 8 | 1 | Sine wave | 0.17 | 5 | Vertical | 10 s |
| 2 | Sine wave | 0.25 | Level | 10 s | ||
| 3 | Sine wave | Horizontal 0.25/Vertical 0.17 | Two directions | 10 s | ||
| 9 | 1 | Lutian UD | Original wave | Compressions 3 times | Vertical | 10 s |
| 2 | Lutian NS | Original wave | Level | |||
| 3 | Lutian UD + NS | Original wave | Two directions | |||
| 10 | 1 | Sine wave | 0.2 | 5 | Vertical | 10 s |
| 2 | Sine wave | 0.3 | Level | 10 s | ||
| 3 | Sine wave | Horizontal 0.3/Vertical 0.2 | Two directions | 10 s |
Note: In the following, we use numbers to represent the different loading groups, e.g. WS3-2 for Working conditions 3 Serial number 2.

Acceleration time curve and Fourier spectrum of the Ludian seismic waves: (a) acceleration in the north–south direction, (b) Fourier spectrum in the north–south direction, (c) acceleration time in the vertical direction, and (d) Fourier spectrum in the vertical direction.
3.6 Basic principle of HHT and marginal spectrum solution
The HHT is an efficient, adaptive, and high time–frequency resolution signal processing method that is suitable for processing non-linear non-stationary signals such as earthquakes. Unlike the Fourier transform, the HHT does not decompose the signal into a single sinusoidal signal but rather into a multivariable signal called the IMF via the empirical mode decomposition (EMD) method. The IMF signal must satisfy the following two conditions: (1) for the entire signal, the number of zeros and poles must be equal or at most have a difference of 1; and (2) at any point on the signal, the envelope determined by the local extreme value point and the local minimal value point must have a mean value of zero, that is, the signal on the time axis must have local symmetry. The EMD of a set of signals can be decomposed into multiple sets of signals with frequencies ranging from high to low, i.e.,
Here,
The Hilbert transform for each set of IMF functions is as follows:
Here,
The marginal spectrum provides a measure of the amplitude for each frequency, expressing the accumulation of amplitudes over the entire time period. If H(w, t) is integrated over time, the marginal spectrum is obtained:
4 Damage processes and instability patterns of anti-dip rock slopes with weak interlayers
During the tests, the failure of the model was recorded under different waveform inputs. The slope damage can be divided into six stages according to the damage and the process of crack development.
The first stage of the model is the minor damage stage, shown in Figure 7a. When the first and second working conditions were input, the slope entered the minor damage stage, with no significant change in the slope surface and minor tensile cracks appearing in the upper middle region of the model, as shown in Figure 8a.
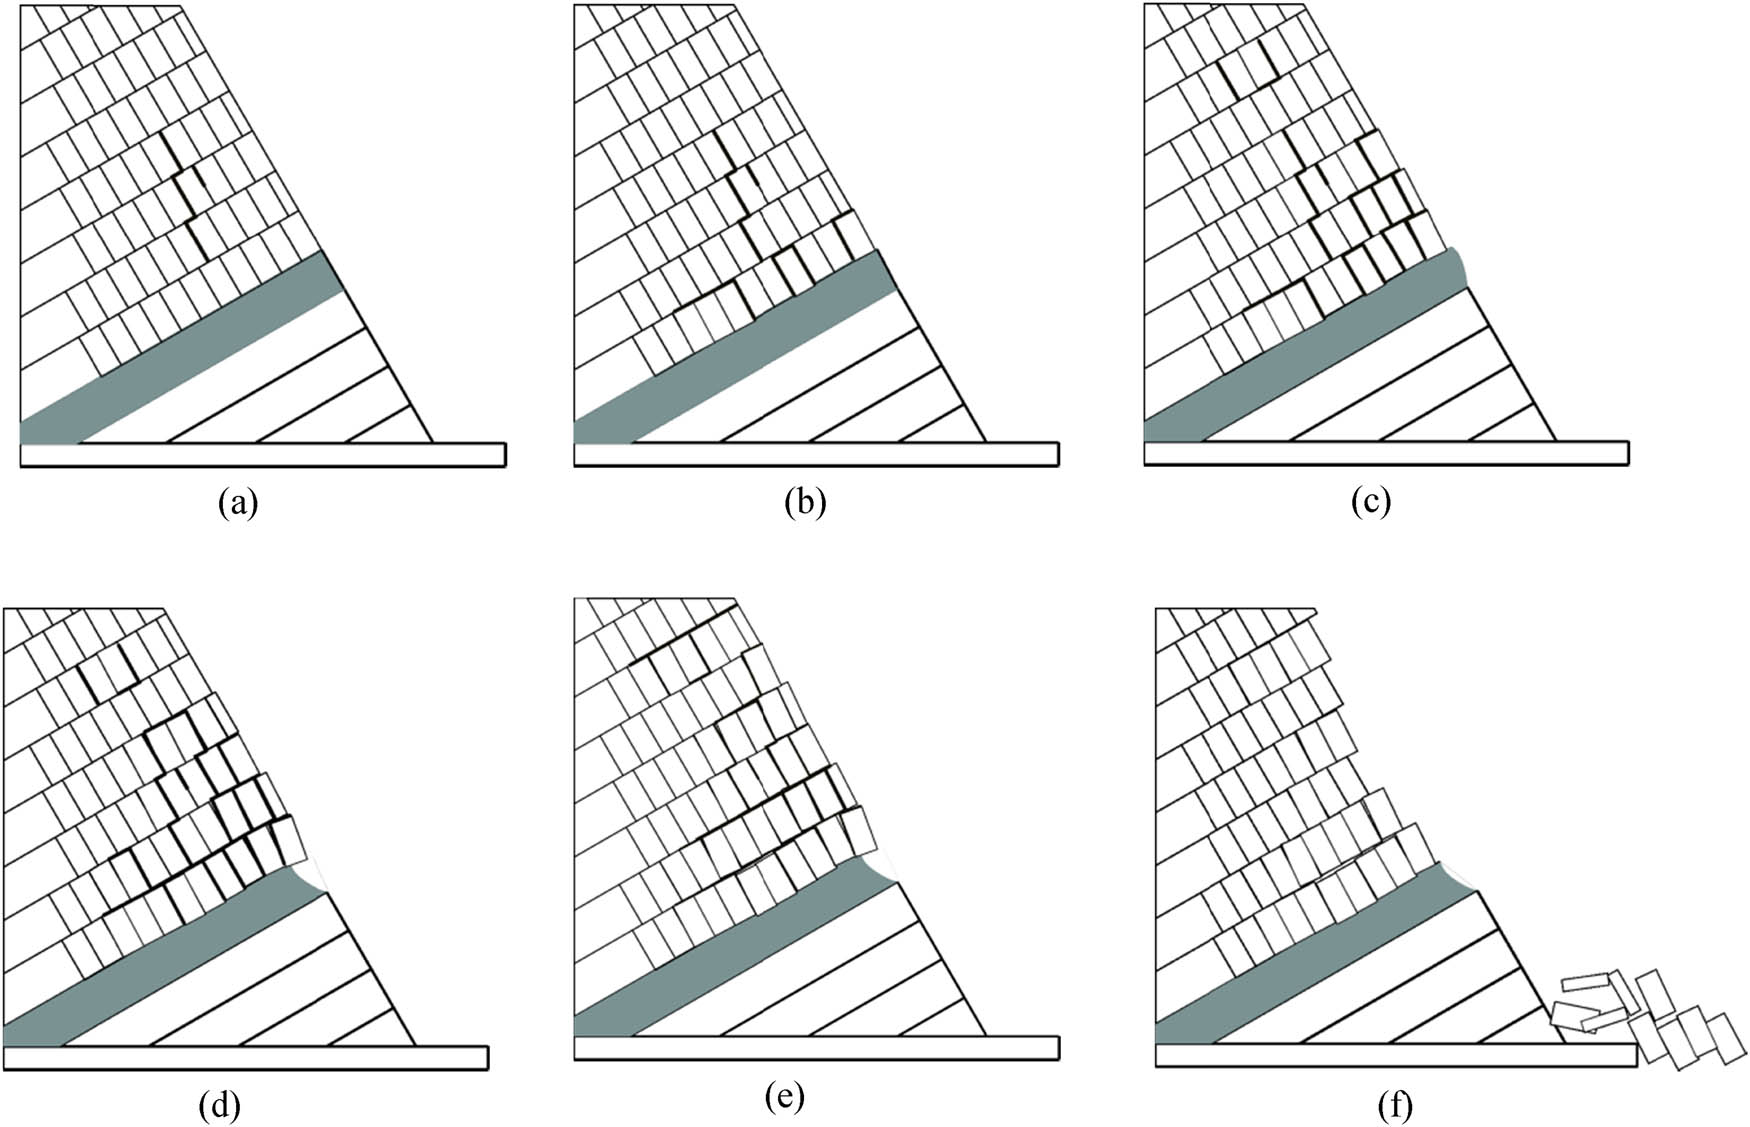
Shaking table test damage process of the model. (a) Development of fine cracks slope, (b) soft and hard rock interface cracked, weak interlayer extrusion, (c) cracks propagation upward, (d) weak interlayer sliding, (e) layer shear cracking, fracture penetration, (f) sliding and accumulating.

Damage to the model slope surface.
The second stage is the joint cracking stage of the soft and hard rock interface, shown in Figure 7b. When the horizontal seismic wave with an amplitude of 0.2 g (WS3-2) was input, tensile cracks appeared at the interface of the weak rock strata on the side of the model and the soft rock squeezed out, as shown in Figure 8b. At the interface of the weak interlayer and the upper hard rock, a horizontal crack appeared, which is consistent with the analysis of Luo [39]. Because of its small stiffness and weak strength, a weak interlayer produces visible compression extrusion deformation under the action of an earthquake, which leads to the deformation and failure of the hard rock in the upper part of the weak interlayer.
The third stage is the development of cracks in the upper hard rock, as shown in Figure 7c. As loading of the slope continued, the upper hard rock part of the model gradually developed tension cracks from the soft and hard rock interface upward. When the input amplitude was 0.25 g and the frequency was 5 Hz (WS4-2) for the horizontal sine wave, at the front of the model and at the interface of the soft and hard rock on both sides of the model, cracks 1 and 2 developed upward, vertical crack 3 appeared at the location of the hard rock at the top of the upper slope of the model, extruded tension cracks 4 and 5 appeared at the weak interlayer of the model, and a raised soft rock block with critical damage formed on the right side of the soft rock body, as shown in Figure 8c.
The fourth stage is the sliding stage of the weak interlayer, shown in Figure 7d. When the model input amplitude was 0.3 g, and the frequency of the horizontal sine wave was 5 Hz (WS6-2), the weak interlayer slid obviously. The sliding interface of the weak interlayer can be seen on the side of the model, and the cracks in the upper hard rock block expanded further. From the front of the model, it can be seen that the soft rock masses on the right side of the projection slid down and the fracture opening on the upper level of the soft rock on the left side became more obvious, with extrusion sliding characteristics. In addition, the fractures between the upper rock masses of the model further developed, forming vertical through fractures, as shown in Figure 8d.
The fifth stage is the sliding surface penetration stage, as shown in Figure 7e. Gradually increasing seismic and sine waves continued to be input into the model (WS8-10). At this stage, the model side appeared to have penetrating interlaminar shear fractures at the interface of the soft and hard rock and interlaminar shear fractures appeared at the location of the model slope shoulder. After continued loading, a penetrating slip surface formed at the slope face from the tension fractures and shear fractures under 0.4-g horizontal sinusoidal wave loading. From the front of the model, it can be seen that there are horizontal and vertical fractures between the upper hard rock masses and that the rock masses are divided into separate blocks with sporadic block dropping, as shown in Figure 8e.
The sixth stage is the slope failure stage, as shown in Figure 7f. The model continued to be loaded, and when the input amplitude was 0.45 g and the frequency of the horizontal sine wave was 5 Hz, the upper part of the model rock body slid and the slope was destroyed (Figure 8f). The final failure characteristics of the slope are shown in Figure 9. From the side of the model, it can be seen that the slope sank significantly during the damage process; the top of the slope dropped approximately 5 cm from the original height, and the rock failure is most obvious at the interface between the soft and hard rock. From the front of the model, with the sine wave input, it is apparent that the rock mass on the right side of the model has collapsed and slid, scraping the lower stable rock mass of the soft rock. This is consistent with the field failure characteristics of the Hongshiyan landslide.

Final failure characteristics of the model slope: (a) side failure characteristics, and (b) frontal failure characteristics.
5 Time–frequency domain analysis of the seismic response and slope damage identification
5.1 Time–frequency characteristics of the slope dynamic response
The HHT was performed on the acquired acceleration signal to obtain the corresponding HHT time–frequency spectrum, and the time–frequency spectrum was time-integrated to obtain the marginal spectrum.
The three-dimensional Hilbert spectrum of measuring points 2 at the lower part of the weak interlayer and measuring points 7, 15, and 19 at the upper part of the weak interlayer were analyzed. Taking the frequency 5 Hz amplitude 0.1 g horizontal direction sine wave as an example, the three-dimensional Hilbert spectrum of the measurement points is shown in Figure 10. There is a single input frequency for sine wave loading. Therefore, the frequency of each measurement point within 0–10 s of loading is basically concentrated around 5 Hz. The maximum magnitudes of the Hilbert spectrum at point 7 and point 2 are close to each other, while the magnitudes at point 15 and point 19 increase significantly with height. This indicates that the weak interlayer is more transmissive to the 5 Hz frequency and has a certain amplification effect. The 5-Hz frequency wave in the hard rock range has a more significant amplification effect. At 10 Hz loading, the three-dimensional Hilbert spectrum of each measurement point is consistent with 5 Hz, and the maximum magnitude increases with the increase of elevation, which indicates that the signal wave of 10 Hz has a significant amplification effect in both hard rock and soft and weak interlayer.
Three-dimensional Hilbert spectrum with 5-Hz horizontal sine wave.
At 15 Hz, the weak interlayer attenuates the fluctuating signal and the upper hard rock amplifies it, resulting in an acceleration suppression zone at the upper interface of the weak interlayer. 20 Hz, both the weak interlayer and the hard rock attenuate the signal, and at this time, the acceleration response is the least dramatic (Figure 11); at 25–30 Hz, the weak interlayer amplifies the signal, and the hard rock attenuates it. This leads to an upward shift of the acceleration suppression zone.

Three-dimensional Hilbert spectrum with 20-Hz horizontal sine wave.
The above characteristics are also obvious in seismic wave loading, as exemplified by the 0.3 g compression of three times seismic wave results (Figure 12). From the results of measurement points 2 and 7, the weak interlayers have significant amplification effects for low-frequency signals less than 10 Hz as well as high-frequency signals greater than 25 Hz. The results from measurement points 15 and 19 show that the hard rock region attenuates the high-frequency signals greater than 25 Hz significantly and amplifies the low-frequency signals with frequencies less than 10 Hz significantly.

Three-dimensional Hilbert spectrum with seismic wave.
Under the vertical sine wave loading, the amplitude variation of each frequency is consistent; we take 0.2 g 5 and 30 Hz as an example (Figure 13). It can be seen that after 5–30 Hz vertical vibration input, the weak interlayer has an obvious amplification effect on the vertical fluctuation, and the rock body in the hard rock range also has an amplification effect on the vertical fluctuation, but it is not as obvious as the amplification of the weak interlayer. Measurement point 19 is located on the slope surface, when the vertical seismic wave is transmitted to the slope surface, the amplification effect is reduced.

Three-dimensional Hilbert spectrum with vertical sine wave: (a) 5 Hz and (b) 30 Hz.
5.2 Slope Hilbert marginal spectrum damage identification
During the propagation of seismic waves on the slope, the energy of seismic waves is gradually amplified with the elevation. However, the post-earthquake damage to the slope results in an incomplete transfer of the seismic energy in the slope structure. The loss of energy causes sharp fluctuations and mutations in the peak of the marginal spectrum. Therefore, the change in the peak value of the marginal spectrum can be used to identify the overall deformation as well as the local deformation.
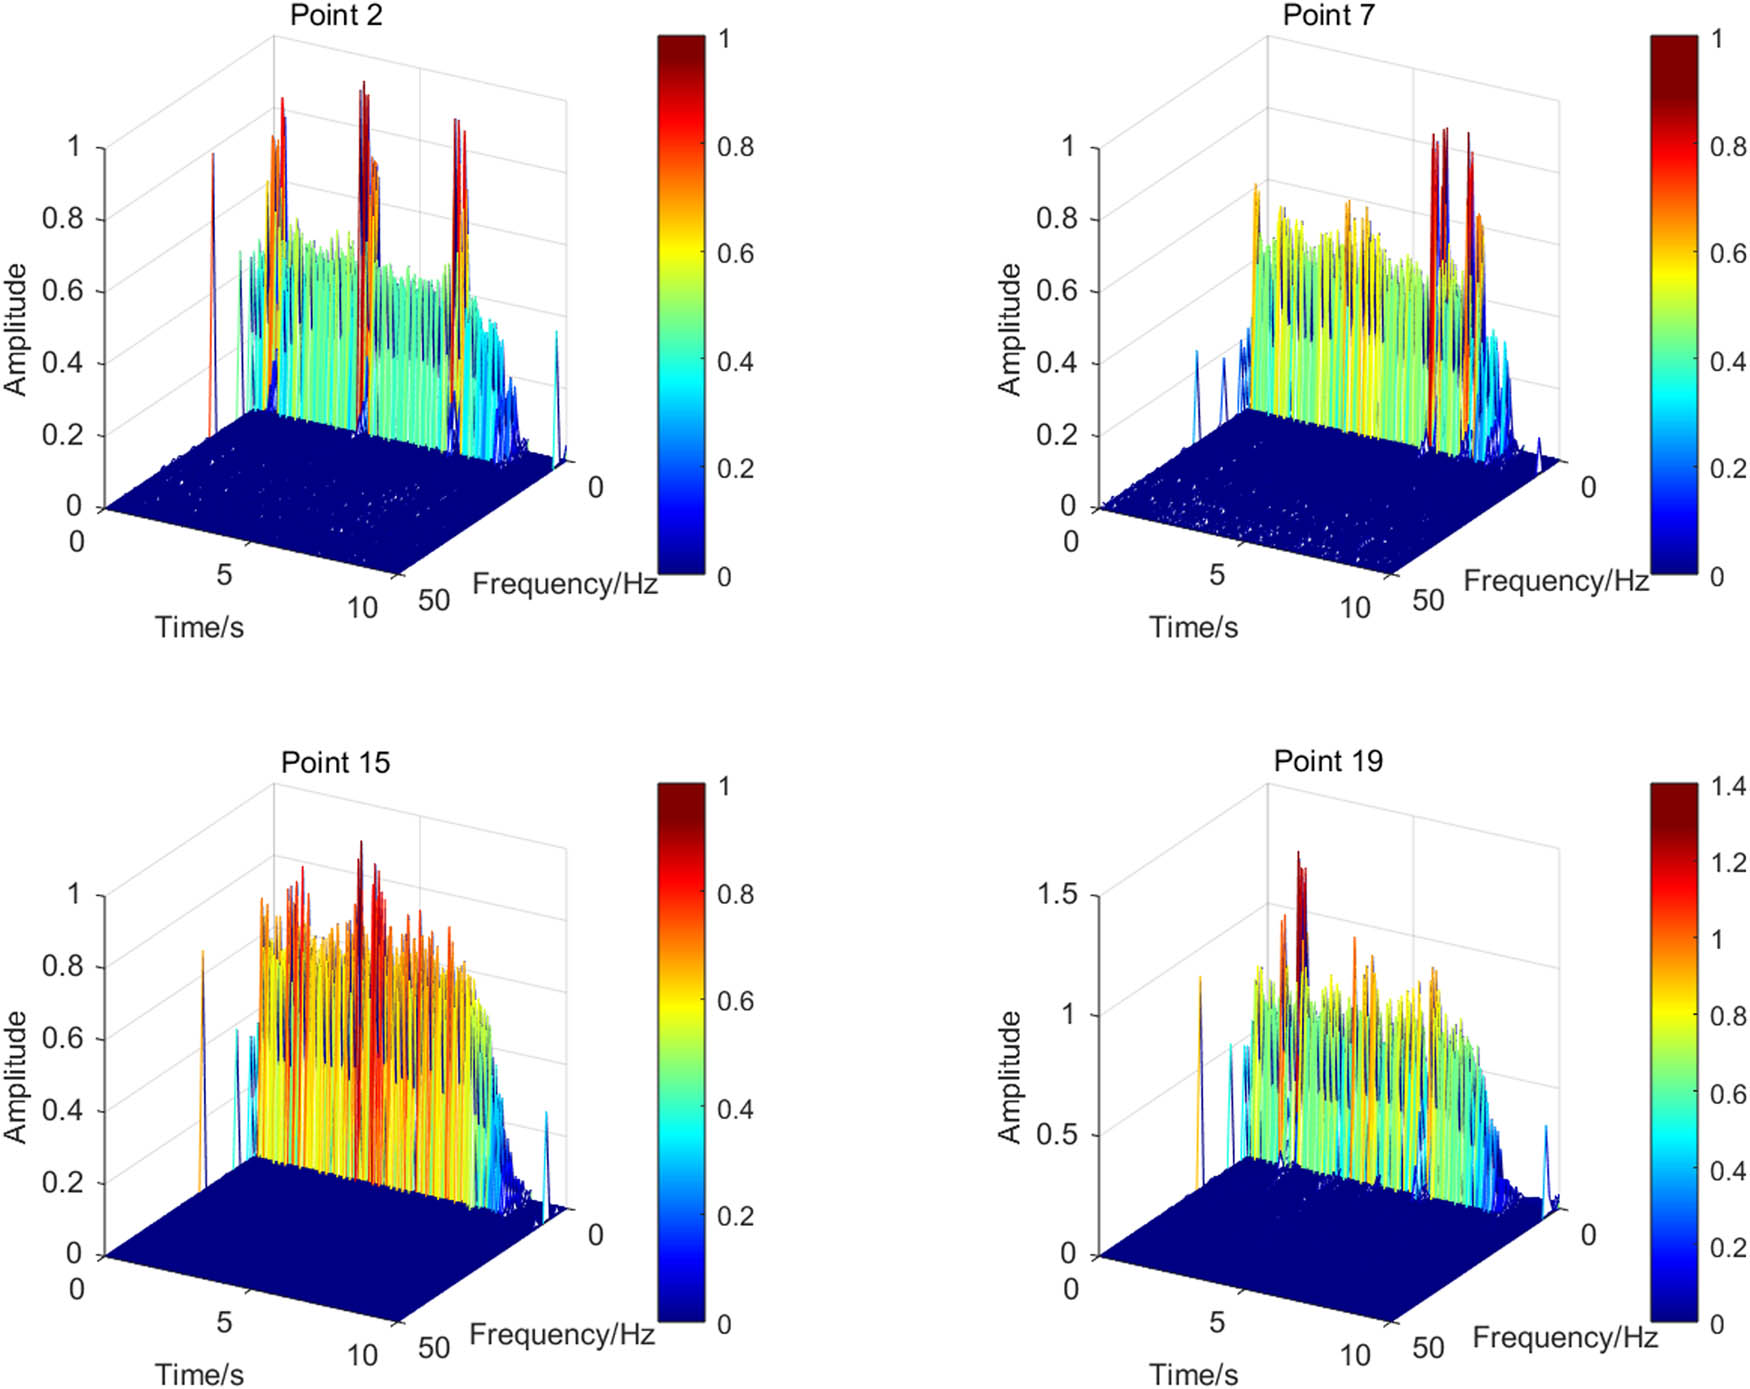
As an example, the marginal spectrum of the 2–7–15–19 sequence with three-times compression and 0.25-g horizontal seismic wave loading is shown in Figure 14. The results of the marginal spectrum show that, after the seismic wave traverses the weak interlayer, the energy gradually converges to the low-frequency part in the hard rock range (monitoring points 7–19); the marginal spectrum gradually changes from the multi-peak characteristic of monitoring point 2 to a unique peak, and the frequency corresponding to the peak of the marginal spectrum of monitoring points 7–19 is close to the slope natural frequency of 8 Hz. This indicates that the slope is subjected to significant stress vibration motion by the seismic waves in the lower part of the slope, while the upper part of the slope experiences more of a self-vibration motion.

Marginal spectrum of the 2–7–17–19 monitoring points. (a) Point 2, (b) point 7, (c) point 15 and (d) point 19.
The variation curves of the peak Hilbert marginal spectrum with the three-times-compressed seismic wave amplitude are plotted for different monitoring points in Figure 15. The variation curves show two abrupt changes in the marginal spectrum amplitude for the horizontal seismic wave input. In the input amplitude range of 0.2–0.3 g, the marginal spectrum amplitude fluctuates at some of the monitoring points, at which point the model does not exhibit significant deformation and is considered to be in the internal damage phase. When the input amplitude is in the range of 0.4–0.5 g, the marginal spectrum amplitude changes significantly and surface fractures develop, indicating the obvious damage stage. Under vertical earthquake loading, the slope damage process is not as obvious as with horizontal loading; internal damage occurs in the amplitude range of 0.3–0.4 g, and significant damage occurs in the range of 0.7–0.8 g. Overall, horizontal seismic wave loading is more likely to cause slope damage; therefore, the loading amplitude at which internal damage and apparent damage occur under horizontal earthquake loading is used as the critical condition for the damage phase of the slope damage.
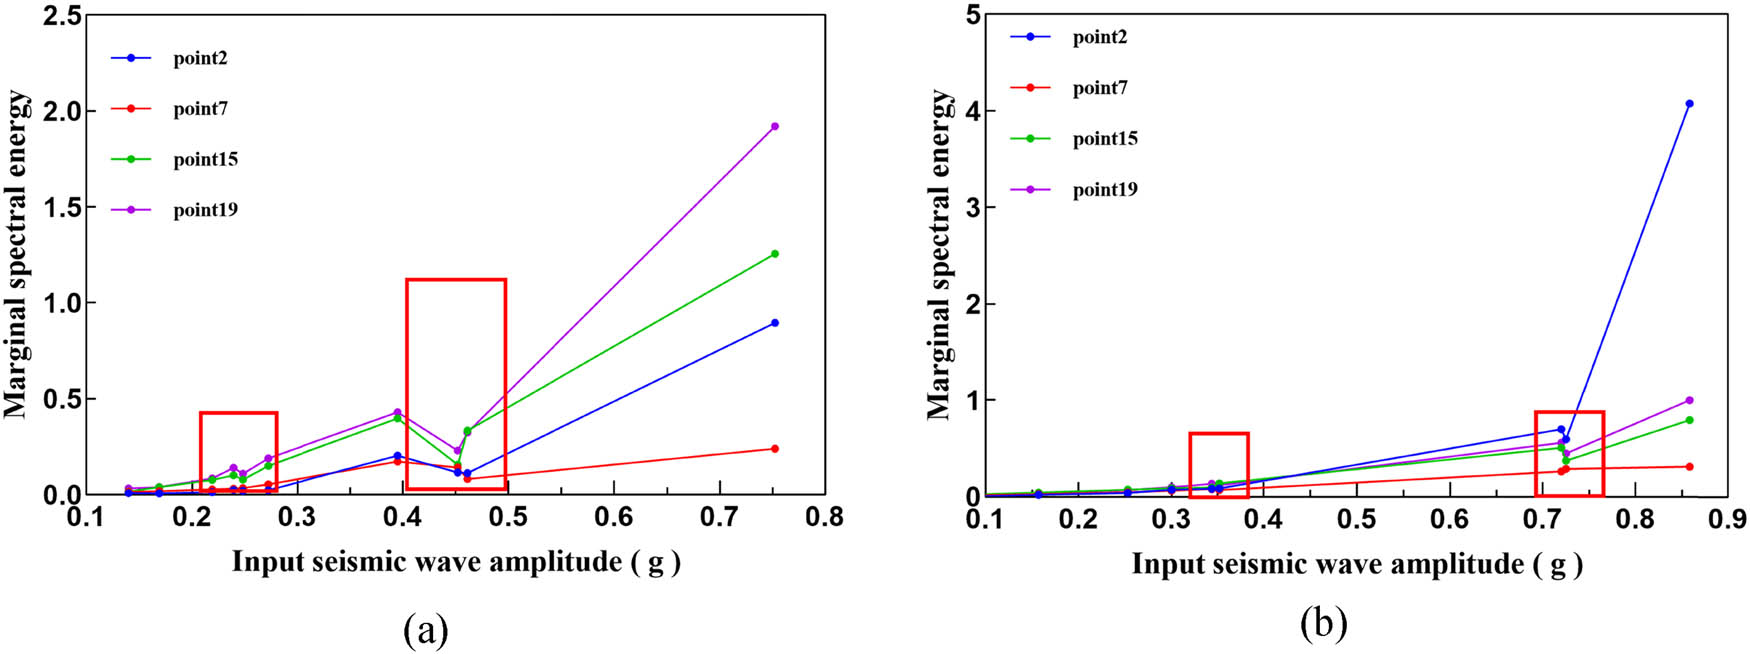
Variation curves of the marginal spectra and amplitudes at monitoring points 2–7–17–19. (a) Horizontal seismic wave loading conditions and (b) vertical seismic wave loading conditions.
In the shaking table test, the seismic waves are loaded from low to high amplitude. When the monitoring point before the damage, the peak of the marginal spectrum under different seismic wave loading should increase with the amplitude. When damage occurs at the measurement point, the peak value of the marginal spectrum decreases significantly, and the corresponding amplitude is the amplitude of the damage. The amplitude of damage occurring at different measurement points is within a certain range, but there is still a sequential order of occurrence. According to the sequence of damage, the damage process after the model dynamic loading is discriminated. Take the internal damage phase of measurement points 4, 9, and 12 under horizontal loading as an example, as shown in Figure 16. Where measurement point 4 is located in the lower stable area, measurement point 9 is located in the weak interlayer, and measurement point 12 is located in the upper hard rock in contact with the soft rock. Measurement point 4 fluctuates less in loading, and the marginal spectral amplitude increases with increasing amplitude. Therefore, the position of measurement point 4 is stable under 0.1–0.3 g seismic wave loading. The marginal spectrum amplitude decreases at measurement point 12 with 0.23 g loading and at measurement point 9 with 0.25 g loading. Therefore, it is considered that the slope damage occurs at measurement point 12 rather than measurement point 9 during the internal damage phase.

Variation curves of the marginal spectra and amplitudes at monitoring points 4–12–9.
By analyzing the order of the damage at the measuring points, we can determine the slope damage process, as shown in Figure 17. During horizontal seismic wave action, the internal slope damage occurs first at monitoring points 12–16–18 (Figure 17a) and then at monitoring points 9–8–15–19–20 (Figure 17b). During the obvious damage phase, the slope is damaged at monitoring points 9–8–7–6–16–18–20 (Figure 17c) and then at monitoring points 12–14–19–22 (Figure 17d). Overall, during the internal damage phase, the slope damage is concentrated below two-third of the height of the hard rock and primarily within the shallow and superficial levels of the slope. In the obvious damage phase, the slope damage deepens and develops toward the middle and rear of the slope. The slope is first significantly damaged in the rock above the weak layer, and then, the damage extends upward to the top of the slope.

Location of slope damage. (a) Internal damage stage 1, (b) internal damage stage 2, (c) obvious failure stage 1, and (d) obvious failure stage 2.
6 Discussion
In this article, the failure process of anti-dip rock slope with weak interlayer is summarized by marginal spectrum energy analysis. The model damage stages were categorized into internal damage stage (horizontal seismic wave loading, 0.2–0.3 g) and obvious failure stage (horizontal seismic wave loading, 0.4–0.5 g) based on the fluctuation of marginal spectral amplitude.
Macroscopically, during the internal damage phase, small tension cracks were observed in the upper and middle parts of the model through the glass from the side wall of the model. Also, tensile cracks were observed in the hard rock above the soft-hard rock junction due to the extrusion of the soft rock. In addition, on the front side of the model, we observed small cracks on the top of the hard rock. In the internal damage stage, the rupture location in the middle of the slope obtained by the marginal spectrum energy damage identification method is plotted together with the crack location on the side as shown in Figure 18. As can be seen in Figure 18a, there is some coincidence between the location of the damage on the interior of the slope and the location of the crack development on the side of the slope. Both are mainly developed within the upper hard rock of the slope body to the top two-third of the slope (Figure 18b). Among them, the sidewall slopes are affected by the glass boundary, and the cracking is more obvious.

Cracks and damage points in the internal damage stage.
Similarly, the location of damage in the interior of the slope during the obvious failure and the location of crack development in the sidewall of the slope are shown in Figure 19. From Figure 19a, it can be seen that the damage location in the middle of the slope body and the crack development location in the sidewall have consistency. In the middle and upper parts of the hard rock, the slope rupture is the most significant. It can also be observed from the front of the slope that there are also obvious shocking cracks in the range where the acceleration sensors are deployed in the middle of the model (Figure 19b).

Cracks and damage points in the obvious failure stage.
Overall, although some measures have been taken to reduce the boundary effect of the model test, the rupture of the slope surface affected by the boundary of the model box is more obvious. However, the macroscopic rupture process on the surface of the slope is still in high agreement with the damage process inside the slope. The acceleration sensors are located in the middle of the slope body, which are less affected by the boundary effect. The damage threshold and damage range of the slope body obtained from the marginal spectral energy of each measurement point in the middle are closer to reality.
7 Conclusions
In this study, the failure mode of an anti-dip slope with a weak interlayer was examined using a shaking table test, the seismic response of the slope was analyzed via HHT, and the identification of the seismic damage was combined with the HHT marginal spectrum to identify the slope damage locations. The following conclusions were obtained:
The seismic dynamic damage process of anti-dip slopes with weak interlayers is a bottom-up damage process, where the extrusion of the weak interlayer causes the structural surface of the upper rock to crack, and the rupture and sinking of the upper rock increases the extrusion of the weak interlayer, which is the active damage mode of this type of slope. The damage process can be divided into six stages: minor damage to the interior of the slope; soft rock extrusion and hard rock cracking above the junction of the soft and hard rock; hard rock cracking extending upward; sliding extrusion of the weak interlayer; sliding surface formation at the surface and through the longitudinal joints; and slope failure.
The Hilbert time–frequency spectrum of the acceleration response is obtained based on the Hilbert–Huang transform, and it can be seen through the time-frequency spectrum that the weak interlayer under horizontal loading amplifies the signal of 5–10 Hz frequency, attenuates the signal of 15–20 Hz, and also has an amplifying effect on the signal of 25–30 Hz. Within the hard rock, it amplifies the 5–15 Hz frequency signal and attenuates the 20–30 Hz signal. Under vertical loading, both weak interlayer and hard rock have amplification effect on 5–30 Hz signal, and the amplification effect of weak interlayer is more obvious.
With a horizontal seismic input amplitude of 0.2–0.3 g, the slope damage process can be divided into an internal damage phase where the slope damage is primarily concentrated below 2/3 of the height of the hard rock and at shallow and surface locations within the slope. The obvious damage phase occurs for an input amplitude range of 0.4–0.5 g, when the slope is first damaged above the weak layer, and then, the damage extends upward to the top of the slope.
Acknowledgements
This research was sponsored by the National Key Research and Development Project of China (Grant No. 2019YFC1509704), the National Natural Science Foundation of China (Grant Nos. U1704243, 41741019, 41977249, and 42090052), the Henan Province Science and Technology Research Project (Grant No. 192102310006), and Henan Province Science and Technology Research Project (Grant No. 232102320035).
-
Author contributions: The order of authors of this article is as follows: Yawen Zhao Jinyu Dong Handong Liu Chuang Wang. Dr. Yawen Zhao completed the experiment, processed the data, and wrote the article. Prof. Jin-Yu Dong conducted the experiment and processed the data, and revised the article. Prof. Handong Liu conducted the conception of the experiment and revised the article. Dr. Chuang Wang helped complete the experiment and revised the article.
-
Conflict of interest: The authors declare no conflicts of interest.
-
Data availability statement: The data underlying this article will be shared on reasonable request to the corresponding author.
References
[1] Yin Y. Researches on the geo-hazards triggered by wenchuan earthquake, sichuan. J Eng Geol. 2008;16(4):433–44.Search in Google Scholar
[2] Qi S, Xu Q, Lan H, Zhang B, Liu J. Spatial distribution analysis of landslides triggered by 2008.5.12 Wenchuan Earthquake, China. Eng Geol. 2010;116:95–108.10.1016/j.enggeo.2010.07.011Search in Google Scholar
[3] Huang RQ, Fan XM. The landslide story. Nat Geoence. 2013;6(5):325–6.10.1038/ngeo1806Search in Google Scholar
[4] Aydan O, Hamada M. Damage to civil engineering structures by Oct. 8, 2005 Kashmir earthquake and recommendations for recovery and reconstruction. J Disaster Res. 2006;1(2):1–9.10.20965/jdr.2006.p0435Search in Google Scholar
[5] Forte G, Verrucci L, Di Giulio A, De Falco M, Tommasi P, Lanzo G, et al. Analysis of major rock slides that occurred during the 2016–2017 Central Italy seismic sequence. Eng Geol. 2021;290:106194.10.1016/j.enggeo.2021.106194Search in Google Scholar
[6] Bird JF, Bommer JJ. Earthquake losses due to ground failure. Eng Geol. 2004;75(2):147–79.10.1016/j.enggeo.2004.05.006Search in Google Scholar
[7] Harp EL, Sarmiento J, Cranswick E. Seismic-induced pore-water pressure records from the Mammoth Lakes, California, earthquake sequence of 25 to 27 May 1980: Bull Seismol Soc Am. Int J Rock Mech Min Sci Geomech Abstr. 1985;74(3):1381–93.10.1785/BSSA0740041381Search in Google Scholar
[8] Marano KD, Wald DJ, Allen TI. Global earthquake casualties due to secondary effects: a quantitative analysis for improving rapid loss analyses. Nat Hazards. 2010;52(2):319–28.10.1007/s11069-009-9372-5Search in Google Scholar
[9] Zhu C, Xu Y, Wu Y, He M, Zhu C, Meng Q, et al. A hybrid artificial bee colony algorithm and support vector machine for predicting blast-induced ground vibration. Earthq Eng Eng Vib. 2022;21(4):861–76.10.1007/s11803-022-2125-0Search in Google Scholar
[10] Liu Z, Ma J, Xia D, Jiang S, Ren Z, Tan C, et al. Toward the reliable prediction of reservoir landslide displacement using earthworm optimization algorithm-optimized support vector regression (EOA-SVR). Nat Hazards. 2023;120:1–24.10.1007/s11069-023-06322-1Search in Google Scholar
[11] Ma J, Lei D, Ren Z, Tan C, Xia D, Guo H. Automated machine learning-based landslide susceptibility mapping for the Three Gorges Reservoir Area, China. Math Geosci. 2023.10.1007/s11004-023-10116-3Search in Google Scholar
[12] Ayalew L, Yamagishi H. The application of GIS-based logistic regression for landslide susceptibility mapping in the Kakuda-Yahiko Mountains, Central Japan. Geomorphology. 2005;65(1):15–31.10.1016/j.geomorph.2004.06.010Search in Google Scholar
[13] Cui S. Seismic responses of wake interlayer and initiation mechanisms of large landslides during strong earthquake. Chin J Rock Mech Eng. 2018;37(6):1560.Search in Google Scholar
[14] Huang R. Mechanism and geomechanical modes of landslide hazards triggered by wenchuan 8.0 earthquake. Chin J Rock Mech Eng. 2009;28(6):1239–49.Search in Google Scholar
[15] Wang C, Liu X, Song D, Wang E, Zhang J. Numerical investigation on dynamic response and failure modes of rock slopes with weak interlayers using continuum-discontinuum element method. Front Earth Sci. 2021;9:791458.10.3389/feart.2021.791458Search in Google Scholar
[16] Chen ZL, Hu X, Xu Q. Experimental study of motion characteristics of rock slopes with weak intercalation under seismic excitation. J Mt Sci. 2016;13(3):546–56.10.1007/s11629-014-3212-0Search in Google Scholar
[17] Liu H, Zhao Y, Dong J, Wang Z. Experimental study of the dynamic response and failure mode of anti-dip rock slopes. Bull Eng Geol Environ. 2021;80(8):6583–96.10.1007/s10064-021-02313-3Search in Google Scholar
[18] He J, Qi S, Zhan Z, Guo S, Li C, Zheng B, et al. Seismic response characteristics and deformation evolution of the bedding rock slope using a large-scale shaking table. Landslides. 2021;18(8):2835–53.10.1007/s10346-021-01682-wSearch in Google Scholar
[19] Bu F, Xue L, Zhai M, Huang X, Dong J, Liang N, et al. Evaluation of the characterization of acoustic emission of brittle rocks from the experiment to numerical simulation. Sci Rep. 2022;12(1):498.10.1038/s41598-021-03910-8Search in Google Scholar PubMed PubMed Central
[20] Yang P, Yin X, Zhang G. Seismic signal time-frequency analysis and attributes extraction based on HHT. Prog Geophysics. 2007;22(5):1585–90.Search in Google Scholar
[21] Chen Z, Wu C, Zhou R. Hilbert-Huang transform spectrum and its application in seismic signal analysis. Jounal Fuzhou Univ (Nat Sci). 2006;2:260–4.Search in Google Scholar
[22] Ma Z, Zhu B, Wu H, Pai L, Wei H, Sun H, et al. Experimental study on seismic failure characteristics optimization of landslide-tunnel shock absorption based on energy analysis. Chin J Rock Mech Eng. 2022;42(4):1–16.Search in Google Scholar
[23] Li H, Dong L, Lv X. Identification of structural damage and test study based on wavelent transform. China Civ Eng J. 2003;36(5):52–7+75.Search in Google Scholar
[24] Mao C, Zhou W, Ou J. Damage assessment based on wavelet energy transfer function spectrum. J Harbin Inst Technol. 2011;43(8):130–4.Search in Google Scholar
[25] Zhang X, Yan Z, Zhang S. Numerical analysis on dynamic response of rock slope using ANSYS software. Northwest Seismol J. 2010;32(2):117–21.Search in Google Scholar
[26] Zhou Y, Liu H, Zhu X, Wen J. Modal analysis of rock slope with a weak interlayer and its influence on seismic dynamic response of slope. Earthq Eng Eng Dyn. 2020;40(1):223–32.Search in Google Scholar
[27] Song D, Chen Z, Chao H, Ke Y, Nie W. Numerical study on seismic response of a rock slope with discontinuities based on the time-frequency joint analysis method. Soil Dyn Earthq Eng. 2020;133:106112.10.1016/j.soildyn.2020.106112Search in Google Scholar
[28] Song D, Chen Z, Ke Y, Nie W. Seismic response analysis of a bedding rock slope based on the time-frequency joint analysis method: a case study from the middle reach of the Jinsha River, China. Eng Geol. 2020;274:105731.10.1016/j.enggeo.2020.105731Search in Google Scholar
[29] Fan G, Zhang J, Wu J, Yan K. Dynamic response and dynamic failure mode of a weak intercalated rock slope using a shaking table. Rock Mech Rock Eng. 2016;49(8):3243–56.10.1007/s00603-016-0971-7Search in Google Scholar
[30] Yang C, Zhang L, Dong L. Research on the difference of dynamic response between bedding and toppling rock slopes based on shaking table test. Chin J Rock Mech Eng. 2022;41(2):271–81.Search in Google Scholar
[31] Kuneš J, ed. Similarity and modeling in science and engineering. Cambridge: Cambridge International Science Publishing Ltd; 2012. p. 30–80.10.1007/978-1-907343-78-0_3Search in Google Scholar
[32] Kumar A, Parihar A. Experimental study on waste foundry sand as partial replacement of retaining wall backfill. Constr Build Mater. 2023;402:132947.10.1016/j.conbuildmat.2023.132947Search in Google Scholar
[33] Kumar A, Parihar A. Response of a small-scale retaining wall-backfill system subjected to amplified motion using shake table. Iran J Sci Technol Trans Civ Eng. 2023;47(4):2333–47.10.1007/s40996-023-01069-ySearch in Google Scholar
[34] Iai S. Similitude for shaking table tests on soil-structure-fluid model in 1g gravitational field. Soils Found. 1989;29(1):105–18.10.3208/sandf1972.29.105Search in Google Scholar
[35] Kunming survey, design and Research Institute Co., Ltd. Engineering geological report on the implementation scheme of Hongshiyan barrier lake regulation project in Niulan River, Yunnan Province; 2015.Search in Google Scholar
[36] Deng Z, Liu X, Liu Y, Liu S, Han Y, Liu J, et al. Model test and numerical simulation on the dynamic stability of the bedding rock slope under frequent microseisms. Earthq Eng Eng Vib. 2020;19(4):919–35.10.1007/s11803-020-0604-8Search in Google Scholar
[37] Zhou Z. Study on the dynamic response and time-frequency stability of slope with persistent discontinuity under strong seismic excitation. PhD thesis. China: Chang’an university; 2022.Search in Google Scholar
[38] Wang C. Study on the seismic dynamic failure mechanism of locked-segment type rock slope. PhD thesis. China: North China University of Water Resources and Electric Power; 2021.Search in Google Scholar
[39] Luo J. A slope dynamic response and formation mechanism of large-scale rockslide dam in the “8.3” Ludian earthquake. PhD thesis. China: Chengdu University of Technology; 2020.Search in Google Scholar
© 2025 the author(s), published by De Gruyter
This work is licensed under the Creative Commons Attribution 4.0 International License.
Articles in the same Issue
- Research Articles
- Seismic response and damage model analysis of rocky slopes with weak interlayers
- Multi-scenario simulation and eco-environmental effect analysis of “Production–Living–Ecological space” based on PLUS model: A case study of Anyang City
- Remote sensing estimation of chlorophyll content in rape leaves in Weibei dryland region of China
- GIS-based frequency ratio and Shannon entropy modeling for landslide susceptibility mapping: A case study in Kundah Taluk, Nilgiris District, India
- Natural gas origin and accumulation of the Changxing–Feixianguan Formation in the Puguang area, China
- Spatial variations of shear-wave velocity anomaly derived from Love wave ambient noise seismic tomography along Lembang Fault (West Java, Indonesia)
- Evaluation of cumulative rainfall and rainfall event–duration threshold based on triggering and non-triggering rainfalls: Northern Thailand case
- Pixel and region-oriented classification of Sentinel-2 imagery to assess LULC dynamics and their climate impact in Nowshera, Pakistan
- The use of radar-optical remote sensing data and geographic information system–analytical hierarchy process–multicriteria decision analysis techniques for revealing groundwater recharge prospective zones in arid-semi arid lands
- Effect of pore throats on the reservoir quality of tight sandstone: A case study of the Yanchang Formation in the Zhidan area, Ordos Basin
- Hydroelectric simulation of the phreatic water response of mining cracked soil based on microbial solidification
- Spatial-temporal evolution of habitat quality in tropical monsoon climate region based on “pattern–process–quality” – a case study of Cambodia
- Early Permian to Middle Triassic Formation petroleum potentials of Sydney Basin, Australia: A geochemical analysis
- Micro-mechanism analysis of Zhongchuan loess liquefaction disaster induced by Jishishan M6.2 earthquake in 2023
- Prediction method of S-wave velocities in tight sandstone reservoirs – a case study of CO2 geological storage area in Ordos Basin
- Ecological restoration in valley area of semiarid region damaged by shallow buried coal seam mining
- Hydrocarbon-generating characteristics of Xujiahe coal-bearing source rocks in the continuous sedimentary environment of the Southwest Sichuan
- Hazard analysis of future surface displacements on active faults based on the recurrence interval of strong earthquakes
- Structural characterization of the Zalm district, West Saudi Arabia, using aeromagnetic data: An approach for gold mineral exploration
- Research on the variation in the Shields curve of silt initiation
- Reuse of agricultural drainage water and wastewater for crop irrigation in southeastern Algeria
- Assessing the effectiveness of utilizing low-cost inertial measurement unit sensors for producing as-built plans
- Analysis of the formation process of a natural fertilizer in the loess area
- Machine learning methods for landslide mapping studies: A comparative study of SVM and RF algorithms in the Oued Aoulai watershed (Morocco)
- Chemical dissolution and the source of salt efflorescence in weathering of sandstone cultural relics
- Molecular simulation of methane adsorption capacity in transitional shale – a case study of Longtan Formation shale in Southern Sichuan Basin, SW China
- Evolution characteristics of extreme maximum temperature events in Central China and adaptation strategies under different future warming scenarios
- Estimating Bowen ratio in local environment based on satellite imagery
- 3D fusion modeling of multi-scale geological structures based on subdivision-NURBS surfaces and stratigraphic sequence formalization
- Comparative analysis of machine learning algorithms in Google Earth Engine for urban land use dynamics in rapidly urbanizing South Asian cities
- Study on the mechanism of plant root influence on soil properties in expansive soil areas
- Simulation of seismic hazard parameters and earthquakes source mechanisms along the Red Sea rift, western Saudi Arabia
- Tectonics vs sedimentation in foredeep basins: A tale from the Oligo-Miocene Monte Falterona Formation (Northern Apennines, Italy)
- Investigation of landslide areas in Tokat-Almus road between Bakımlı-Almus by the PS-InSAR method (Türkiye)
- Predicting coastal variations in non-storm conditions with machine learning
- Cross-dimensional adaptivity research on a 3D earth observation data cube model
- Geochronology and geochemistry of late Paleozoic volcanic rocks in eastern Inner Mongolia and their geological significance
- Spatial and temporal evolution of land use and habitat quality in arid regions – a case of Northwest China
- Ground-penetrating radar imaging of subsurface karst features controlling water leakage across Wadi Namar dam, south Riyadh, Saudi Arabia
- Rayleigh wave dispersion inversion via modified sine cosine algorithm: Application to Hangzhou, China passive surface wave data
- Fractal insights into permeability control by pore structure in tight sandstone reservoirs, Heshui area, Ordos Basin
- Debris flow hazard characteristic and mitigation in Yusitong Gully, Hengduan Mountainous Region
- Research on community characteristics of vegetation restoration in hilly power engineering based on multi temporal remote sensing technology
- Identification of radial drainage networks based on topographic and geometric features
- Trace elements and melt inclusion in zircon within the Qunji porphyry Cu deposit: Application to the metallogenic potential of the reduced magma-hydrothermal system
- Pore, fracture characteristics and diagenetic evolution of medium-maturity marine shales from the Silurian Longmaxi Formation, NE Sichuan Basin, China
- Study of the earthquakes source parameters, site response, and path attenuation using P and S-waves spectral inversion, Aswan region, south Egypt
- Source of contamination and assessment of potential health risks of potentially toxic metal(loid)s in agricultural soil from Al Lith, Saudi Arabia
- Regional spatiotemporal evolution and influencing factors of rural construction areas in the Nanxi River Basin via GIS
- An efficient network for object detection in scale-imbalanced remote sensing images
- Effect of microscopic pore–throat structure heterogeneity on waterflooding seepage characteristics of tight sandstone reservoirs
- Environmental health risk assessment of Zn, Cd, Pb, Fe, and Co in coastal sediments of the southeastern Gulf of Aqaba
- A modified Hoek–Brown model considering softening effects and its applications
- Evaluation of engineering properties of soil for sustainable urban development
- The spatio-temporal characteristics and influencing factors of sustainable development in China’s provincial areas
- Application of a mixed additive and multiplicative random error model to generate DTM products from LiDAR data
- Gold vein mineralogy and oxygen isotopes of Wadi Abu Khusheiba, Jordan
- Prediction of surface deformation time series in closed mines based on LSTM and optimization algorithms
- 2D–3D Geological features collaborative identification of surrounding rock structural planes in hydraulic adit based on OC-AINet
- Spatiotemporal patterns and drivers of Chl-a in Chinese lakes between 1986 and 2023
- Land use classification through fusion of remote sensing images and multi-source data
- Nexus between renewable energy, technological innovation, and carbon dioxide emissions in Saudi Arabia
- Analysis of the spillover effects of green organic transformation on sustainable development in ethnic regions’ agriculture and animal husbandry
- Factors impacting spatial distribution of black and odorous water bodies in Hebei
- Large-scale shaking table tests on the liquefaction and deformation responses of an ultra-deep overburden
- Impacts of climate change and sea-level rise on the coastal geological environment of Quang Nam province, Vietnam
- Reservoir characterization and exploration potential of shale reservoir near denudation area: A case study of Ordovician–Silurian marine shale, China
- Seismic prediction of Permian volcanic rock reservoirs in Southwest Sichuan Basin
- Application of CBERS-04 IRS data to land surface temperature inversion: A case study based on Minqin arid area
- Geological characteristics and prospecting direction of Sanjiaoding gold mine in Saishiteng area
- Research on the deformation prediction model of surrounding rock based on SSA-VMD-GRU
- Geochronology, geochemical characteristics, and tectonic significance of the granites, Menghewula, Southern Great Xing’an range
- Hazard classification of active faults in Yunnan base on probabilistic seismic hazard assessment
- Characteristics analysis of hydrate reservoirs with different geological structures developed by vertical well depressurization
- Estimating the travel distance of channelized rock avalanches using genetic programming method
- Landscape preferences of hikers in Three Parallel Rivers Region and its adjacent regions by content analysis of user-generated photography
- New age constraints of the LGM onset in the Bohemian Forest – Central Europe
- Characteristics of geological evolution based on the multifractal singularity theory: A case study of Heyu granite and Mesozoic tectonics
- Soil water content and longitudinal microbiota distribution in disturbed areas of tower foundations of power transmission and transformation projects
- Oil accumulation process of the Kongdian reservoir in the deep subsag zone of the Cangdong Sag, Bohai Bay Basin, China
- Investigation of velocity profile in rock–ice avalanche by particle image velocimetry measurement
- Optimizing 3D seismic survey geometries using ray tracing and illumination modeling: A case study from Penobscot field
- Sedimentology of the Phra That and Pha Daeng Formations: A preliminary evaluation of geological CO2 storage potential in the Lampang Basin, Thailand
- Improved classification algorithm for hyperspectral remote sensing images based on the hybrid spectral network model
- Map analysis of soil erodibility rates and gully erosion sites in Anambra State, South Eastern Nigeria
- Identification and driving mechanism of land use conflict in China’s South-North transition zone: A case study of Huaihe River Basin
- Evaluation of the impact of land-use change on earthquake risk distribution in different periods: An empirical analysis from Sichuan Province
- A test site case study on the long-term behavior of geotextile tubes
- An experimental investigation into carbon dioxide flooding and rock dissolution in low-permeability reservoirs of the South China Sea
- Detection and semi-quantitative analysis of naphthenic acids in coal and gangue from mining areas in China
- Comparative effects of olivine and sand on KOH-treated clayey soil
- YOLO-MC: An algorithm for early forest fire recognition based on drone image
- Earthquake building damage classification based on full suite of Sentinel-1 features
- Potential landslide detection and influencing factors analysis in the upper Yellow River based on SBAS-InSAR technology
- Assessing green area changes in Najran City, Saudi Arabia (2013–2022) using hybrid deep learning techniques
- An advanced approach integrating methods to estimate hydraulic conductivity of different soil types supported by a machine learning model
- Hybrid methods for land use and land cover classification using remote sensing and combined spectral feature extraction: A case study of Najran City, KSA
- Streamlining digital elevation model construction from historical aerial photographs: The impact of reference elevation data on spatial accuracy
- Analysis of urban expansion patterns in the Yangtze River Delta based on the fusion impervious surfaces dataset
- A metaverse-based visual analysis approach for 3D reservoir models
- Review Articles
- Humic substances influence on the distribution of dissolved iron in seawater: A review of electrochemical methods and other techniques
- Applications of physics-informed neural networks in geosciences: From basic seismology to comprehensive environmental studies
- Ore-controlling structures of granite-related uranium deposits in South China: A review
- Shallow geological structure features in Balikpapan Bay East Kalimantan Province – Indonesia
- A review on the tectonic affinity of microcontinents and evolution of the Proto-Tethys Ocean in Northeastern Tibet
- Special Issue: Natural Resources and Environmental Risks: Towards a Sustainable Future - Part II
- Depopulation in the Visok micro-region: Toward demographic and economic revitalization
- Special Issue: Geospatial and Environmental Dynamics - Part II
- Advancing urban sustainability: Applying GIS technologies to assess SDG indicators – a case study of Podgorica (Montenegro)
- Spatiotemporal and trend analysis of common cancers in men in Central Serbia (1999–2021)
- Minerals for the green agenda, implications, stalemates, and alternatives
- Spatiotemporal water quality analysis of Vrana Lake, Croatia
- Functional transformation of settlements in coal exploitation zones: A case study of the municipality of Stanari in Republic of Srpska (Bosnia and Herzegovina)
- Hypertension in AP Vojvodina (Northern Serbia): A spatio-temporal analysis of patients at the Institute for Cardiovascular Diseases of Vojvodina
- Regional patterns in cause-specific mortality in Montenegro, 1991–2019
- Spatio-temporal analysis of flood events using GIS and remote sensing-based approach in the Ukrina River Basin, Bosnia and Herzegovina
- Flash flood susceptibility mapping using LiDAR-Derived DEM and machine learning algorithms: Ljuboviđa case study, Serbia
- Geocultural heritage as a basis for geotourism development: Banjska Monastery, Zvečan (Serbia)
- Assessment of groundwater potential zones using GIS and AHP techniques – A case study of the zone of influence of Kolubara Mining Basin
- Impact of the agri-geographical transformation of rural settlements on the geospatial dynamics of soil erosion intensity in municipalities of Central Serbia
- Where faith meets geomorphology: The cultural and religious significance of geodiversity explored through geospatial technologies
- Applications of local climate zone classification in European cities: A review of in situ and mobile monitoring methods in urban climate studies