Hypertension in AP Vojvodina (Northern Serbia): A spatio-temporal analysis of patients at the Institute for Cardiovascular Diseases of Vojvodina
-
Emina Kričković
 ,
Tin Lukić
,
Tin Lukić

Abstract
Hypertension is one of the most prevalent cardiovascular diseases globally. This study presents a spatio-temporal analysis of hypertension among patients treated at the Institute for Cardiovascular Diseases of Vojvodina between 2000 and 2023. A Mann–Kendall trend analysis was performed at the settlement level using Python to identify trends in hypertension cases. The Getis-Ord Gi* statistic, implemented through the Emerging Hot Spot Analysis (HSA) tool in ArcGIS Pro, was applied to detect spatial clusters of hot and cold spots. The Mann–Kendall analysis identified significant trends in 40 of the 467 settlements in Autonomous Province Vojvodina. Of these, 36 settlements exhibited an increasing trend in hypertension cases, while a decreasing trend was observed in 4 settlements. The Emerging HSA detected 19 clusters classified as “Consecutive Hot Spots” among 316 analysed clusters, with no discernible patterns observed in the remaining clusters. To compare the findings and results from these two analyses, the Kriging method was applied to the z-values of trends from both analyses. The method indicated higher trends in hypertension cases in settlements within South Bačka County. This research identifies areas with significant hypertension trends, helping to pinpoint high-risk regions. The results support further investigation into the causes and guide targeted public health interventions in the study area.
1 Introduction
Cardiovascular diseases (CVDs) pose a major public health challenge, significantly contributing to the global disease burden across both high- and low-income countries [1]. From the perspective of health geography, CVDs are widely recognised as one of the leading causes of death in Europe [2]. The World Health Organization (WHO) estimates that complications arising from hypertension are responsible for approximately 9.4 million deaths each year [3]. Alarmingly, without immediate and effective interventions, this figure is expected to rise significantly in the coming years. Furthermore, projections suggest that by 2030, nearly a quarter of all global deaths will be attributed to CVDs, underscoring the urgent need for comprehensive strategies to address this growing public health crisis [3].
Among the key risk factors, high blood pressure ranks as one of the leading contributors to death and disability worldwide [4,5]. People’s health is greatly affected by environmental conditions and their impacts [6]. Various factors, such as smoking, poor dietary habits, lack of physical activity, stress, and environmental pollution, play a significant role in the development of noncommunicable diseases [6].
The global prevalence of hypertension – defined as a systolic blood pressure of ≥140 mmHg, diastolic blood pressure of ≥90 mmHg, or the use of antihypertensive medication – doubled from 650 million people in 1990 to 1.3 billion in 2019 [4,5]. Many individuals live with hypertension for extended periods before receiving a diagnosis [4,7].
The NCD Risk Factor Collaboration analysed global hypertension trends from 1990 to 2019 across 200 countries [8]. In 2019, the age-standardised prevalence of hypertension was lowest in Canada and Peru for both men and women (Figure 1). For women, low prevalence was also observed in Taiwan, South Korea, Japan, and several Western European countries, including Switzerland, Spain, and the United Kingdom [8]. Among men, low rates were noted in various low- and middle-income countries, such as Eritrea, Bangladesh, Ethiopia, and the Solomon Islands [8]. In 2019, South Korea, Canada, and Iceland recorded the highest rates of hypertension treatment and control, with treatment exceeding 70% and control surpassing 50% [8]. These were followed by countries like the United States, Costa Rica, Germany, Portugal, and Taiwan. In contrast, treatment rates were below 25% for women and under 20% for men in Nepal, Indonesia, and several nations in sub-Saharan Africa and Oceania [8]. Control rates were less than 10% for both women and men in these regions, as well as for men in parts of North Africa, Central and South Asia, and Eastern Europe [8].
![Figure 1
Number of data sources by country for the hypertension [8].](/document/doi/10.1515/geo-2025-0843/asset/graphic/j_geo-2025-0843_fig_001.jpg)
Number of data sources by country for the hypertension [8].
Various studies have applied geographic information systems (GIS) and spatial statistical methods to analyse hypertension patterns and prevalence. For example, Murad and Khashoggi employed the Getis-Ord Gi* statistic to explore spatial clustering of diabetes, asthma, and hypertension in Jeddah, Saudi Arabia [9]. Similarly, Laohasiriwong et al. used local indicators of spatial association statistics to study hypertension distribution across Thailand’s 76 provinces [10]. In the United States, White et al. utilised Getis-Ord Gi* hotspot mapping to visualise clusters of hypertension prevalence in South Carolina [11].
In South Africa, Rudasingwa et al. conducted spatial scans and hotspot analyses using ArcGIS to identify areas with particularly high hypertension prevalence [1]. Leroux and Cloutier analysed geographic patterns of hypertension in Canada, demonstrating the value of health geography and GIS in understanding hypertension distribution and risk factors [12]. These tools help identify spatial clusters and map hypertension prevalence effectively [12]. Kamath et al. explored the spatial distribution of hypertension among men and women in India and examined its association with health insurance coverage [13]. Similarly, Xu et al. analysed the spatio-temporal variations in gender-specific hypertension risk across China [14].
Kang et al. conducted a study to evaluate temporal trends and regional variations in blood pressure across China, while Gupta and Gupta et al. analysed trends in hypertension epidemiology in India [15–17]. Heaton et al. investigated contemporary hypertension trends’ identification and management following the 2017 American College of Cardiology/American Heart Association guidelines [18]. Aekplakorn et al. analysed temporal trends in hypertension prevalence, awareness, treatment, and control in Thailand [19].
The kriging method has been widely applied in public health and environmental research [20–30]. Matheron, in Principles of Geostatistics, established the foundations of geostatistics by developing a methodological framework for more precise estimation of ore reserves and mineral concentrations in mining [20]. Oliver and Webster, in Kriging: A Method of Interpolation for Geographic Information Systems, explored the integration of the kriging method into GIS, highlighting that traditional interpolation techniques often rely on deterministic models that fail to capture the inherent spatial variability of geographic data [21]. The application of kriging in epidemiological research was demonstrated by Carrat and Valleron, who employed this approach to map an influenza epidemic in France [31]. Oliver et al. analysed the spatial distribution of childhood cancer cases in England, using ordinary and conditionally unbiased cokriging to estimate cancer risk [30]. Jerrett et al. applied universal kriging alongside a multiquadric interpolator to generate a smoothed air pollution surface for Los Angeles, linking it to mortality rates from various causes [24]. Goovaerts and Gebreab compared Bayesian spatial models with Poisson kriging using lung and cervical cancer mortality data from 118 counties, as well as simulated datasets [26]. Mercer et al. assessed the effectiveness of universal kriging and land-use regression in predicting nitrogen oxide (NO x ) concentrations within the Multi-Ethnic Study of Atherosclerosis and Air Pollution [28].
In Serbia, undiagnosed and untreated hypertension remains widespread among the adult population [7]. As reported by Timmis et al., Serbia had an incidence rate of 920 per 100,000 population in 2019, ranking 18th among 54 countries in terms of CVD incidence rate [6,32]. In Serbia and the territory of Autonomous Province (AP) Vojvodina, medical studies analysing hypertension were primarily conducted. Grujić et al. evaluated the prevalence of hypertension and assessed awareness, treatment, and control levels within the population in Serbia [7]. Jocić-Savić et al. examined the prevalence of hypertension among the elderly and its treatment, considering various factors such as regions of Serbia, type of settlement, gender, age, educational background, and socioeconomic status [33]. Vulin et al. conducted a retrospective analysis of data from the outpatient department at the Institute of Cardiovascular Diseases of Vojvodina for the year 2020 [34]. The study identified a link between short-term blood pressure variability and left ventricular diastolic dysfunction in patients with arterial hypertension [34]. A small number of studies in the territory of AP Vojvodina used a geographical approach in the study of CVDs and hypertension [6,35–39]. Kričković et al. applied the Getis-Ord G* method to identify CVD hotspots in Vojvodina, while Tomasevic et al. explored the growing public health issues of obesity and hypertension in the province [6,35]. Furthermore, Petrović and Čanković investigated obesity prevalence and the influence of socio-demographic factors among adolescents aged 15–19 in Vojvodina [36]. Maksimović et al. studied the connection between magnesium and calcium levels in drinking water and CVDs across 65 municipalities in Serbia, while Poloniecki et al. and Jevtić et al. explored the link between air pollution and the incidence of CVDs in the same region [37–39].
This study will focus on the distribution and trends of hypertension within the AP Vojvodina region, specifically among patients treated at the Institute for Cardiovascular Diseases of Vojvodina (ICDV), spanning from 2000 to 2023. While it will not delve into the underlying causes of hypertension, it aims to provide valuable insights into its geographic prevalence and patterns over the past two decades. By integrating spatial analysis with public health research, this study underscores the critical role of geographic perspectives in understanding and addressing the growing burden of hypertension and other non-communicable diseases. Such research is essential for developing targeted interventions and policies that account for regional health disparities and the unique challenges faced by different populations in managing chronic conditions like hypertension. Although hypertension is a significant risk factor for CVDs and one of the most prevalent chronic conditions worldwide, there is a lack of detailed spatial and temporal data on its distribution in Serbia. In the AP Vojvodina region, limited insight into regional trends and patterns hampers public health protective measures. This gap inhibits effective resource allocation and the implementation of tailored preventive actions. By analysing 23 years of hypertension data from the ICDV, this study aims to provide spatial-temporal insights that support evidence-based planning and promote regional health equity.
2 Methods
2.1 Study area
The AP Vojvodina, situated in the northern part of Serbia, boasts a strategically significant geographical location [6,40,41]. It lies between 44°38′ and 46°10′ north latitude and 18°10′ and 21°15′ east longitude in south-eastern Europe, within the Balkans, and covers the southern portion of the Pannonian Basin (Figure 2) [6,40,41]. To the north, it borders Hungary, to the east Romania, to the west Croatia, and to the southeast Bosnia and Herzegovina [6,40]. To the south, it is bounded by the Danube and Sava rivers [6,40,42]. The total area of the research region is 21,506 km2 [6,40]. In 2022, the Republic Institute of Statistics recorded 1,740,230 inhabitants in the AP Vojvodina [40,43]. The research area has 467 settlements. The modern network of urban areas consists of 52 settlements, 45 local self-governments, and 37 settlements represent municipal centres [44,45]. The largest number of settlements belongs to the category of 5,000–10,000 inhabitants, and only Novi Sad belongs to the category of over 100,000 inhabitants [44,45].
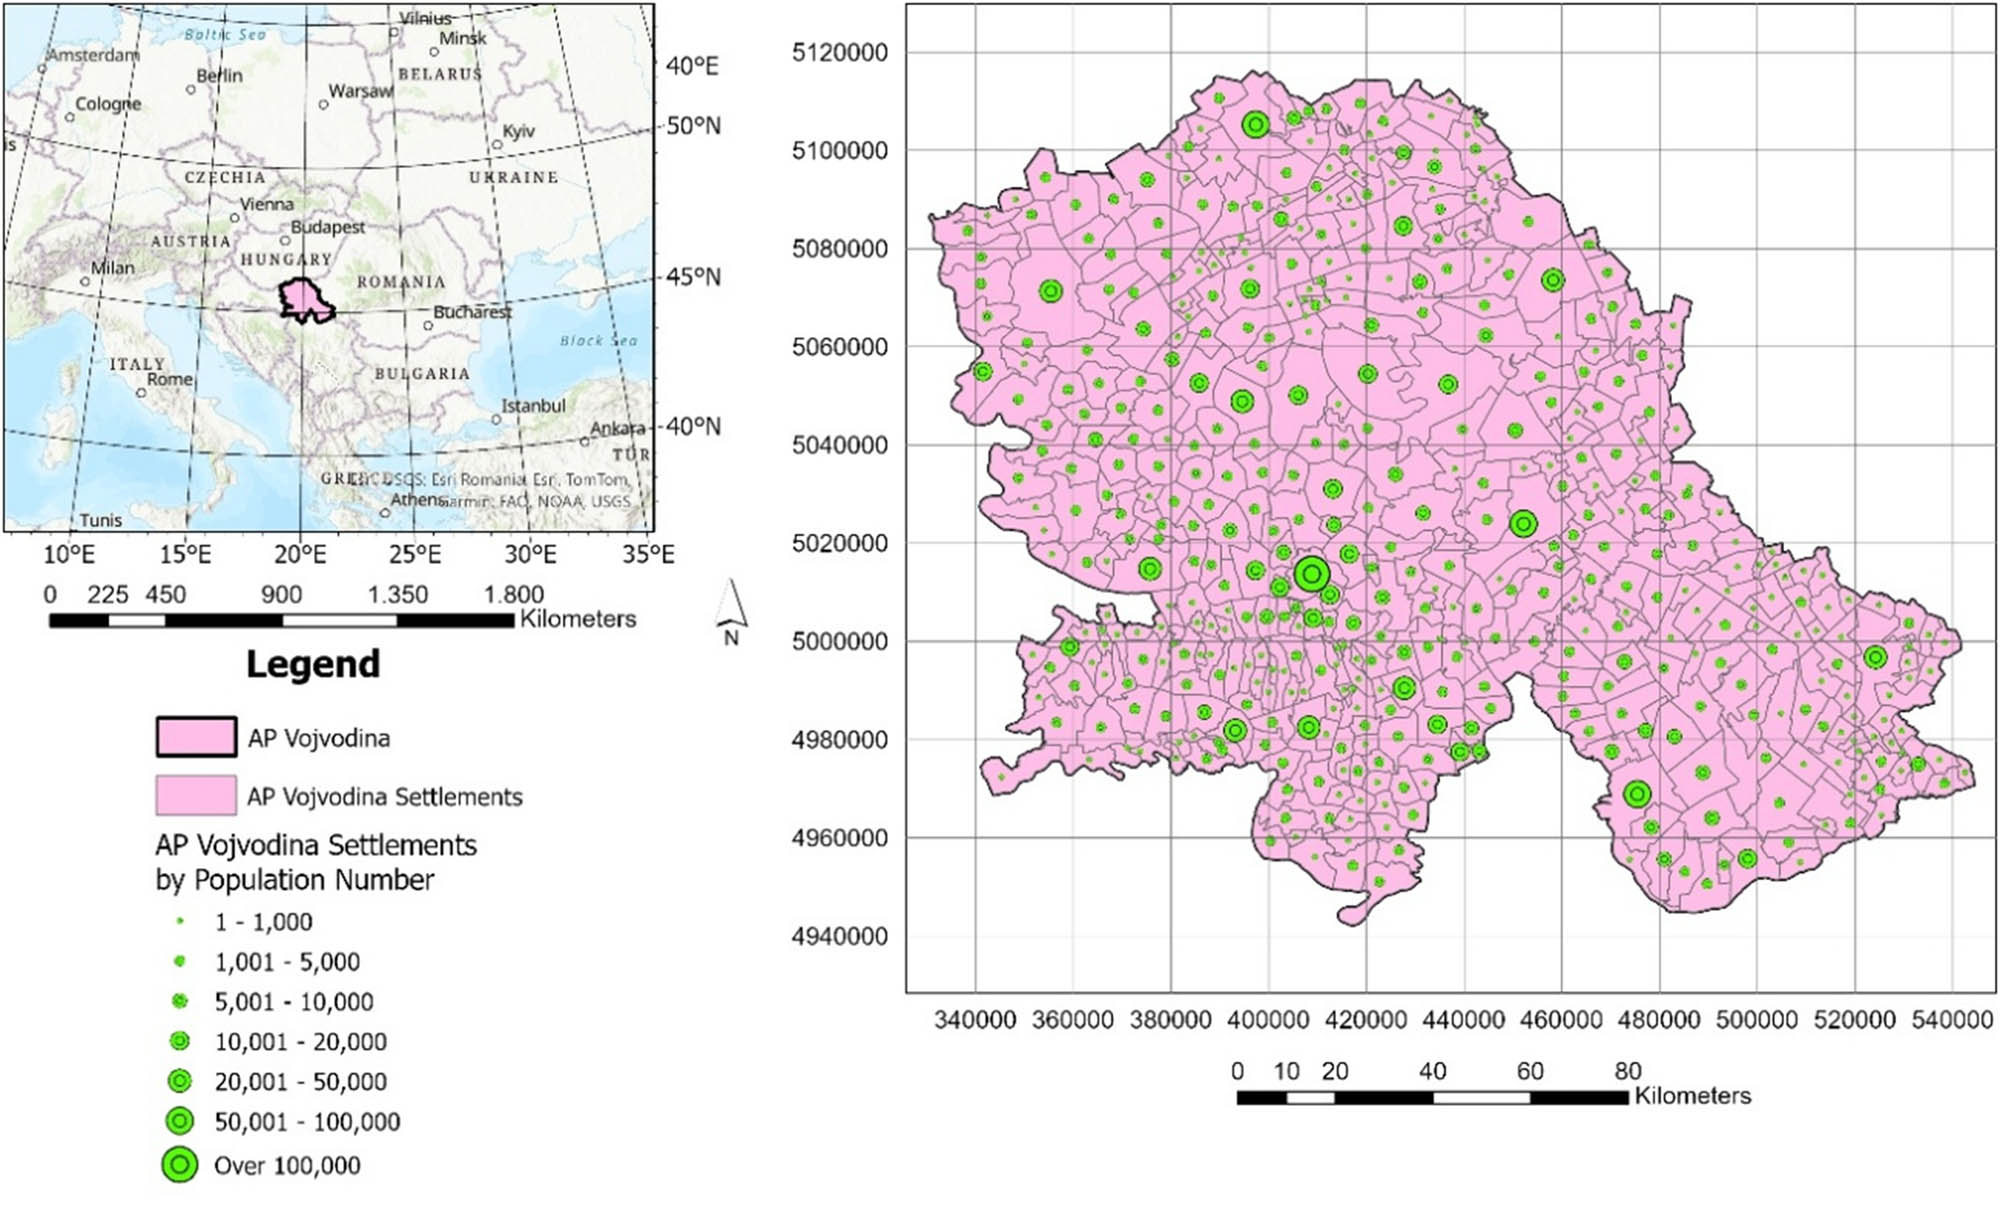
Position of the study area in the South-eastern Europe and settlements by population number.
2.2 Data set
For this study, a reference database from the ICDV in Sremska Kamenica was used [46]. The database was organised according to the International Classification of Diseases (ICD), as defined by the 10th Revision of the International Statistical Classification of Diseases and Related Health Problems, published by the WHO [47]. Although the WHO released the 11th Revision of the ICD at the 72nd World Health Assembly in 2019, which came into effect on January 1, 2022 [48], the 10th Revision remains in use in the Republic of Serbia. Following this classification, the group of diseases related to hypertension (I10-I15) was analysed, and the results are presented cumulatively. Table 1 provides the hypertension classification used in this study.
International classification of hypertension according to 10th revision by the WHO used in the research [47,49]
| Code | Diagnosis |
|---|---|
| I10 | Essential (primary) hypertension |
| I11 | Hypertensive heart disease |
| I11.0 | Hypertensive heart disease with (congestive) heart failure |
| I11.9 | Hypertensive heart disease without (congestive) heart failure |
| I12 | Hypertensive renal disease |
| I12.0 | Hypertensive renal disease with renal failure |
| I12.9 | Hypertensive renal disease without renal failure |
| I13 | Hypertensive heart and renal disease |
| I13.0 | Hypertensive heart and renal disease with (congestive) heart failure |
| I13.1 | Hypertensive heart and renal disease with renal failure |
| I13.2 | Hypertensive heart and renal disease with both (congestive) heart failure and renal failure |
| I13.9 | Hypertensive heart and renal disease, unspecified |
| I15 | Secondary hypertension |
| I15.0 | Renovascular hypertension |
| I15.1 | Hypertension secondary to other renal disorders |
| I15.2 | Hypertension secondary to endocrine disorders |
| I15.8 | Other secondary hypertension |
| I15.9 | Secondary hypertension, unspecified |
The study examines the period from 2000 to 2023. Data on admission diagnoses of patients treated for hypertension, based on their place of residence, were used. Data on the number of deaths due to hypertension at ICDV were not included, as the number of deaths was small. Table 2 provides the total number of hypertension cases by diagnosis. The majority of cases were classified as essential (primary) hypertension. Conversely, only one case of hypertensive heart and renal disease with renal failure was recorded, making it the least frequent diagnosis.
The type of admission diagnosis and its frequency [46]
| Diagnosis | Count |
|---|---|
| I10 | 140,975 |
| I11.9 | 5,979 |
| I11 | 602 |
| I11.0 | 151 |
| I13 | 15 |
| I13.0 | 11 |
| I12.0 | 7 |
| I13.9 | 6 |
| I13.2 | 5 |
| I12 | 4 |
| I13.1 | 1 |
| Sum | 147,756 |
This table shows that the total number of recorded hypertension cases in the database is 147,756. However, the analysis included only patients from the AP Vojvodina region who were treated at the specified institute. Consequently, the total number of hypertension cases used for this study was 146,606. Data on patients from outside the AP Vojvodina region were not analysed. Additionally, patients treated at other healthcare institutions within the AP Vojvodina region were excluded from the analysis due to the lack of access to their data. Figure 3 presents the settlements in the AP Vojvodina region by the total number of hypertension cases. Most cases are concentrated near the largest city in the study area, Novi Sad.
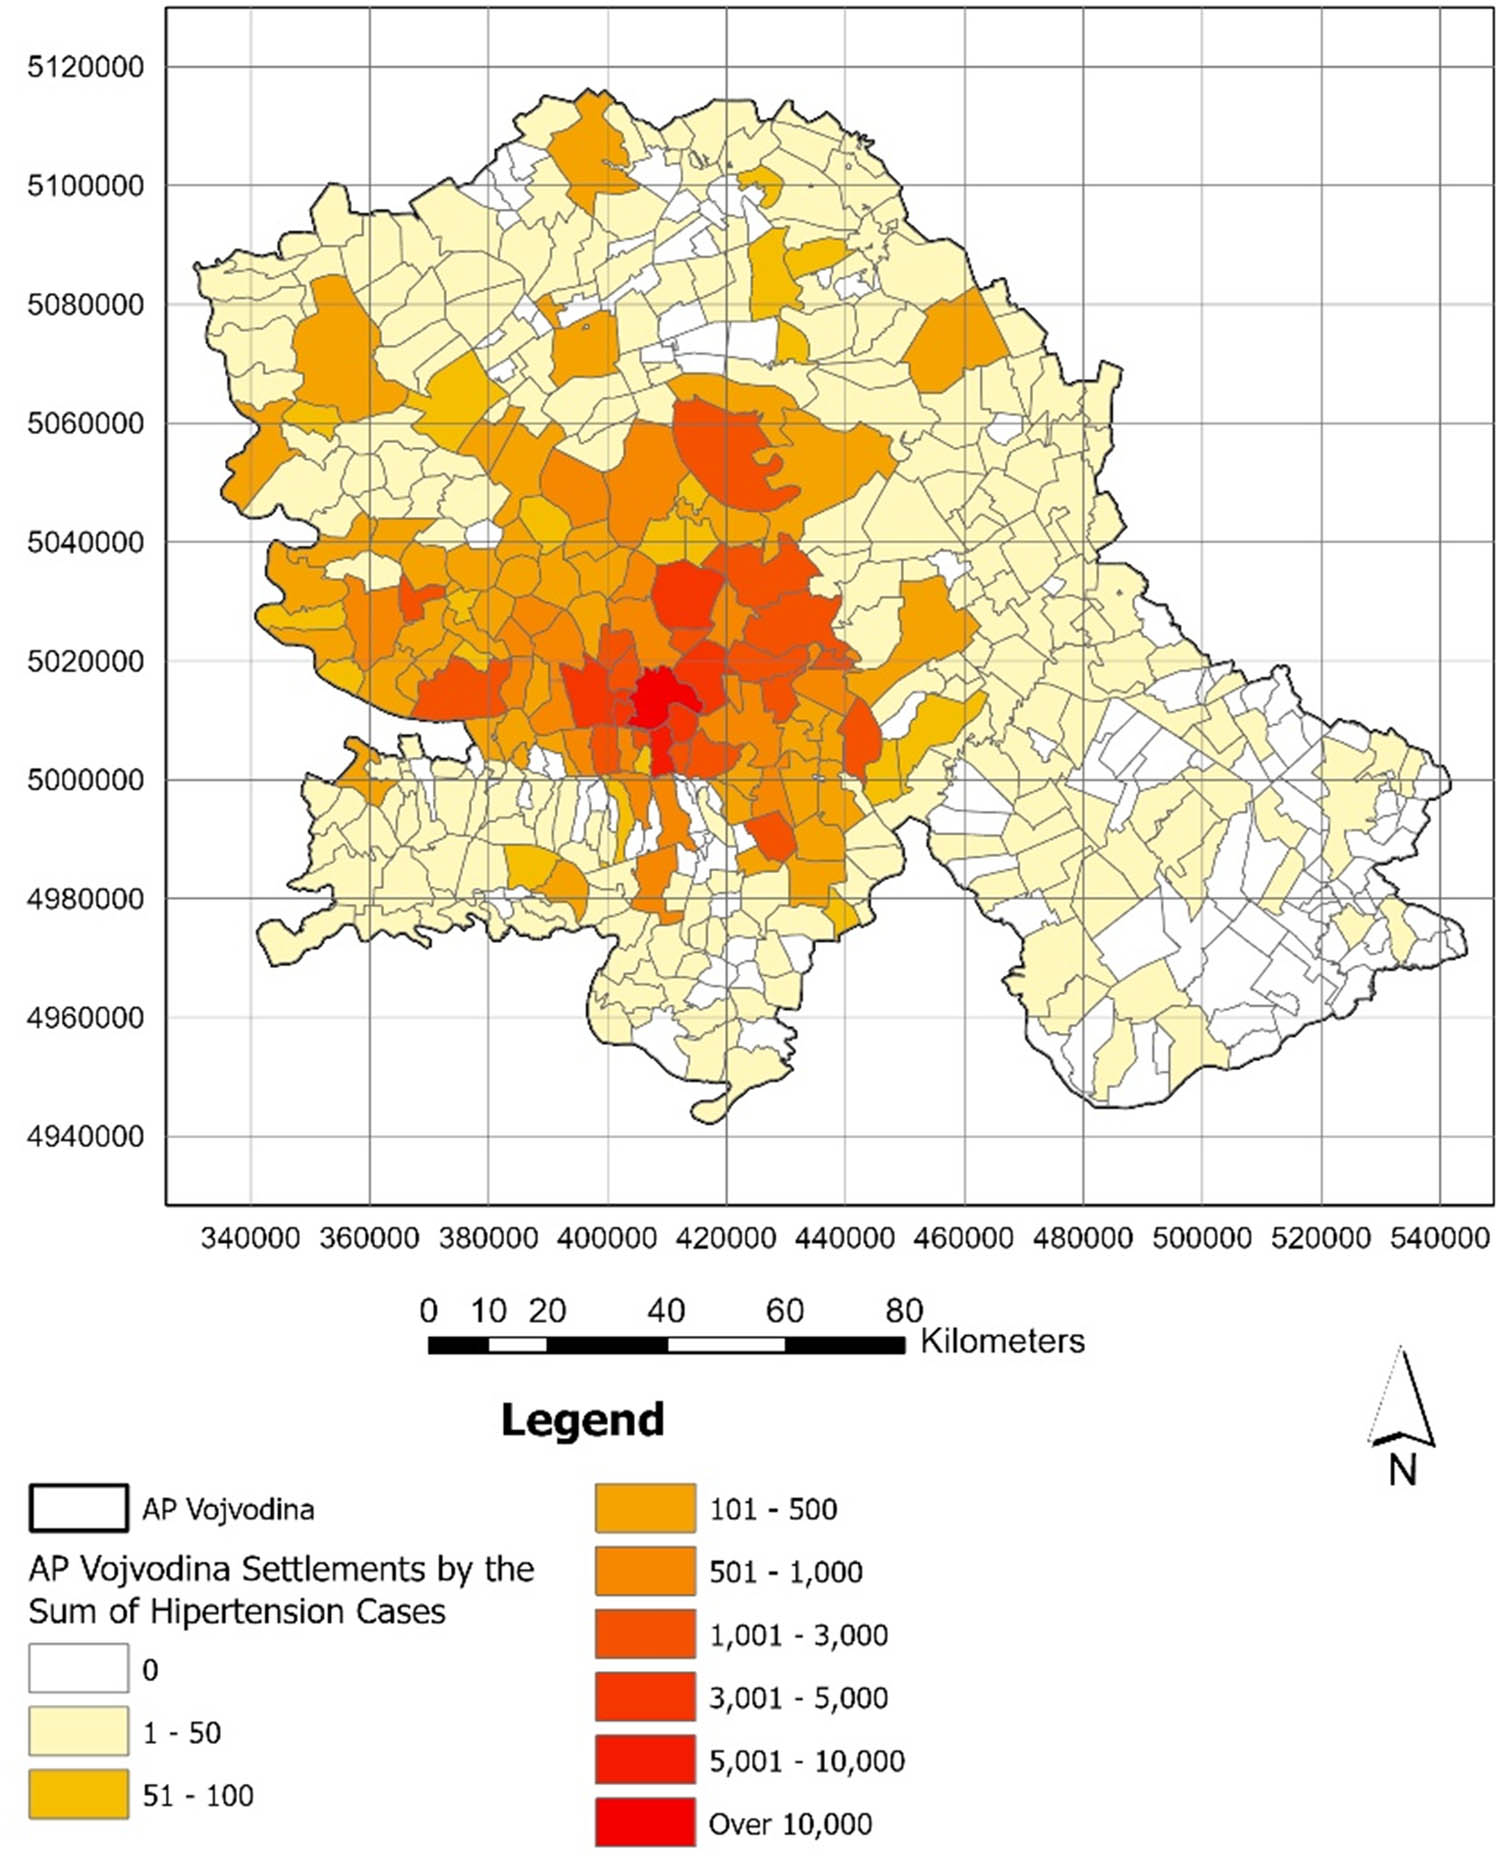
Settlements in the AP Vojvodina by the sum of hypertension cases.
From this figure, it is evident that no hypertension cases were recorded in some settlements. In 136 out of 467 settlements, there were no recorded cases of hypertension. Conversely, hypertension cases were reported in 331 settlements.
From 1995 to 2005, the data are quite limited, as these were the early years of the information system at the ICDV, and data entry was optional during that period [46]. Starting in 2005, data entry became mandatory. If data from the early period of implementing the information system were used, it would create a mistaken insight that some settlements have increased trends or are hot spots. Figure 4 depicts the research framework, outlining the workflow from data acquisition and processing through the use of software for geospatial analysis to the visualization of results.
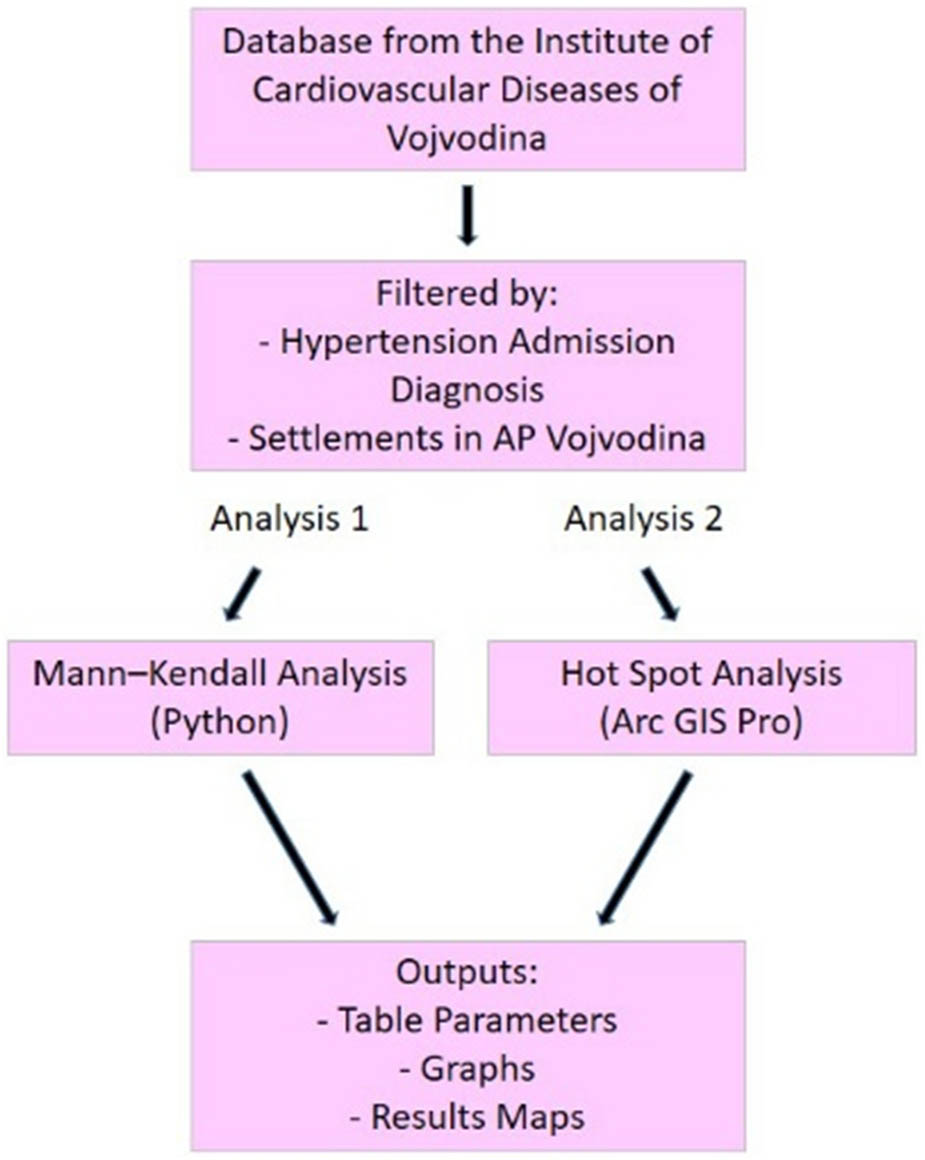
The initial stage of the research process.
These maps with visualised data were used for subsequent analysis to compare the results of the two methods. Clusters from the Emerging Hot Spot Analysis (HSA) and settlement polygons from the Mann-Kendall (MK) analysis were used as inputs in the Kriging procedure to present the results of both analyses in a consistent manner. Figure 5 illustrates the schematic process of this procedure.
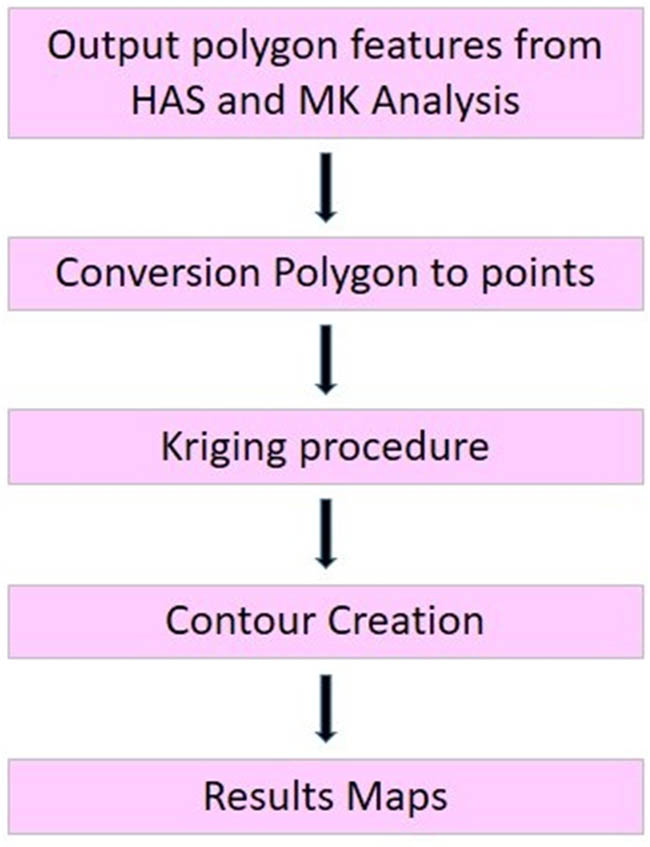
The second stage of the research process.
First, the polygon features from the aforementioned analyses were converted into point features, as the Kriging method in ArcGIS Pro requires point features as input. The next step involved creating a Kriging raster, which was subsequently used to generate contour lines. This approach allowed for a uniform comparison of the two analyses.
3 Methods
3.1 MK analysis
A Mann–Kendall trend analysis of hypertension at the settlement level was conducted using Python. The Mann–Kendall test involves testing two hypotheses: the null hypothesis (H 0) assumes no trend exists in the time series, while the alternative hypothesis (H a) asserts the presence of a significant trend, based on a specified significance level [6,40,50–52]. The probability, p, was calculated to determine the level of confidence in the hypothesis. If the p-value is less than the chosen significance level α (e.g., α = 5%), H 0 is rejected, and H a is accepted, indicating a significant trend [6,40,52]. Conversely, if the p-value exceeds α, H 0 is accepted (or not rejected) [6,40,52].
The Mann–Kendall test is applicable when it is reasonable to assume that the following model applies to the x i values in a time series [6,40,50–52]:
where
The statistic S tends to normality for large n; with mean and variance defined as follows [6,40,50–52]:
where n is the length of the time series, t P is the number of ties for the p value, and q is the number of tied values (i.e., equal values). The second term represents an adjustment for tied or censored data. The standardised test statistic Z is given by [6,40,53,54]:
The presence of a statistically significant trend is evaluated using the Z value. A positive Z indicates an increasing trend in the time series, while a negative Z indicates a decreasing trend [6,40,53]. To test either an increasing or decreasing monotonic trend at the p significance level, the null hypothesis is rejected if the absolute value of Z is greater than Z 1−P/2, where Z 1−P/2 is obtained from the standard normal cumulative distribution tables [6,40,53]. The MK test compares each data point in a time series with all subsequent data points to evaluate the presence of a monotonic trend. It counts the number of times a later value is higher or lower than an earlier one. A predominance of higher values indicates a potential upward trend, whereas a predominance of lower values suggests a downward trend.
3.2 Emerging HSA
The Getis-Ord Gi* statistic, implemented through the Emerging HSA (Space-Time Pattern Mining) tool, was utilised to identify areas classified as “hot spots” and “cold spots” [6,55–57] concerning hypertension. This method categorizes spatial patterns into clusters and outliers, with clusters representing either positive patterns (hot spots) or negative patterns (cold spots) [6]. Outliers, on the other hand, are spatial features with attribute values that significantly differ from those of their surrounding neighbours [6,58]. The space-time analysis conducted in ArcGIS Pro utilised a space-time cube (netCDF cube) as input to identify data trends, including emerging, intensifying, diminishing, and sporadic hot and cold spots [6]. This space-time cube was constructed from predefined locations and organized time-stamped features into a netCDF data structure [6]. The cube generated space-time bins, each representing a defined feature along with its associated spatiotemporal attributes [6]. This hotspot analysis is based on the
where
The
3.3 Kriging procedure
Kriging is a widely used interpolation technique for spatial data [27]. The input data consist of measurements or observations representing a spatially continuous process, collected at sample points across the study area [27]. The output is either a continuous surface or a densely distributed network of predicted values at specific locations within the study area [27]. The estimation of this continuous surface relies on the variogram and the spatial distribution of measured values [27]. Kriging estimators are considered optimal as they are statistically unbiased and minimise the prediction mean square error, which quantifies uncertainty or variability in the predicted values [27].
The weights for each interpolated point are computed based on the spatial structure of the interpolated location in relation to all sampled points [62]. These weights are derived from the variogram, which reflects the spatial characteristics of the data, and are applied to the sampled points using the following formula [62]:
where the value of the predicted point (z-hat, at location x-nought) is equal to the sum of the value of each sampled point (x, at location i) times that point’s unique weight (lambda, for location i) [62].
Low values in the optional output variance of the prediction raster indicate a high level of confidence in the predicted values, whereas high values may suggest the need for additional data points [62]. In this study, the ordinary Kriging method was used, with a spherical model applied for the semi-variogram model.
4 Results
4.1 Results of MK analysis
Table 3 reveals increasing trends in hypertension in 36 settlements. Only four settlements recorded decreasing trends in hypertension cases. Overall, in 40 of 467 settlements significant trend was detected. In 296 settlements, the MK analysis was not conducted either due to the absence of recorded hypertension cases or insufficient parameters. Only settlements with a recorded period of at least 10 years were included in the analysis. If hypertension cases were recorded in a settlement for a shorter period, that settlement was excluded from the analysis. This is because the MK analysis yields reliable results only for periods of 10 years or longer. For shorter timeframes, the test may lack statistical significance. Given that 136 settlements had no recorded hypertension cases, this means that in 160 settlements, some cases were recorded, but not in a sufficient number to be included in the MK analysis. Due to the large number of 131 settlements where some MK parameters were available but no significant trend was detected, the parameters for these settlements are not presented in this study.
Parameters of the MK test for the hypertension at the significance level of 0.05 in the study area (p – p-value of the significance test, Z – standardised test statistics, s – so-called Sen’s slope, B – intercept)
| Settlement | Trend | P | Z | s | B |
|---|---|---|---|---|---|
| Bačka Palanka | Increasing | 0.02 | 2.28 | 6.43 | 103.14 |
| Bački Brestovac | Increasing | 0.03 | 2.22 | 0.18 | −0.64 |
| Bački Gračac | Increasing | 0.01 | 2.51 | 0.14 | −0.21 |
| Begeč | Increasing | 0.01 | 2.53 | 1 | 24 |
| Budisava | Increasing | 0.02 | 2.39 | 1 | 38 |
| Bukovac | Increasing | 4.07 × 10⁻⁴ | 3.54 | 3.50 | 45.50 |
| Čelarevo | Increasing | 1.60 × 10⁻³ | 3.16 | 1.55 | 16.09 |
| Ečka | Increasing | 0.02 | 2.32 | 0.14 | −0.07 |
| Futog | Increasing | 2.69 × 10⁻⁵ | 4.20 | 12.33 | 149 |
| Gajdobra | Increasing | 7.41 × 10⁻⁴ | 3.37 | 1 | 9 |
| Jarak | Increasing | 0.02 | 2.32 | 0.11 | 0.17 |
| Karavukovo | Increasing | 2.60 × 10⁻³ | 3.01 | 0.43 | 0.14 |
| Kikinda | Increasing | 2.74 × 10⁻³ | 3 | 0.50 | 2.50 |
| Krčedin | Decreasing | 0.04 | −2.04 | −0.60 | 27.40 |
| Kumane | Decreasing | 0.02 | −2.40 | −0.25 | 3.63 |
| Ledinci | Increasing | 0.02 | 2.24 | 1.55 | 48.09 |
| Ljuba | Decreasing | 3.11 × 10⁻³ | −2.96 | −0.14 | 2.07 |
| Manđelos | Increasing | 0.02 | 2.41 | 0.20 | 0.40 |
| Mileševo | Increasing | 0.04 | 2.02 | 0.12 | 0.94 |
| Mladenovo | Increasing | 0.02 | 2.40 | 0.50 | 6.50 |
| Neštin | Increasing | 0.03 | 2.21 | 0.45 | 4.91 |
| Novi Bečej | Increasing | 6.83 × 10⁻⁴ | 3.40 | 0.50 | 2.50 |
| Novi Kneževac | Increasing | 0.01 | 2.60 | 0.33 | −1.50 |
| Novi Sad | Increasing | 1.68 × 10⁻³ | 3.14 | 110 | 2,379 |
| Odžaci | Increasing | 2.22 × 10⁻³ | 3.06 | 0.71 | 5.65 |
| Petrovaradin | Increasing | 9.61 × 10⁻⁷ | 4.90 | 11.67 | 68.33 |
| Platičevo | Increasing | 0.01 | 2.43 | 0.15 | 0.69 |
| Prigrevica | Increasing | 3.07 × 10⁻³ | 2.96 | 0.18 | 1.45 |
| Ratkovo | Decreasing | 0.02 | −2.30 | −0.33 | 9 |
| Ravno Selo | Increasing | 3.62 × 10⁻³ | 2.91 | 0.65 | 6.18 |
| Ruma | Increasing | 0.05 | 2 | 1.21 | 33.07 |
| Rumenka | Increasing | 4.51 × 10⁻³ | 2.84 | 3.17 | 65.50 |
| Senta | Increasing | 0.05 | 1.99 | 0.29 | 2.07 |
| Sombor | Increasing | 0.05 | 1.96 | 0.63 | 9.38 |
| Sremska Mitrovica | Increasing | 0.01 | 2.46 | 1.33 | 14 |
| Srpski Miletić | Increasing | 0.01 | 2.48 | 0.10 | 0.10 |
| Stari Ledinci | Increasing | 4.07 × 10⁻⁴ | 3.54 | 0.67 | −1.33 |
| Titel | Increasing | 0.01 | 2.46 | 2.17 | 58.50 |
| Tovariševo | Increasing | 1.57 × 10⁻³ | 3.16 | 1.07 | 6.36 |
| Veternik | Increasing | 1.36 × 10⁻⁴ | 3.82 | 9 | 113 |
In most settlements with an increasing trend in hypertension cases, the MK analysis recorded in South Bačka county. In 19 settlement, an increasing trend was detected – Bačka Palanka (p = 0.02, Z = 2.28), Begeč (p = 0.01, Z = 2.53), Budisava (p = 0.02, Z = 2.39), Bukovac (p = 4.07 × 10⁻⁴, Z = 3.54), Čelarevo (p = 1.60 × 10⁻³, Z = 3.16), Futog (p = 2,69 × 10⁻⁵, Z = 4.20), Gajdobra (p = 7,41 × 10⁻⁴, Z = 3.37), Ledinci (p = 0.02, Z = 2.24), and Mileševo (p = 0.04, Z = 2.02). Figure 6 shows the graph of the MK analysis for these settlements.
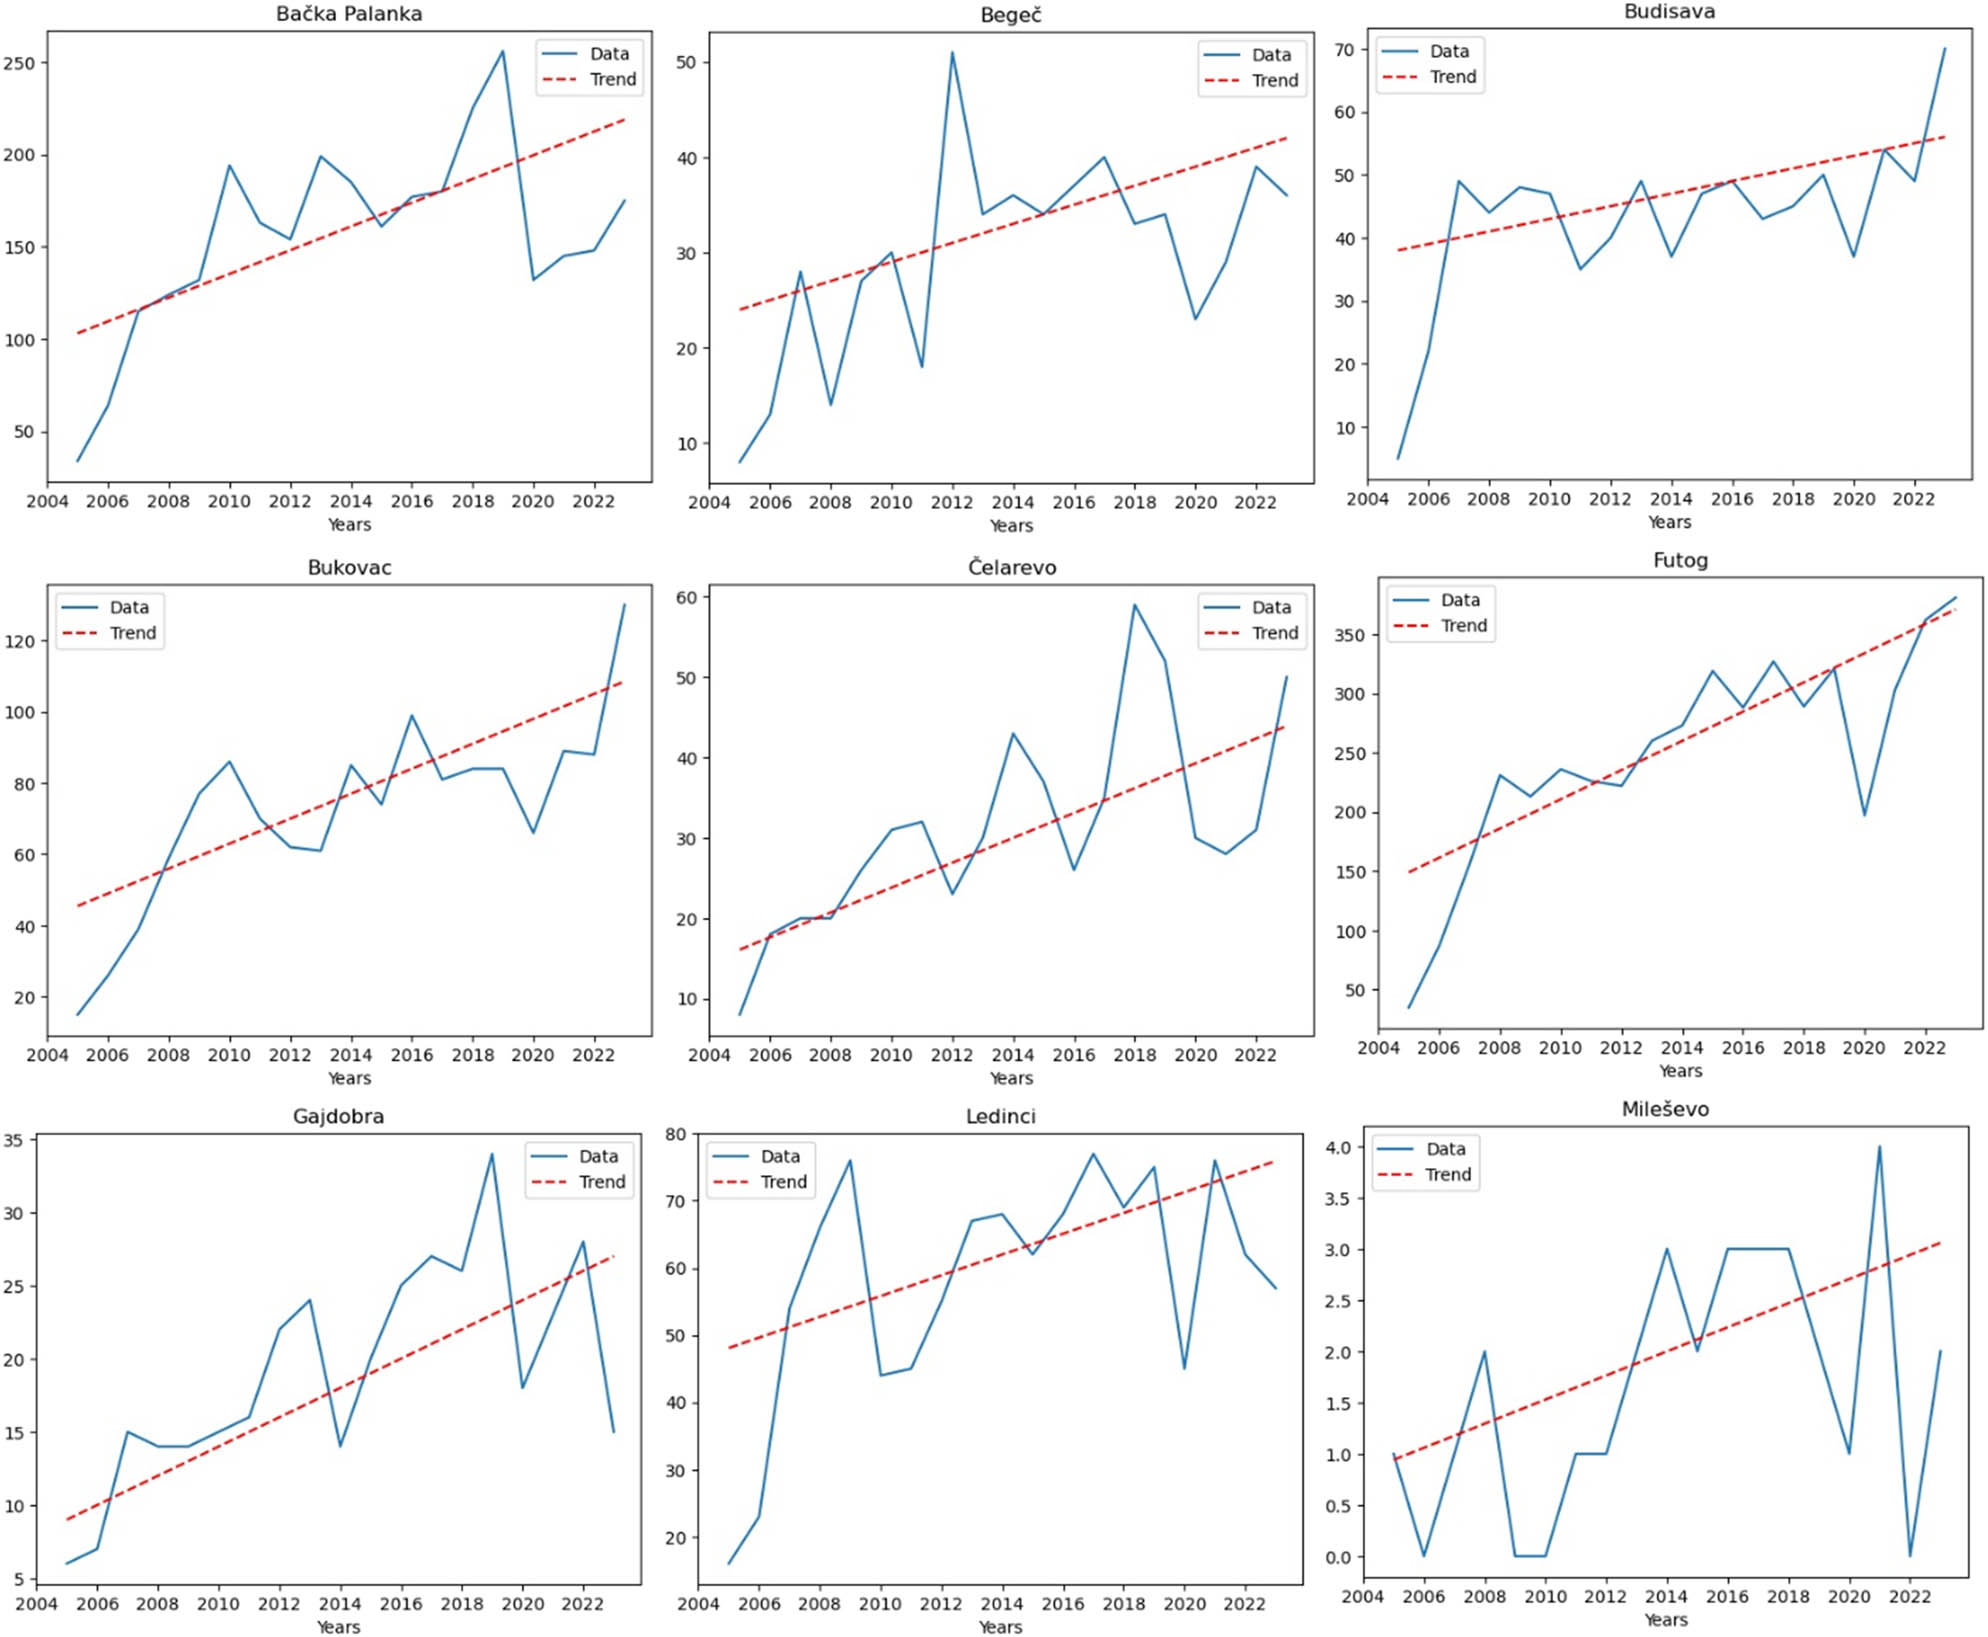
MK analysis for: Bačka Palanka, Begeč, Budisava, Bukovac, Čelarevo, Futog, Gajdobra, Ledinci, and Mileševo (South Bačka county).
Also, in the same county, this analysis recorded an increasing trend in hypertension cases in Mladenovo (p = 0.02, Z = 2.40), Neštin (p = 0.03, Z = 2.21), Novi Sad (p = 1.68 × 10⁻³, Z = 3.14), Petrovaradin (p = 9.61 × 10⁻⁷, Z = 4.90), Ravno Selo (p = 3.62 × 10⁻³, Z = 2.91), Rumenka (p = 4.51 × 10⁻³, Z = 2.84), Stari Ledinci (p = 0.01, Z = 3.54), Titel (p = 0.01, Z = 2.46), Tovariševo (p = 1.57 × 10⁻³, Z = 3.16), and Veternik (p = 1.36 × 10⁻⁴, Z = 3.82). Figure 7 shows the graph of the MK analysis for these settlements.
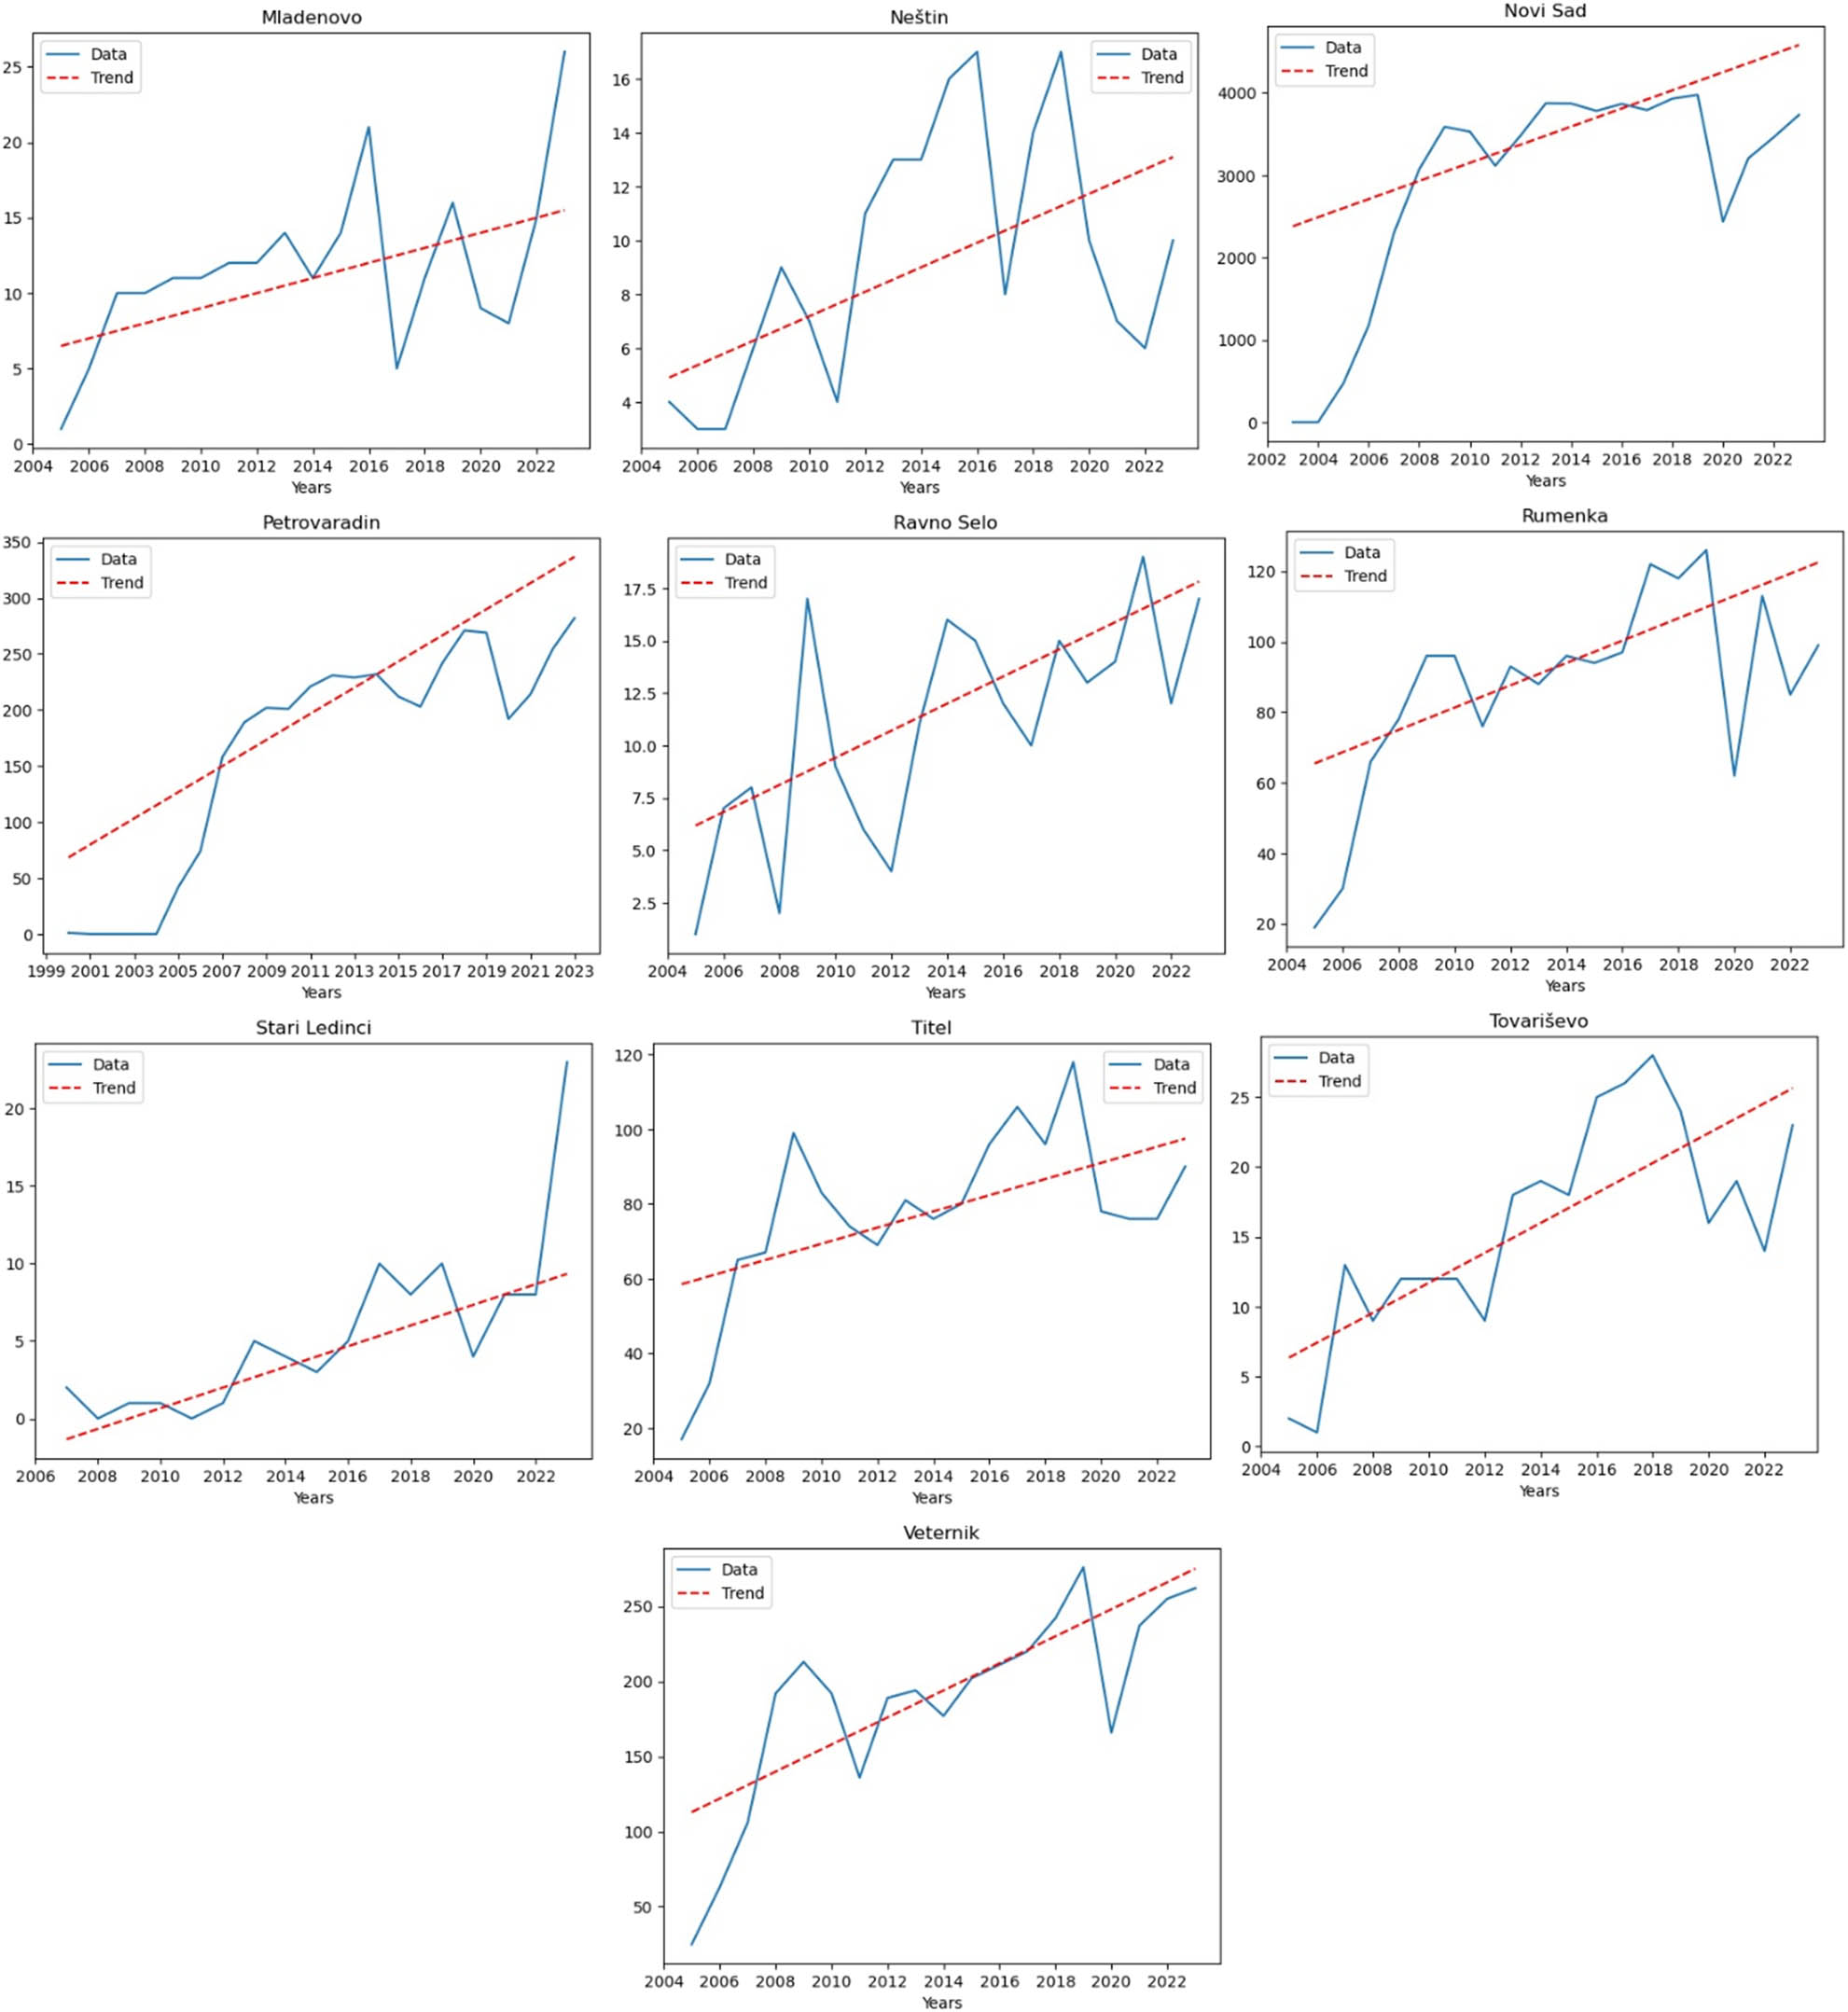
MK analysis for: Mladenovo, Neštin, Novi Sad, Petrovaradin, Ravno Selo, Rumenka, Stari Ledinci, Titel, Tovariševo, and Veternik (South Bačka county).
In West Bačka County, seven settlements recorded an increasing trend in hypertension cases – Bački Brestovac (p = 0.03, Z = 2.22), Bački Gračac (p = 0.01, Z = 2.51), Karavukovo (p = 2.60 × 10⁻³, Z = 3.01), Odžaci (p = 2.22 × 10⁻³, Z = 3.06), Prigrevica (p = 3.07 × 10⁻³, Z = 2.96), Sombor (p = 0.05, Z = 1.96), and Srpski Miletić (p = 0.01, Z = 2.48). Figure 8 shows the graph of the MK analysis for these settlements.
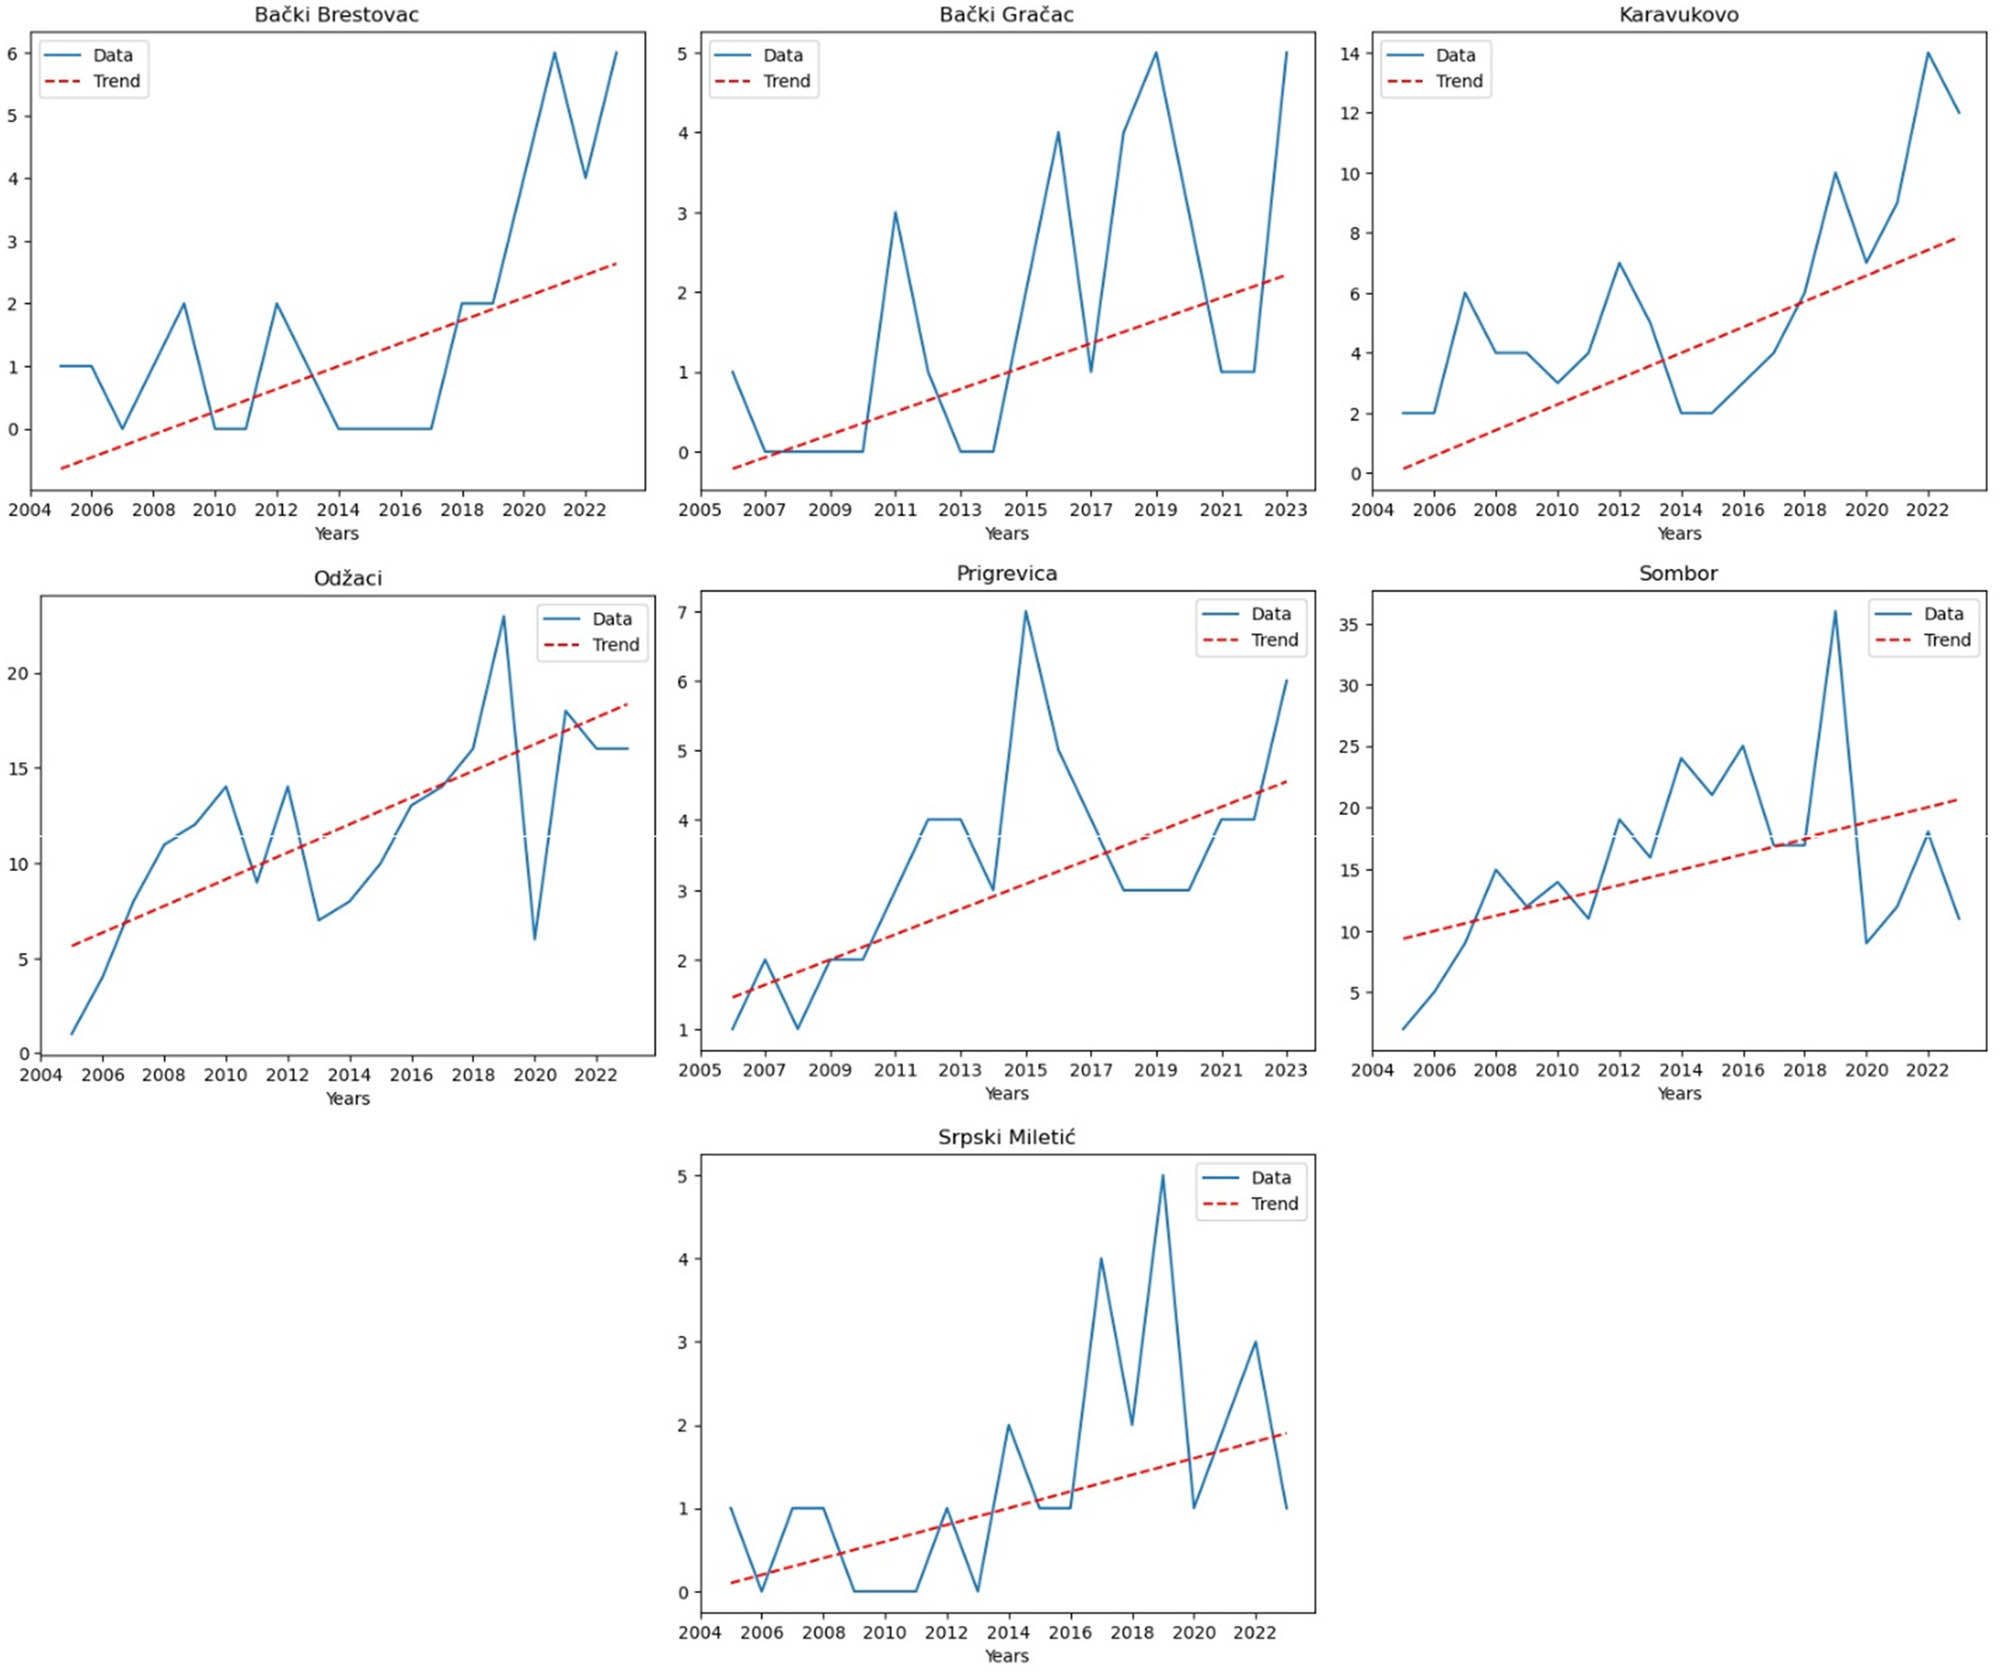
MK analysis for: Bački Brestovac, Bački Gračac, Karavukovo, Odžaci, Prigrevica, Sombor, and Srpski Miletić (West Bačka County).
This analysis recorded an increasing trend in five settlements – Jarak (p = 0.02, Z = 2.32), Manđelos (p = 0.02, Z = 2.41), Platičevo (p = 0.01, Z = 2.43), Ruma (p = 0.05, Z = 2), and Sremska Mitrovica (p = 0.01, Z = 2.46). Figure 9 shows a graph for these settlements.
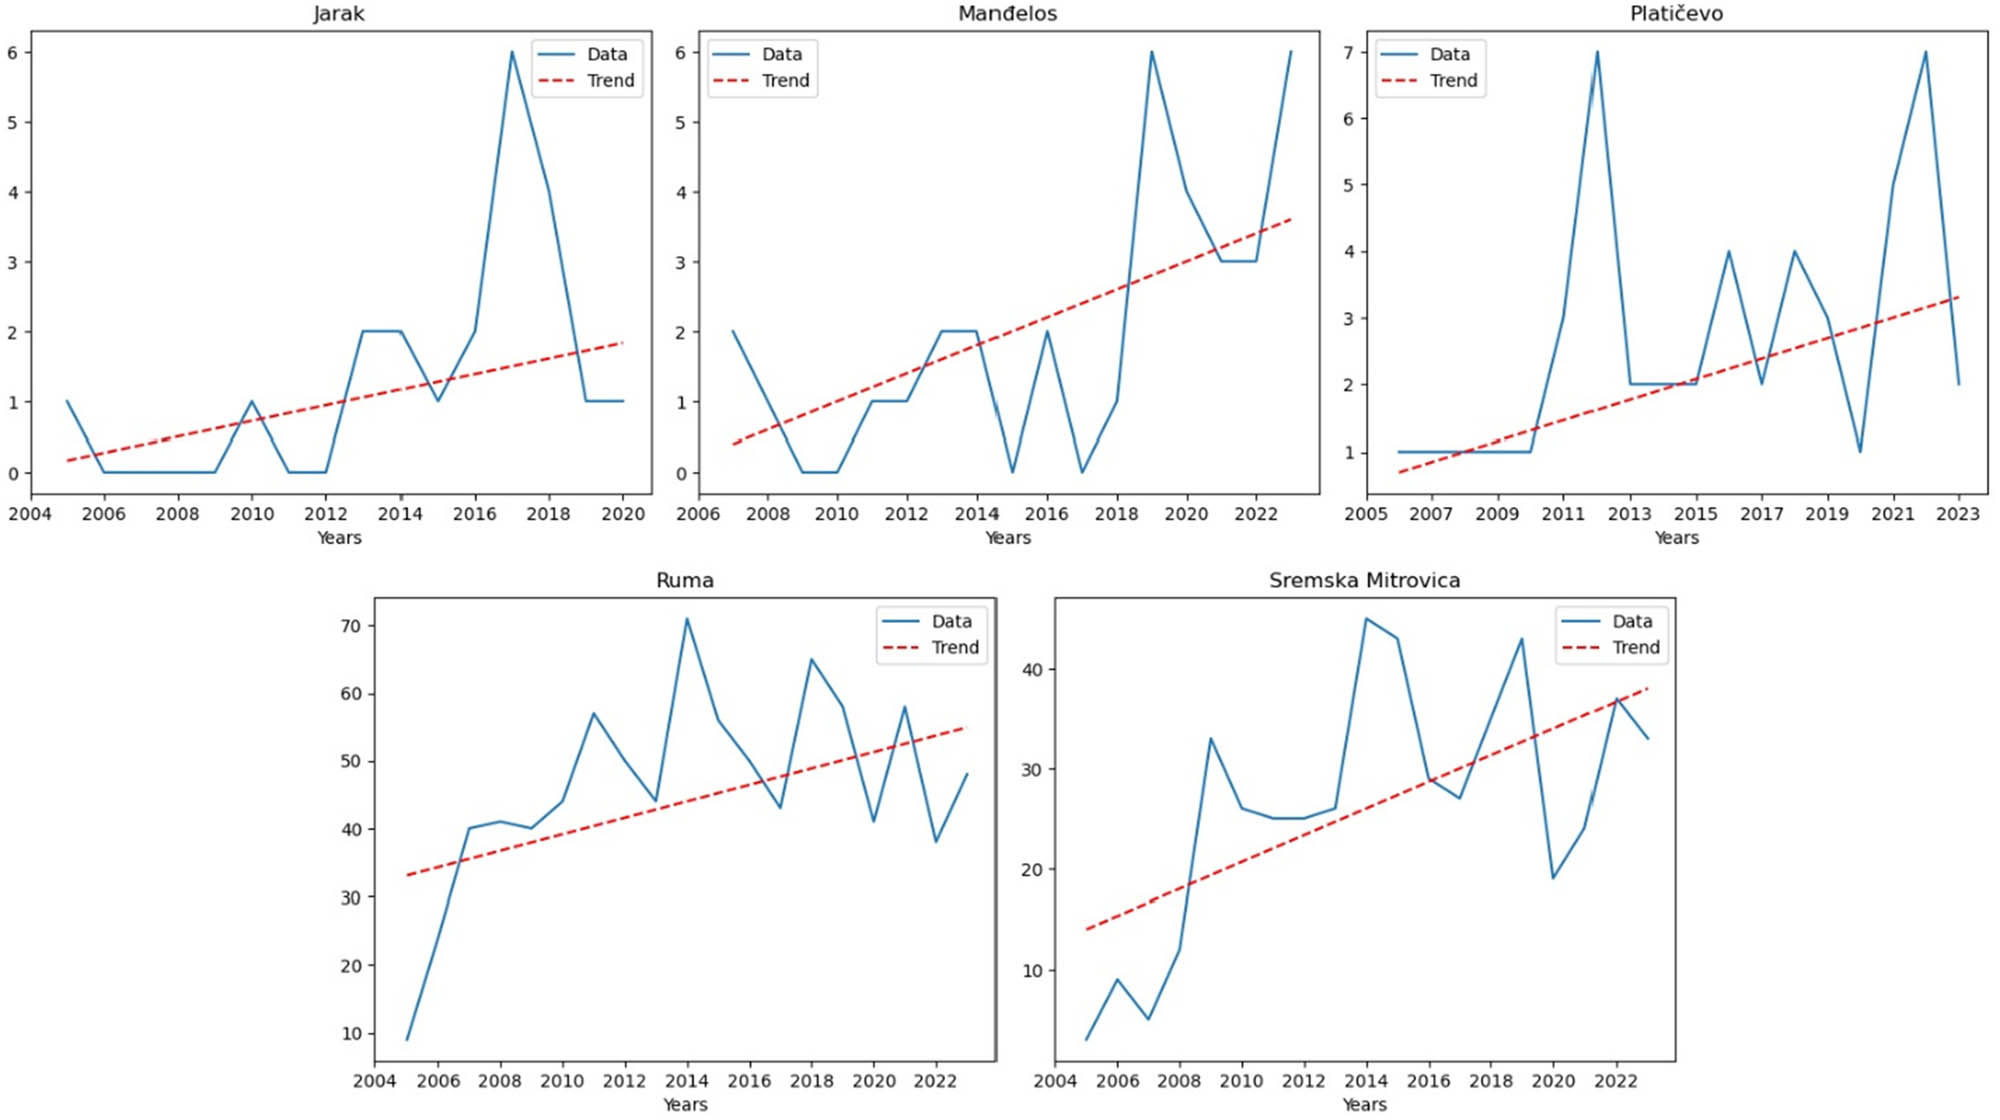
MK analysis for: Jarak, Manđelos, Platičevo, Ruma, and Sremska Mitrovica (Srem County).
In three settlements in North Banat county, the MK analysis recorded an increasing trend in hypertension cases – Kikinda (p = 2.74 × 10⁻³, Z = 3), Novi Kneževac (p = 0.01, Z = 2.60), and Senta (p = 0.05, Z = 1.99). Figure 10 presents a graph for these settlements. No settlements with an increasing trend were recorded in North Bačka and South Banat counties.
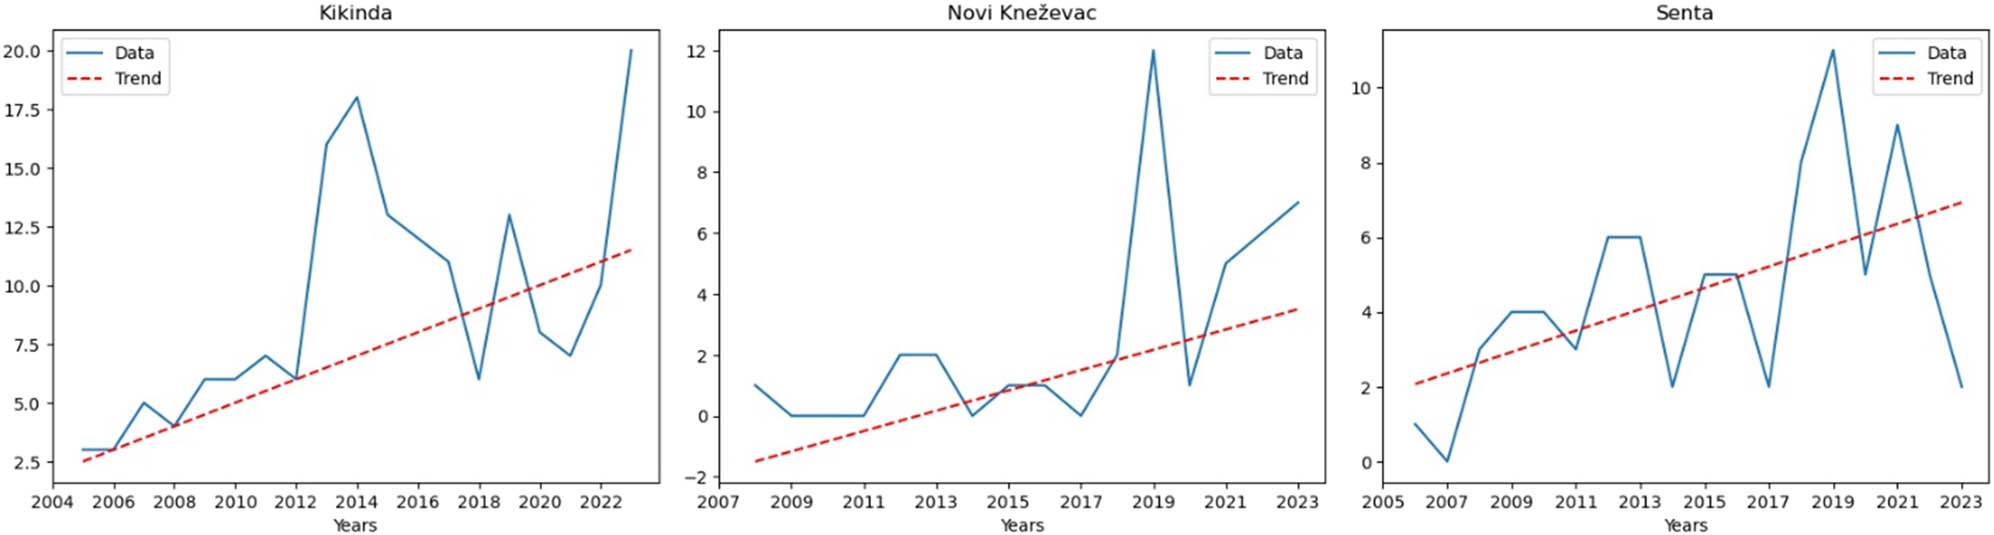
MK analysis for: Kikinda, Novi Kneževac, and Senta (North Banat County).
Figure 11 presents two settlements in Middle Banat county with a recorded increasing trend in hypertension cases – Ečka (p = 0.02, Z = 2.32) and Novi Bečej (p = 6.83 × 10⁻⁴, Z = 3.40).
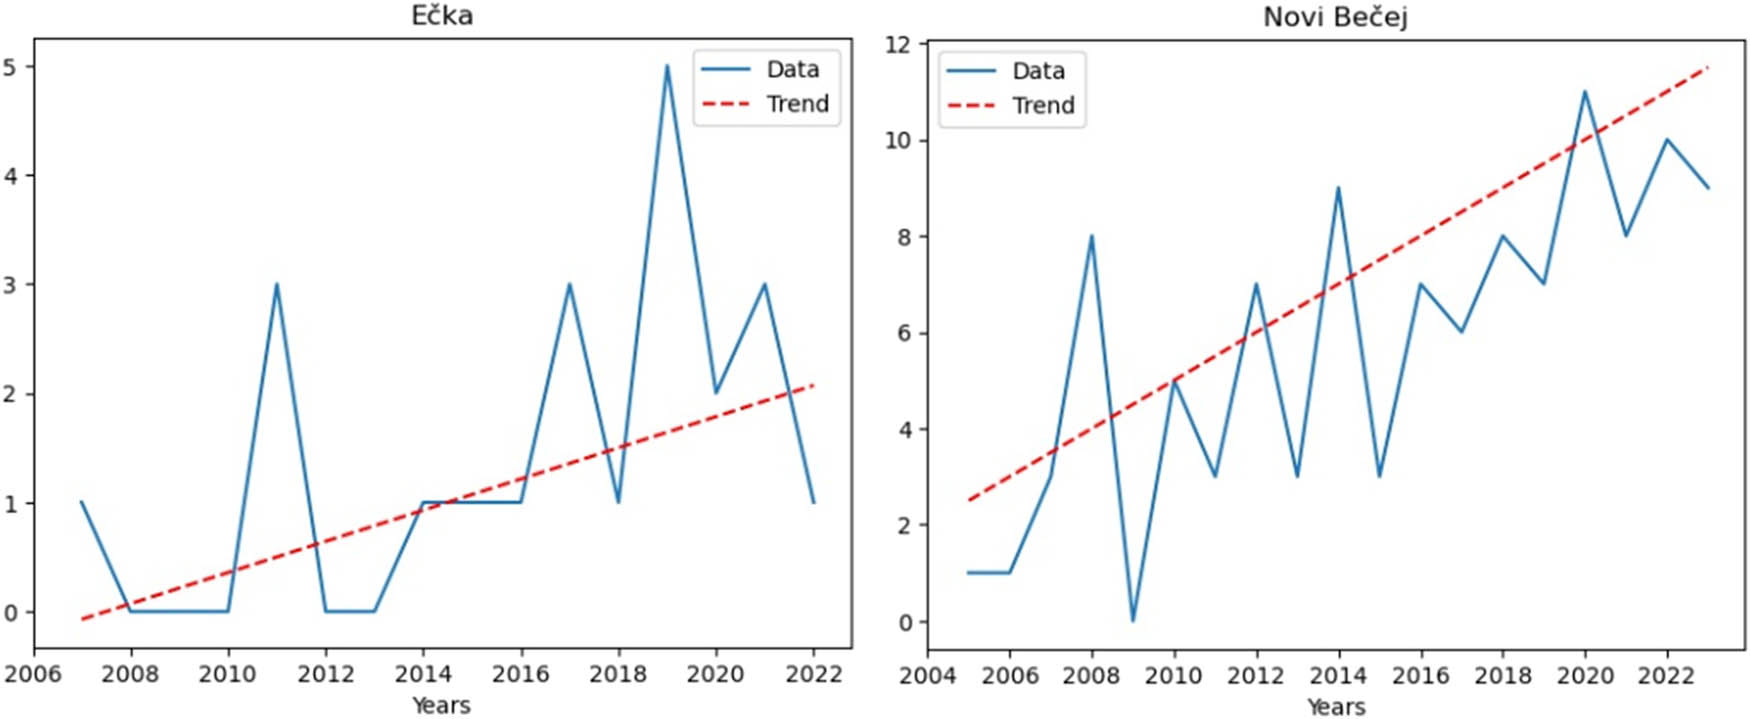
MK analysis for: Ečka and Novi Bečej.
Conversely, in only four counties in the study area, the MK analysis showed a decreasing trend in hypertension cases. Those settlements are as follows: Krčedin (p = 0.04, Z = −2.04), Kumane (p = 0.02, Z = −2.40), Ljuba (p = 3.11 × 10⁻³, Z = −2.96), and Ratkovo (p = 0.02, Z = −2.30). Figure 12 presents the MK analysis for these settlements.
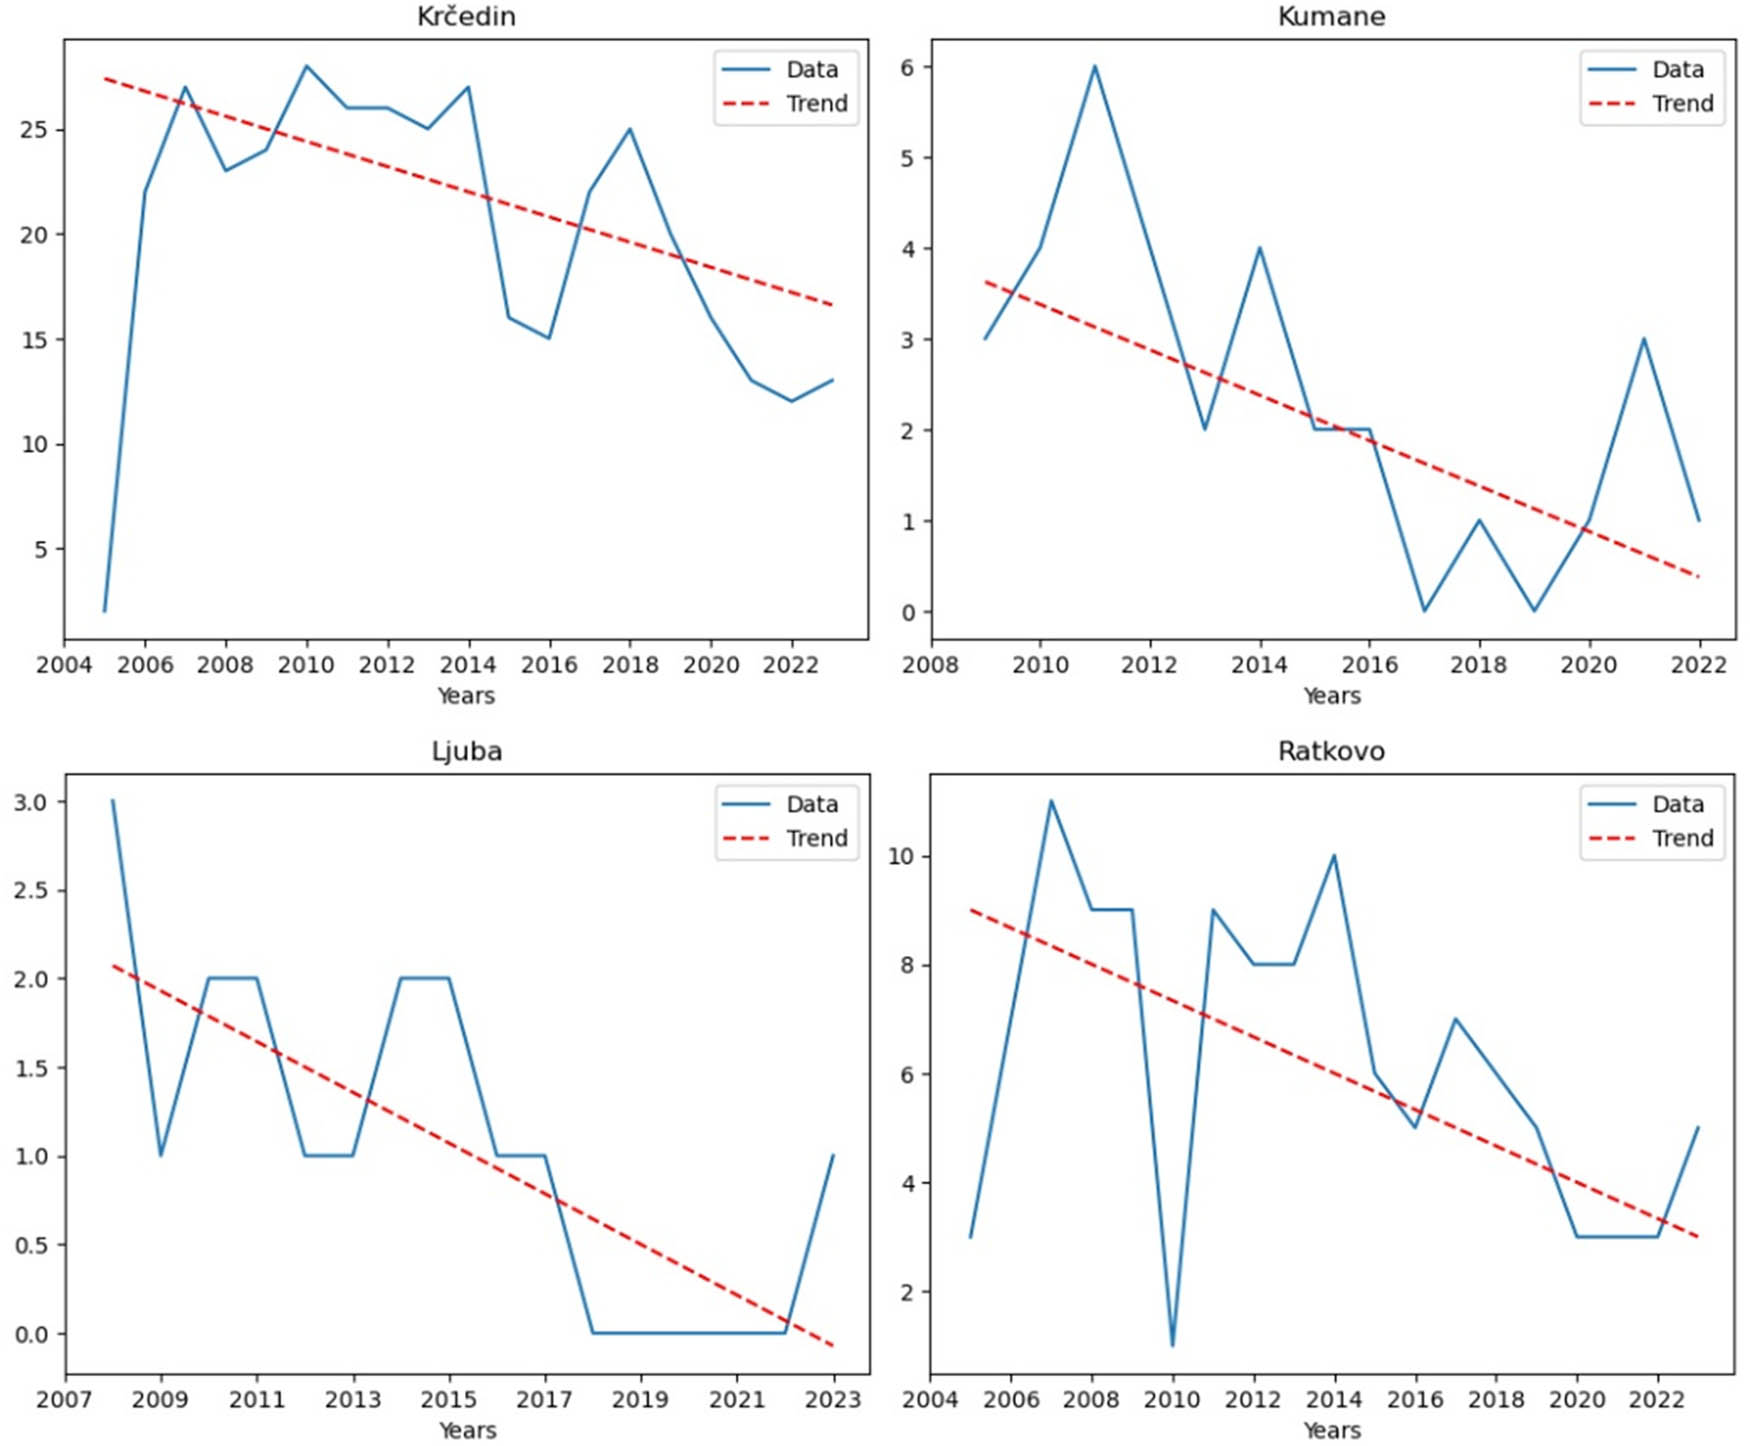
MK analysis for: Krčedin, Kumane, Ljuba, and Ratkovo.
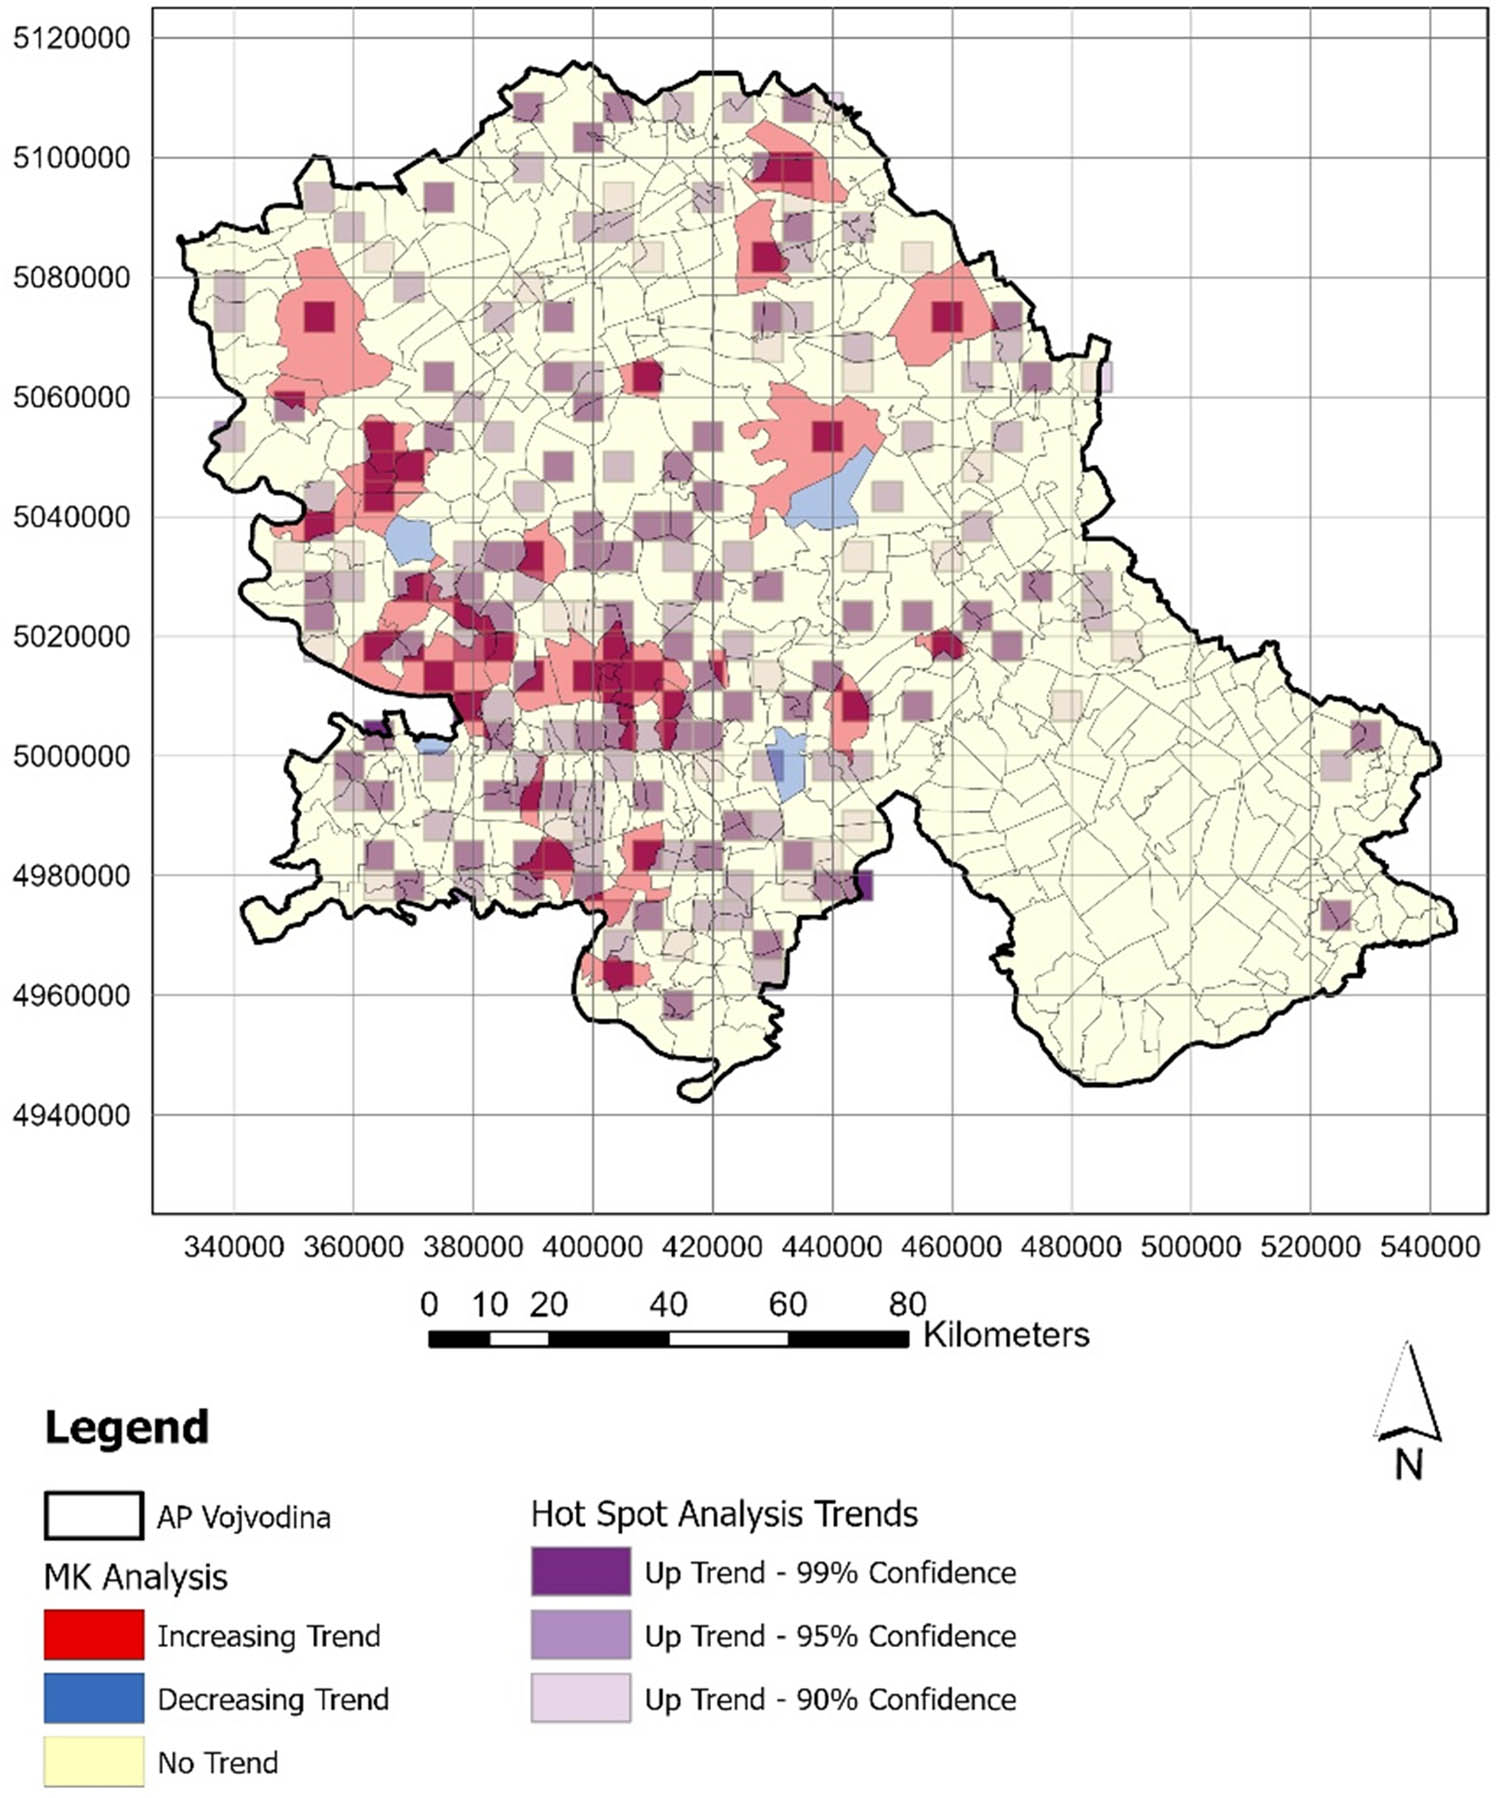
In contrast, the remaining 427 settlements did not exhibit any notable trends. Figure 13 shows the MK map of trends at the settlement level within the territory of AP Vojvodina. The map highlights settlements with increasing trends, decreasing trends, and those with no observable trends.
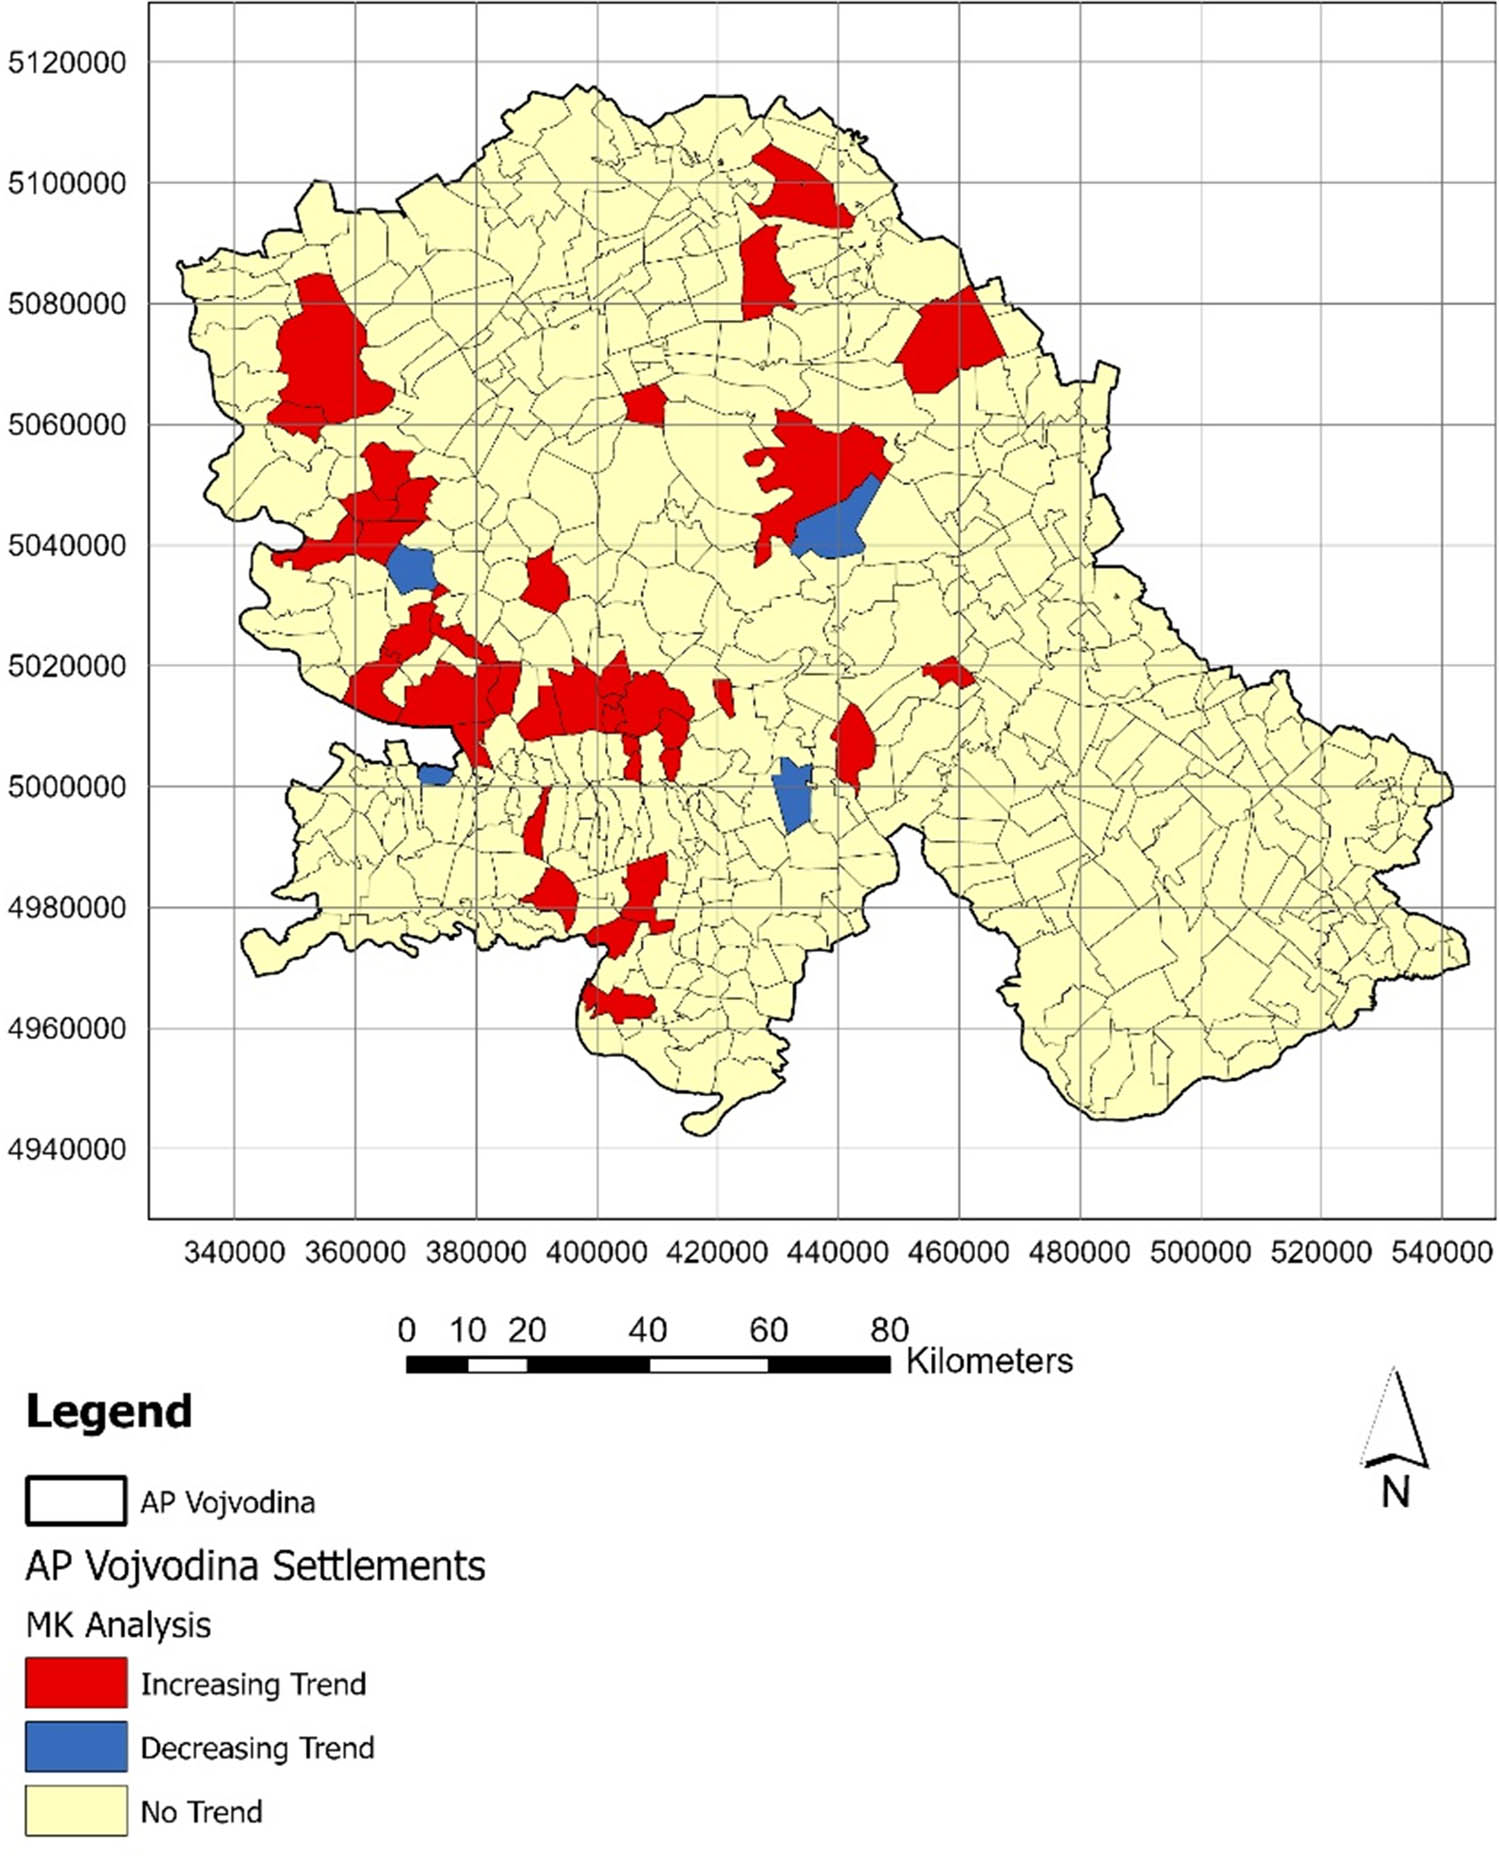
Map of MK analysis at the settlement level in AP Vojvodina.
4.2 Results of Emerging HSA
The Emerging HSA for hypertension is presented using the aforementioned parameters in Table 4. The graphical representation of this analysis is shown in Figure 14.
Parameters of the HSA for hypertension in the study area (Z – z-score, p – p-value)
| Settlement | Pattern | Z | p |
|---|---|---|---|
| Kisač | Consecutive Hot Spot | 4.37 | 1.26 × 10⁻⁵ |
| Čenej | Consecutive Hot Spot | 4.17 | 3.07 × 10⁻⁵ |
| Bački Jarak | Consecutive Hot Spot | 4.12 | 3.81 × 10⁻⁵ |
| Rumenka | Consecutive Hot Spot | 4.14 | 3.40 × 10⁻⁵ |
| Kać | Consecutive Hot Spot | 4.14 | 3.40 × 10⁻⁵ |
| Đurđevo | Consecutive Hot Spot | 3.97 | 7.19 × 10⁻⁵ |
| Futog | Consecutive Hot Spot | 4.19 | 2.73 × 10⁻⁵ |
| Veternik | Consecutive Hot Spot | 4.19 | 2.73 × 10⁻⁵ |
| Novi Sad | Consecutive Hot Spot | 4.19 | 2.73 × 10⁻⁵ |
| Budisava | Consecutive Hot Spot | 3.95 | 7.94 × 10⁻⁵ |
| Ledinci | Consecutive Hot Spot | 4.14 | 3.40 × 10⁻⁵ |
| Petrovaradin | Consecutive Hot Spot | 4.10 | 4.22 × 10⁻⁵ |
| Kovilj | Consecutive Hot Spot | 3.90 | 9.75 × 10⁻⁵ |
| Beočin | Consecutive Hot Spot | 4.24 | 2.19 × 10⁻⁵ |
| Rakovac, Stari Ledinci | Consecutive Hot Spot | 4.14 | 3.40 × 10⁻⁵ |
| Sremska Kamenica | Consecutive Hot Spot | 4.14 | 3.40 × 10⁻⁵ |
| Bukovac | Consecutive Hot Spot | 3.90 | 9.75 × 10⁻⁵ |
| Sremski Karlovci | Consecutive Hot Spot | 3.95 | 7.94 × 10⁻⁵ |
| Vrdnik | Consecutive Hot Spot | 4.19 | 2.73 × 10⁻⁵ |
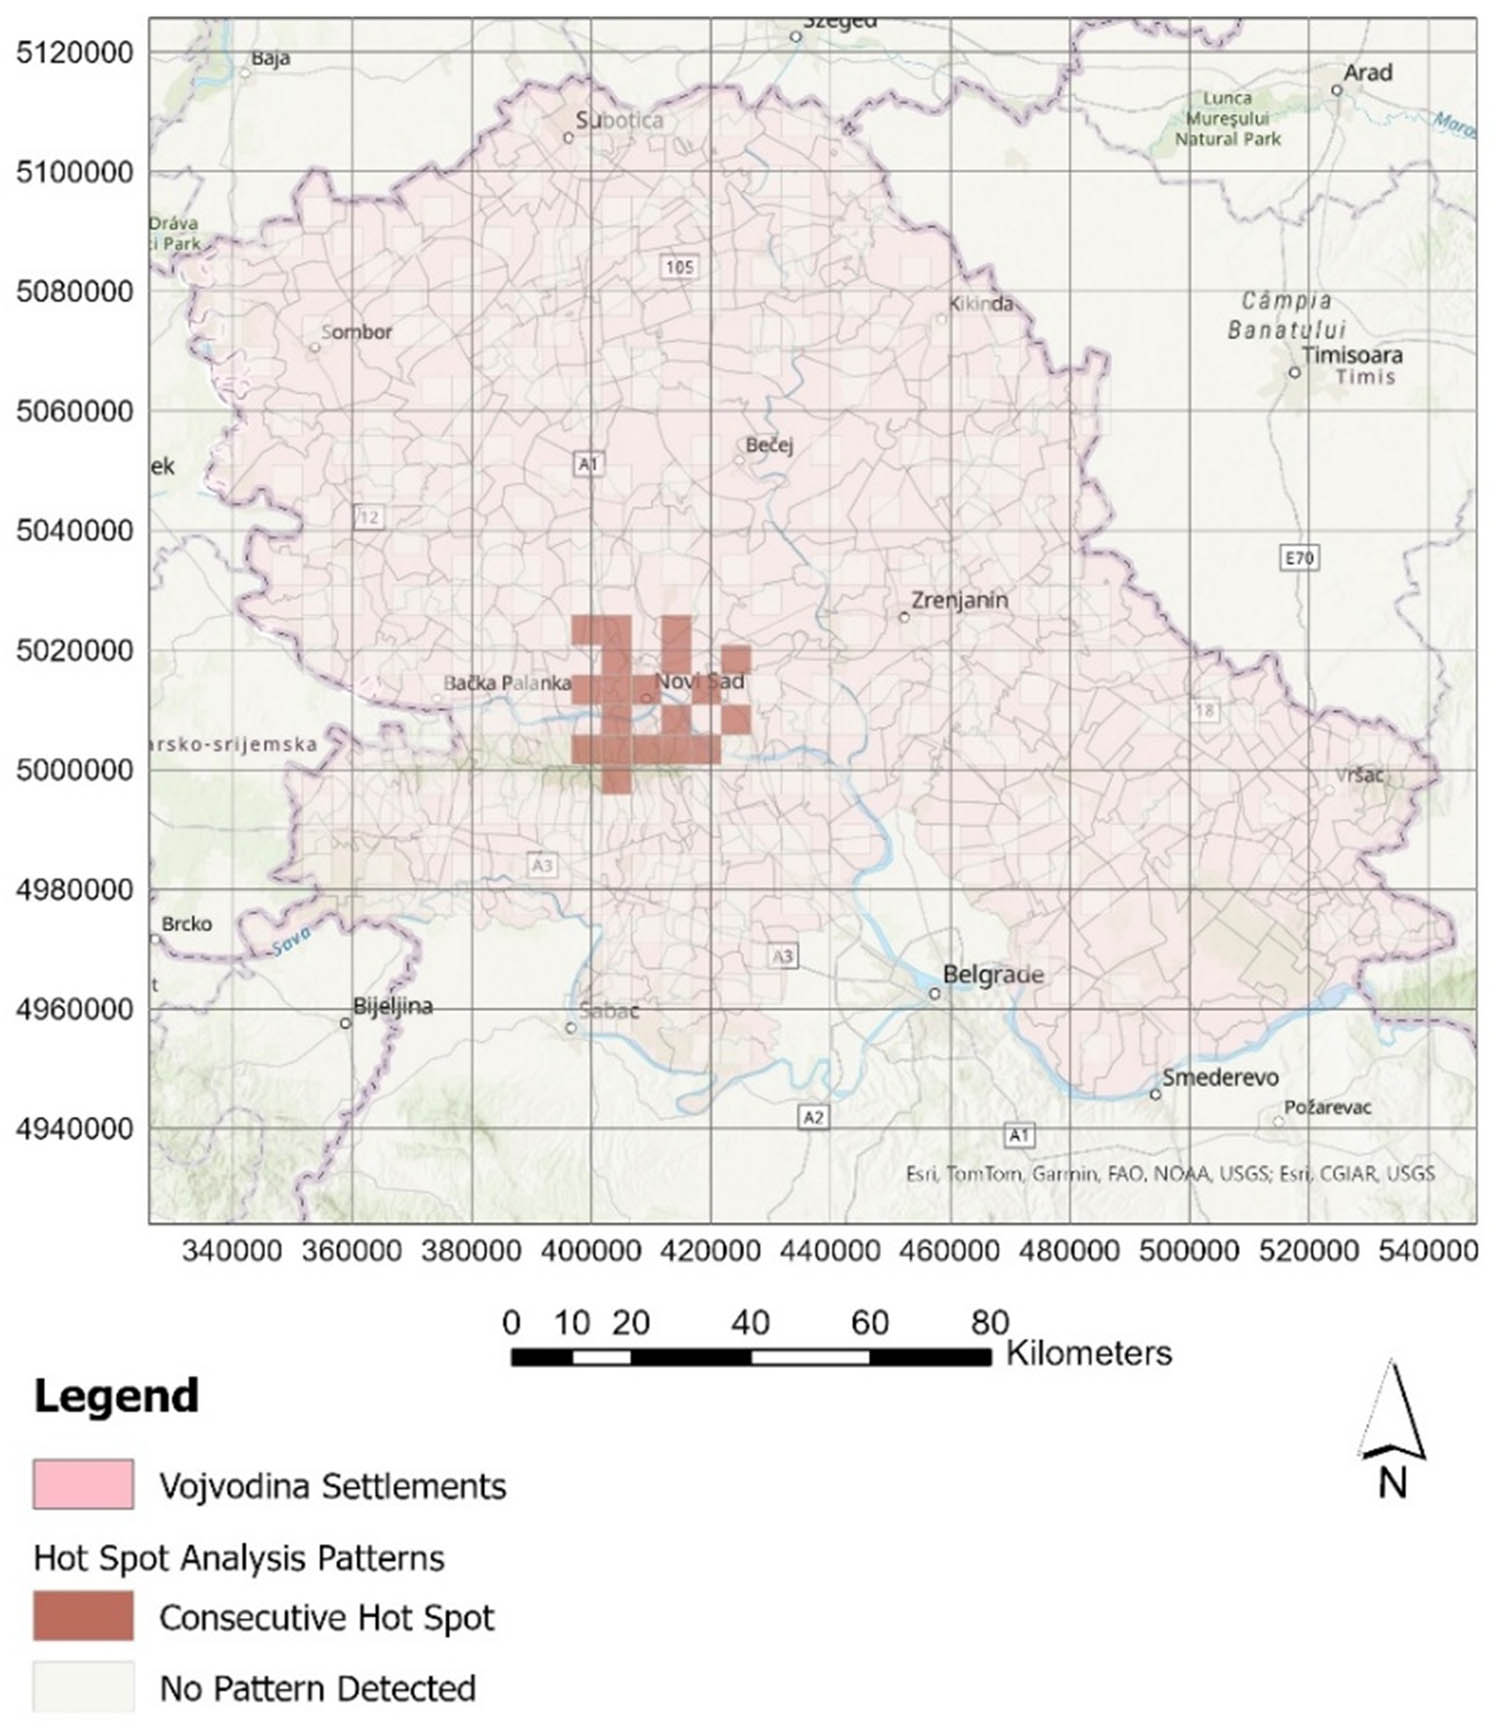
Map of Emerging HSA.
The Emerging HSA detected 19 clusters – Kisač, Čenej, Bački Jarak, Rumenka, Kać, Đurđevo, Futog, Veternik, Novi Sad, Budisava, Ledinci, Petrovaradin, Kovilj, Beočin, Rakovac, Stari Ledinci, Sremska Kamenica, Bukovac, Sremski Karlovac, and Vrdnik – that were classified as “Consecutive Hot Spots” among 316 analysed clusters. All the detected settlements in this category are located within the territory of the South Bačka county. No discernible patterns were observed in the remaining clusters.
4.3 The results of Kriging procedures
As previously mentioned, this procedure required converting polygon features into points before applying the Kriging method. The resulting raster was then used to generate contour lines. In Figure 15a, points with graduated z-values from the MK analysis, ranging from −3 to 4.9, are presented. Figure 15b displays the Kriging raster, with values ranging from −0.653 to 2.846, while Figure 15c shows the final contour lines, with values ranging from −0.6 to 2.7. These maps indicate that the highest concentration of values is found in most settlements within South Bačka County, with some exceptions in other counties. The ordinary Kriging method was used, with a spherical model applied for the semi-variogram model. The output cell size was 500 m, while the contour interval was set to 0.2, as the values are small and vary within a limited numerical range, as mentioned earlier.
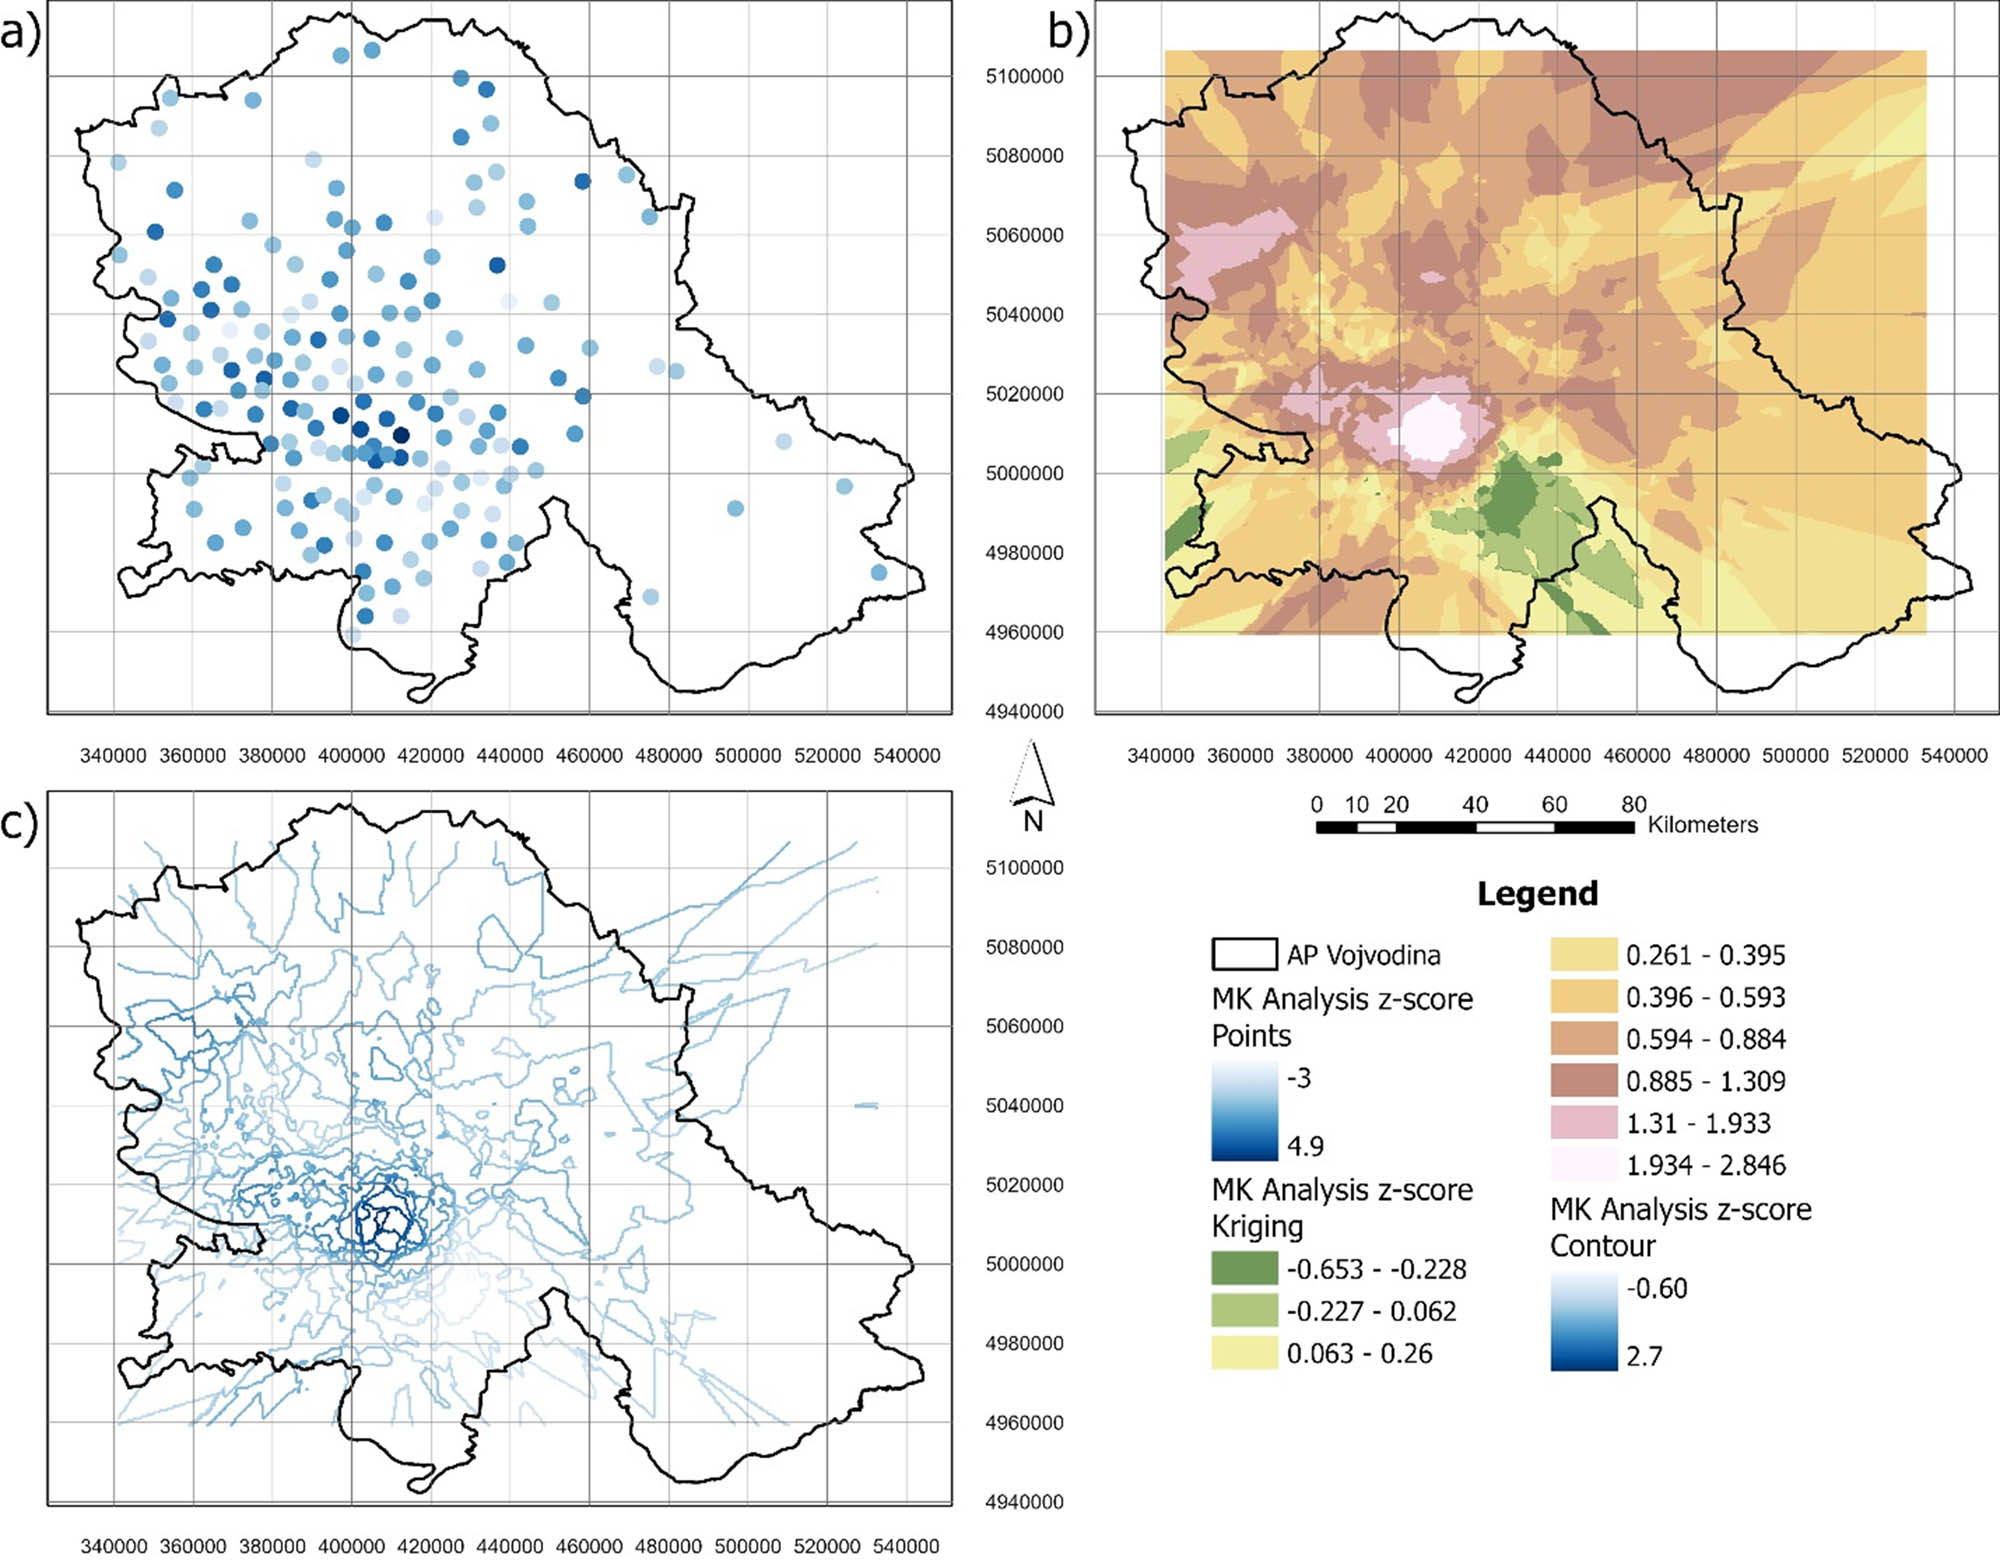
MK analysis z-score presented by: (a) points, (b) Kriging raster, and (c) contours.
The same procedure was applied to the Emerging HSA. The results are similar, as shown in Figure 16a, where points representing z-values of trends range from −0.61 to 5.4. Figure 16b displays the Kriging raster, with values ranging from −0.175 to 4.857, while Figure 16c presents the final contour lines, with values ranging from 0 to 4.8. Similar to the previous analysis, this one also highlights settlements in South Bačka County as the area with the highest values. The same parameters were used in this procedure as in the previous analysis – ordinary Kriging with a spherical model, a 500-m cell size, and a 0.2 contour interval. Analyses indicate that settlements in South Banat County have the lowest number of hypertension cases.
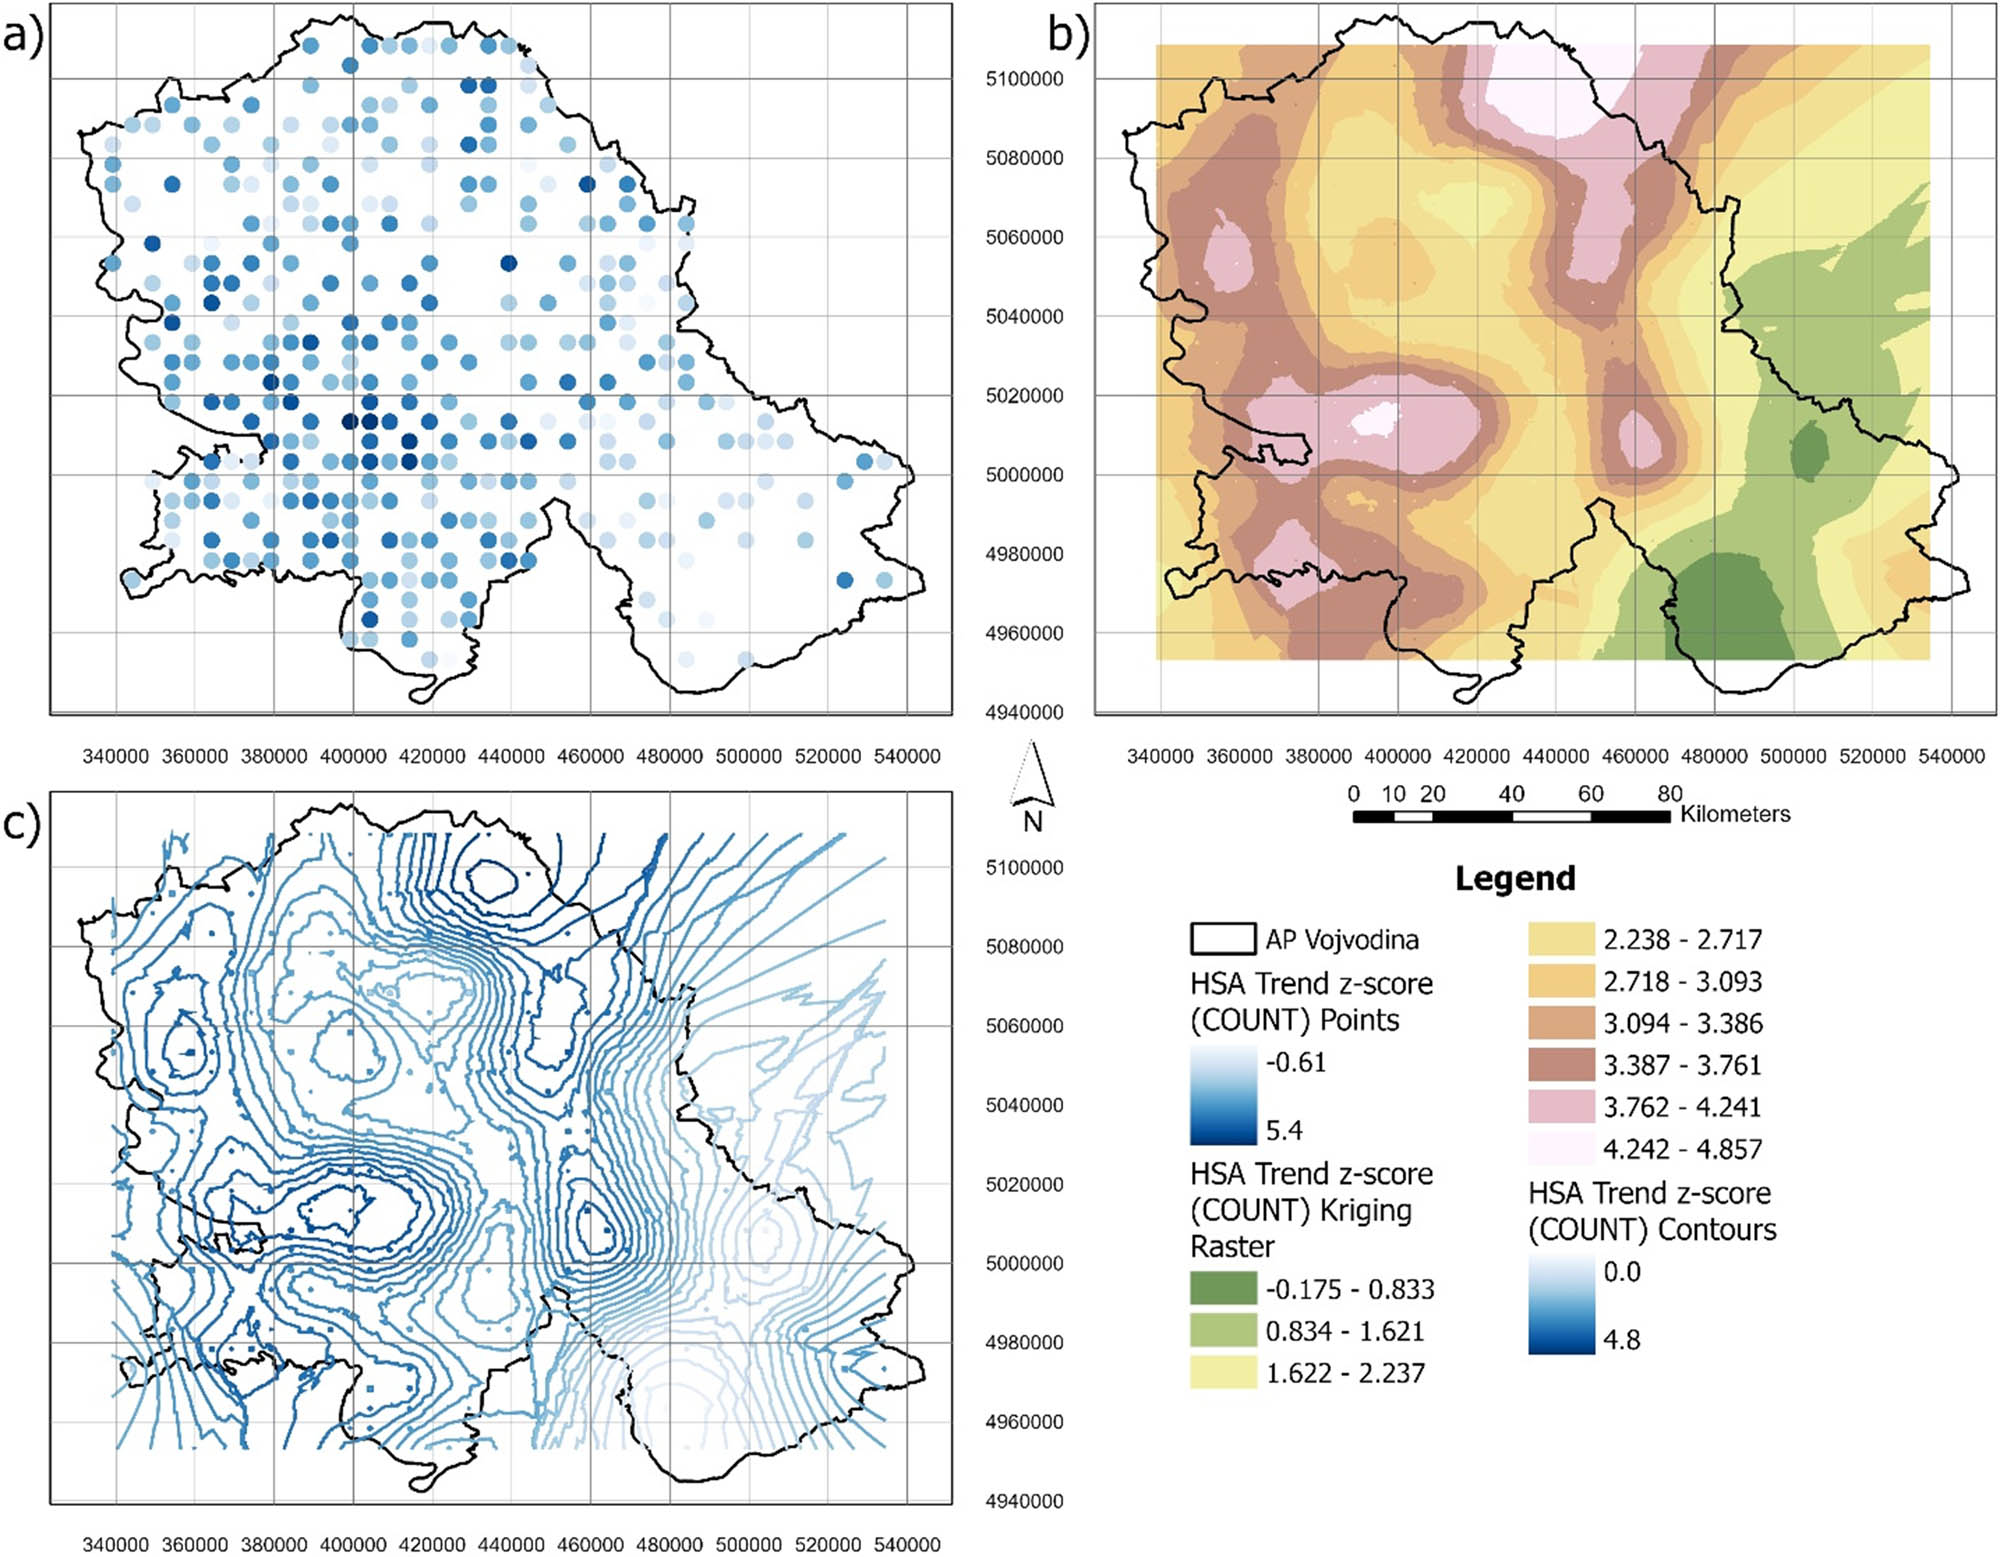
Emerging HSA trend z-score (count) presented by: (a) points, (b) Kriging raster, and (c) contours.
5 Discussion
Research has shown that the MK analysis identified significant trends in 40 of the 467 settlements in the study area. Of these, 36 settlements exhibited an increasing trend in hypertension cases, while a decreasing trend was observed in only four settlements. The Emerging HSA detected 19 clusters in the South Bačka county classified as “Consecutive Hot Spots” among 316 analysed clusters, with no discernible patterns observed in the remaining clusters. Figure 17 presents a synthesis map of hypertension, overlaying the trends from the MK analysis and clusters identified by the Emerging HSA. Settlements in the South Bačka county exhibited an increasing trend and were classified as Consecutive Hot Spots, indicating that targeted prevention measures should be prioritised in this county. Krčedin, Kumane, Ljuba, and Ratkovo represent positive examples, as they exhibit a decrease in the growth of hypertension patients. In these settlements, studies could be conducted to examine the lifestyle and health-related behaviours of residents to identify the factors contributing to the reduction of this condition. These positive examples may serve as a foundation for identifying the factors contributing to reducing hypertension and guiding protective measures, particularly in high-risk areas. The findings could also form part of broader population health protection strategies and offer valuable insights for improving public health.
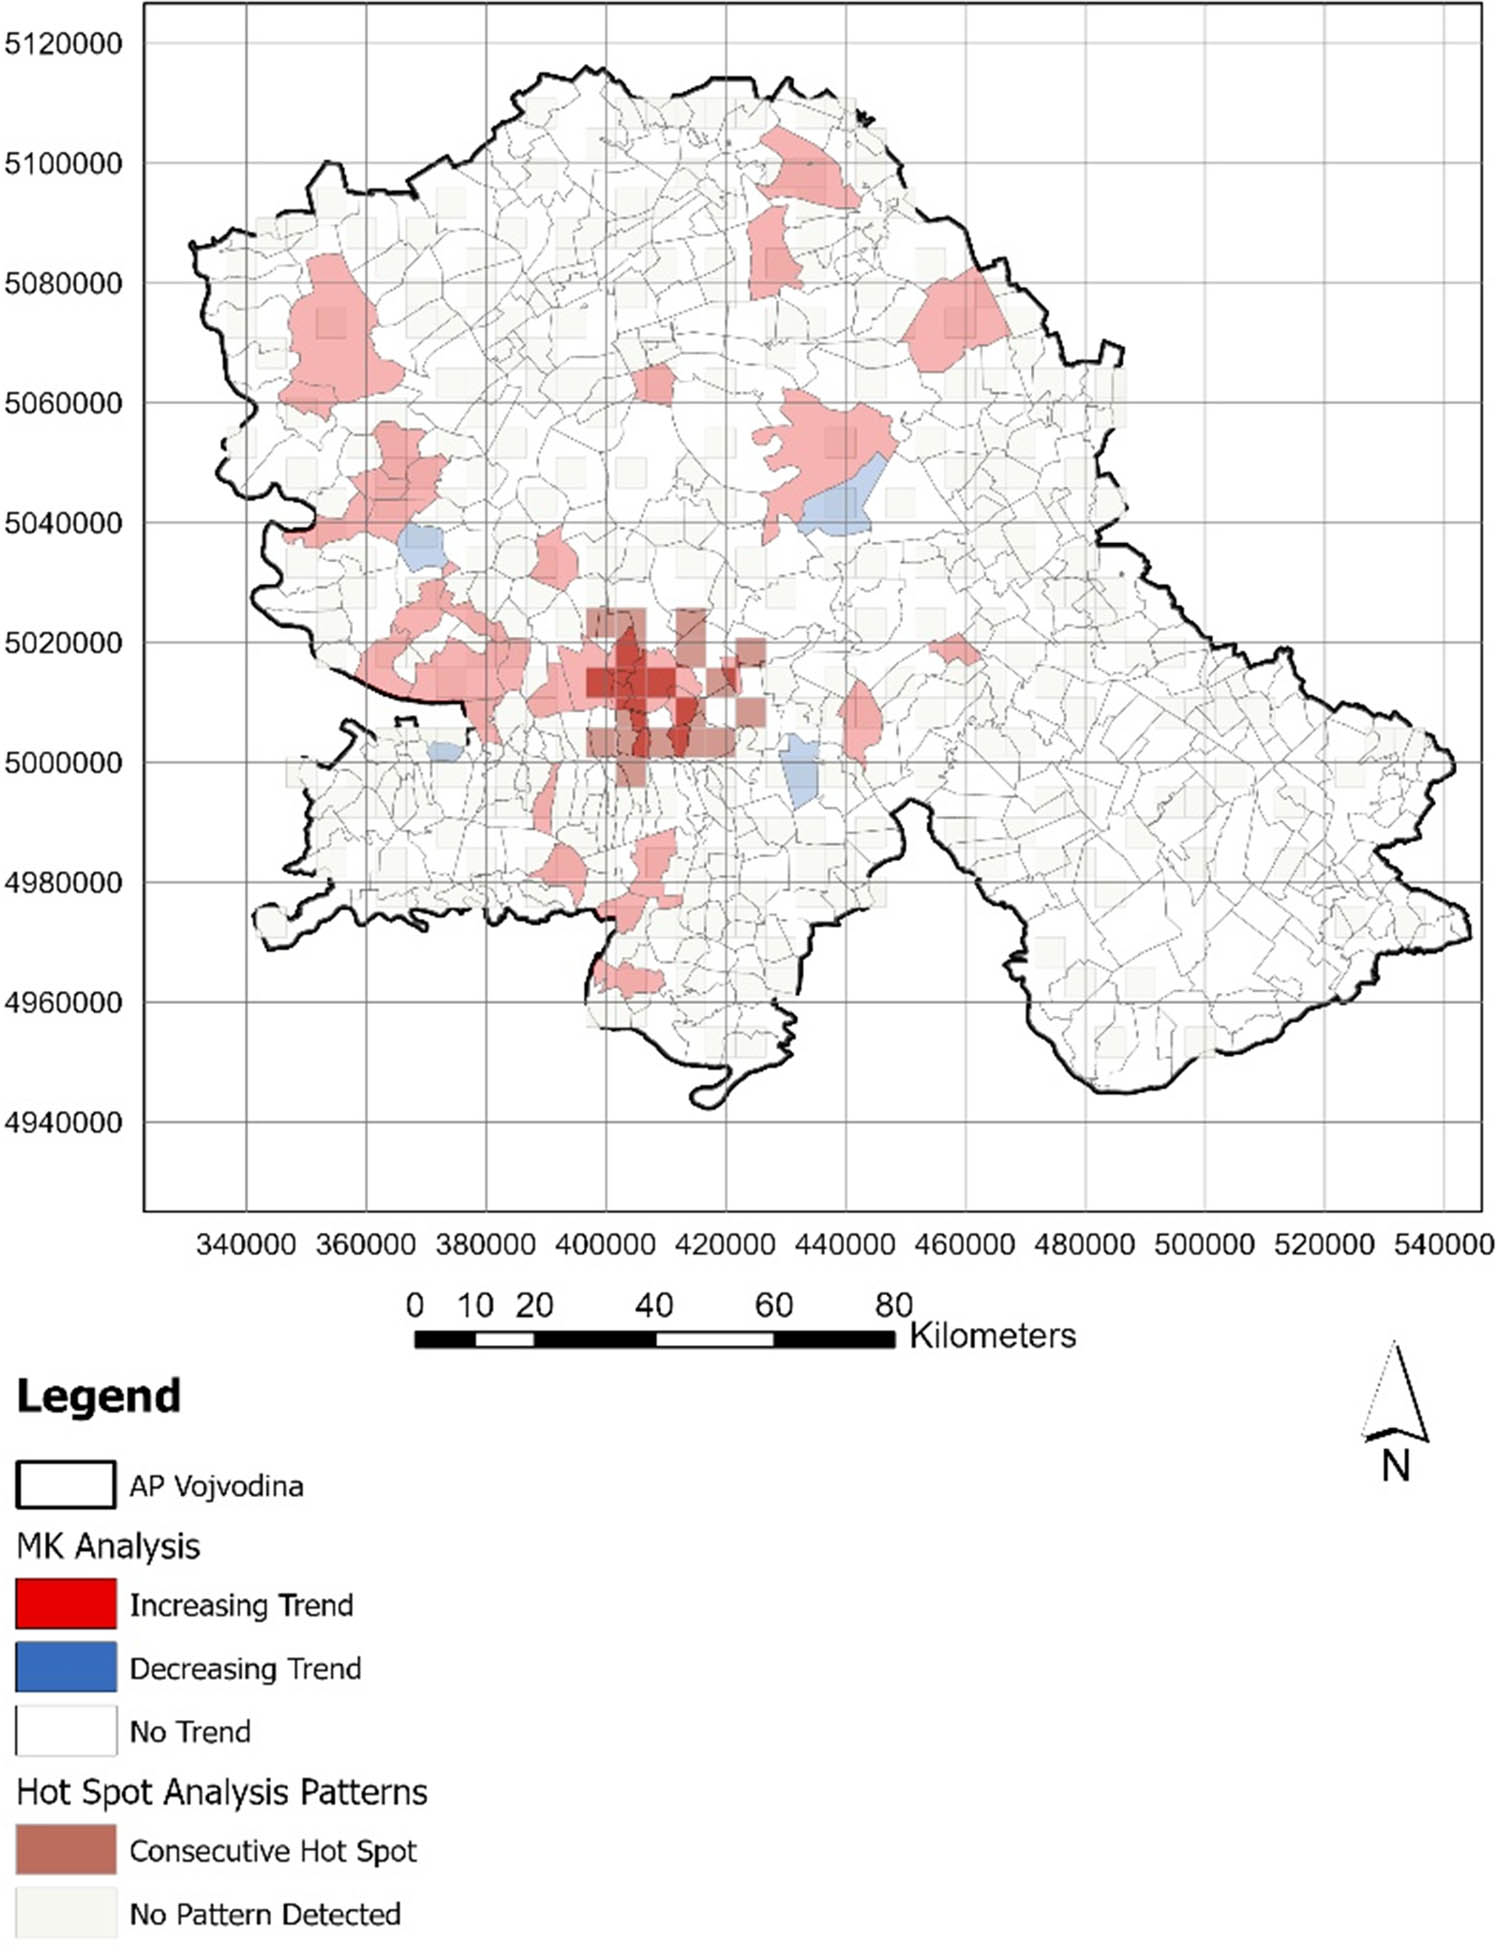
Synthesis map of hypertension, overlaying the trends from the MK analysis and clusters identified by the Emerging HSA.
Figure 18 presents a synthesis map of hypertension, overlaying the trends from the MK analysis and the calculated trends from the HSA. The identified increasing trends are similar in both analyses, with convergence towards the South Bačka County. Additionally, both analyses revealed a relatively small number of settlements with increasing trends in hypertension cases in the South Banat County. This synthesis map also highlights the importance of observing neighbouring settlements, as hypertension cases are not confined within settlement borders. Identifying trends for each settlement individually is insufficient; it is essential to consider neighbouring settlements as well, which is facilitated by the Emerging HSA.
Synthesis map of hypertension cases, overlaying the trends from the MK analysis and calculated trends in HSA.
The application of GIS techniques to map disease prevalence, density, and spatial diffusion provides an efficient way to identify the root causes of diseases and pinpoint sources of infection [9]. Therefore, the same approach to presenting results is applied in this study.
The Kriging method is most appropriate when there is a spatially correlated distance or directional bias in the data [63], as is the case with these hypertension occurrences. As shown in Figure 19, it is evident that hypertension cases are most concentrated in settlements within South Bačka County, as well as in North Banat County. In contrast, settlements in South Banat County recorded the lowest trends in hypertension cases.
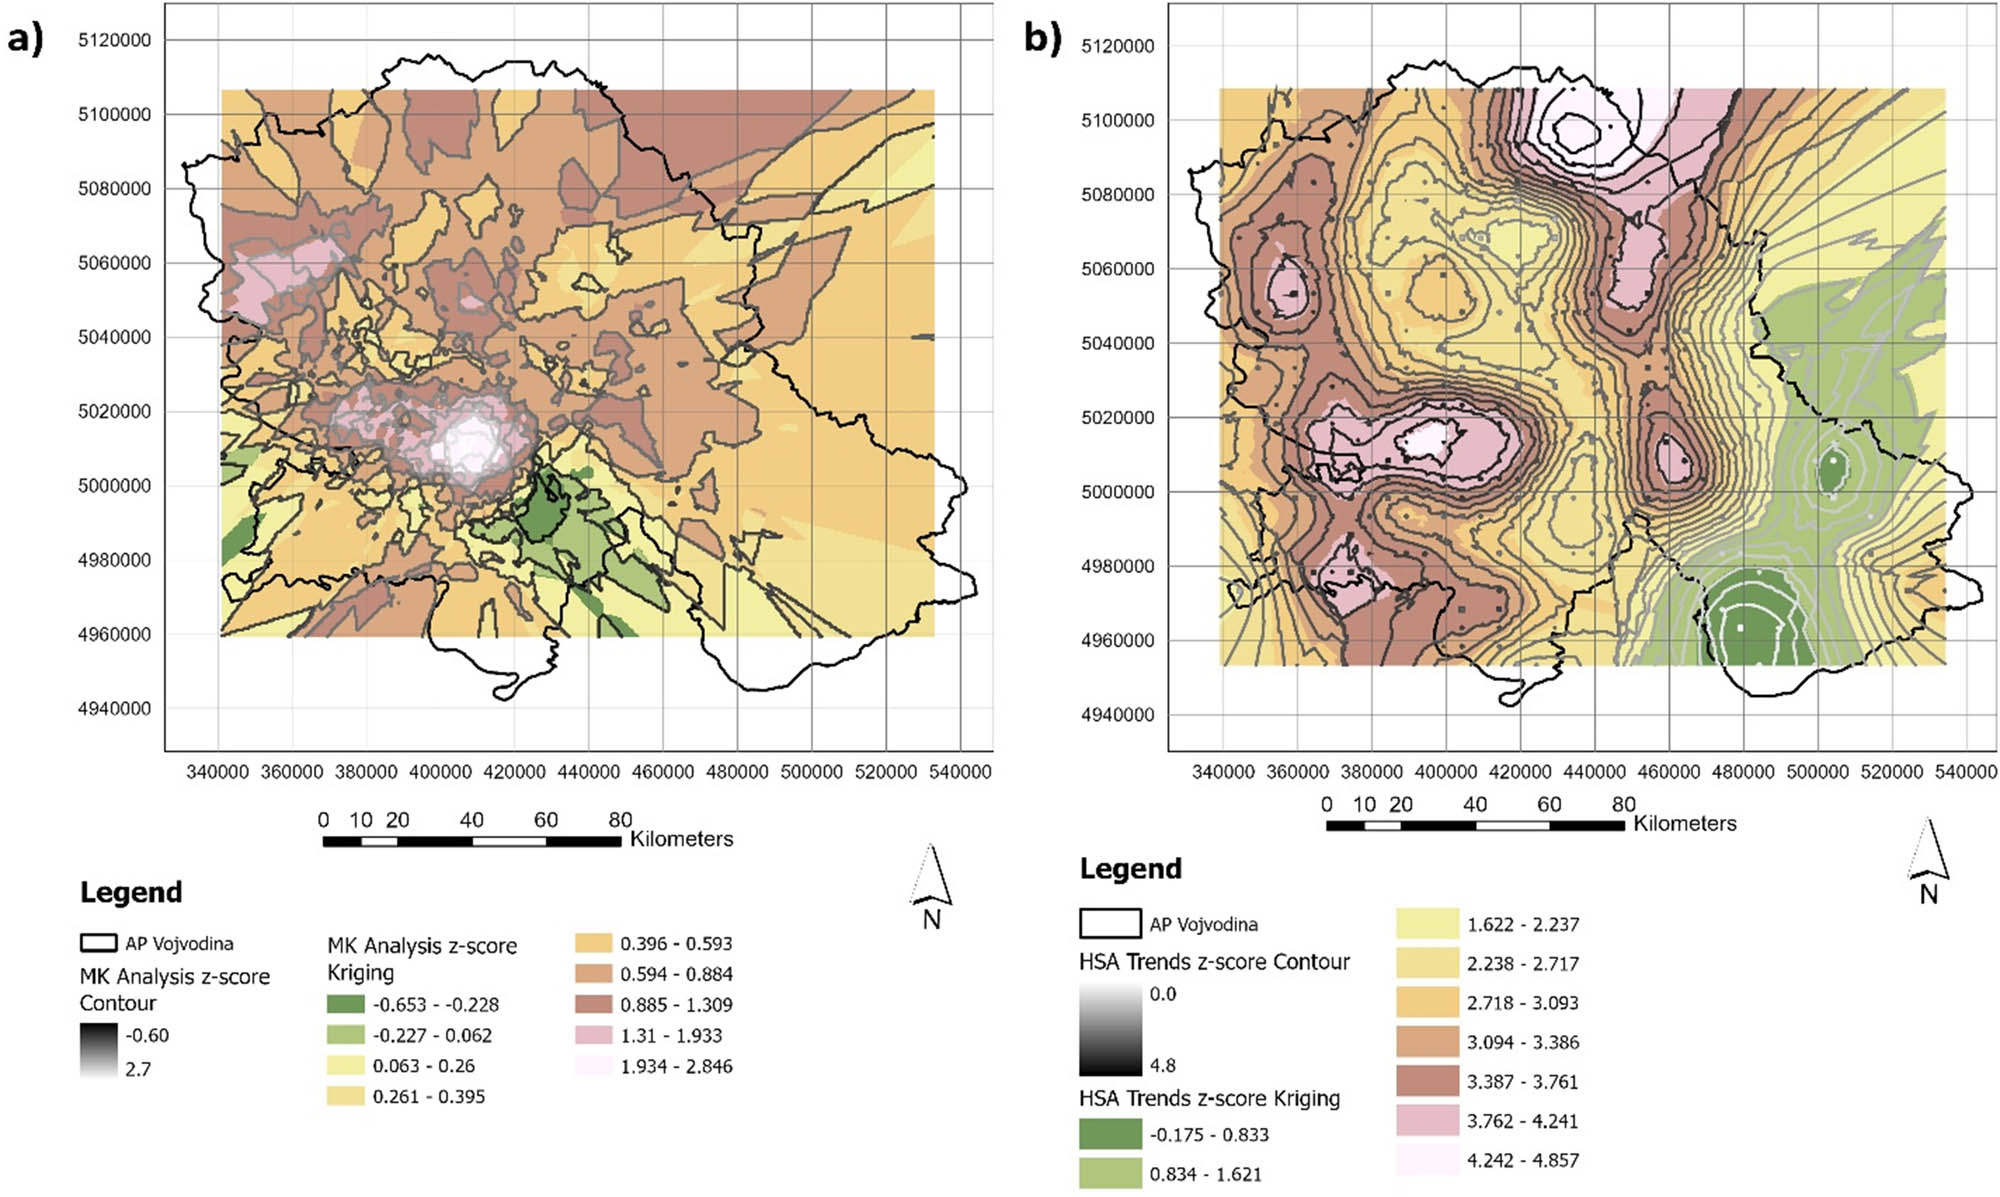
z-values of hypertension case trends represented through contours and Kriging raster in: (a) MK analysis and (b) Emerging HSA.
Figure 19a presents z-values calculated in the MK analysis, while Figure 19b displays z-values from trends calculated in the Emerging HSA. Because of the use of neighbouring values instead of the complete dataset or individual settlements, the contours in the HSA appear smoother than those in the MK analysis, making them easier to read and interpret.
AP Vojvodina is a centre of agricultural production and has a well-developed food industry [64]. During the last decade of the 20th century, former Yugoslavia experienced wars, a decline in living standards, significant migrations, and a prolonged recession [64]. These factors contributed to changes in population structure, living conditions, and general lifestyle [64].
Pork meat and pork meat products are commonly consumed in AP Vojvodina by the local population [45]. Consequently, CVDs, diabetes, and obesity are more prevalent in the region [45,65]. A study conducted by Tomasevic et al. found that the prevalence of obesity and hypertension in Vojvodina is rising, with obese adults being twice as likely to develop hypertension [35].
Further research by Petrović and Čanković revealed that obesity and abdominal obesity are highly prevalent among adolescents in Vojvodina, with boys being more affected [36]. The study also confirmed that gender, community type, and the father’s level of education significantly influence both obesity and abdominal obesity [36].
In addition, a 2017 study conducted by the Institute of Public Health of Vojvodina examined the salt content in meals prepared for preschool children [66]. It found that the salt levels in all three daily meals generally exceeded the recommended daily intake, posing a risk for hypertension [6,45,66].
The Institute of Public Health of Vojvodina conducted an examination of the nutritional status and health risks of school children in 2020 [6,45,67]. An analysis of students’ knowledge and attitudes regarding the principles of proper nutrition revealed that 46.15% of students do not know how many meals they should have per day and 19.23% believe that eating puff pastry is healthier than whole meal bread [6,45]. Furthermore, 11.54% of students think eating chips is healthier than boiled potatoes, and drinking sweetened beverages is healthier than drinking water [45,67]. The analysis also determined that 46.15% of students do not drink milk daily, 23.08% do not eat fruit, and 46.15% do not consume salad. On the other hand, 61.54% of students consume sweets regularly, and 23.08% drink carbonated beverages daily [6,45,47]. It can be concluded that children’s nutrition is neither properly distributed nor balanced. Therefore, it is crucial to enhance education for children about the importance of proper nutrition [45]. This study recommends the establishment and implementation of continuous nutrition education programs across all schools and educational levels. Such initiatives would contribute to raising public awareness about the benefits of proper nutrition and its role in improving health outcomes throughout the education system. Incorporating such programs into the formal curriculum would not only promote healthy lifestyle habits from an early age but also contribute to the long-term prevention of diet-related diseases. Moreover, integrating nutritional education into various subjects and extracurricular activities can enhance students’ understanding and encourage the practical application of acquired knowledge in everyday life.
The study titled “Research on the Health of the Population of Serbia in 2019”, conducted by the Statistical Office of the Republic of Serbia (RZS) in collaboration with the Institute of Public Health of Serbia (IZJZS) and the Ministry of Health of the Republic of Serbia, included 1,324 households from the AP Vojvodina [6,45,68]. According to the study, 64.7% of the population assessed their health as good, while 46.1% reported having an illness lasting at least six months [45,68]. The analysis also revealed that women, particularly those with the lowest levels of education and poor financial status, reported the worst health conditions [6,45,68]. Additionally, the study recorded a significantly higher percentage of obese individuals (25.4%) in AP Vojvodina compared to the overall territory of the Republic of Serbia [6,45,68]. This difference is attributed to the frequent use of fatty and salty foods and similar dietary habits [6,45,48]. Future research should take into account more detailed information about alcohol consumption and sodium intake and further identify the potential gender-specific risk factors at regional levels [14].
Research conducted by Jocić-Savić et al., using data from surveys carried out in 2000 and 2006 by the IZJZS, revealed that residents of Vojvodina are not the most frequently treated for hypertension when compared to the rest of the Republic of Serbia [33]. Additional efforts are needed to accelerate the detection and treatment of high blood pressure [7]. Emphasis should also be placed on educational programs to enhance patients’ knowledge, attitudes, and awareness of hypertension [7].
This study did not investigate the underlying causes of hypertension but instead focused on identifying the disease’s hotspots and examining its trends using data from the ICDV. Future research should expand this focus to include the geographic distribution of hypertension patients from other hospitals across the Vojvodina region, providing a more comprehensive understanding of the disease’s prevalence and patterns in the area. Such an undertaking is inherently complex and would require collaboration among experts from various disciplines, not just healthcare professionals. One key recommendation from this study is that data from other hospitals in the AP Vojvodina region be made publicly accessible, as this would offer a more complete and transparent view of the hypertension situation throughout the entire province. Hypertension imposes significant economic burdens on individuals, families, health systems, and national economies [5]. Patients face direct medical expenses and lost income, often during their prime working years, potentially impoverishing families [5]. Health systems bear the high costs of hospital and outpatient care for heart attacks and strokes caused by uncontrolled hypertension [5]. National economies suffer from lost tax revenue, reduced productivity, increased healthcare expenses, and greater societal support needs for survivors of cardiovascular events and their dependents [5]. However, improved hypertension treatment programs are highly cost-effective, with an estimated benefit-to-cost ratio of 18:1 [5].
Certain countries, including Canada, Costa Rica, South Korea, and Taiwan, have successfully attained low hypertension prevalence or high control rates by enhancing prevention measures and optimising every step of the treatment process [8,69,70].
Pharmacologic treatment of high blood pressure reduces the risk of CVDs, such as stroke, coronary heart disease, and renal insufficiency [5,7]. However, high blood pressure is one of several modifiable risk factors for CVDs [5,7]. A comprehensive approach is essential to address interrelated health risks, including tobacco use, obesity, physical inactivity, poor diet, and diabetes [5,7]. Effective strategies focus on promoting a healthy, low-sodium diet, maintaining a healthy weight, avoiding alcohol and tobacco, and engaging in regular physical activity, which benefits overall health as well [5,7].
Effective hypertension management provides significant health, well-being, and economic benefits [5,8]. It alleviates pressure on acute-care services, promotes integrated healthcare systems, and reduces deaths, suffering, and costs from complications like heart attack, stroke, and kidney failure [5,8]. Hypertension can be easily identified in primary healthcare settings, and affordable treatments are available for effective management [5,8].
6 Concluding remarks
This study offers valuable insights into the geographic distribution and trends of hypertension in the AP Vojvodina, employing spatial-temporal analysis to deepen our understanding of the disease’s prevalence and dynamics in the region. The findings underscore the need for targeted public health interventions, particularly in high-risk areas, and highlight the importance of exploring the underlying causes of hypertension to develop more effective prevention strategies.
Moreover, enhancing the accessibility and integration of health data from various healthcare institutions in the province could provide a more comprehensive view of the hypertension’s spread and its impact. This data-sharing approach would not only offer a clearer understanding of the disease’s current state but also inform more precise, region-specific interventions. This study recommends adopting specific strategies for regional data integration and fostering inter-institutional cooperation, which would significantly support future research on population public health.
A multi-disciplinary approach, involving collaboration between healthcare professionals, public health experts, data scientists, and policymakers, is essential for addressing this growing health challenge. This would facilitate the development of evidence-based strategies for prevention, early detection, and treatment of hypertension across diverse communities.
Future research should expand beyond the current scope, exploring additional factors such as socio-economic determinants, lifestyle behaviours, and environmental influences on hypertension trends. Longitudinal studies that track changes in hypertension rates over time, combined with interventions aimed at improving nutrition, physical activity, and healthcare access, could provide critical data to inform public health policy and practice. Additionally, research on the effectiveness of existing treatment protocols in different regions of Vojvodina could offer valuable insights into optimising care and outcomes. Ultimately, continued investigation and a holistic approach will be key to reducing the burden of hypertension and ensuring a healthier population in AP Vojvodina, north Serbia.
Acknowledgments
This study was supported by the Program of Cooperation with the Serbian Scientific Diaspora – Joint Research Projects – DIASPORA 2023, from the Science Fund of the Republic of Serbia, under the project LAMINATION (The Loess Plateau Margins: Towards Innovative Sustainable Conservation), Project number: 17807 and the support of the Ministry of Science, Technological Development and Innovation of the Republic of Serbia (Grant Nos 451-03-137/2025-03/200125, 451-03-136/2025-03/200125, and 451-03-136/2025-03/200091).
-
Funding information: This research received no external funding that has supported the work.
-
Author contributions: Conceptualization and methodology: E.K. and T.L.; formal analysis: Z.K. and A.S.M.; GIS software and mapping: Z.K.; technical editing: E.K.; supervision: T.L.; all authors discussed the results and contributed to the final manuscript. All authors have read and agreed to the published version of the manuscript.
-
Conflict of interest: The authors state no conflict of interest.
References
[1] Rudasingwa G, Cho S, Ishimwe NC. Regional prevalence and spatial modeling of hypertension in South Africa. Open Health. 2024;5(1):20230030. 10.1515/ohe-2023-0030.Search in Google Scholar
[2] Levine DA, Lewis CE, Williams OD, Safford MM, Liu K, Calhoun DA, et al. Geographic and demographic variability in 20-year hypertension incidence. Hypertension. 2010;57(1):39–47. 10.1161/hypertensionaha.110.160341.Search in Google Scholar
[3] Sørensen HT, Kristensen FPB. Cardiovascular diseases and health inequalities in Europe—a pressing public health challenge. Lancet Reg Health Eur. 2023;33:100722. 10.1016/j.lanepe.2023.100722.Search in Google Scholar PubMed PubMed Central
[4] United Nations Population Division. World population prospects 2022. New York: United Nations; 2022. https://population.un.org/wpp/.Search in Google Scholar
[5] World Health Organization. Global report on hypertension: The race against a silent killer. Geneva: WHO; 2023. ISBN 978-92-4-008106-2 (electronic), ISBN 978-92-4-008105-5 (print).Search in Google Scholar
[6] Kričković E, Lukić T, Jovanović-Popović D. Geographic medical overview of noncommunicable diseases (cardiovascular diseases and diabetes) in the territory of the AP Vojvodina (Northern Serbia). Healthcare. 2023;11(48):1–35. 10.3390/healthcare11010048.Search in Google Scholar PubMed PubMed Central
[7] Grujić V, Dragnić D, Kvrgić S, Šušnjević S, Grujić J, Travar S. Epidemiology of hypertension in Serbia: results of a national survey. J Epidemiol. 2012;22(3):261–6. 10.2188/jea.je20110077.Search in Google Scholar PubMed PubMed Central
[8] NCD Risk Factor Collaboration (NCD-RisC). Worldwide trends in hypertension prevalence and progress in treatment and control from 1990 to 2019: a pooled analysis of 1201 population-representative studies with 104 million participants. Lancet. 2021;398(10304):957–80. 10.1016/S0140-6736(21)01330-1.Search in Google Scholar PubMed PubMed Central
[9] Murad A, Khashoggi BF. Using GIS for disease mapping and clustering in Jeddah, Saudi Arabia. ISPRS Int J Geo-Inf. 2020;9(5):328. 10.3390/ijgi9050328.Search in Google Scholar
[10] Laohasiriwong W, Puttanapong N, Singsalasang A. Prevalence of hypertension in Thailand: Hotspot clustering detected by spatial analysis. Geospat Health. 2018;13(1):20–7. 10.4081/gh.2018.608.Search in Google Scholar PubMed
[11] White K, Stewart JE, Lòpez-DeFede A, Wilkerson RC. Small-area variation in hypertension prevalence among black and white medicaid enrollees. Ethn Dis. 2016;26(3):331–8. 10.18865/ed.26.3.331. PMID: 27440972; PMCID: PMC4948799.Search in Google Scholar PubMed PubMed Central
[12] Leroux D, Cloutier L. Geographical analysis of hypertension in Canadian population. J Hypertens. 2022;40(Suppl 1):e211. 10.1097/01.hjh.0000837600.51239.74.Search in Google Scholar
[13] Kamath R, Brand H, Arun HR, Lakshmi V, Sharma N, D’Souza RMC. Spatial patterns in the distribution of hypertension among men and women in India and its relationship with health insurance coverage. Healthcare (Basel). 2023;11(11):1630. 10.3390/healthcare11111630.Search in Google Scholar PubMed PubMed Central
[14] Xu L, Jiang Q, Lairson DR. Spatio-temporal variation of gender-specific hypertension risk: evidence from China. Int J Env Res Public Health. 2019;16(22):4545. 10.3390/ijerph16224545.Search in Google Scholar PubMed PubMed Central
[15] Kang Y, Wang X, Yin P, Chen Z, Jiang L, Dong W, et al. Nationwide spatiotemporal trends in blood pressure and the attributable cardiovascular burden from 2005 to 2018: a pooled analysis of 13.1 million participants in China. J Hypertens. 2021;39(Suppl 1):e84. 10.1097/01.hjh.0000745224.89611.24.Search in Google Scholar
[16] Gupta R. Trends in hypertension epidemiology in India. J Hum Hypertens. 2004;18(2):73–8. 10.1038/sj.jhh.1001633.Search in Google Scholar PubMed
[17] Gupta R, Gaur K, Ram CV. Emerging trends in hypertension epidemiology in India. J Hum Hypertens. 2019;33(8):575–87. 10.1038/s41371-018-0117-3.Search in Google Scholar PubMed
[18] Heaton J, Alshami A, Imburgio S, Mararenko A, Schoenfeld M, Sealove B, et al. Current trends in hypertension identification and management: Insights from the National Health and Nutrition Examination Survey (NHANES) following the 2017 ACC/AHA high blood pressure guidelines. J Am Heart Assoc. 2024;13(8):1–10. 10.1161/JAHA.123.034322.Search in Google Scholar PubMed PubMed Central
[19] Aekplakorn W, Chariyalertsak S, Kessomboon P, Assanangkornchai S, Taneepanichskul S, Goldstein A, et al. Trends in hypertension prevalence, awareness, treatment, and control in the Thai population, 2004 to 2020. BMC Public Health. 2024;24:3149. 10.1186/s12889-024-20643-1.Search in Google Scholar PubMed PubMed Central
[20] Matheron G. Principles of geostatistics. Econ Geol. 1963;58(8):1246–66.10.2113/gsecongeo.58.8.1246Search in Google Scholar
[21] Oliver MA, Webster R. Kriging: A method of interpolation for geographical information systems. Int J Geogr Inf Sci. 1990;4(3):313–32. 10.1080/02693799008941549.Search in Google Scholar
[22] Goovaerts P, Gebreab S. How does Poisson kriging compare to the popular BYM model for mapping disease risks. Int J Health Geogr. 2008;7:6. 10.1186/1476-072X-7-6.Search in Google Scholar PubMed PubMed Central
[23] Auchincloss AH, Diez Roux AV, Brown DG, Raghunathan TE, Erdmann CA. Filling the gaps: Spatial interpolation of residential survey data in the estimation of neighborhood characteristics. Epidemiology. 2007;18(4):469–78. 10.1097/EDE.0b013e3180646320. PMID: 17568220; PMCID: PMC3772132. Search in Google Scholar PubMed PubMed Central
[24] Jerrett M, Burnett RT, Ma R, Pope CA, Krewski D, Newbold KB, et al. Spatial analysis of air pollution and mortality in Los Angeles. Epidemiology. 2005 Nov;16(6):727–36. 10.1097/01.ede.0000181630.15826.7d. PMID: 16222161.Search in Google Scholar PubMed
[25] Ali M, Goovaerts P, Nazia N, Haq MZ, Yunus M, Emch M. Application of Poisson kriging to the mapping of cholera and dysentery incidence in an endemic area of Bangladesh. Int J Health Geogr. 2006;5:45. 10.1186/1476-072X-5-45.Search in Google Scholar PubMed PubMed Central
[26] Goovaerts P, Gebreab S. How does Poisson kriging compare to the popular BYM model for mapping disease risks? Int J Health Geogr. 2008;7(1):6. 10.1186/1476-072X-7-6.Search in Google Scholar PubMed PubMed Central
[27] Pouliou T, Kanaroglou PS, Elliott SJ, Pengelly LD. Assessing the health impacts of air pollution: A re-analysis of the Hamilton children’s cohort data using a spatial analytic approach. Int J Env Health Res. 2008;18(1):17–35. 10.1080/09603120701844290. PMID: 18231944.Search in Google Scholar PubMed
[28] Mercer LD, Szpiro AA, Sheppard L, Lindström J, Adar SD, Allen RW, et al. Comparing universal kriging and land-use regression for predicting concentrations of gaseous oxides of nitrogen (NOx) for the multi-ethnic study of atherosclerosis and air pollution (MESA Air). Atmos Env (1994). 2011;45(26):4412–20. 10.1016/j.atmosenv.2011.05.043. PMID: 21808599; PMCID: PMC3146303. Search in Google Scholar PubMed PubMed Central
[29] Zhang K, Oswald EM, Brown DG, Brines SJ, Gronlund CJ, White-Newsome JL, et al. Geostatistical exploration of spatial variation of summertime temperatures in the Detroit metropolitan region. Env Res. 2011;111(8):1046–53. 10.1016/j.envres.2011.08.012. PMID: 21924413; PMCID: PMC4345124. Search in Google Scholar PubMed PubMed Central
[30] Oliver MA, Webster R, Lajaunie C, Muir KR, Parkes SE, Cameron AH, et al. Binomial cokriging for estimating and mapping the risk of childhood cancer. Math Med Biol. 1998;15(3):279–97. PMID: 9773520.10.1093/imammb15.3.279Search in Google Scholar
[31] Carrat F, Valleron AJ. Epidemiologic mapping using the “kriging” method: application to an influenza-like epidemic in France. Am J Epidemiol. 1992;135(11):1293–300. 10.1093/oxfordjournals.aje.a116236.Search in Google Scholar PubMed
[32] Timmis A, Vardas P, Townsend N, Torbica A, Katus H, De Smedt D, et al. European Society of Cardiology: Cardiovascular disease statistics 2021. Eur Heart J. 2022;43:716–99. 10.1093/eurheartj/ehab892.Search in Google Scholar PubMed
[33] Jocić-Savić M, Obradović N, Čomić M, Radovanović M, Petrović J. Hypertension in older persons. Zdravstvena zaštita. 2010;1:9–13, https://scindeks-clanci.ceon.rs/data/pdf/0350-3208/2010/0350-32081001009J.pdf.10.5937/ZZ1001009JSearch in Google Scholar
[34] Vulin A, Sucur N, Delic Z, Poljak JP, Ljubotina A, Todic VD, et al. Short-term blood pressure variability and left ventricular diastolic dysfunction in patients with arterial hypertension. J Hypertens. 2022;40(Suppl 1):e109. 10.1097/01.hjh.0000836344.52502.64.Search in Google Scholar
[35] Tomasevic T, Milijasevic D, Ac Nikolic E, Ukropina S, Topalov Z. Obesity and hypertension as a growing public health problem in Province of Vojvodina, Serbia. Eur J Public Health. 2015;25(Suppl 3):ckv175.248. 10.1093/eurpub/ckv175.248.Search in Google Scholar
[36] Petrović V, Čanković S. Prevalence of obesity and impact of socio-demographic factors on obesity in 15–19 years old adolescents in Vojvodina, Serbia. Cent Eur J Public Health. 2023;31(4):287–95. 10.21101/cejph.a7683.Search in Google Scholar PubMed
[37] Maksimović Z, Jovanović T, Ršumović M, Đorđević M. Magnesium and calcium in drinking water in relation to cadiovascular mortality in Serbia. In Magnesium in the Environment and Organisms; SANU, Scientific Meetings; Book 1; Department of Mathematics, Physics and Geo-Sciences, Department of Chemical and Biological Sciences: Belgrade, Serbia. Belgrade: Serbian Academy of Sciences and Arts; Vol. XCII, 1999. p. 21–7.Search in Google Scholar
[38] Poloniecki J, Atkinson R, de Leon A, Anderson H. Daily time series for cardiovascular hospital admissions and previous day’s air pollution in London, UK. Occup Env Med. 1997;54:35–40., http://www.jstor.org/stable/27730787.10.1136/oem.54.8.535Search in Google Scholar PubMed PubMed Central
[39] Jevtić M, Dragić N, Bijelović S, Popović M. Cardiovascular diseases and air pollution in Novi Sad, Serbia. Int J Occup Med Env Health. 2014;27:153–64. 10.2478/s13382-014-0239-y.Search in Google Scholar PubMed
[40] Kričković E, Lukić T, Srejić T, Stojšić-Milosavljević A, Stojanović V, Kričković Z. Spatial-temporal and trend analysis of traffic accidents in AP Vojvodina (North Serbia). Open Geosci. 2024;16:20220630.10.1515/geo-2022-0630Search in Google Scholar
[41] Čvoro J, Golubović P. Geography of Yugoslavia. Belgrade, Serbia: National Library of Serbia; 2001 (In Serbian).Search in Google Scholar
[42] Tomić P, Romelić J, Kicošev S, Lazić L. Population of Vojvodina. 2nd ed. Novi Sad, Serbia: Association of Geographers of Vojvodina; 2004.Search in Google Scholar
[43] Statistical Office of the Republic of Serbia. 2022 Census of Population, Households and Dwellings. Ethnicity. Data by municipalities and cities. Belgrade: Statistical Office of the Republic of Serbia; 2023. https://publikacije.stat.gov.rs/G2023/Pdf/G20234001.pdf.Search in Google Scholar
[44] JP Institute for Urban Planning of Vojvodina, 2021. https://www.zavurbvo.rs/cir/.Search in Google Scholar
[45] Kričković E. The influence of geographical and medical factors on the health of the population of AP Vojvodina. PhD thesis. Belgrade, Serbia: University of Belgrade, Faculty of Geography; 2022.Search in Google Scholar
[46] Institute for Cardiovascular Diseases of Vojvodina. Database (2000–2023). Sremska Kamenica.Search in Google Scholar
[47] World Health Organization. International statistical classification of diseases and related health problems. 10th revision, edition 2010, Volume 1. Geneva, Switzerland: WHO; 2011. https://www.who.int/standards/classifications/classification-of-diseases.Search in Google Scholar
[48] World Health Organization. Classification of diseases. Geneva: WHO. https://www.who.int/standards/classifications/classification-of-diseases.Search in Google Scholar
[49] Institute for Public Health of Serbia “Dr. Milan Jovanović Batut”. International statistical classification of diseases and related health problems. Belgrade: Institute for Public Health of Serbia “Dr. Milan Jovanović Batut”; Tenth Revision, Book 1, 2010 Edition; 2013.Search in Google Scholar
[50] Mann HB. Non-parametric tests against trend. Econometrica. 1945;13:245–59.10.2307/1907187Search in Google Scholar
[51] Kendall MG. Rank correlation methods. 4th edn. London: Charles Griffin; 1975.Search in Google Scholar
[52] Gavrilov MB, Marković SB, Janc N, Nikolić M, Valjarević AĐ, Komac B, et al. Assessing average annual air temperature trends using the Mann-Kendall test in Kosovo. Acta Geographica Slovenica. 2017;58:7–26. 10.3986/AGS.1309.Search in Google Scholar
[53] Ghalharia GF, Dastjerdib JK, Nokhandanc MH. Using Mann-Kendall and t-test methods in identifying trends of climatic elements: A case study of northern parts of Iran. Manag Sci Lett. 2012;2:911–20. 10.5267/j.msl.2011.10.015.Search in Google Scholar
[54] Hirsch RM, Slack JR, Smith RA. Techniques of trend analysis for monthly water quality data. Water Resour Res. 1982;18(1):107–21. 10.1029/WR018i001p00107.Search in Google Scholar
[55] Getis A, Ord JK. The analysis of spatial association by use of distance statistics. Geogr Anal. 1992;24(3):189–206.10.1111/j.1538-4632.1992.tb00261.xSearch in Google Scholar
[56] Ord JK, Getis A. Local spatial autocorrelation statistics: distributional issues and an application. Geogr Anal. 1995;27(4):286–306. 10.1111/j.1538-4632.1995.tb00912.x.Search in Google Scholar
[57] Erdoğan S, Dereli MA, Şenol HIA. GIS‑based assessment of long‑term traffic accidents using spatiotemporal and empirical Bayes analysis in Turkey. Appl Geomat. 2022;14:147–62. 10.1007/s12518-022-00419-1.Search in Google Scholar
[58] Zainuddin AA, Rahim A, Rasyid H, Ramadany S, Dharmayani H, Abdullah AA Geospatial analysis of diabetes type 2 and hypertension in South Sulawesi, Indonesia, 2022. (Pre-print). as-sets.researchsquare.com/files/rs-2031474/v1/0fa625c9-fd2b-4ca6-a7a8-a631f60f63e2.pdf?c=1663716153.Search in Google Scholar
[59] Kumari B, Pandey AC. MODIS based forest fire hotspot analysis and its relationship with climatic variables. Spat Inf Res. 2020;28:87–99. 10.1007/s41324-019-00275-z.Search in Google Scholar
[60] Said SNBM, Zahran E-SMM, Shams S. Forest fire risk assessment using hotspot analysis in GIS. Open Civ Eng J. 2017;11:786–801. 10.2174/1874149501711010786.Search in Google Scholar
[61] Vizuete-Jaramillo E, Meza-Figueroa D, Reyes-Castro PA, Robles-Morua A. Using a sensitivity analysis and spatial clustering to determine vulnerability to potentially toxic elements in a semiarid city in Northwest Mexico. Sustainability. 2022;14:10461. 10.3390/su141710461.Search in Google Scholar
[62] Columbia University Mailman School of Public Health. Kriging interpolation [Internet]. https://www.publichealth.columbia.edu/research/population-health-methods/kriging-interpolation.Search in Google Scholar
[63] Esri. How Kriging works [Internet]. https://pro.arcgis.com/en/pro-app/latest/tool-reference/3d-analyst/how-kriging-works.htm.Search in Google Scholar
[64] Rakić R, Božić-Krstić V, Pavlica T. Relationship between overweight, obesity and socioeconomic factors of adolescents in Vojvodina, Serbia. HOMO. 2011;62(4):307–13. 10.1016/j.jchb.2011.04.002.Search in Google Scholar PubMed
[65] Obradović-Arsić D, Gledović Z. Medical geography. Belgrade, Serbia: Faculty of Geography; 2012.Search in Google Scholar
[66] Institute of Public Health of Vojvodina. Population Health Status of Vojvodina in 2017. Novi Sad, Serbia: Institute of Public Health of Vojvodina; 2018 (In Serbian).Search in Google Scholar
[67] Institute of Public Health of Vojvodina. A small school of proper nutrition and assessment of nutritional status and health risks of school children 2020. Novi Sad (Serbia). 2021. https://www.izjzv.org.rs/?lng=&cir=&link=3-19-2264.Search in Google Scholar
[68] Milić N, Stanisavljević D, Krstić M, Jovanović B, Brcanski J, Kilibarda B, et al. Research on the health of the population of Serbia in 2019. In: Milić N, Stanisavljević D, Krstić M, editors. Belgrade (Serbia): Institute of Public Health of Serbia “Dr Milan Jovanović Batut” and Statistical Office of the Republic of Serbia; 2021. p. 1–144.Search in Google Scholar
[69] Kim HC, Cho SMJ, Lee H, Lee HH, Baek J, Heo JE. Korea hypertension fact sheet 2020: Analysis of nationwide population-based data. Clin Hypertens. 2021;27:8. 10.1186/s40885-021-00166-2.Search in Google Scholar PubMed PubMed Central
[70] Campbell NRC, Sheldon T. The Canadian effort to prevent and control hypertension: Can other countries adopt Canadian strategies? Curr Opin Cardiol. 2010;25(4):366–72. 10.1097/HCO.0b013e32833a3632.Search in Google Scholar PubMed
© 2025 the author(s), published by De Gruyter
This work is licensed under the Creative Commons Attribution 4.0 International License.
Articles in the same Issue
- Research Articles
- Seismic response and damage model analysis of rocky slopes with weak interlayers
- Multi-scenario simulation and eco-environmental effect analysis of “Production–Living–Ecological space” based on PLUS model: A case study of Anyang City
- Remote sensing estimation of chlorophyll content in rape leaves in Weibei dryland region of China
- GIS-based frequency ratio and Shannon entropy modeling for landslide susceptibility mapping: A case study in Kundah Taluk, Nilgiris District, India
- Natural gas origin and accumulation of the Changxing–Feixianguan Formation in the Puguang area, China
- Spatial variations of shear-wave velocity anomaly derived from Love wave ambient noise seismic tomography along Lembang Fault (West Java, Indonesia)
- Evaluation of cumulative rainfall and rainfall event–duration threshold based on triggering and non-triggering rainfalls: Northern Thailand case
- Pixel and region-oriented classification of Sentinel-2 imagery to assess LULC dynamics and their climate impact in Nowshera, Pakistan
- The use of radar-optical remote sensing data and geographic information system–analytical hierarchy process–multicriteria decision analysis techniques for revealing groundwater recharge prospective zones in arid-semi arid lands
- Effect of pore throats on the reservoir quality of tight sandstone: A case study of the Yanchang Formation in the Zhidan area, Ordos Basin
- Hydroelectric simulation of the phreatic water response of mining cracked soil based on microbial solidification
- Spatial-temporal evolution of habitat quality in tropical monsoon climate region based on “pattern–process–quality” – a case study of Cambodia
- Early Permian to Middle Triassic Formation petroleum potentials of Sydney Basin, Australia: A geochemical analysis
- Micro-mechanism analysis of Zhongchuan loess liquefaction disaster induced by Jishishan M6.2 earthquake in 2023
- Prediction method of S-wave velocities in tight sandstone reservoirs – a case study of CO2 geological storage area in Ordos Basin
- Ecological restoration in valley area of semiarid region damaged by shallow buried coal seam mining
- Hydrocarbon-generating characteristics of Xujiahe coal-bearing source rocks in the continuous sedimentary environment of the Southwest Sichuan
- Hazard analysis of future surface displacements on active faults based on the recurrence interval of strong earthquakes
- Structural characterization of the Zalm district, West Saudi Arabia, using aeromagnetic data: An approach for gold mineral exploration
- Research on the variation in the Shields curve of silt initiation
- Reuse of agricultural drainage water and wastewater for crop irrigation in southeastern Algeria
- Assessing the effectiveness of utilizing low-cost inertial measurement unit sensors for producing as-built plans
- Analysis of the formation process of a natural fertilizer in the loess area
- Machine learning methods for landslide mapping studies: A comparative study of SVM and RF algorithms in the Oued Aoulai watershed (Morocco)
- Chemical dissolution and the source of salt efflorescence in weathering of sandstone cultural relics
- Molecular simulation of methane adsorption capacity in transitional shale – a case study of Longtan Formation shale in Southern Sichuan Basin, SW China
- Evolution characteristics of extreme maximum temperature events in Central China and adaptation strategies under different future warming scenarios
- Estimating Bowen ratio in local environment based on satellite imagery
- 3D fusion modeling of multi-scale geological structures based on subdivision-NURBS surfaces and stratigraphic sequence formalization
- Comparative analysis of machine learning algorithms in Google Earth Engine for urban land use dynamics in rapidly urbanizing South Asian cities
- Study on the mechanism of plant root influence on soil properties in expansive soil areas
- Simulation of seismic hazard parameters and earthquakes source mechanisms along the Red Sea rift, western Saudi Arabia
- Tectonics vs sedimentation in foredeep basins: A tale from the Oligo-Miocene Monte Falterona Formation (Northern Apennines, Italy)
- Investigation of landslide areas in Tokat-Almus road between Bakımlı-Almus by the PS-InSAR method (Türkiye)
- Predicting coastal variations in non-storm conditions with machine learning
- Cross-dimensional adaptivity research on a 3D earth observation data cube model
- Geochronology and geochemistry of late Paleozoic volcanic rocks in eastern Inner Mongolia and their geological significance
- Spatial and temporal evolution of land use and habitat quality in arid regions – a case of Northwest China
- Ground-penetrating radar imaging of subsurface karst features controlling water leakage across Wadi Namar dam, south Riyadh, Saudi Arabia
- Rayleigh wave dispersion inversion via modified sine cosine algorithm: Application to Hangzhou, China passive surface wave data
- Fractal insights into permeability control by pore structure in tight sandstone reservoirs, Heshui area, Ordos Basin
- Debris flow hazard characteristic and mitigation in Yusitong Gully, Hengduan Mountainous Region
- Research on community characteristics of vegetation restoration in hilly power engineering based on multi temporal remote sensing technology
- Identification of radial drainage networks based on topographic and geometric features
- Trace elements and melt inclusion in zircon within the Qunji porphyry Cu deposit: Application to the metallogenic potential of the reduced magma-hydrothermal system
- Pore, fracture characteristics and diagenetic evolution of medium-maturity marine shales from the Silurian Longmaxi Formation, NE Sichuan Basin, China
- Study of the earthquakes source parameters, site response, and path attenuation using P and S-waves spectral inversion, Aswan region, south Egypt
- Source of contamination and assessment of potential health risks of potentially toxic metal(loid)s in agricultural soil from Al Lith, Saudi Arabia
- Regional spatiotemporal evolution and influencing factors of rural construction areas in the Nanxi River Basin via GIS
- An efficient network for object detection in scale-imbalanced remote sensing images
- Effect of microscopic pore–throat structure heterogeneity on waterflooding seepage characteristics of tight sandstone reservoirs
- Environmental health risk assessment of Zn, Cd, Pb, Fe, and Co in coastal sediments of the southeastern Gulf of Aqaba
- A modified Hoek–Brown model considering softening effects and its applications
- Evaluation of engineering properties of soil for sustainable urban development
- The spatio-temporal characteristics and influencing factors of sustainable development in China’s provincial areas
- Application of a mixed additive and multiplicative random error model to generate DTM products from LiDAR data
- Gold vein mineralogy and oxygen isotopes of Wadi Abu Khusheiba, Jordan
- Prediction of surface deformation time series in closed mines based on LSTM and optimization algorithms
- 2D–3D Geological features collaborative identification of surrounding rock structural planes in hydraulic adit based on OC-AINet
- Spatiotemporal patterns and drivers of Chl-a in Chinese lakes between 1986 and 2023
- Land use classification through fusion of remote sensing images and multi-source data
- Nexus between renewable energy, technological innovation, and carbon dioxide emissions in Saudi Arabia
- Analysis of the spillover effects of green organic transformation on sustainable development in ethnic regions’ agriculture and animal husbandry
- Factors impacting spatial distribution of black and odorous water bodies in Hebei
- Large-scale shaking table tests on the liquefaction and deformation responses of an ultra-deep overburden
- Impacts of climate change and sea-level rise on the coastal geological environment of Quang Nam province, Vietnam
- Reservoir characterization and exploration potential of shale reservoir near denudation area: A case study of Ordovician–Silurian marine shale, China
- Seismic prediction of Permian volcanic rock reservoirs in Southwest Sichuan Basin
- Application of CBERS-04 IRS data to land surface temperature inversion: A case study based on Minqin arid area
- Geological characteristics and prospecting direction of Sanjiaoding gold mine in Saishiteng area
- Research on the deformation prediction model of surrounding rock based on SSA-VMD-GRU
- Geochronology, geochemical characteristics, and tectonic significance of the granites, Menghewula, Southern Great Xing’an range
- Hazard classification of active faults in Yunnan base on probabilistic seismic hazard assessment
- Characteristics analysis of hydrate reservoirs with different geological structures developed by vertical well depressurization
- Estimating the travel distance of channelized rock avalanches using genetic programming method
- Landscape preferences of hikers in Three Parallel Rivers Region and its adjacent regions by content analysis of user-generated photography
- New age constraints of the LGM onset in the Bohemian Forest – Central Europe
- Characteristics of geological evolution based on the multifractal singularity theory: A case study of Heyu granite and Mesozoic tectonics
- Soil water content and longitudinal microbiota distribution in disturbed areas of tower foundations of power transmission and transformation projects
- Oil accumulation process of the Kongdian reservoir in the deep subsag zone of the Cangdong Sag, Bohai Bay Basin, China
- Investigation of velocity profile in rock–ice avalanche by particle image velocimetry measurement
- Optimizing 3D seismic survey geometries using ray tracing and illumination modeling: A case study from Penobscot field
- Sedimentology of the Phra That and Pha Daeng Formations: A preliminary evaluation of geological CO2 storage potential in the Lampang Basin, Thailand
- Improved classification algorithm for hyperspectral remote sensing images based on the hybrid spectral network model
- Map analysis of soil erodibility rates and gully erosion sites in Anambra State, South Eastern Nigeria
- Identification and driving mechanism of land use conflict in China’s South-North transition zone: A case study of Huaihe River Basin
- Evaluation of the impact of land-use change on earthquake risk distribution in different periods: An empirical analysis from Sichuan Province
- A test site case study on the long-term behavior of geotextile tubes
- An experimental investigation into carbon dioxide flooding and rock dissolution in low-permeability reservoirs of the South China Sea
- Detection and semi-quantitative analysis of naphthenic acids in coal and gangue from mining areas in China
- Comparative effects of olivine and sand on KOH-treated clayey soil
- YOLO-MC: An algorithm for early forest fire recognition based on drone image
- Earthquake building damage classification based on full suite of Sentinel-1 features
- Potential landslide detection and influencing factors analysis in the upper Yellow River based on SBAS-InSAR technology
- Assessing green area changes in Najran City, Saudi Arabia (2013–2022) using hybrid deep learning techniques
- An advanced approach integrating methods to estimate hydraulic conductivity of different soil types supported by a machine learning model
- Hybrid methods for land use and land cover classification using remote sensing and combined spectral feature extraction: A case study of Najran City, KSA
- Streamlining digital elevation model construction from historical aerial photographs: The impact of reference elevation data on spatial accuracy
- Analysis of urban expansion patterns in the Yangtze River Delta based on the fusion impervious surfaces dataset
- A metaverse-based visual analysis approach for 3D reservoir models
- Late Quaternary record of 100 ka depositional cycles on the Larache shelf (NW Morocco)
- Integrated well-seismic analysis of sedimentary facies distribution: A case study from the Mesoproterozoic, Ordos Basin, China
- Study on the spatial equilibrium of cultural and tourism resources in Macao, China
- Urban road surface condition detecting and integrating based on the mobile sensing framework with multi-modal sensors
- Application of improved sine cosine algorithm with chaotic mapping and novel updating methods for joint inversion of resistivity and surface wave data
- The synergistic use of AHP and GIS to assess factors driving forest fire potential in a peat swamp forest in Thailand
- Dynamic response analysis and comprehensive evaluation of cement-improved aeolian sand roadbed
- Rock control on evolution of Khorat Cuesta, Khorat UNESCO Geopark, Northeastern Thailand
- Gradient response mechanism of carbon storage: Spatiotemporal analysis of economic-ecological dimensions based on hybrid machine learning
- Comparison of several seismic active earth pressure calculation methods for retaining structures
- Mantle dynamics and petrogenesis of Gomer basalts in the Northwestern Ethiopia: A geochemical perspective
- Study on ground deformation monitoring in Xiong’an New Area from 2021 to 2023 based on DS-InSAR
- Paleoenvironmental characteristics of continental shale and its significance to organic matter enrichment: Taking the fifth member of Xujiahe Formation in Tianfu area of Sichuan Basin as an example
- Equipping the integral approach with generalized least squares to reconstruct relict channel profile and its usage in the Shanxi Rift, northern China
- InSAR-driven landslide hazard assessment along highways in hilly regions: A case-based validation approach
- Attribution analysis of multi-temporal scale surface streamflow changes in the Ganjiang River based on a multi-temporal Budyko framework
- Maps analysis of Najran City, Saudi Arabia to enhance agricultural development using hybrid system of ANN and multi-CNN models
- Hybrid deep learning with a random forest system for sustainable agricultural land cover classification using DEM in Najran, Saudi Arabia
- Long-term evolution patterns of groundwater depth and lagged response to precipitation in a complex aquifer system: Insights from Huaibei Region, China
- Remote sensing and machine learning for lithology and mineral detection in NW, Pakistan
- Spatial–temporal variations of NO2 pollution in Shandong Province based on Sentinel-5P satellite data and influencing factors
- Numerical modeling of geothermal energy piles with sensitivity and parameter variation analysis of a case study
- Stability analysis of valley-type upstream tailings dams using a 3D model
- Variation characteristics and attribution analysis of actual evaporation at monthly time scale from 1982 to 2019 in Jialing River Basin, China
- Investigating machine learning and statistical approaches for landslide susceptibility mapping in Minfeng County, Xinjiang
- Investigating spatiotemporal patterns for comprehensive accessibility of service facilities by location-based service data in Nanjing (2016–2022)
- A pre-treatment method for particle size analysis of fine-grained sedimentary rocks, Bohai Bay Basin, China
- Study on the formation mechanism of the hard-shell layer of liquefied silty soil
- Comprehensive analysis of agricultural CEE: Efficiency assessment, mechanism identification, and policy response – A case study of Anhui Province
- Simulation study on the damage and failure mechanism of the surrounding rock in sanded dolomite tunnels
- Towards carbon neutrality: Spatiotemporal evolution and key influences on agricultural ecological efficiency in Northwest China
- High-frequency cycles drive the cyclical enrichment of oil in porous carbonate reservoirs: A case study of the Khasib Formation in E Oilfield, Mesopotamian Basin, Iraq
- Reconstruction of digital core models of granular rocks using mathematical morphology
- Spatial–temporal differentiation law of habitat quality and its driving mechanism in the typical plateau areas of the Loess Plateau in the recent 30 years
- A machine-learning-based approach to predict potential oil sites: Conceptual framework and experimental evaluation
- Effects of landscape pattern change on waterbird diversity in Xianghai Nature Reserve
- Research on intelligent classification method of highway tunnel surrounding rock classification based on parameters while drilling
- River morphology and tectono-sedimentary analysis of a shallow river delta: A case study of Putaohua oil layer in Saertu oilfield (L. Cretaceous), China
- Review Articles
- Humic substances influence on the distribution of dissolved iron in seawater: A review of electrochemical methods and other techniques
- Applications of physics-informed neural networks in geosciences: From basic seismology to comprehensive environmental studies
- Ore-controlling structures of granite-related uranium deposits in South China: A review
- Shallow geological structure features in Balikpapan Bay East Kalimantan Province – Indonesia
- A review on the tectonic affinity of microcontinents and evolution of the Proto-Tethys Ocean in Northeastern Tibet
- Advancements in machine learning applications for mineral prospecting and geophysical inversion: A review
- Special Issue: Natural Resources and Environmental Risks: Towards a Sustainable Future - Part II
- Depopulation in the Visok micro-region: Toward demographic and economic revitalization
- Special Issue: Geospatial and Environmental Dynamics - Part II
- Advancing urban sustainability: Applying GIS technologies to assess SDG indicators – a case study of Podgorica (Montenegro)
- Spatiotemporal and trend analysis of common cancers in men in Central Serbia (1999–2021)
- Minerals for the green agenda, implications, stalemates, and alternatives
- Spatiotemporal water quality analysis of Vrana Lake, Croatia
- Functional transformation of settlements in coal exploitation zones: A case study of the municipality of Stanari in Republic of Srpska (Bosnia and Herzegovina)
- Hypertension in AP Vojvodina (Northern Serbia): A spatio-temporal analysis of patients at the Institute for Cardiovascular Diseases of Vojvodina
- Regional patterns in cause-specific mortality in Montenegro, 1991–2019
- Spatio-temporal analysis of flood events using GIS and remote sensing-based approach in the Ukrina River Basin, Bosnia and Herzegovina
- Flash flood susceptibility mapping using LiDAR-Derived DEM and machine learning algorithms: Ljuboviđa case study, Serbia
- Geocultural heritage as a basis for geotourism development: Banjska Monastery, Zvečan (Serbia)
- Assessment of groundwater potential zones using GIS and AHP techniques – A case study of the zone of influence of Kolubara Mining Basin
- Impact of the agri-geographical transformation of rural settlements on the geospatial dynamics of soil erosion intensity in municipalities of Central Serbia
- Where faith meets geomorphology: The cultural and religious significance of geodiversity explored through geospatial technologies
- Applications of local climate zone classification in European cities: A review of in situ and mobile monitoring methods in urban climate studies
- Complex multivariate water quality impact assessment on Krivaja River
- Ionization hotspots near waterfalls in Eastern Serbia’s Stara Planina Mountain
- Shift in landscape use strategies during the transition from the Bronze age to Iron age in Northwest Serbia
- Assessing the geotourism potential of glacial lakes in Plav, Montenegro: A multi-criteria assessment by using the M-GAM model
- Flash flood potential index at national scale: Susceptibility assessment within catchments
- SWAT modelling and MCDM for spatial valuation in small hydropower planning
- Disaster risk perception and local resilience near the “Duboko” landfill: Challenges of governance, management, trust, and environmental communication in Serbia