
Dynamic response analysis and comprehensive evaluation of cement-improved aeolian sand roadbed
-
Yonggang Wang
 ,
Xunchang Li
,
Xunchang Li

Abstract
Long-term stability of high-speed railway roadbeds is a complex multi-criteria decision-making problem. The stability of cement-improved sandy roadbeds is investigated and evaluated in order to efficiently identify and control risk, assure train safety, and optimize resource allocation. This study relies on bibliometric analysis to filter out roadbed assessment indexes and create an evaluation index system. The Analytic Hierarchy Process-Technique for Order Preference by Similarity to Ideal Solution evaluation model is established, and finite element software is used to simulate the actual project, allowing for dynamic stability analysis of the roadbed and lateral comparison of each scheme. The roadbed’s dynamic stability analysis and lateral comparison are completed, as well as the analysis and optimization of the roadbed parameters. The results reveal that a 3:7 pulverized soil ratio and 6% cement mixing improve roadbed stability by 5%. The effect of cement was larger than that of silt. The proposed model’s evaluation results were similar to the field test, demonstrating its dependability, and the research findings can be used to construct a cement-improved aeolian sand high-speed train foundation.
1 Introduction
The roadbed of a high-speed rail (HSR) is impacted by both train load and environmental conditions throughout long-term service. Stability of the roadbed affects the HSR’s long-term performance and train safety. For example, the high-speed railway roadbed of the Daxi Passenger Dedicated Line may cause dynamic instability due to differential settlement of strata on both sides of ground cracks, and freight train derailment accidents have occurred on the Dazheng Line due to train vibration, insufficient roadbed stability, and line maintenance issues. Therefore, in order to screen the influencing factors of roadbed disease, screen the risk, and reduce the potential loss, it is especially important to establish the roadbed risk evaluation, which can better understand the behavior of roadbed under different geological conditions, environmental factors, and loads, and provide a scientific basis for the design of the roadbed to reduce the occurrence of accidents.
Because of the scarcity of excellent fillers in the western desert region, the use of improved soil of aeolian sand as roadbed fill for high-speed railroads is an economic and practical measure [1], which can adapt to large temperature changes and a dry environment, as well as solve environmental problems in the desert region while lowering project costs. However, aeolian sand has tiny particles and a loose structure [2] and is classified as a Group C filler, which has a negative impact on the stability and bearing capacity of railroad roadbeds. The project improves the overall quality of the high-speed train roadbed by managing important admixtures such as cement admixture, pulverized soil ratio, fly ash, and water content [3,4,5,6,7], ensuring the roadbed’s stability and reliability. Some experts have conducted research on the suitability and durability of aeolian sand enhanced soil as a high-speed railroad base. Through on-site tests, Liu et al. [8] showed that the vibration damping capacity of reinforced aeolian sand roadbed is superior to that of gravel soil roadbed, establishing the foundation for desert roadbed construction. California bearing ratio is also commonly utilized in road engineering and foundation design to quantify the material’s performance improvement [9,10,11]. Dapeng et al. [12] created a 1:1 full-scale model of a low embankment, tested it under various loading conditions, and compared the stress attenuation rate and diffusion capacity of different embankments to study the dynamic response law of the aeolian sand roadbed. Mengqian et al. [13] investigated the change rule of dynamic response under various operating conditions using on-site monitoring and evaluated the deformation of aeolian sand roadbed to fulfill specification criteria using the critical dynamic stress formula. Yang et al. [14] and Zhang et al. [15] conducted a triaxial test with material proportioning to investigate the change in shear strength and the strength change rule of improved aeolian sand. They discovered that the shear strength increased with the incorporation of pulverized soil and additives, and elaborated on the trend and feasibility of the incorporation for improving the performance of aeolian sand-improved soil. Cabalar and Karabash [16] investigated the effects of five different sample preparation techniques, including different curing pressures, times, and stress conditions on mechanical response, and used electron microscopy to explain the mechanism of their effects, providing data support for roadbed construction. Chuxuan et al. [17] and Yang [18] discussed the effects of various conditions such as roadbed thickness and reinforcement improvement on the dynamic response of aeolian sandy roadbeds by establishing computational models. The study of different working conditions showed that with the increasing depth of the roadbed layer, the amplitude of dynamic velocity, dynamic acceleration amplitude, and dynamic stress amplitude showed a gradual attenuation; and the treatment approach has a stronger effect on the dynamic response curve’s volatility.
In conclusion, researchers investigated the dynamic response, shear strength change, and other properties of aeolian sand enhanced soil using field tests and numerical simulations. However, the majority of available research focuses on the examination of a single element and does not provide a full evaluation of roadbed stability when numerous factors are coupled. As illustrated in Table 1, a variety of models and approaches are currently being used to analyze roadbed assessment, including the fuzzy comprehensive evaluation method, the approximation ideal solution ranking method, the entropy value method, and others.
Research methods and contents
| Method | Research |
|---|---|
| Game theory – Toppable models | Zhu et al. [19] constructed a new type of stability assessment model for perennial permafrost highway subgrade, which evaluates the four aspects of permafrost type, climatic conditions, geological environment, and engineering conditions, and provides a decision-making basis for the maintenance of perennial permafrost subgrade |
| Gray correlation analysis | Zhang et al. [20] used gray correlation to investigate the effect of pore structure factors on compressive strength in order to develop a model for predicting concrete strength |
| In the research, Liyang et al. [21] used the gray correlation degree method to investigate, selecting the internal friction angle and compression modulus, among other evaluation indexes, and determining the integrated water content acceptable for fly ash roadbed construction | |
| Analytic Hierarchy Process (AHP)-extended Technique for Order Preference by Similarity to Ideal Solution (TOPSIS) | Zheng and Bao [22] evaluated the safety of permafrost roadbeds by the AHP-extended TOPSIS method, and the combination of the two created conditions for the accuracy of roadbed safety evaluation |
| Machine learning algorithms | Bai et al. [23] used machine learning techniques to quantify the form evaluation metrics of longitudinal flatness, edges, and roughness of stacked stone materials for roadbeds, in order to examine the effect of stacked stone particles on roadbed fill settling |
| To determine the optimal ratio for soft soil roadbeds, Li et al. [24] created a strength database of modified fill based on the physical parameters and mechanical properties of the reinforced soft soil, then used machine learning for evaluation and prediction to improve testing efficiency | |
| Entropy | Xin et al. [25] utilized the entropy value method based on the principle of acoustic wave transmission test to assess the quality of roadbed filling and proposed the minimum standard for evaluating the qualified roadbed, which proved the reasonableness of the bubble mixed lightweight filler roadbed |
At the moment, roadbed evaluation is primarily concerned with converting the qualitative description of each indicator into a quantitative expression [26], so addressing the uncertainty in the evaluation process, which necessitates a significant number of expert judgments. Furthermore, the current evaluation indexes are primarily used to evaluate and analyze the stability and filling quality of roadbeds based on material strength and external environment, with an even greater lack of relevant dynamic response indexes, particularly for aeolian sand improved soil research.
To solve the problems listed above, this study uses the evaluation approach to solve the problem of aeolian sand rationing, and the article’s structure is as follows: Section 3 illustrates the construction of the evaluation model, Section 4 introduces engineering and simulation, Section 5 analyzes the evaluation of the dynamic stability of the roadbed and the effect of the improvement, Section 6 discusses the effect of the impacts and the validation of the model, and Section 7 draws the conclusion.
2 Significance of the study
To meet the high standards of high-speed railway roadbed and solve the problem of railroad construction in the western desert area, materials with dynamic stability and low cost are required. In this study, the optimal proportioning scheme is derived using a combination of refined finite element numerical simulation and a comprehensive evaluation model, which reveals the intrinsic law of material proportioning improvement affecting the dynamic response, but it also effectively solves the problem of index selection and scheme preferential selection in multi-criteria decision-making. More importantly, it effectively addresses index selection and program preference issues in multi-criteria decision-making, as well as improving the scientific, comprehensive, and practicality of decision-making. The roadbed analysis provides an effective evaluation approach for roadbed design, as well as data support for material selection and design of cement-improved sandy roadbed, which is critical technical support for railroad construction in the western desert area. However, in the actual project, the climatic and geological circumstances of different places vary widely, and a single material ratio may not be sufficient to suit all technical requirements. In the future, the specific environmental conditions of different regions can be used to further refine the prediction of the proportioning and design of aeolian sand-improved materials to improve their adaptability and engineering performance, resulting in more projects promoting aeolian sand-improved technology.
3 Establishment of evaluation model
3.1 Data collection
Bibliometrics is a quantitative way of studying scientific literature that looks for patterns and trends in scientific activities by counting and analyzing a range of data in the literature, such as authors, keywords, and citation counts. Knowledge mapping is a way of portraying knowledge in the form of a graph that displays the fundamental connectedness and structure of knowledge by creating a network of entities and inter-entity links. The steps are as follows:
Data collection: Identify the research topic and gather relevant literature data, such as academic articles, specifications, and accident reports.
Data organization and statistics: Categorize, code, and format the acquired literature, and analyze the data using statistical methods such as frequency analysis, co-occurrence analysis, and citation analysis.
Data analysis: It includes integrating and storing knowledge, resolving ambiguities and conflicts between entities, applying graph algorithms to reason about the knowledge graph, and discovering new knowledge and relationships.
Visualization: Use visualization tools to display the knowledge graph and reveal the research object’s development pattern.
3.2 AHP evaluation method
The AHP technique is an assignment method that uses expert weights to determine the relevance of the indicator evaluation. The computation steps are as follows. First, the hierarchical analysis model is created, which includes the goal, criterion, and program layers. The program layer’s indicators are used to create the n × n judgment matrix A.
where a ij is the quantitative value of the relative importance of criterion i and criterion j. The importance scaling methods are shown in Table 2, and values are usually taken according to the Saaty 1–9 scale method table.
Scale value method
| Scale | Meaning (i compared to j) |
|---|---|
| 1 | Both are equally important |
| 3 | The former is slightly more important than the latter |
| 5 | The former is obviously more important than the latter |
| 7 | The former is more important than the latter |
| 9 | The former is strongly more important than the latter |
| 2, 4, 6, 8 | The median value in the adjacency judgment above |
Formula (1) identifies the eigenvector ω for the criterion layer.
The consistency test evaluates whether the results of several tests for the same research item are consistent (where n is the number of indicators at the criterion level). The consistency test index (C R ) is defined as
When C R < 0.1, then the judgment matrix passes the consistency test.
3.3 TOPSIS evaluation method
The TOPSIS [27] evaluation approach sorts evaluation items by calculating the distance between the ideal solution and the negative ideal solution in order to evaluate the advantages and disadvantages of each evaluation object. TOPSIS, as a multi-objective decision analysis and assessment method, can fully utilize index data and has high objectivity. It is commonly used for objectively evaluating engineering designs. The calculations are as follows:
Create a decision matrix Y = (y ij ) m×n using the indicator data from each evaluation program.
where y ij represents the value of program i in relation to evaluation indication j, m is the number of evaluated programs, and n is the number of evaluation indicators.
Data standardization processing:
The lower the value of the indicator, the better the indicator, using formula (4) for positive processing
(4)The larger the value of the indicator, the better the indicator, using formula (5) for negative processing
(5)In order to eliminate the influence of different scales of the evaluation indicators, the positive decision matrix Y′ is standardized, and the standardized decision matrix Z = (y ij ) m×n is obtained
Determine the positive and negative ideal solutions
The ideal solution Z + = {z 1+, z 2+, …, z n+}is the set of maximum values corresponding to each index in the weighted gauge matrix, and the negative ideal solution Z − = {z 1−, z 2−, …, z n−} is the set of minimum values corresponding to each index in the weighted gauge matrix.
Calculate the score
The distance from scheme i to the positive ideal solution is defined as
(6)(7)
The larger the relative sticking point C i is, the closer the sample point is to the positive ideal solution, and the better the result of the comprehensive evaluation.
3.4 AHP-TOPSIS method model
To evaluate and analyze cement upgraded aeolian sand high railway foundations, a complete assessment model based on AHP-TOPSIS was developed. Figure 1 illustrates the specific technique.
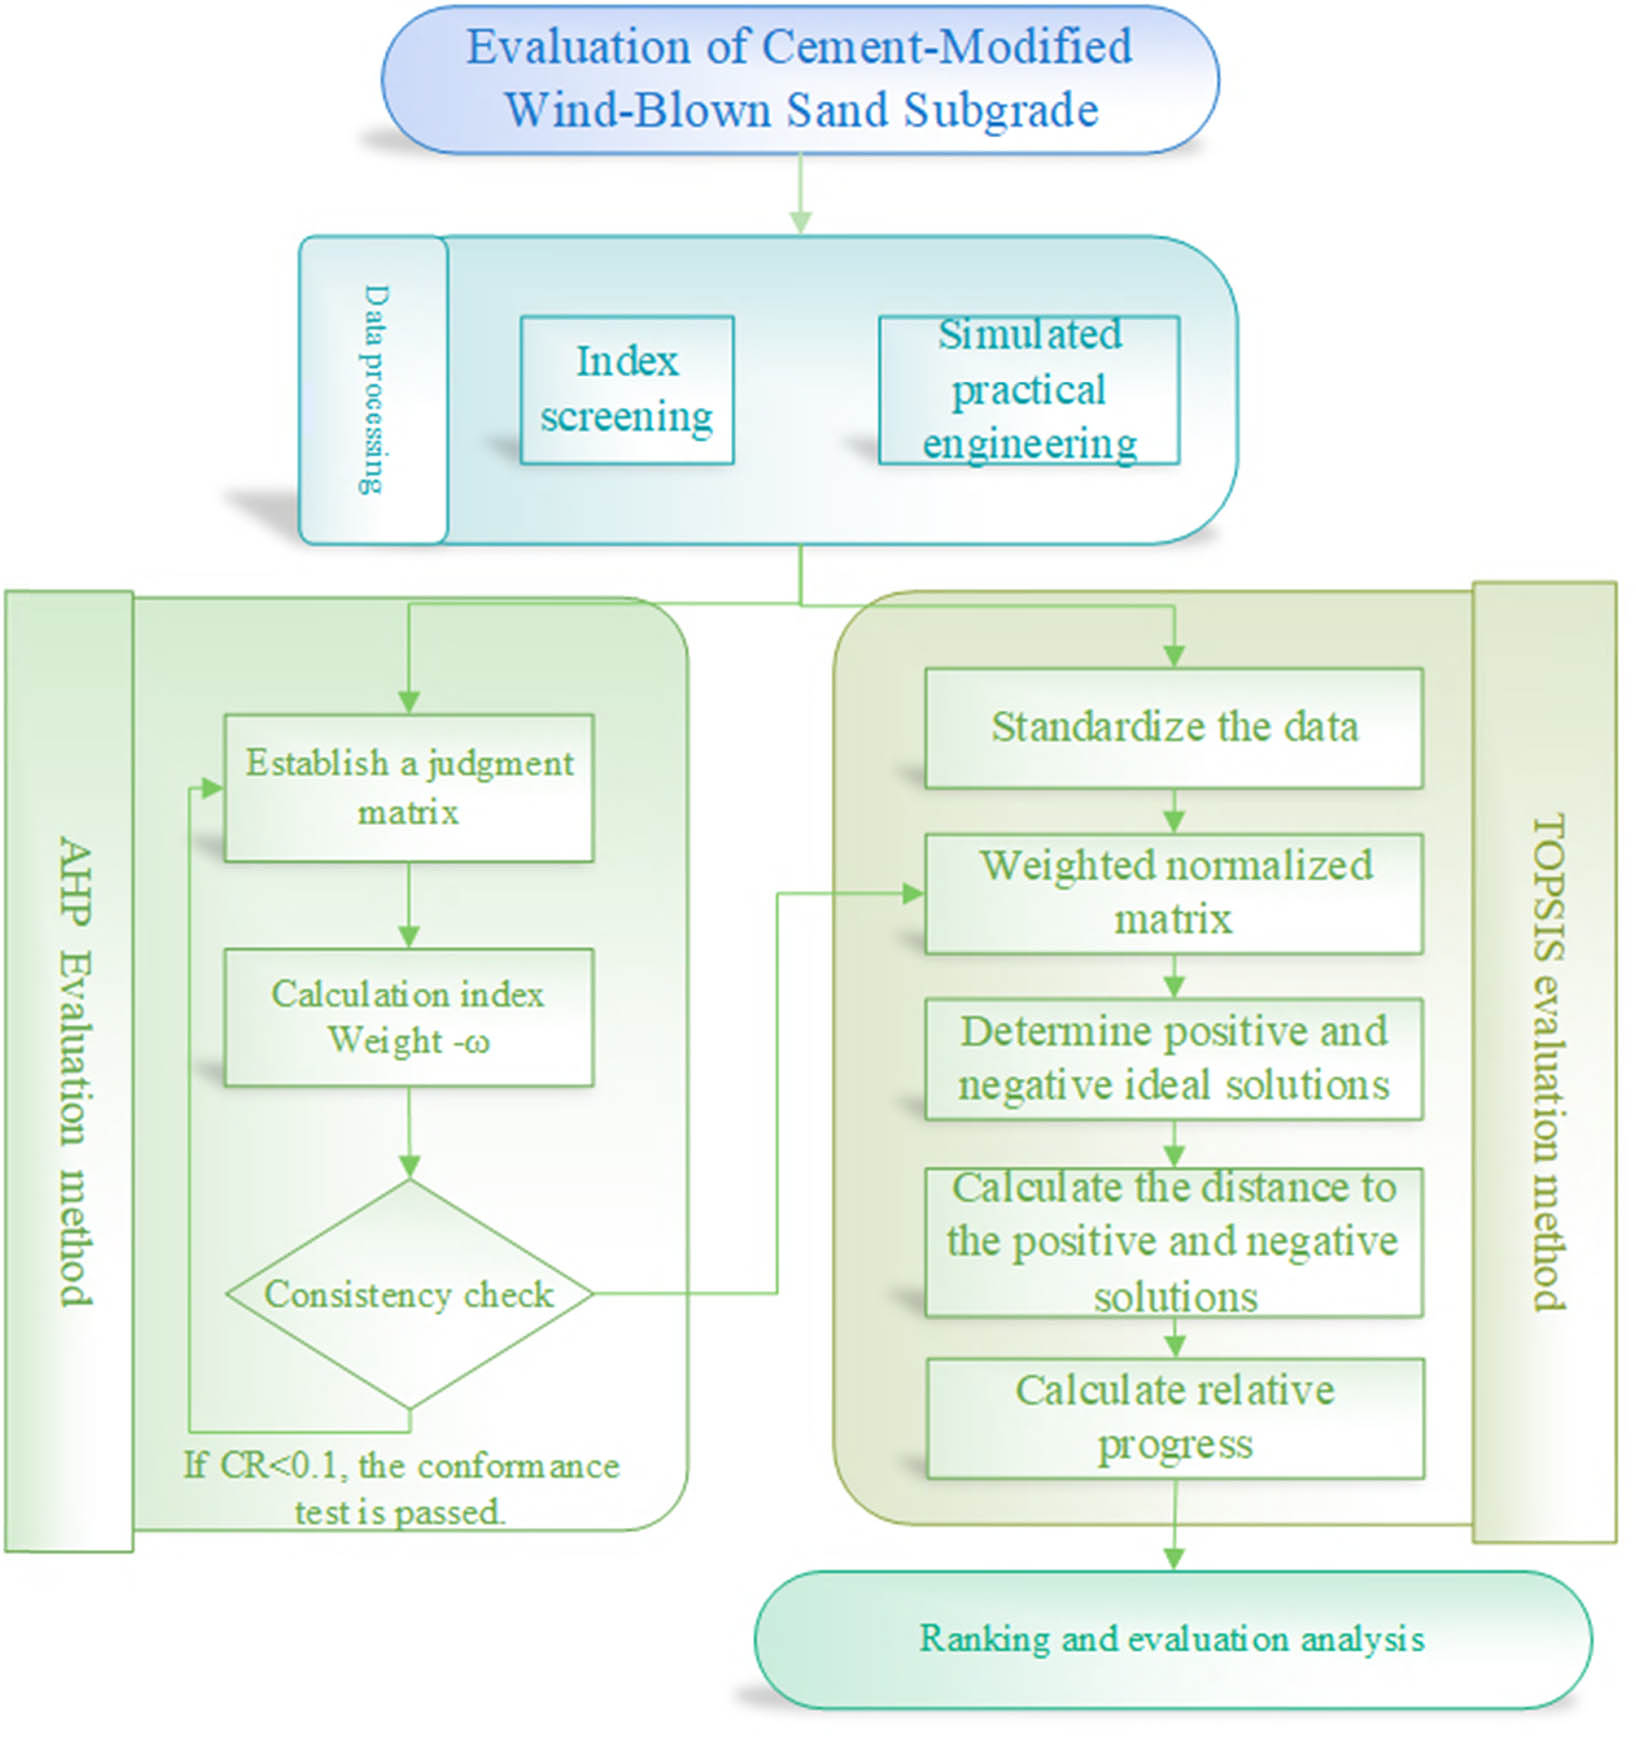
The flowchart of the evaluation model.
4 Example analysis
4.1 Project example
Baoyin Railway starts from Baotou, which is an important railroad trunk line connecting Baotou City of Inner Mongolia Autonomous Region and Yinchuan City of Ningxia Hui Autonomous Region, with a total line length of 519 km and a design speed of 250 km/h. The railroad is located on the edge of the Ulan Buh Desert, which is a dry area with little annual precipitation and high evaporation. The region where it is located is the edge of Ulan Buh Desert, which has an arid climate, scanty annual precipitation, high evaporation, and a significant temperature difference between day and night, and this special geographic and climatic condition poses a serious challenge to railroad construction, due to the lack of qualified AB group filler required for railroad subgrade filling around the area, and in order to save costs, the wind-deposited sand in the desert. Figure 2 depicts the geographic position of Baoyin Railway.
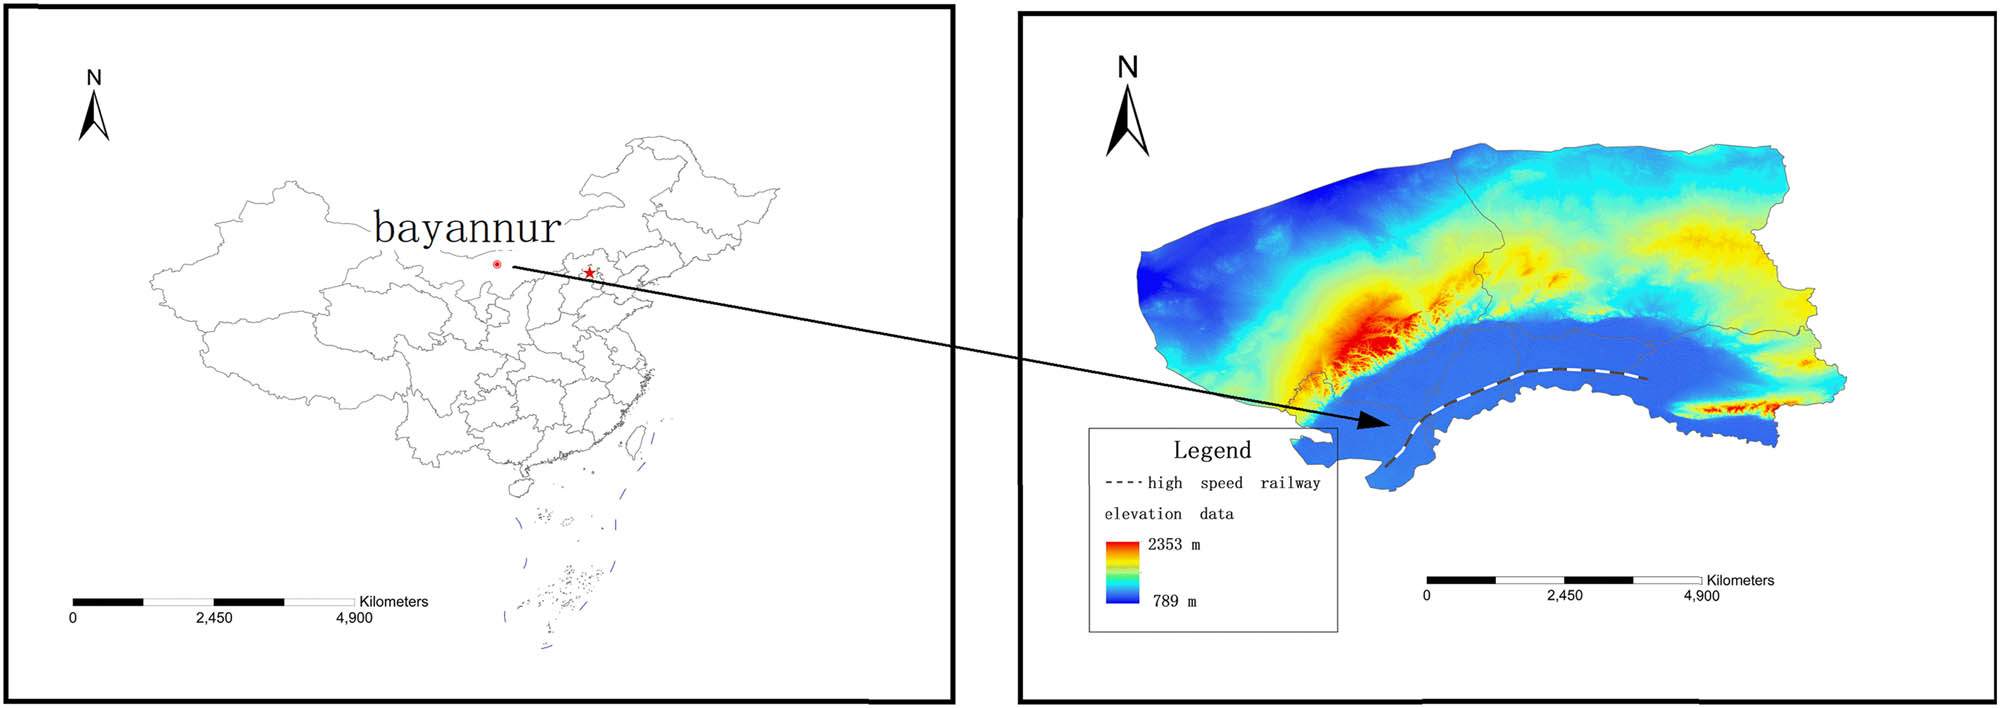
Geographical location information of Baoyin Railway.
This study uses the Baoyin Railway as a backdrop to build a finite element model to investigate the effect of the proportion of aeolian sandy improved soil below the sub-base layer on roadbed stability, and chooses 20–40% of pulverized soil and 4–6% of cement to create nine programs for evaluation and comparison based on the requirements of the design code for high-speed railway, as shown in Table 3.
Simulation scheme
| The scheme | Cement content | Silt ratio | Degree of compaction | E (MPa) | Ψ (°) |
|---|---|---|---|---|---|
| 1 | 4% | 2:8 | 0.98 | 26 | 36.5 |
| 2 | 4% | 3:7 | 46 | 37 | |
| 3 | 4% | 4:6 | 49 | 40 | |
| 4 | 5% | 2:8 | 46 | 37.5 | |
| 5 | 5% | 3:7 | 55 | 38 | |
| 6 | 5% | 4:6 | 59 | 39 | |
| 7 | 6% | 2:8 | 73 | 38.5 | |
| 8 | 6% | 3:7 | 83 | 39 | |
| 9 | 6% | 4:6 | 83 | 39.5 | |
| Symbol | Meaning | ||||
| E | Elastic modulus | ||||
| μ | Poisson’s ratio | ||||
| Ψ | Friction Angle | ||||
4.2 Engineering simulation
Based on GTS-NS, we design ballasted track-roadbed finite dynamic model. According to the actual roadbed, the model consists of railroad track, graded gravel, AB filler, sub-bed, sub-bed and foundation, in which the railroad track consists of rails, sleepers, roadbed, sub-bed, and sub-bed are made of cement-improved airborne sand. The length, width, and height of the model are 100 m × 200 m × 35 m, and the heights of graded gravel, AB filler, the bottom layer of the bedrock, below the bottom layer of the bedrock and foundation level are 0.7, 0.8, 1.5, 2.5, and 30 m, respectively, and the slopes are 1:1.5, which are shown in Figures 3 and 4.
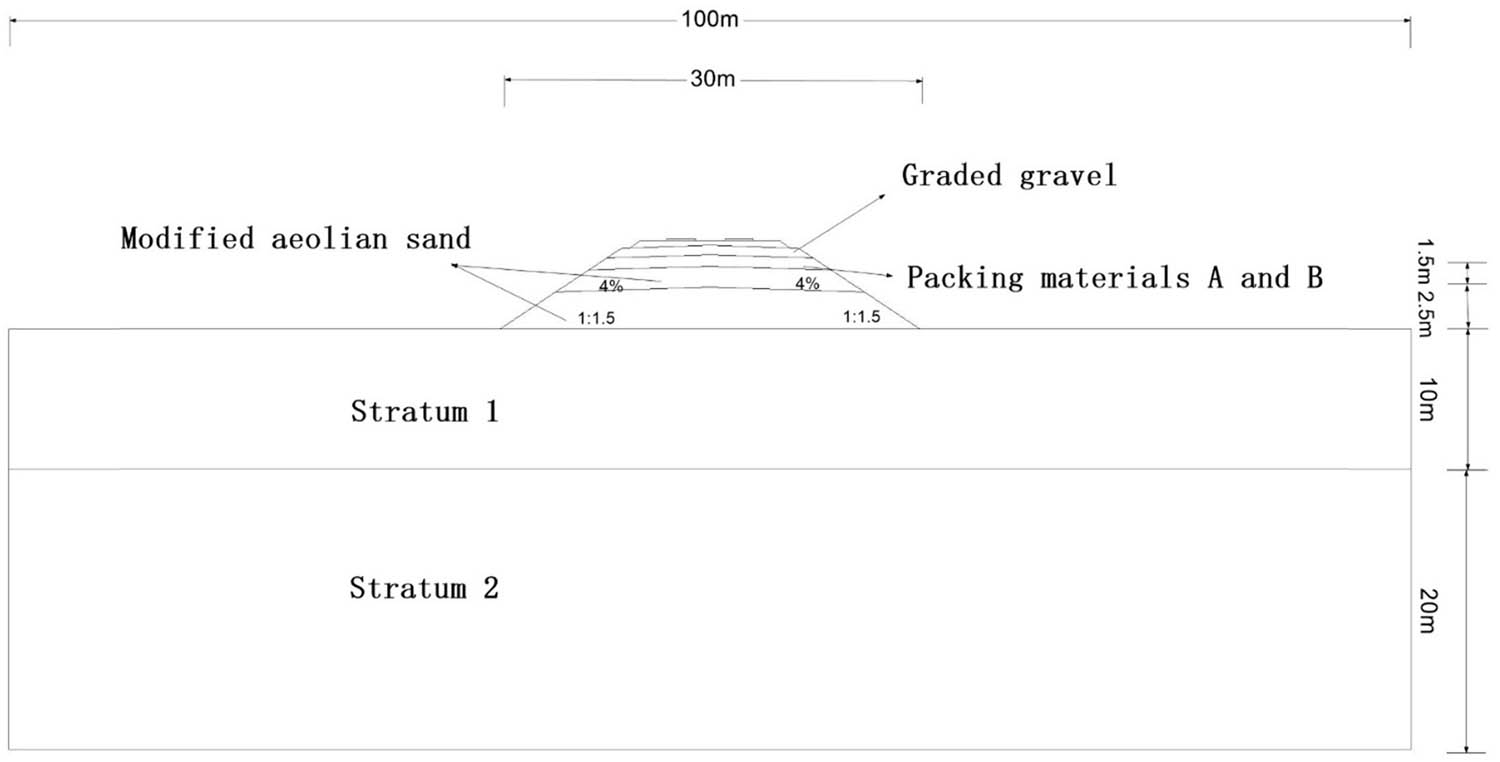
Model profile.
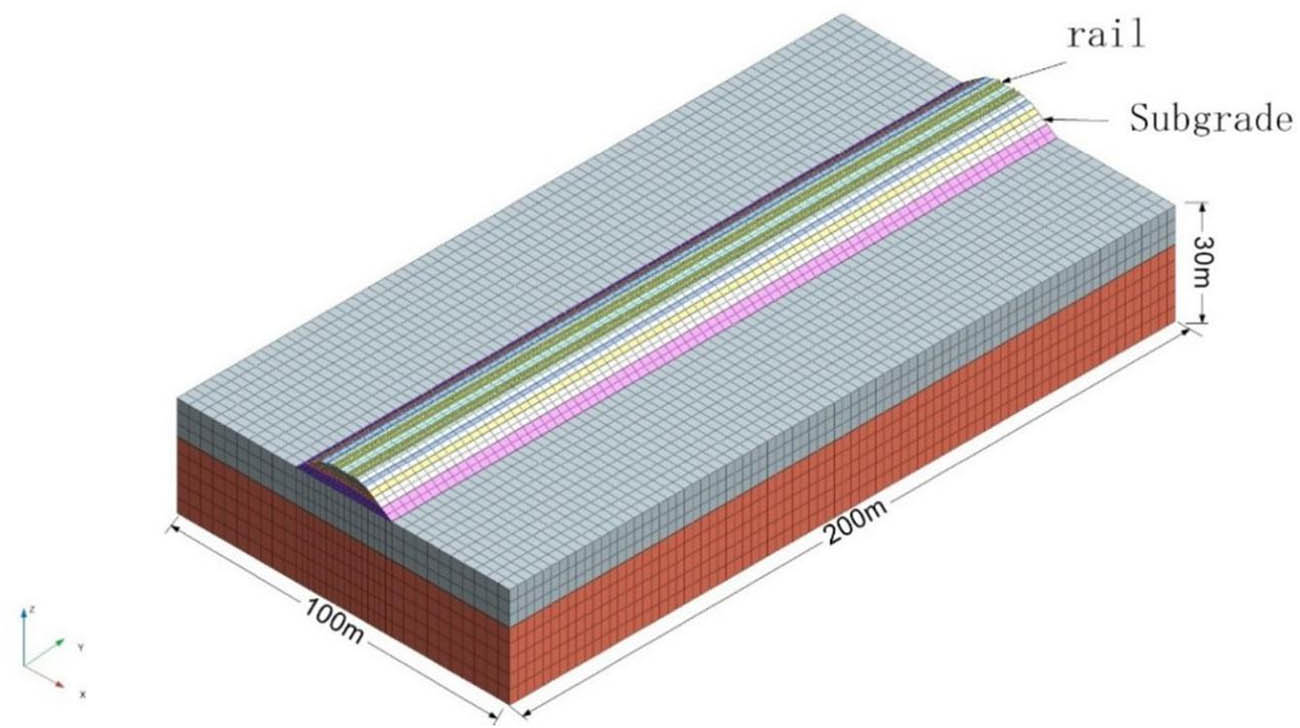
Schematic diagram of the model.
The rails, sleepers, and roadbeds are configured as linear elastic models, while the rail fasteners are simulated using spring-damping units. Mohr-Coulomb models are used for the bed’s surface and bottom layers, as well as stratums 1 and 2. The elastic-viscous boundary is established at the foundation’s edge, considering the boundary vibration at the chosen foundation boundary. Table 4 displays the simulation parameters of the fill materials in each stratum of the roadbed based on the test data and the investigation report [28].
Material parameters
| Properties | ||||||
|---|---|---|---|---|---|---|
| Name | Materials | E (MPa) | μ | Unit weight (kN/m3) | Cohesive force (kPa) | Ψ (°) |
| Rail | / | 2.1 × 10⁵ | 0.3 | 78.3 | / | / |
| Sleeper | / | 1.8 × 10⁴ | 0.3 | 25 | / | / |
| Track bed | / | 710 | 0.17 | 27 | / | / |
| Subgrade surface layer | Graded gravel | 150 | 0.27 | 23 | 75 | 27 |
| Above ground floor | AB packing | 110 | 0.33 | 21 | 55 | 20 |
| Subbed | Aeolian sand improved soil | 87 | 0.33 | 21 | 55 | 20 |
| Formation 1 | Fine sand | 3.46 | 0.32 | 17.6 | 30 | 32 |
| Formation 2 | Sandy soil | 3.5 | 0.33 | 18.6 | 30 | 25 |
In this study, the train is a CRH2A type train set, with a speed of 250 km/h and a length of 201.4 m. The precise train data are provided in Table 5. The simulation uses the real train speed, the vibration time is 3 s, and the train load curve is illustrated in Figure 5.
Train data
| Train parameter | Train data |
|---|---|
| Axle load (t) | 15 |
| Gauge (m) | 1.435 |
| Vehicle distance (m) | 17.5 |
| Wheelbase between two cars (m) | 5.6 |
| Bogie fixed wheelbase (m) | 2.5 |
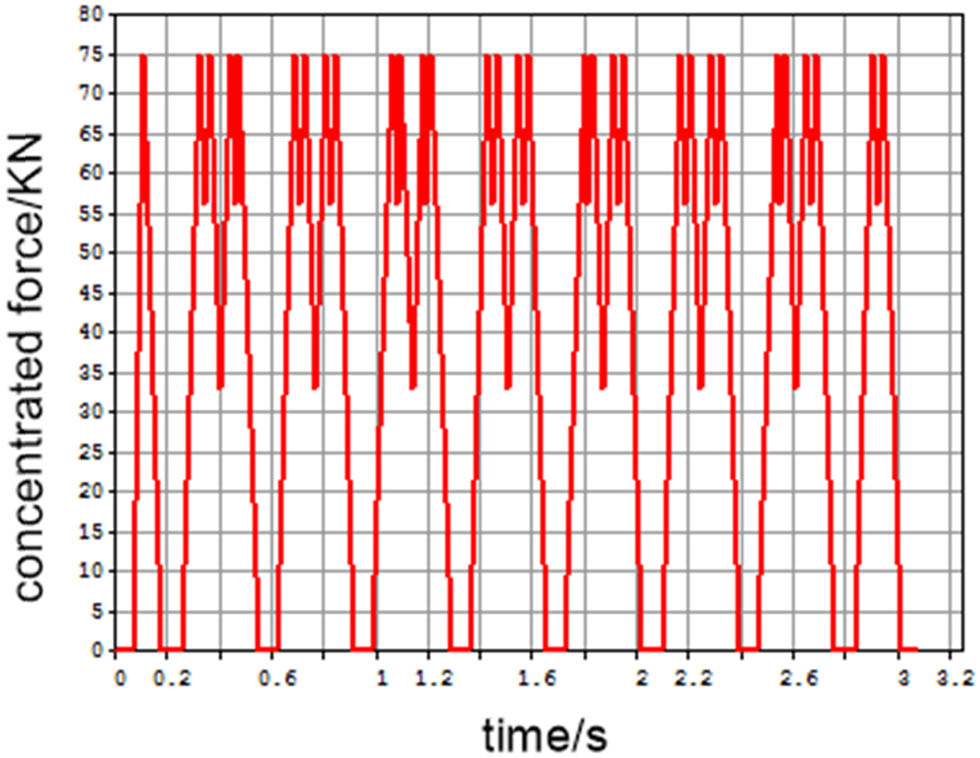
Load time history curve.
5 Comprehensive study of the dynamic stability of the roadbed
5.1 Screening for roadbed stability evaluation indicators
Because cement enhanced sandy roadbed is a complex integrated system, its dynamic stability is influenced by a variety of index parameters. The Baoyin Railway is used as a background for the research.
This study employs the bibliometric analysis approach [29], utilizing Citespace software and picking the Web of Science core database and China Academic Journal Database (CNKI) as data sources for visualization. The advanced search with “roadbed” as the keyword obtained 1,000 pieces of literature, and the keyword analysis is shown in Figure 6. Summarizing the research hotspots of high-speed railroad roadbeds in the past years and the evaluation indexes mentioned in the relevant standards and specifications, the focus of the research on roadbeds and the indexes of the study mainly focus on the static and dynamic characteristics, among which, the resilience modulus, the quality of compaction, the moisture content and the unconfined compressive strength belong to the static and dynamic characteristics, which are the most important. Static characteristics include rebound modulus, compaction quality, moisture content, and unconfined compressive strength, whereas dynamic response refers to the mechanical behavior of a structure or material under dynamic loading, which describes changes in physical quantities such as displacement, velocity, acceleration, and stress.

Analysis of knowledge graph.
At the same time, this study combines the specifications for railway roadbed design [30], technical regulations for observation and evaluation of settlement and deformation of railway engineering [31], and technical regulations for the construction of high-speed railway roadbed engineering [32] with the main research directions and contents of the current literature summarized in the knowledge graph, and establishes the evaluation indexes as shown in Figure 7. Among them, insufficient unconfined compressive strength may result in insufficient bearing capacity of the roadbed, causing settlement, deformation, or even collapse of the roadbed, which is the primary indicator used to test the bearing capacity of materials. Excessive dynamic stress caused by train dynamic load fatigues roadbed material, and long-term accumulation can cause cracking, settling, and other disorders. Surface settlement, lateral displacement, and vertical displacement that are too large may cause track unevenness, trigger bumps, and vibration of the train operation, and, in severe cases, lead to derailment accidents. It is an important index to test the roadbed disease. The specification is also commonly used in the surface displacement to monitor that the design of the roadbed is qualified. Excessive dynamic acceleration may cause fatigue damage to the roadbed material, while long-term buildup may cause cracking, loosening, and other roadbed disorders. Since the modulus of elasticity, angle of internal friction, and cohesion are used as input parameters in the simulation experiment, the unconfined compressive strength, surface settlement, lateral displacement, vertical displacement, lateral acceleration, vertical acceleration, and effective stress are chosen as evaluation indexes to ensure evaluation independence.
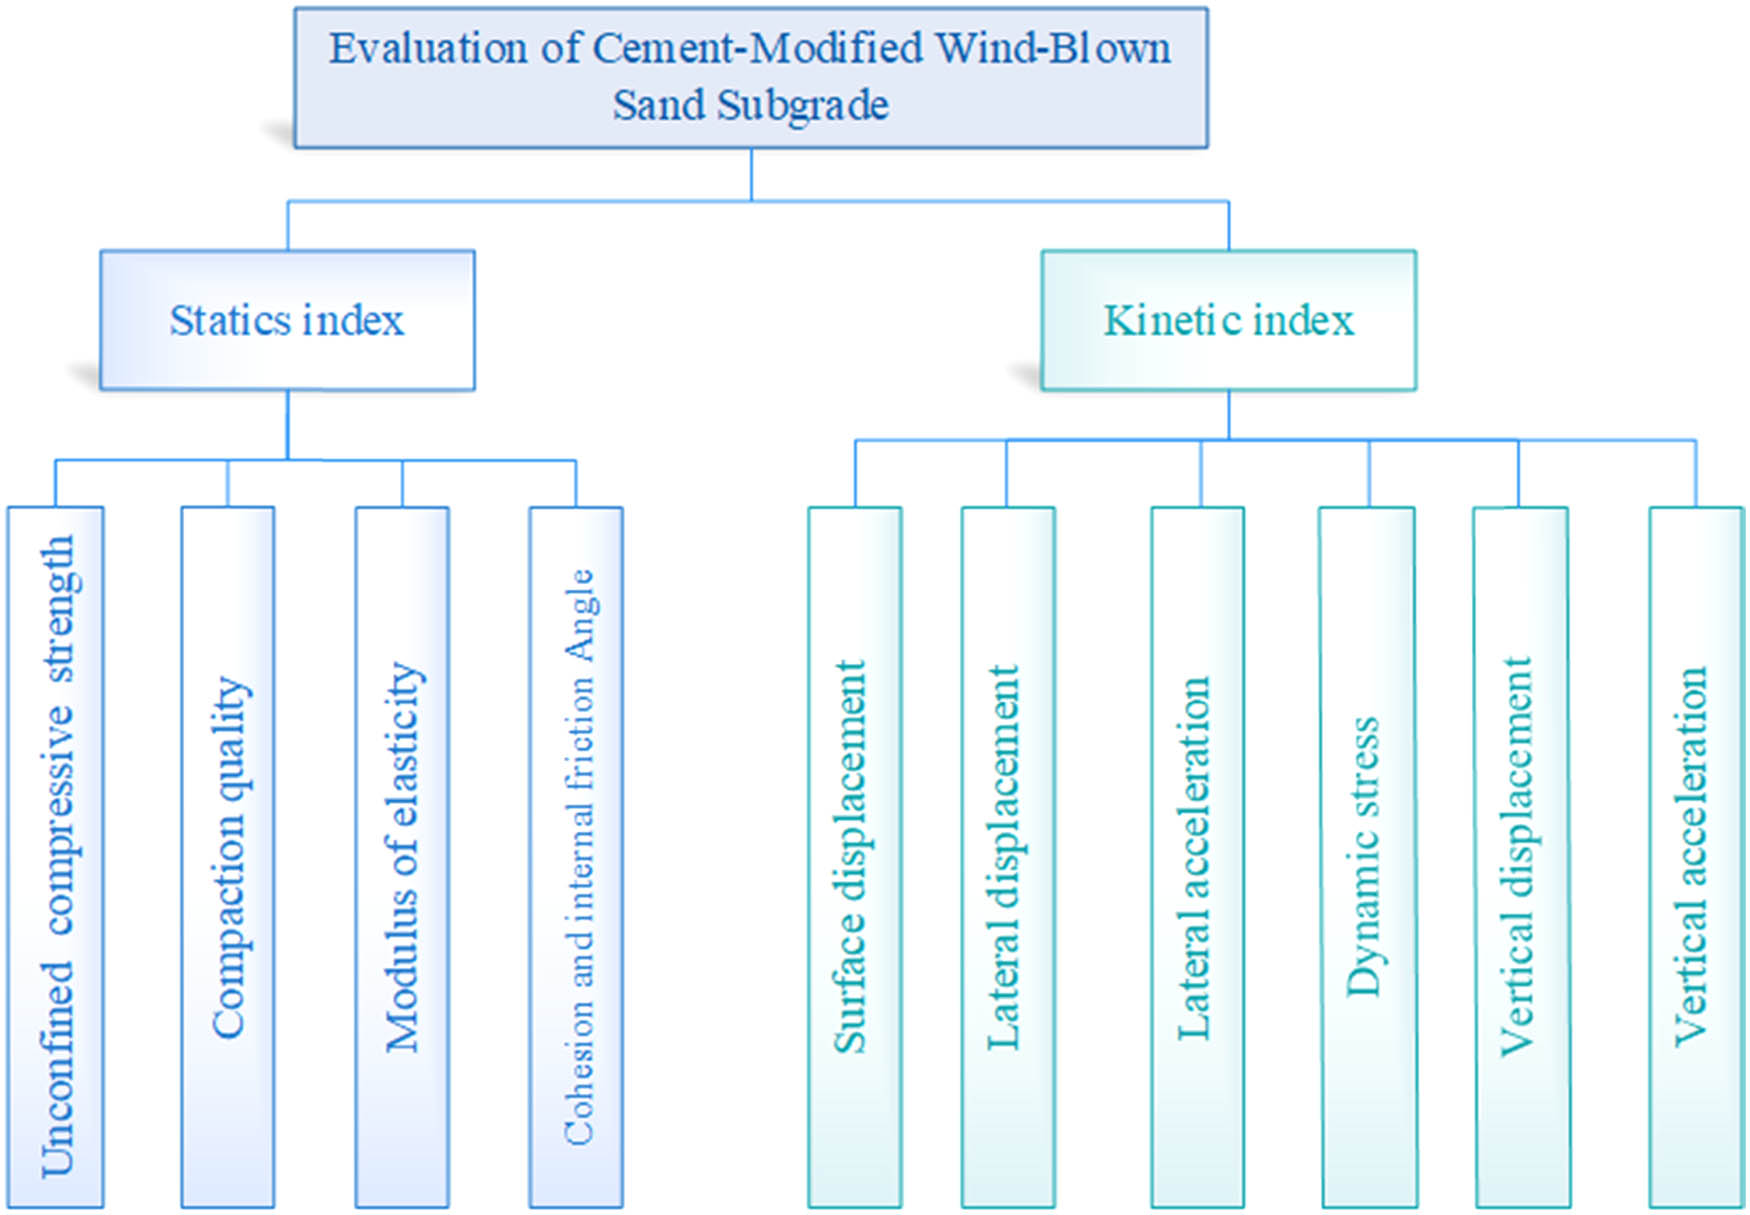
Evaluation index system of aeolian sand subgrade.
5.2 Calculation of indicator weights
In the real project, the assessment indicators are rated using the expert evaluation method [33], and the scale score between [0, 10] is calculated based on their importance to the variables considered in the roadbed design, and this is considered the data of the relevant indicators. Based on equation (2), the importance of the indicators is calculated as surface settlement, unconfined compressive strength, lateral displacement, lateral acceleration, vertical displacement, vertical acceleration, and effective stress, with the final weights being [0.281719, 0.281710, 0.047030, 0.033966, 0.136198, 0.083162, 0.136198] T . Equation (3) yields C R = 0.0419 < 0.1, indicating the model passes the required conditions (Figure 8).
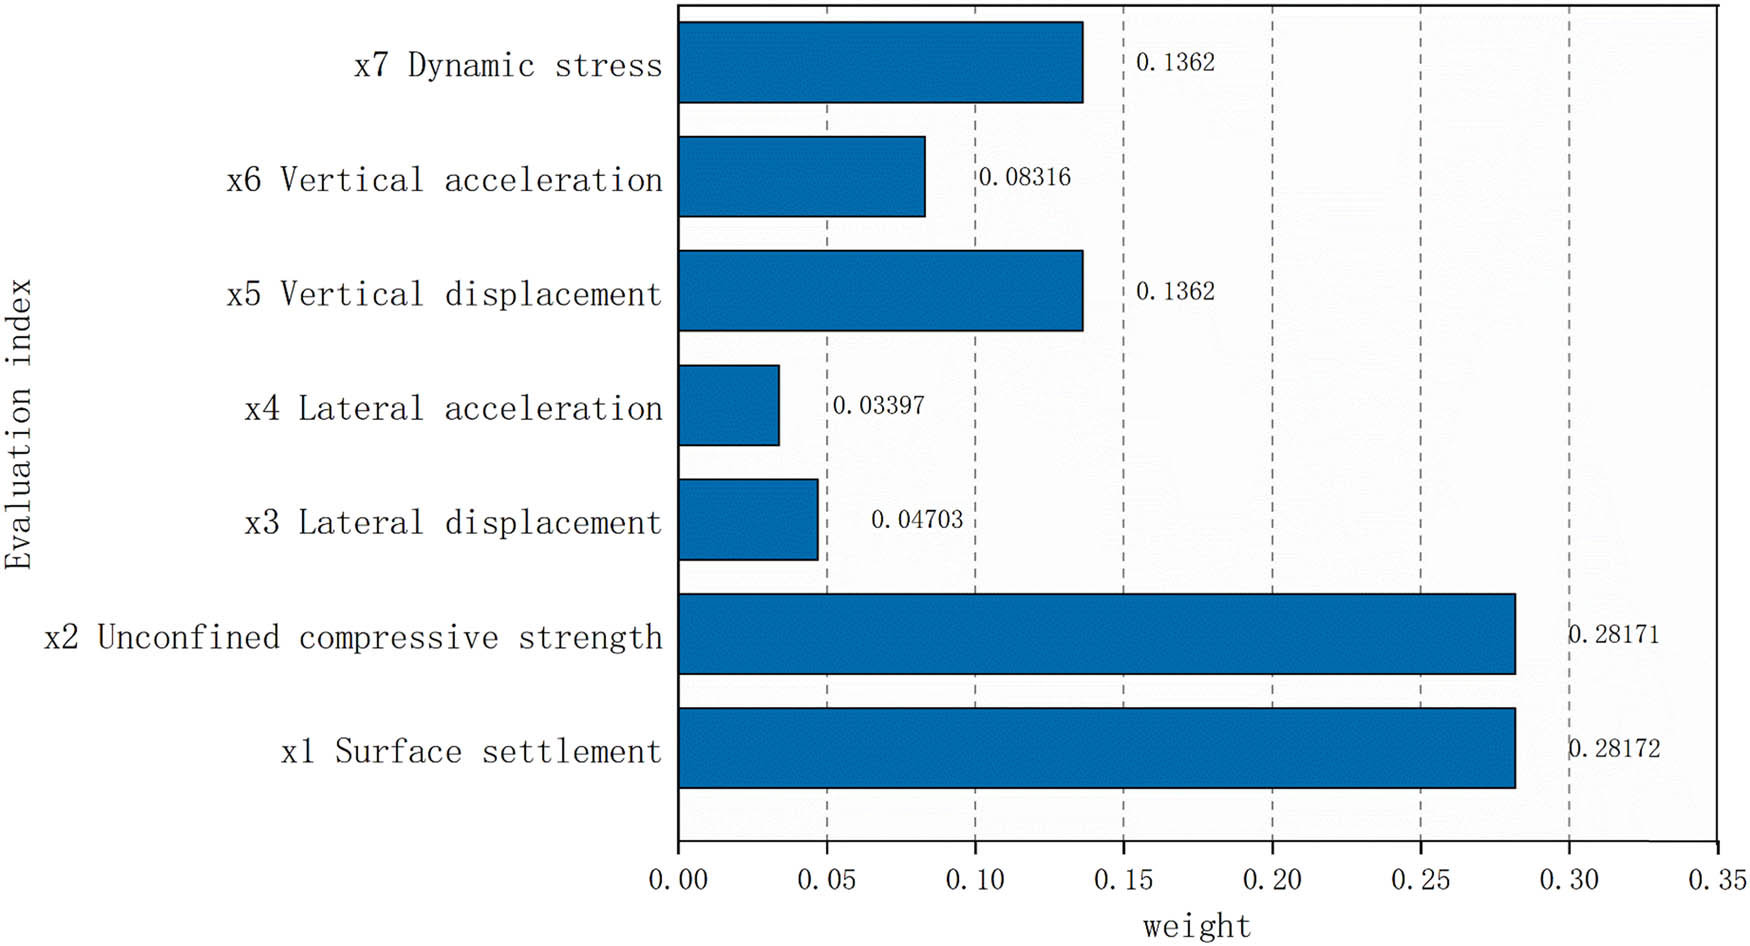
Weight of evaluation indicators.
5.3 Initial data of the test
The simulation test is carried out according to different sections of the roadbed, and the simulation results of the evaluation indexes are shown in Table 6.
Simulated initial data
| Experimental sequence number | Evaluation index | ||||||
|---|---|---|---|---|---|---|---|
| Surface displacement (mm) | Unconfined compressive strength (kPa) | Lateral displacement (mm) | Lateral acceleration (m/s2) | Vertical displacement (mm) | Vertical acceleration (m/s2) | Dynamic stress (kPa) | |
| 1 | 0.038254 | 0.56 | 0.184738 | 0.027003 | 0.034650 | 0.099544 | 3.517328 |
| 2 | 0.034788 | 0.79 | 0.105767 | 0.029713 | 0.032896 | 0.103286 | 3.932547 |
| 3 | 0.034593 | 0.85 | 0.105773 | 0.030437 | 0.032751 | 0.103565 | 3.981740 |
| 4 | 0.034788 | 0.78 | 0.105767 | 0.029713 | 0.032896 | 0.103286 | 3.932547 |
| 5 | 0.034254 | 0.92 | 0.105422 | 0.031382 | 0.032493 | 0.103889 | 4.077386 |
| 6 | 0.034057 | 1.09 | 0.104986 | 0.031709 | 0.032342 | 0.103975 | 4.137598 |
| 7 | 0.034203 | 0.97 | 0.105326 | 0.031484 | 0.032454 | 0.103919 | 4.092687 |
| 8 | 0.033484 | 1.26 | 0.102691 | 0.031567 | 0.031892 | 0.103829 | 4.331942 |
| 9 | 0.033176 | 1.42 | 0.100081 | 0.030820 | 0.031783 | 0.103583 | 4.447083 |
5.4 Comprehensive evaluation of dynamic stability
Data are evaluated and processed by combining multiple data indications. Based on the baseline data from the simulation in Table 5, the judgment matrix X can be calculated statistically.
The acceleration index, dynamic displacement index, and dynamic stress index are all negative, while the unconfined compressive strength is positive. Using the TOPSIS method, the matrix X is normalized using equations (4) and (5), yielding the normalized matrix X 1.
Determine the positive ideal solution Z + = {1, 1, 1, 1, 1, 1, 1, 1}, the negative ideal solution Z − = {0, 0, 0, 0, 0, 0, 0}, and then calculate the C i of each evaluation scheme to the ideal solution according to equation (8). The larger the C i , the better the ratio. The results are shown in Table 7.
Program evaluation
| Option | Positive ideal solution distance | Negative ideal solution distance | Distance from solution to ideal solution | Ranking | Evaluation zone |
|---|---|---|---|---|---|
| 1 | 0.864093 | 0.503316 | 0.368080 | 9 | Poor stability |
| 2 | 0.545865 | 0.542148 | 0.498292 | 7 | Poor stability |
| 3 | 0.530942 | 0.563294 | 0.514783 | 6 | Good stability |
| 4 | 0.550278 | 0.540565 | 0.495548 | 8 | Poor stability |
| 5 | 0.524604 | 0.604205 | 0.535259 | 5 | Good stability |
| 6 | 0.482684 | 0.667367 | 0.580293 | 3 | Good stability |
| 7 | 0.510154 | 0.620728 | 0.548888 | 4 | Good stability |
| 8 | 0.474623 | 0.780070 | 0.621722 | 2 | Excellent stability |
| 9 | 0.477118 | 0.865170 | 0.644549 | 1 | Excellent stability |
This study defines C i ∈ [0.6, 1] as outstanding roadbed stability. C i ∈ [0.5, 0.6] represents strong roadbed stability, while C i ∈ [0, 0.5] denotes poor roadbed stability. In conclusion, the 4:6 pulverized soil ratio and 6% cement dosing have the best overall stability, while the 3:7 pulverized soil ratio and 6% cement dosing are second best, but the stability is satisfactory.
5.5 Site selection
Traditionally, there are two primary objectives when building roadbeds: fulfilling mechanical criteria and minimizing construction costs. The design of the roadbed must meet the specification requirement that the bearing capacity of the part of the roadbed below the foundation bed be 250 kPa, whereas in the actual project, considering the local freezing and thawing environment, the unconfined compressive strength should be greater than 350 kPa to ensure sufficient stability. Furthermore, water content and compactness have a considerable impact on freezing rate; the lower the water content or the higher the compactness, the lower the freezing rate. Therefore, when designing material proportioning, it is vital to select the ideal water content to assure compaction while decreasing frost expansion rate in order to meet engineering performance and durability criteria. Figure 9 depicts the field monitoring of water content and unconfined compressive strength. After a thorough analysis and comparison, the optimal strategy is scheme 5> scheme 6> scheme 7> scheme 8> scheme 9> scheme 1, 2, 3, 4. As a result, in the building process of DK254+962- DK255+262, the subgrade of the foundation bed uses a cement mixing quantity of 5.4–5.9% and a pulverized soil proportion of 3:7 [34].
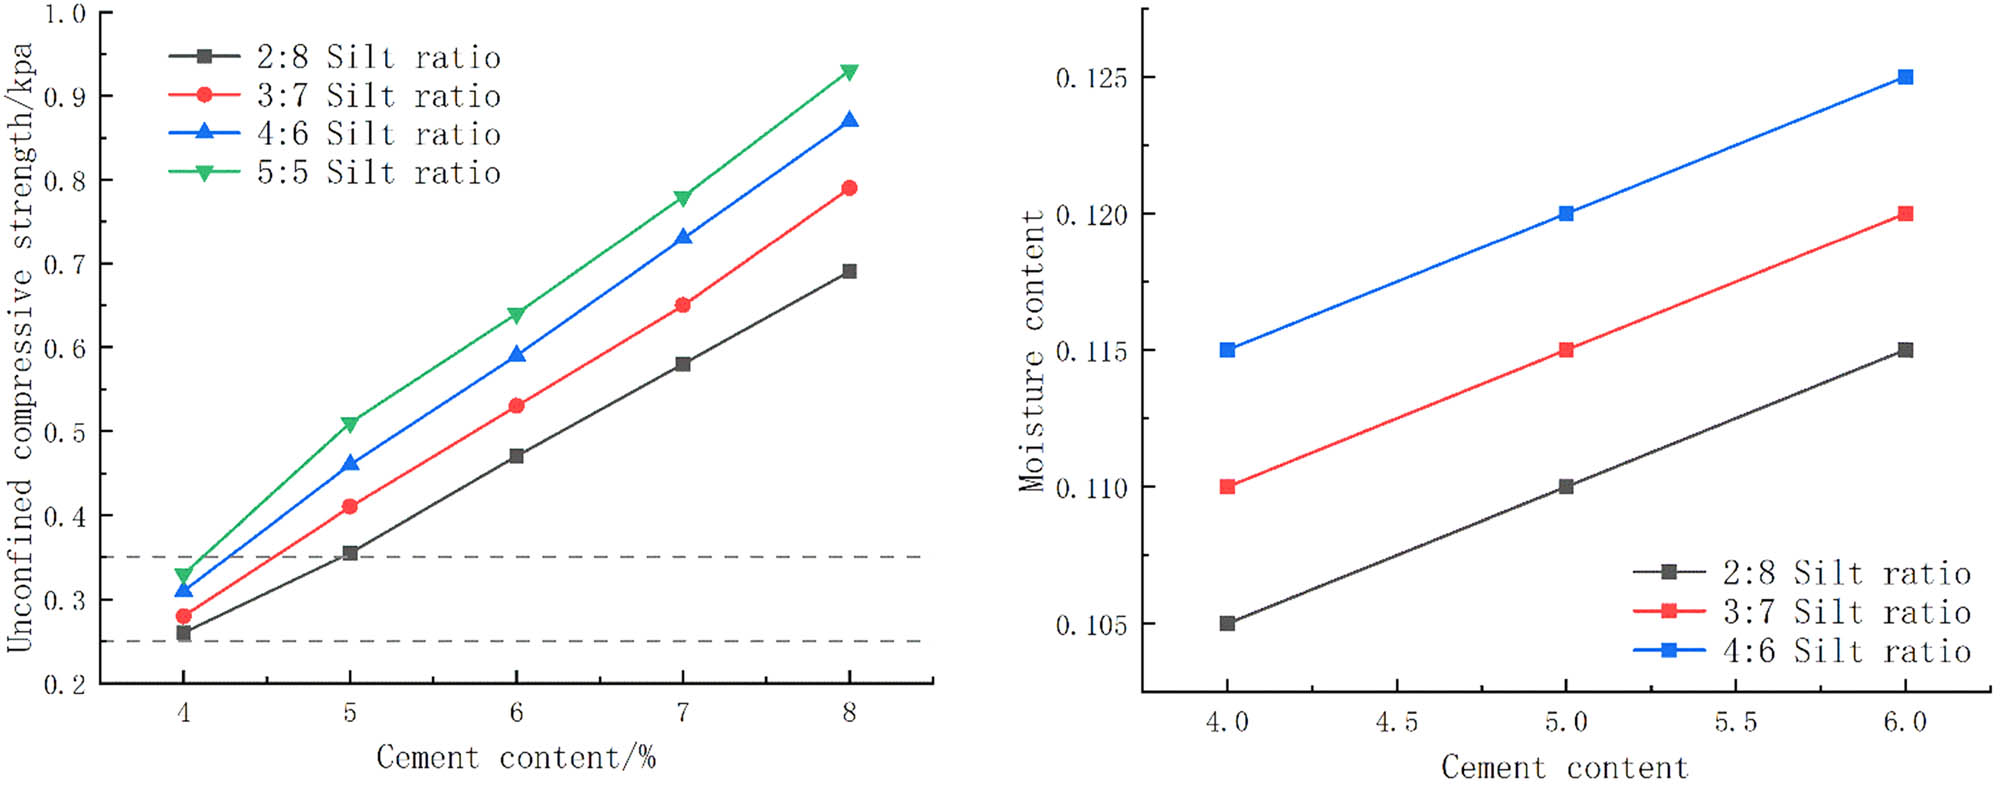
Tests of strength and moisture content in the field.
The image depicts a comparative examination of field preference, evaluation preference, and the field excitation test [35,36]. In comparison to other researchers’ studies, the simulated dynamic stress curve and the actual dynamic stress curve at the bottom layer of the roadbed are nearly identical [37], demonstrating the validity of this numerical simulation follow-up research effort. The settlement of scheme 8 is clearly smaller than that of scheme 5 chosen from the field test, and the gap is larger as the depth of the roadbed declines. The evaluation results presented in this research have a higher resistance to dynamic load damage than the field selection (Figures 10 and 11).
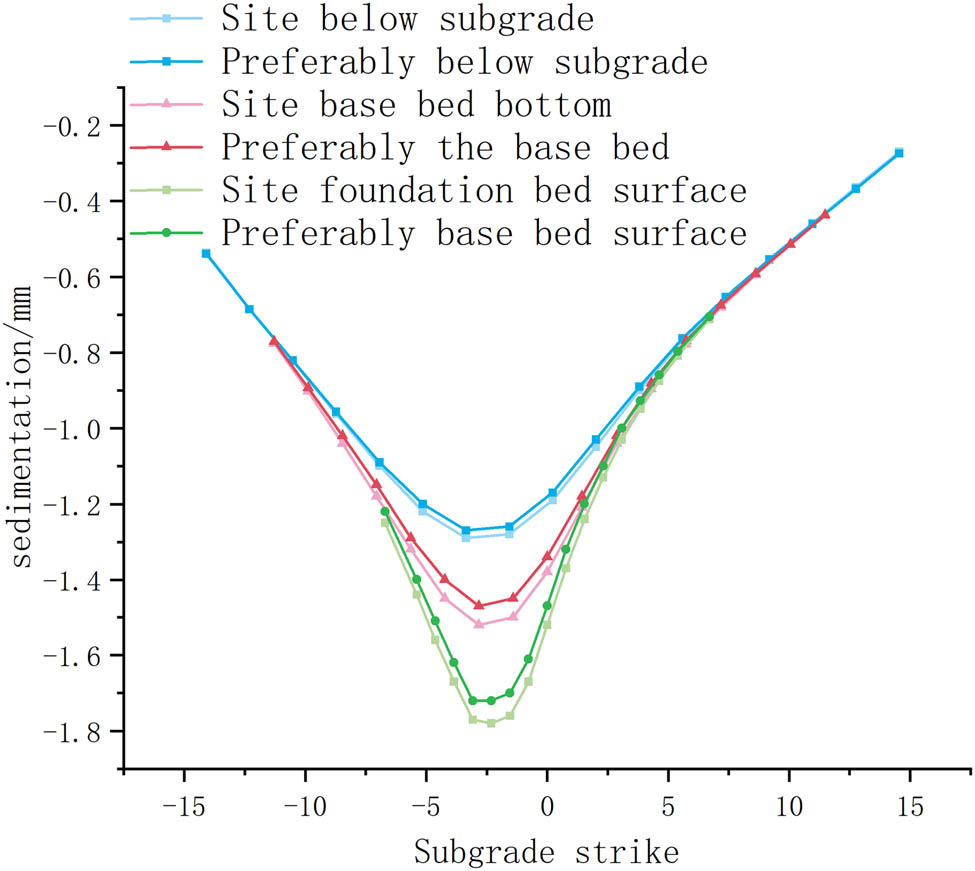
Comparison of settlement in situ and optimal ratio.
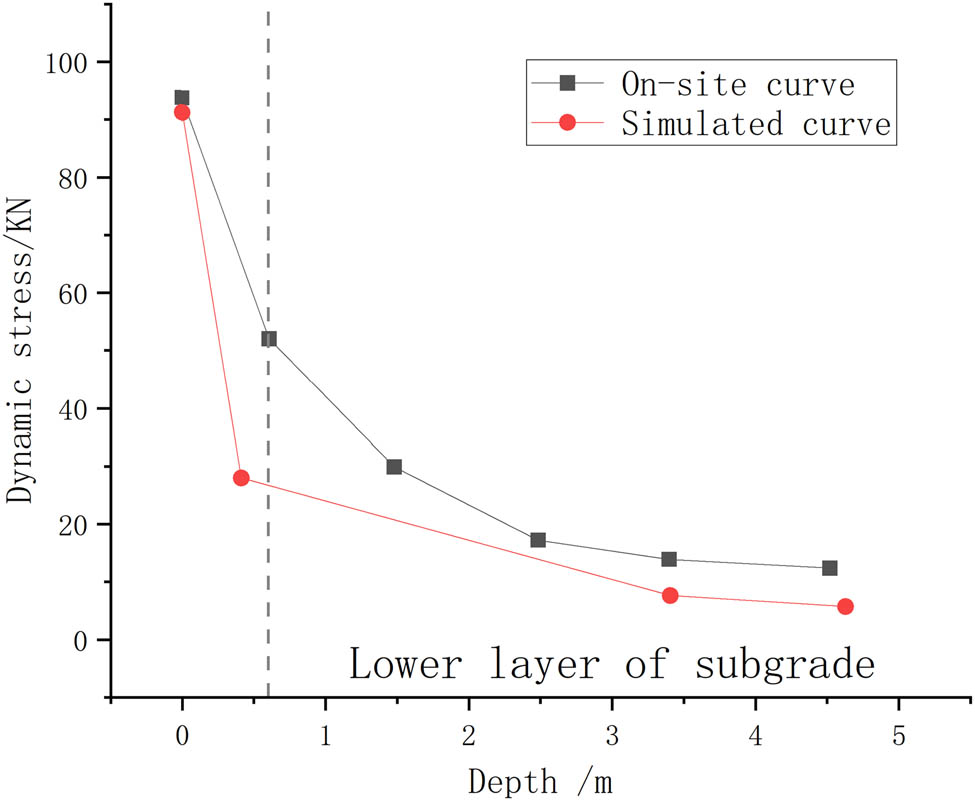
Rationality verification.
The full on-site examination is based on subjective expert judgment and combines with actual technical requirements, and the evaluation results are useful. In contrast, the quantitative examination examines the roadbed’s strength, deformation, shear resistance, and other critical indices under dynamic loading using dynamic stability and mechanical properties. Special emphasis is placed on dynamic loading performance, which is more in line with the actual operating conditions of high-speed rails with high mechanical property requirements. Experimental data are used to support the evaluation outcomes, ensuring their comprehensiveness and dependability.
5.6 Comparison of improvement effect
The effects of complete settlement and dynamic stress under train load on the roadbed as a whole are investigated, and the results are contrasted as follows.
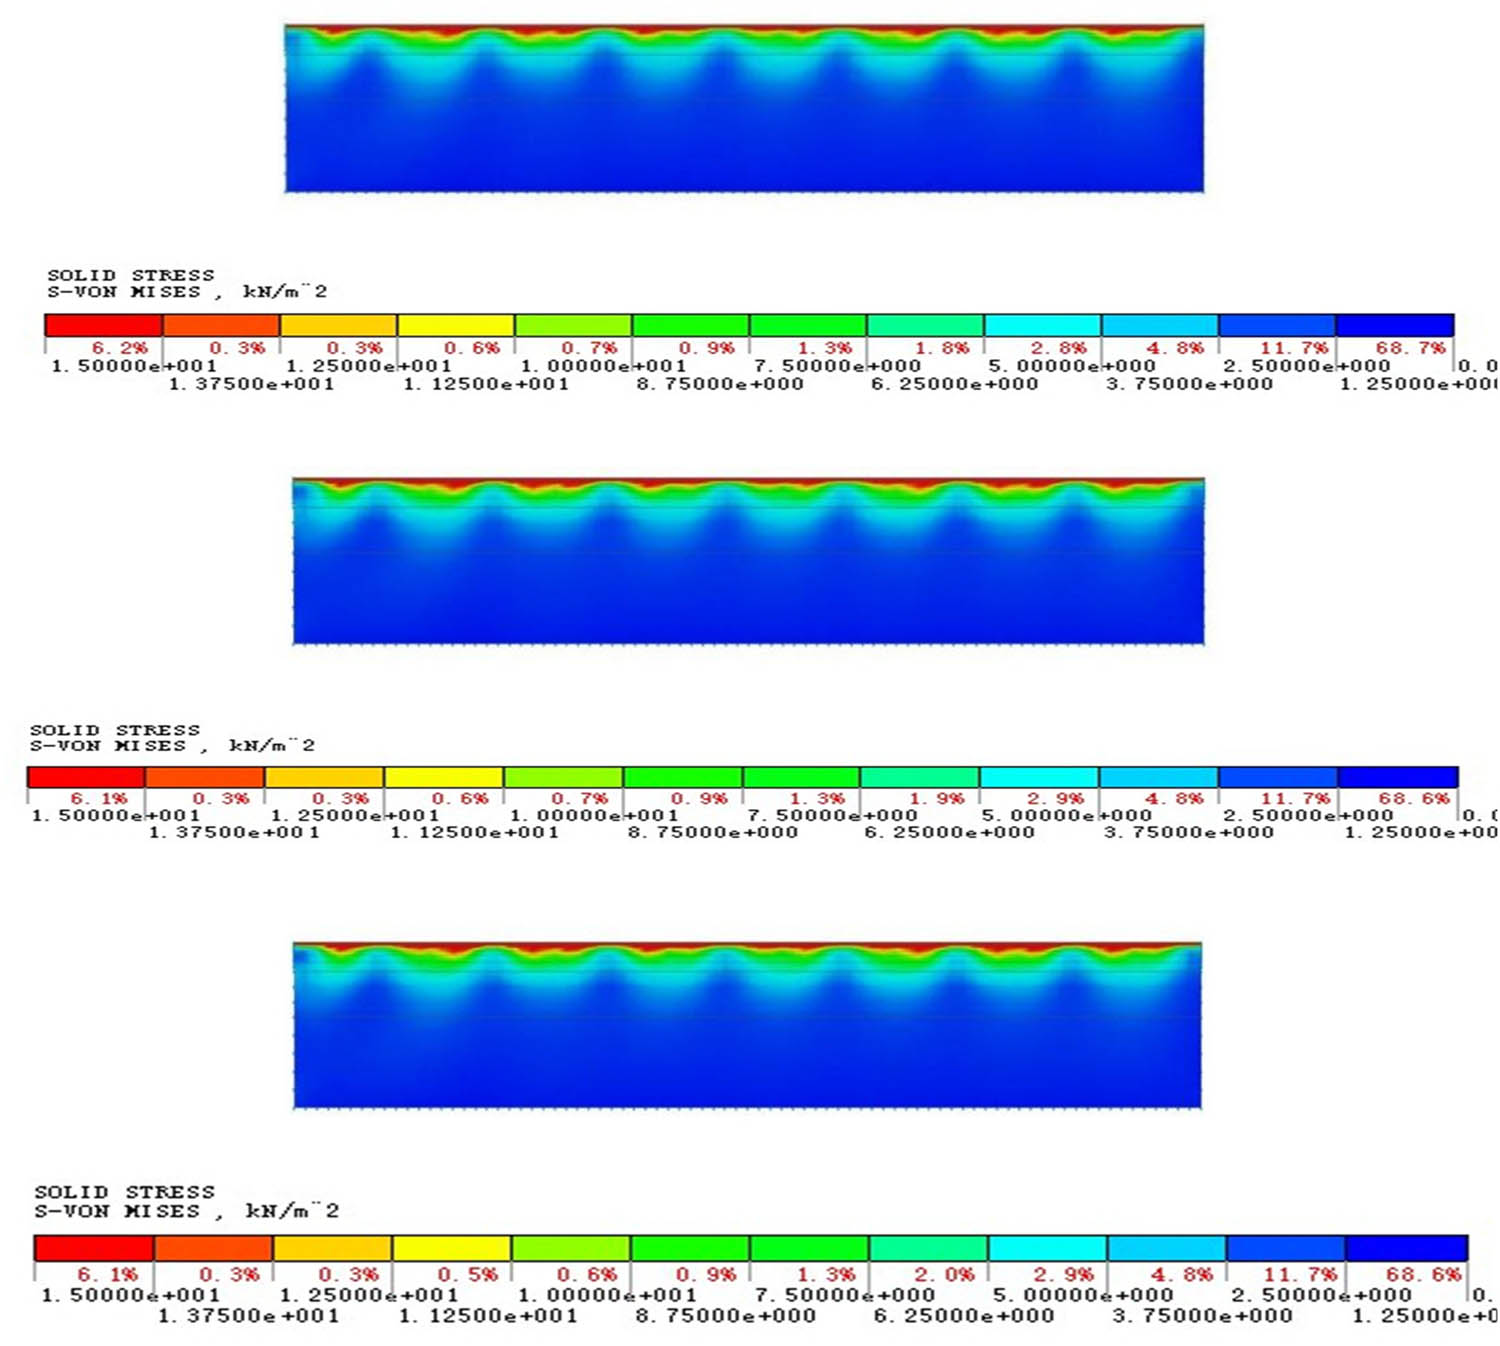
Figures 12 and 13 depict the simulated horizontal profile cloud at Y = 30 m (0 ≤ Y ≤ 200) and longitudinal profile cloud at X = 50 m (0 ≤ X ≤ 100) with train load. The maximum cumulative vertical deformation value is located in the center of the dynamic load, the settlement amplitude gradually decreases with increasing distance, the lateral dynamic displacement along the roadbed is V-shaped, and the vertical deformation maps show a semi-elliptic distribution decreasing outward from the center. The dynamic stress distribution along the direction of train movement fluctuates periodically as a result of the action of the moving train load. As the depth of the roadbed increases, the settlement decreases and eventually reaches zero. With the direction of train movement, the front part of the roadbed is the first to absorb the impact and vibration of the wheels, and because the front section of the roadbed is concentrated in stress and subjected to vibration for an extended period of time, the settlement at the front end is more visible. From scenario 1 to scenario 9, the settlement of the roadbed beneath the train track varies dramatically, and the dynamic displacement effect range and amplitude rapidly decrease. Figure 14 depicts the specific distribution. In this roadbed cross-section, the highest settlement value of the roadbed fell from 2.0728 mm to 1.72913 mm, while the surface settlement induced by the train load was lowered by 0.35 mm. When the roadbed was selected at 1.6 mm, Scheme 1’s vertical deformation was 1.3 and 1.8 times that of Schemes 5 and 9, respectively.
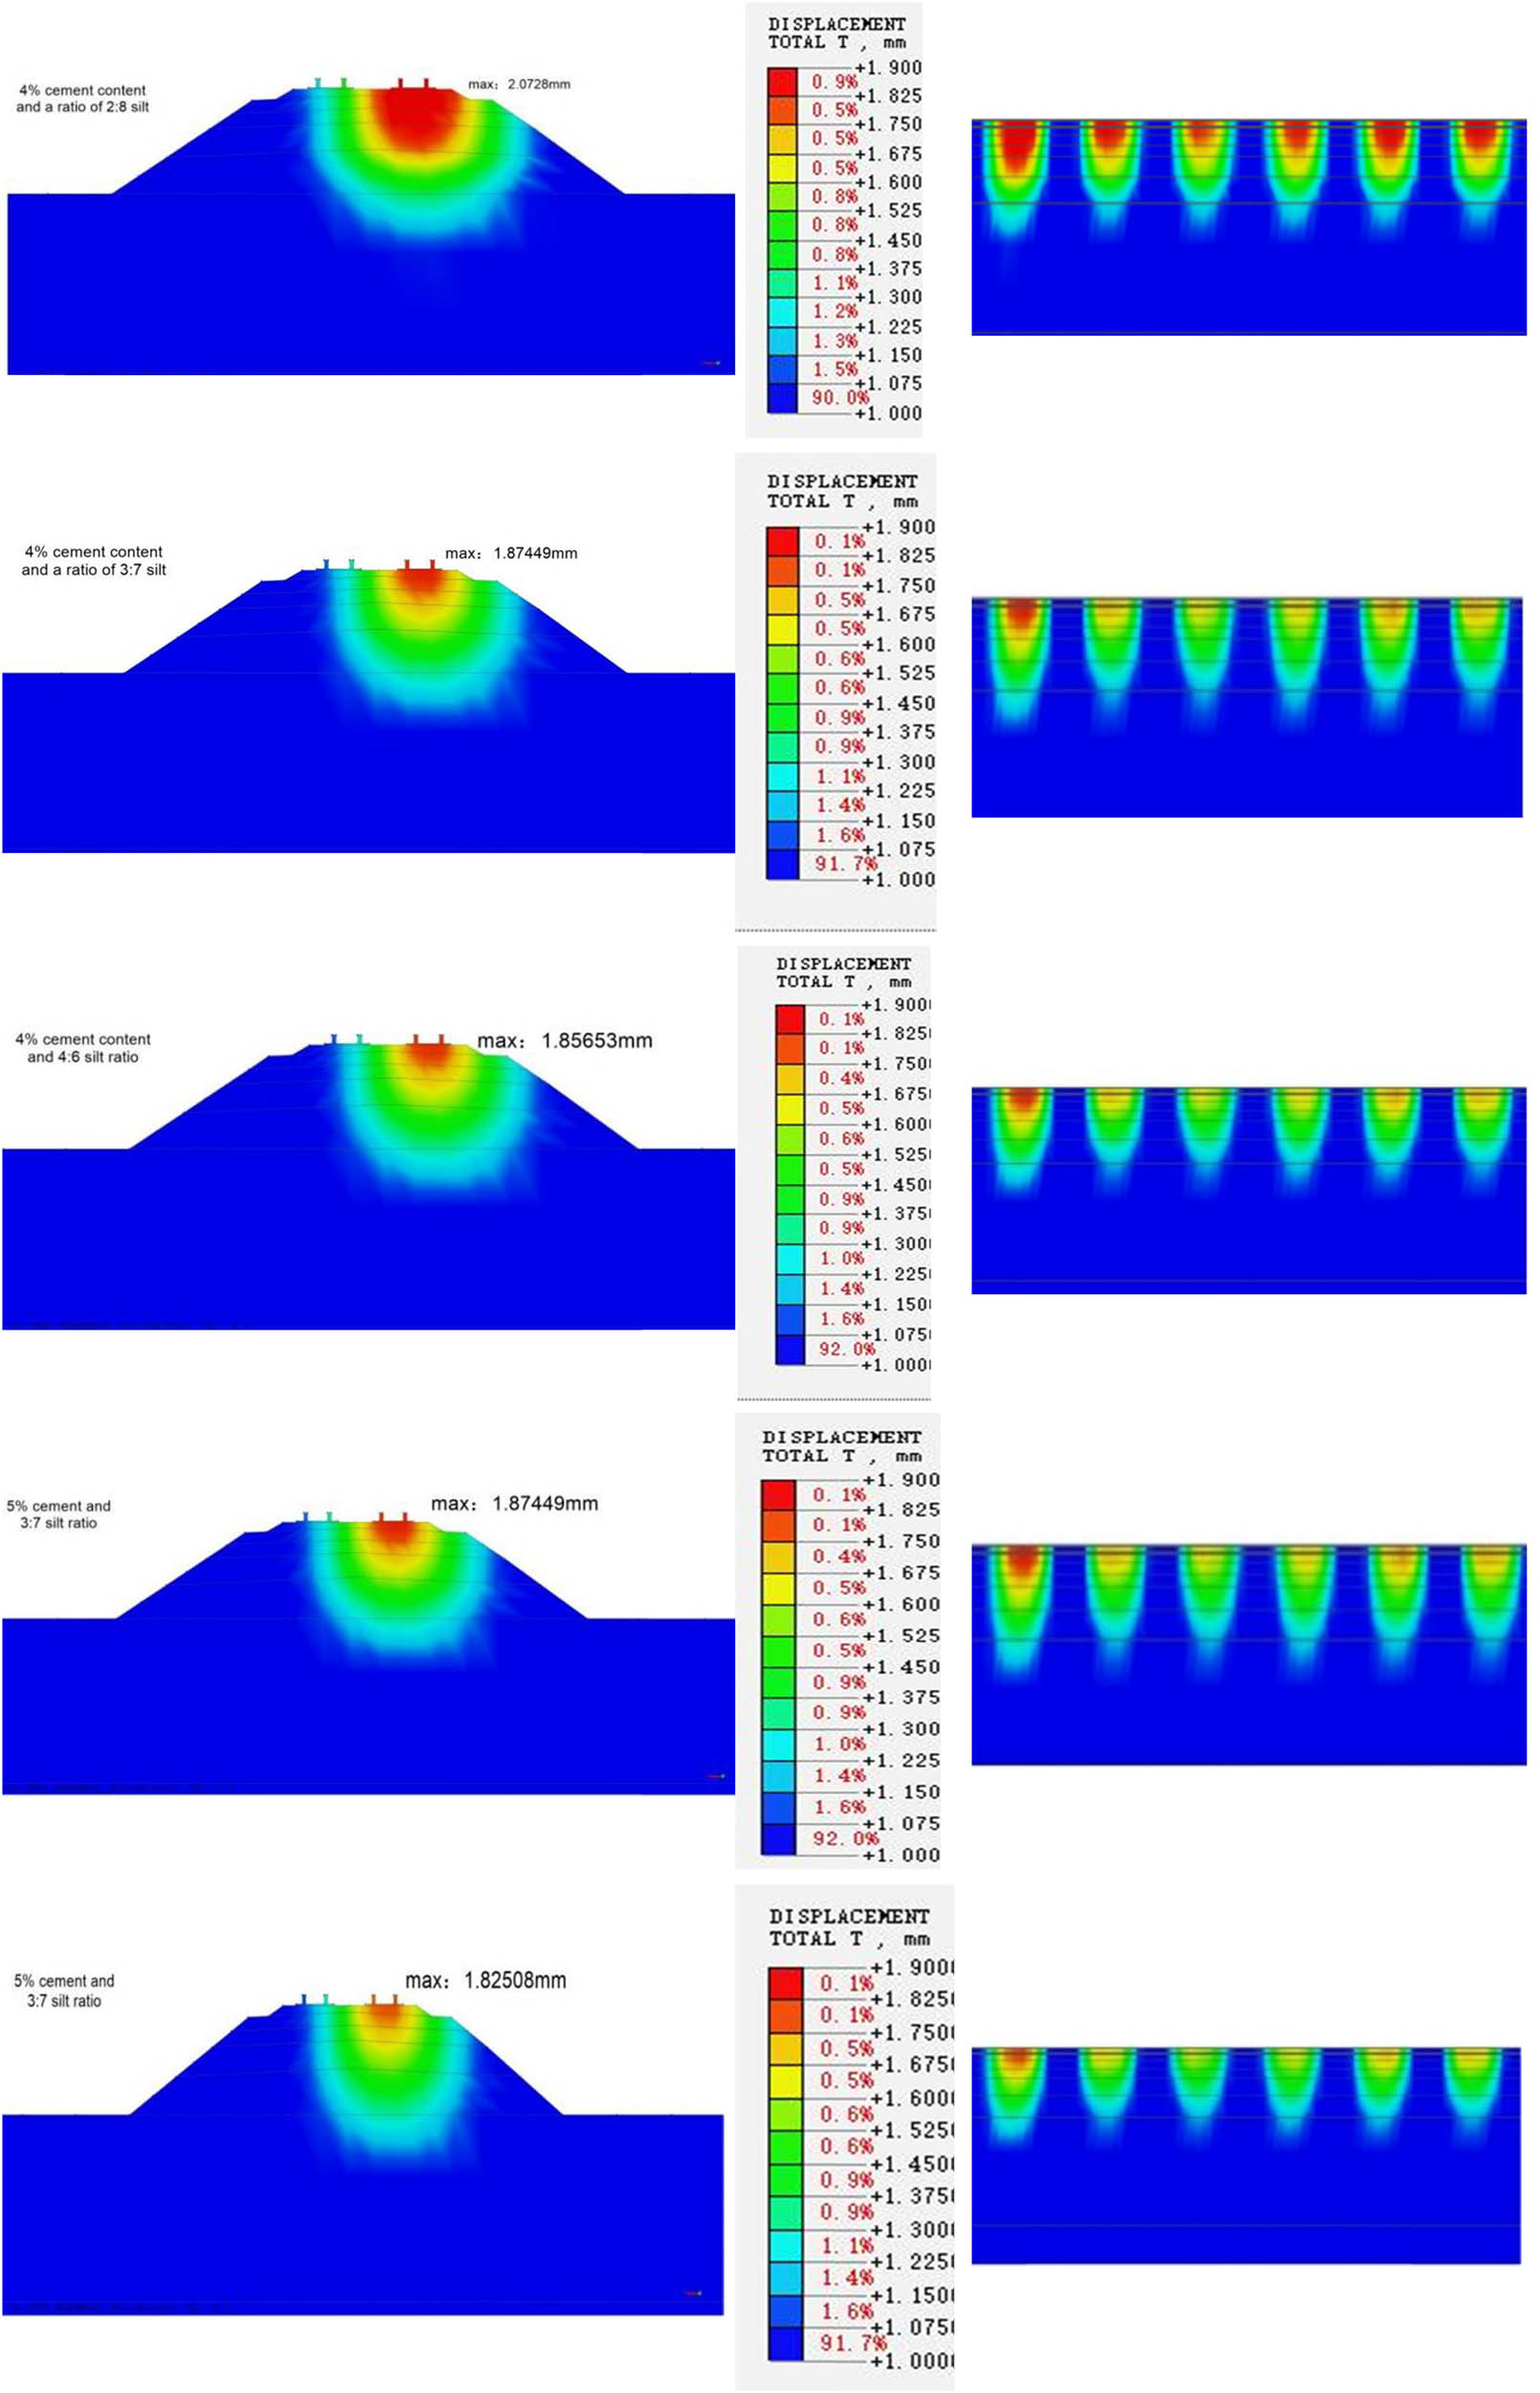
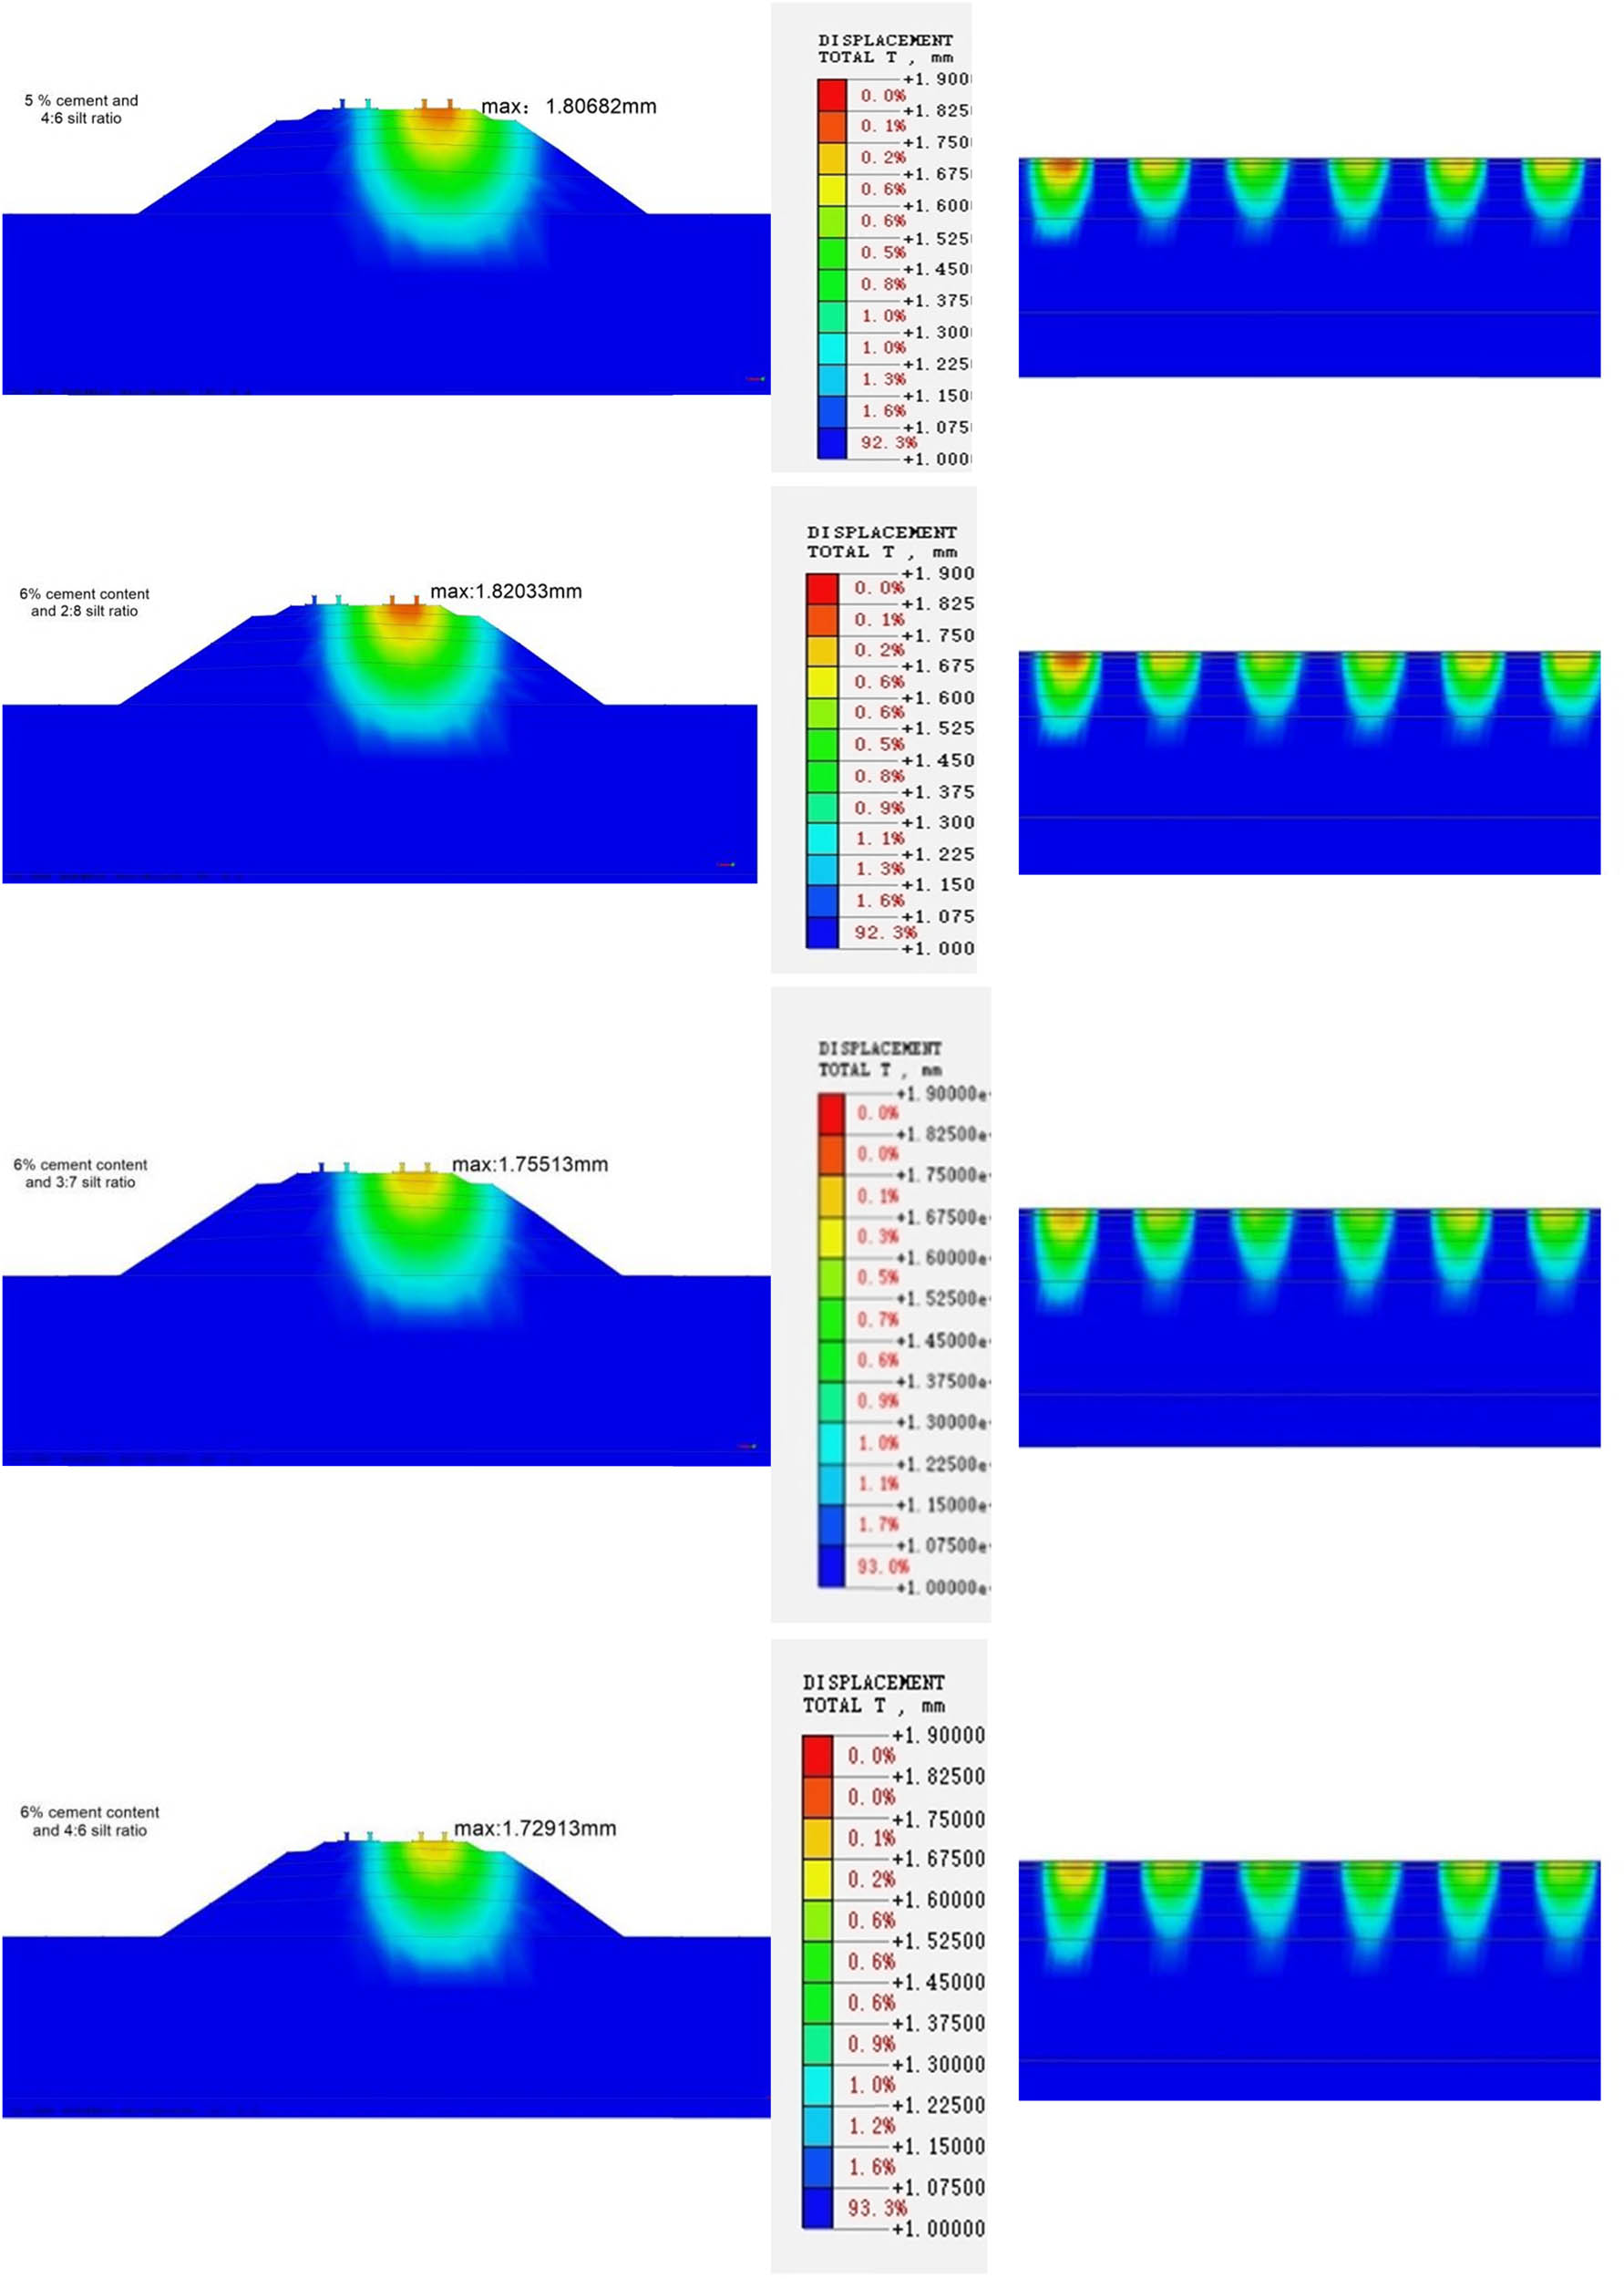
Cloud map of displacement changes.
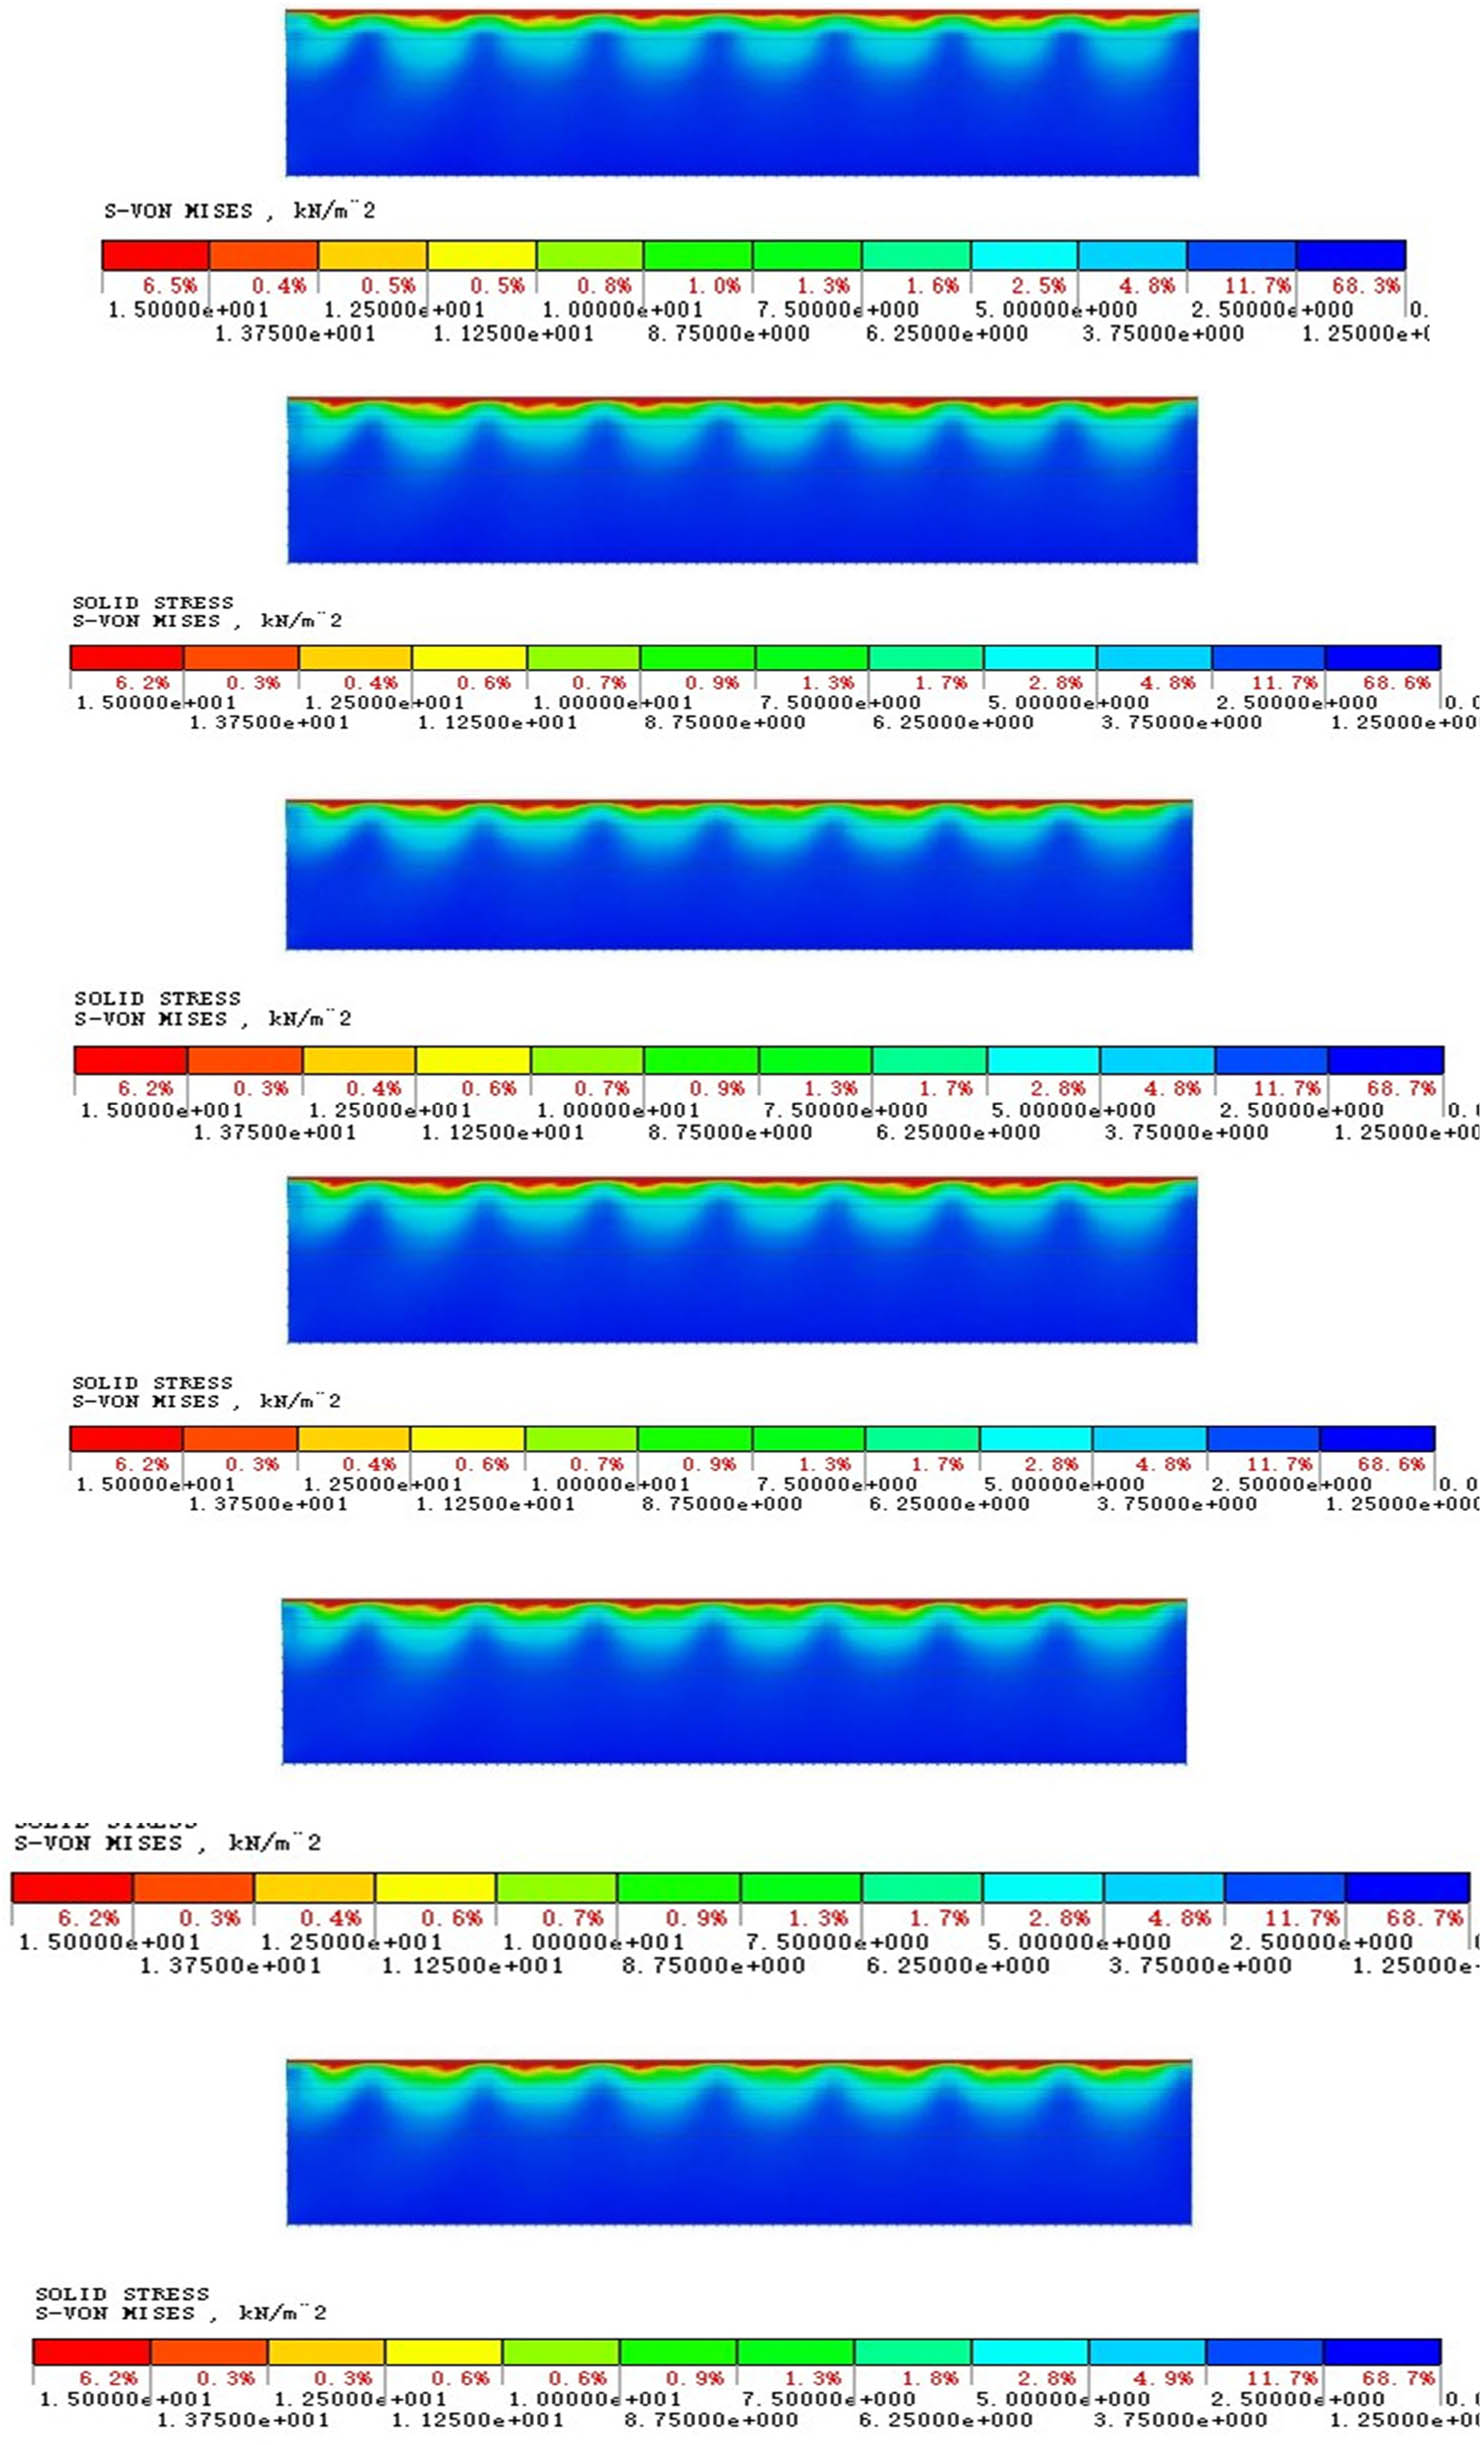
Dynamic stress cloud map.
Statistics of dynamic stress and dynamic displacement.
The longitudinal profile of the roadbed at X = 50 m (0 ≤ X ≤ 100) shows that the largest dynamic stress is located in the railroad track below the railroad roadbed. The dynamic stress distribution under the action of the dynamic load was periodic fluctuations, with stress contours being wide and slow “bowl-shaped” distribution. The high stress area is focused in the graded gravel layer, and the stress diffusion speed varies in the roadbed’s bottom layer due to material ratio differences. As the roadbed depth increases, the dynamic stress approaches zero.
The statistics of the above cloud map reveal that the percentage of 1.5–2 mm settlement has decreased from 12.8 to 3.2%. The dynamic stress change range tends to be stable. To summarize, the improved system efficiently reduces the impact of vibration on the roadbed as a whole.
6 Discussion
6.1 Analysis of dynamic stability of roadbed and discussion of improvement scheme
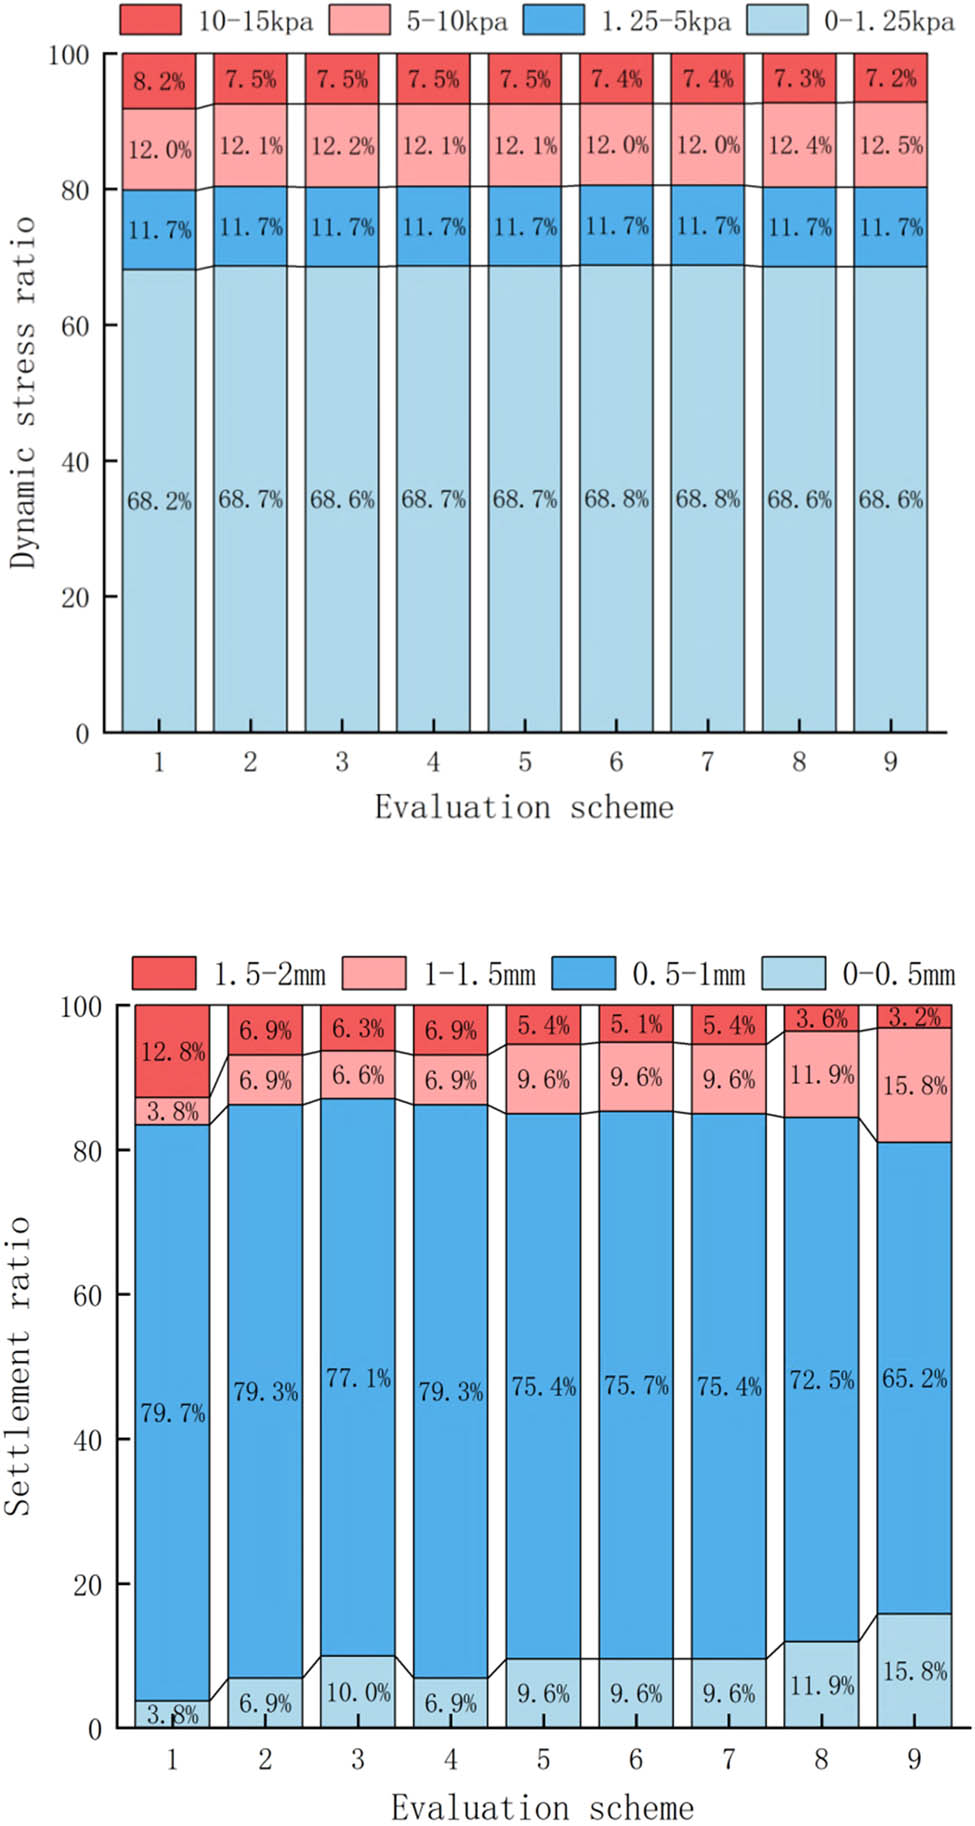
The lateral displacement changes little as the cement admixture increases, and scheme 1 has a substantially bigger lateral displacement than the other schemes because the unconfined compressive strength does not fulfill the requirements. And when the cement concentration increases, both vertical and surface displacement decrease equally, indicating that cement doping aids in the reduction in roadbed settlement and stability. Figure 15 shows that the vertical displacement diminishes with increasing depth. As the proportion of pulverized soil increases, the trend of lateral displacement and vertical displacement is similar to that of cement incorporation, but the magnitude of change is smaller, indicating that pulverized soil incorporation has a smaller effect on dynamic displacement than cement incorporation. When comparing the effect of cement and pulverized soil on dynamic displacement, the best ratio is 6% cement and 4:6 silt.
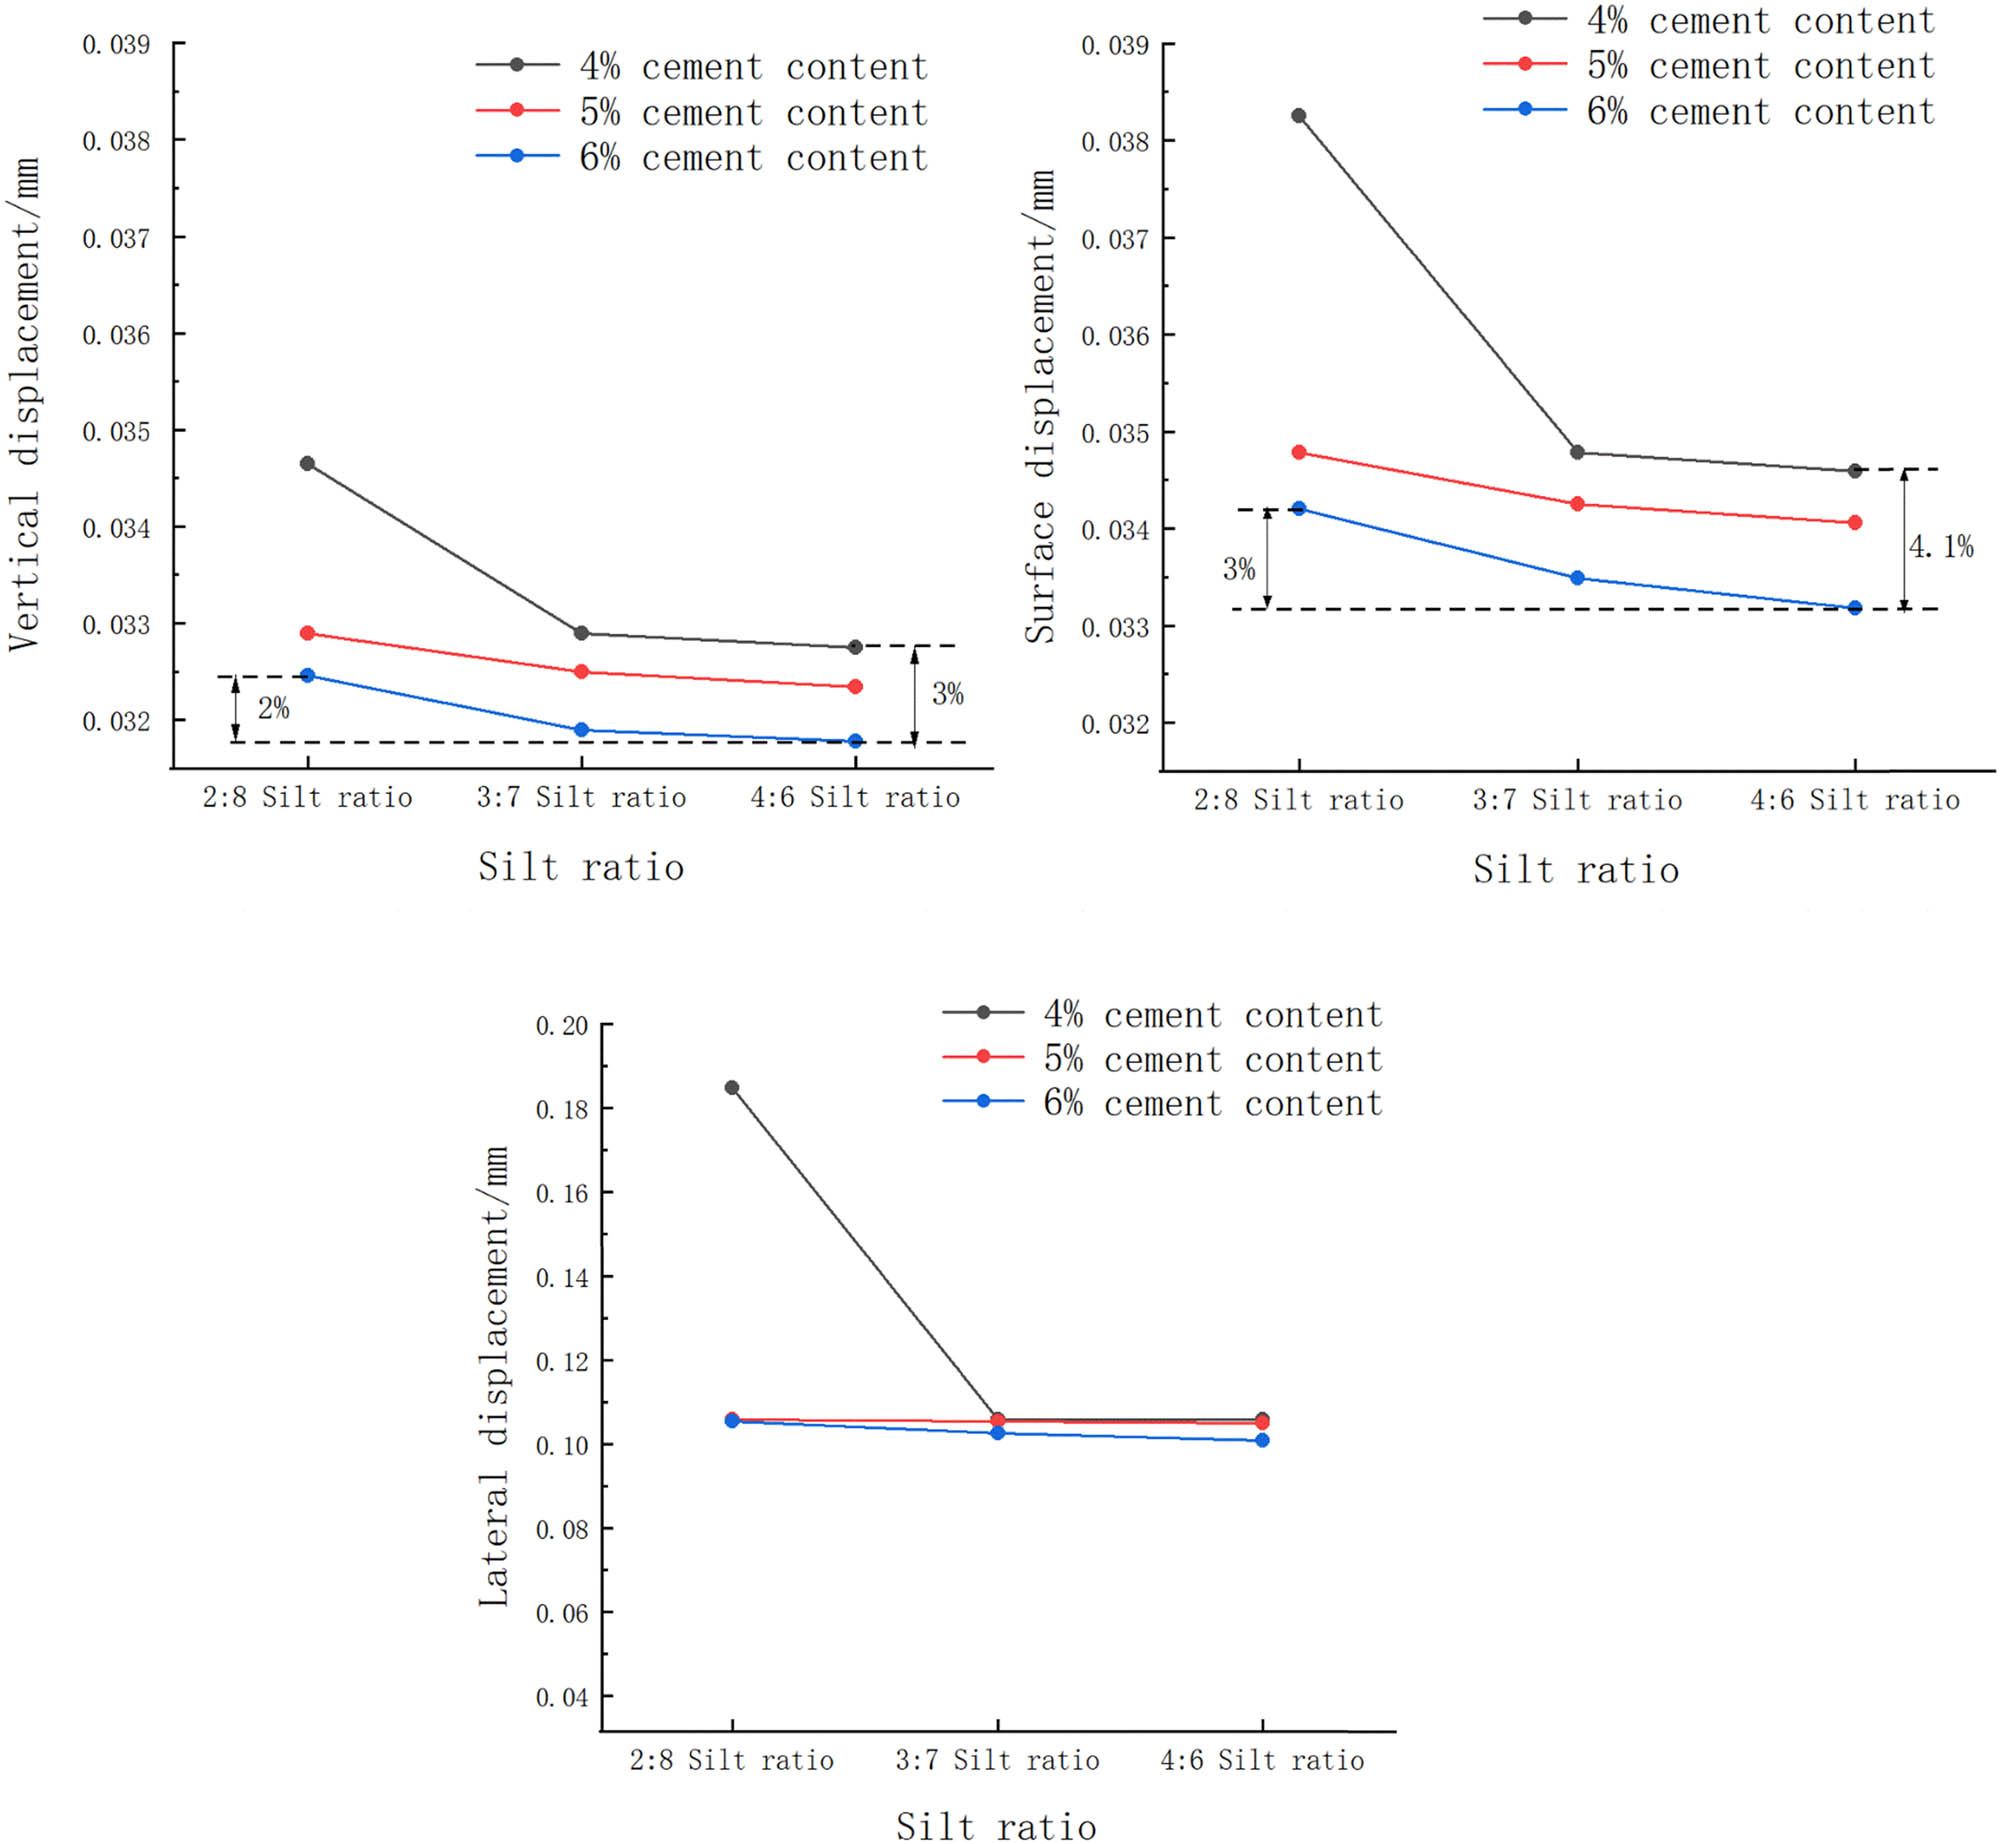
Changes in dynamic displacement.
As shown in Figure 16, the lateral and vertical accelerations of the roadbed subgrade under train loading change significantly, with the lateral acceleration being much smaller than the vertical acceleration, implying that the harm caused by the lateral movement of coarse particles under train loading will be less than the vertical acceleration. The dynamic acceleration response below the roadbed subgrade improves with the addition of pulverized soil at 4 and 5% cement dosage, but not at 6% cement dosage. The dynamic acceleration response decreases as the fraction of pulverized soil increases in 6% cement dosage. It demonstrates that different proportions have varied impacts on dynamic acceleration, i.e., dynamic acceleration is influenced by the material proportion, and dynamic acceleration is greatest when the material strength reaches a specific level.
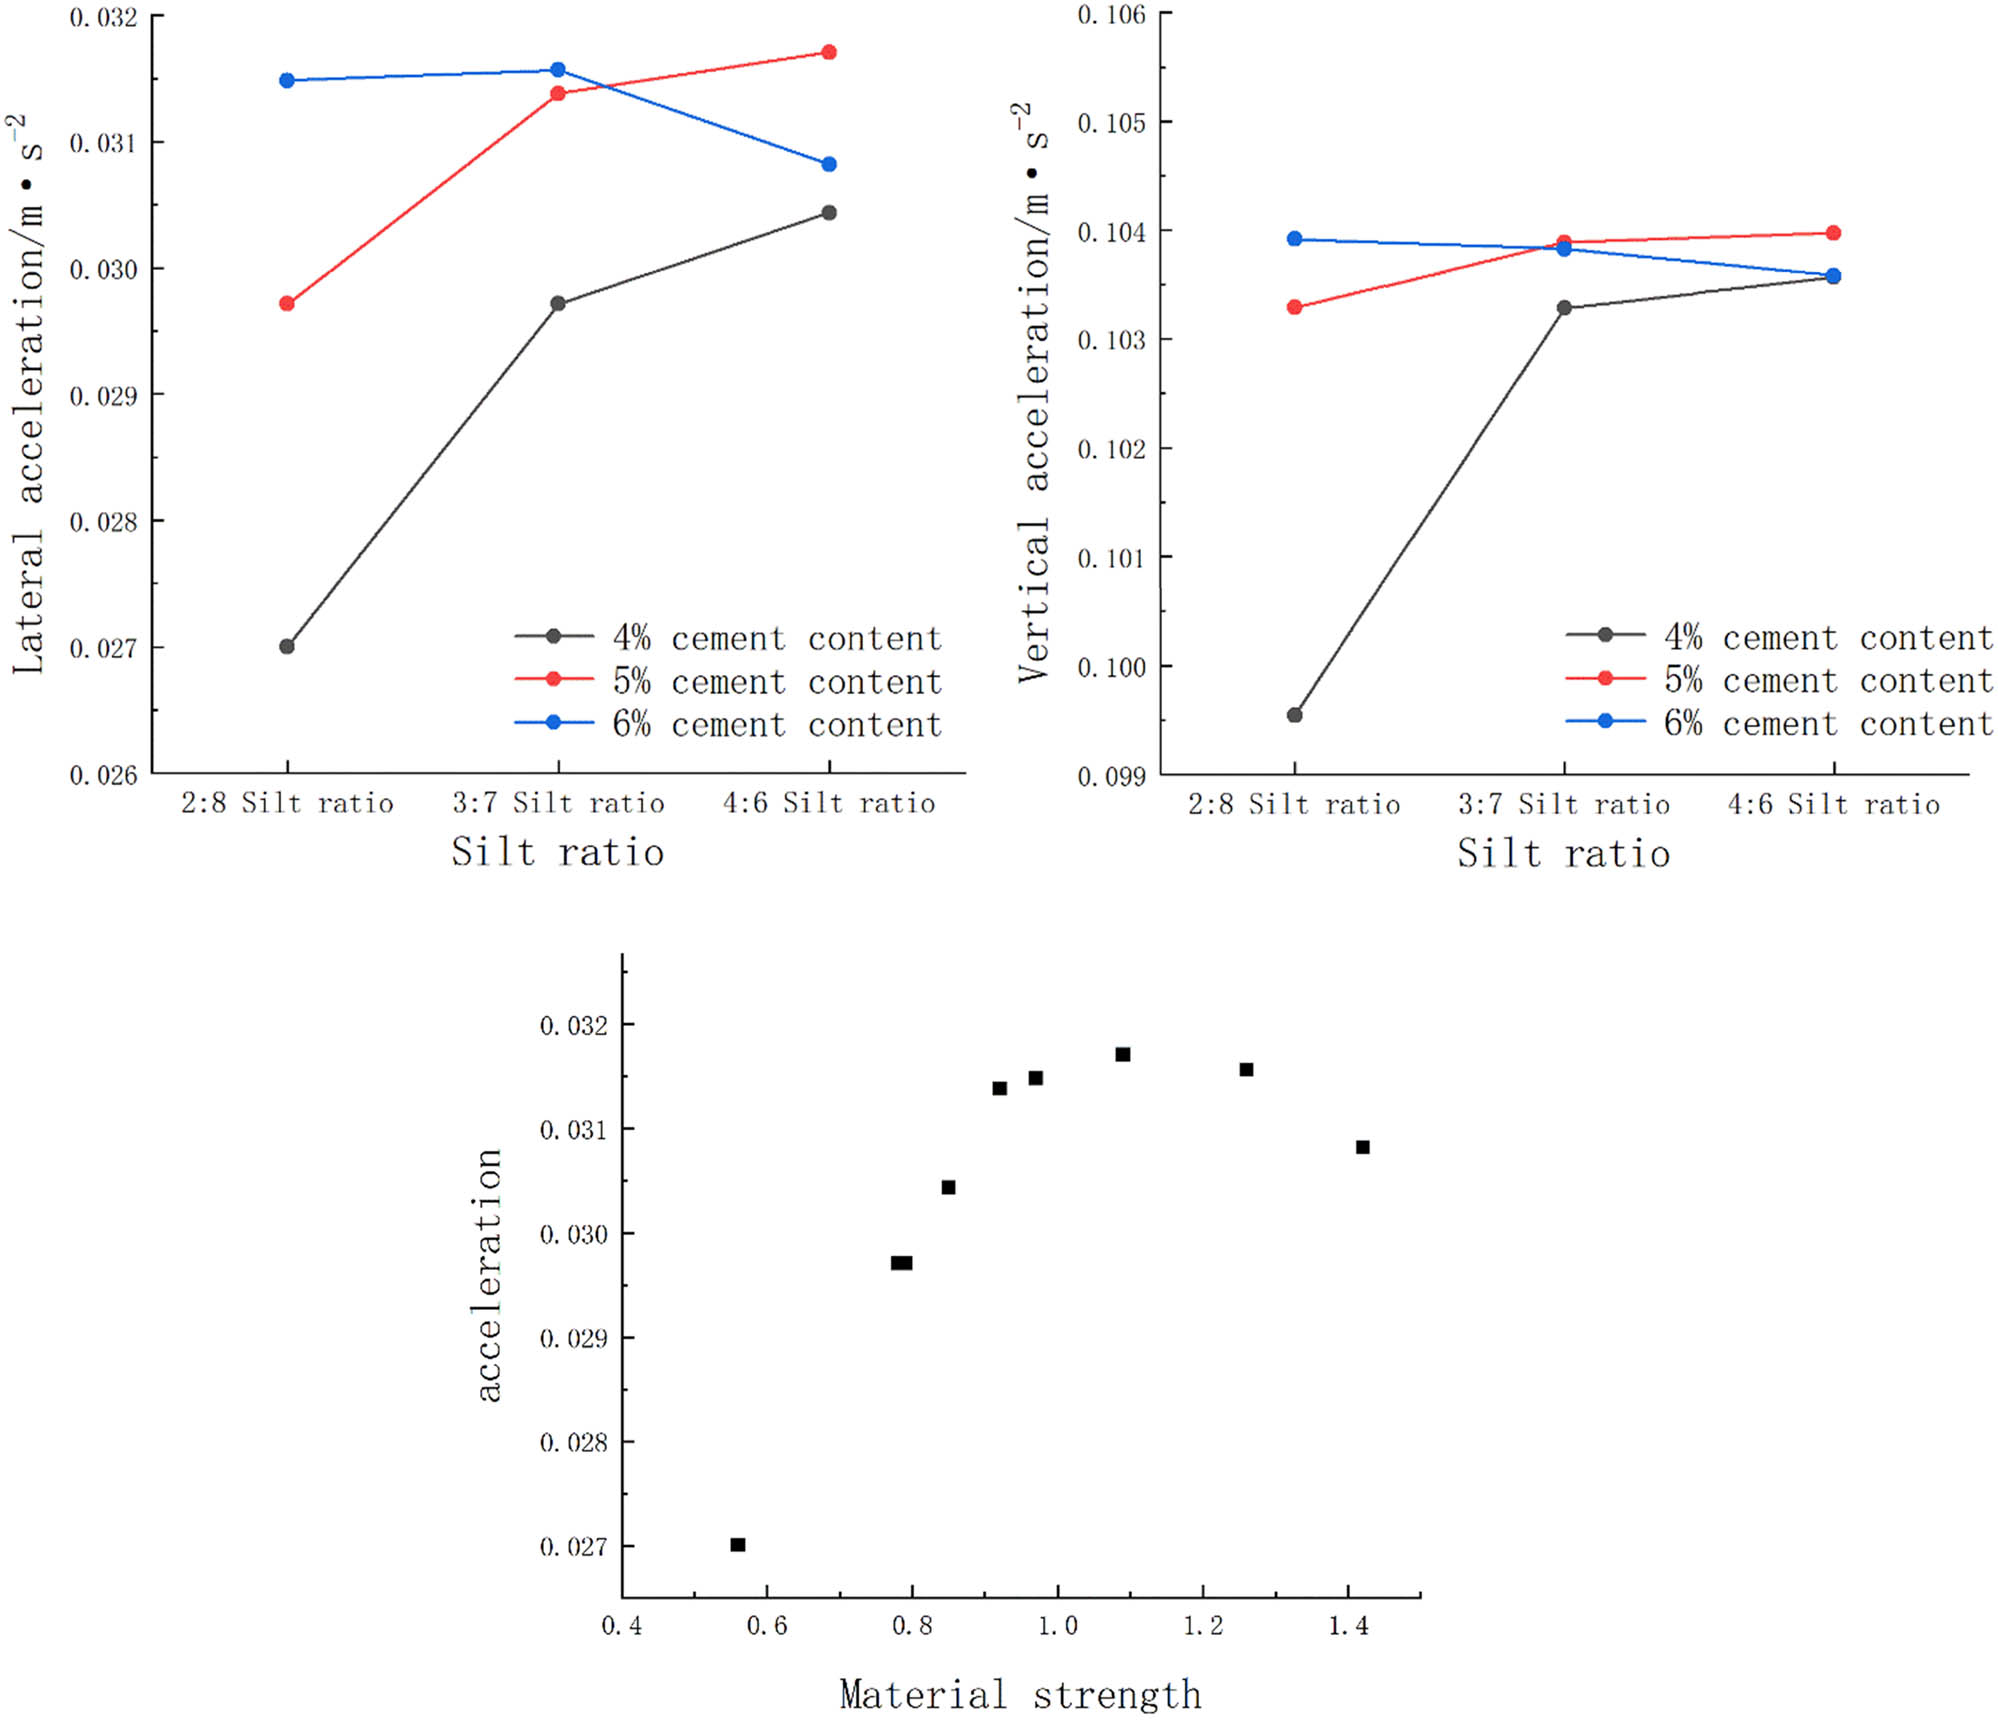
Change in acceleration effect.
Figure 17 depicts the trend of dynamic stresses below the roadbed’s subgrade with various ratios, and the dynamic stress response increases with the increase in pulverized soil and cement, indicating that both cement and pulverized soil admixture are incompatible with the stabilization of the dynamic stress response and the decay rate of the dynamic stresses. Cross-sectional comparisons revealed that the magnitude of change gradually increased with cement incorporation and was greater than the magnitude of change with the addition of pulverized soil, with a rate of change of 10.2% when the cement incorporation was changed and 5% when the pulverized soil ratio was changed.
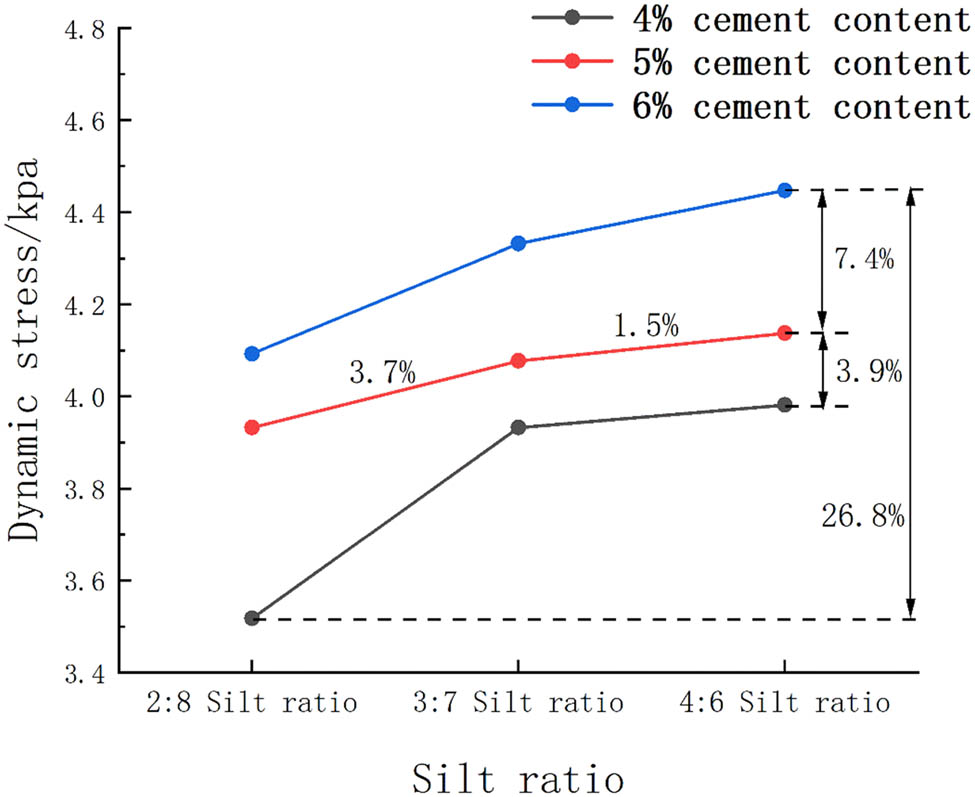
Changes in dynamic stress below subgrade.
In conclusion, the change rule of dynamic response of cement-improved sandy roadbed under train load is as follows: pulverized soil and cement have a reinforcing effect on dynamic displacement, which is unfavorable to the dynamic stress response of the roadbed sublayer, and the dynamic acceleration response is related to the strength of the roadbed material. Furthermore, the degree of influence of cement is greater than that of pulverized soil, and it is advised that the amount of crushed soil mixed be adjusted suitably to improve material performance.
According to the full evaluation and one-factor analysis of dynamic response, both are ideal at 6% cement and a 4:6 pulverized soil ratio. Yanjun and Wenhua [38] and Cui et al. [39] demonstrated that when cement doping reaches 6%, the surface structure becomes smoother and shows an obvious surface cementation stage, and increasing the proportion of cement doping significantly improves the cohesion and internal friction angle of the improved aeolian sand, as well as void filling, which improves the strength of the improved sand and the dynamic stability of the roadbed. The findings of this examination and research are consistent with the statements of various scholars, all of whom see 6% cement doping as an improved remedy for aeolian sand. Liu et al. [40] proposed that 20% powdered soil dosing is easy to compress using static triaxial testing, and electron scanning microscopy demonstrated that filling the holes between sand grains at 20% can improve cohesiveness and make compaction easier under compaction. However, excessive pulverized dirt might generate a too fine particle skeleton, increasing the soil’s compression deformation. Furthermore, an excessive amount of silt can adsorb a considerable amount of water, preventing the hydration reaction of cement, which is detrimental to the enhancement of material qualities. The sensitivity of the mix to water increases dramatically as the dosage of crushed soil increases, resulting in an increase in the specimen’s water content, greater free water lubrication between the particles, and increased elastic strain [41]. At the same time, controlling water content during construction is extremely challenging and will undoubtedly affect the project’s quality and progress [42]. The above Baoyin HSR site test, considering the local climate, frost expansion, and norms and standards, chose a 3:7 powder soil ratio. To summarize, the additional powder dirt increased the roadbed’s stability while negatively impacting field construction and elastic strain. Comprehensive on-site construction, on the basis of superior roadbed stability, the choice of 3:7 powdered soil is advantageous to the completion of on-site compaction, which should be more stable and convenient for option 8.
6.2 Comparison of existing assessment models
Figure 18 depicts a schematic diagram of the indicators covered by the bibliometric technique and the coding criteria, demonstrating that the indicators and statistical weights for both are nearly equivalent. The indications for detecting roadbed stability in the railroad design specification include the physical, mechanical, and environmental features of the roadbed. These indicators can be used to qualitatively examine the safety and longevity of railroad projects. The indicators screened using the bibliometric technique primarily investigate the stability of the roadbed from dynamics and material characteristics, which satisfies the specification criteria and provides a more accurate judgment on the dynamic stability of the roadbed under train loads. The bibliometric method has the advantages of objectivity, comprehensiveness, and visualization in screening evaluation indexes, with data-driven objectivity and relevance, which has strategic guiding significance for the construction of the evaluation index system of dynamic stability of roadbed in line with the design of high-speed railroad roadbed, and knowledge mapping has been widely used in index selection [43,44]. It indicates that this method can take into account multiple factors, and the rating index system is of guiding significance.
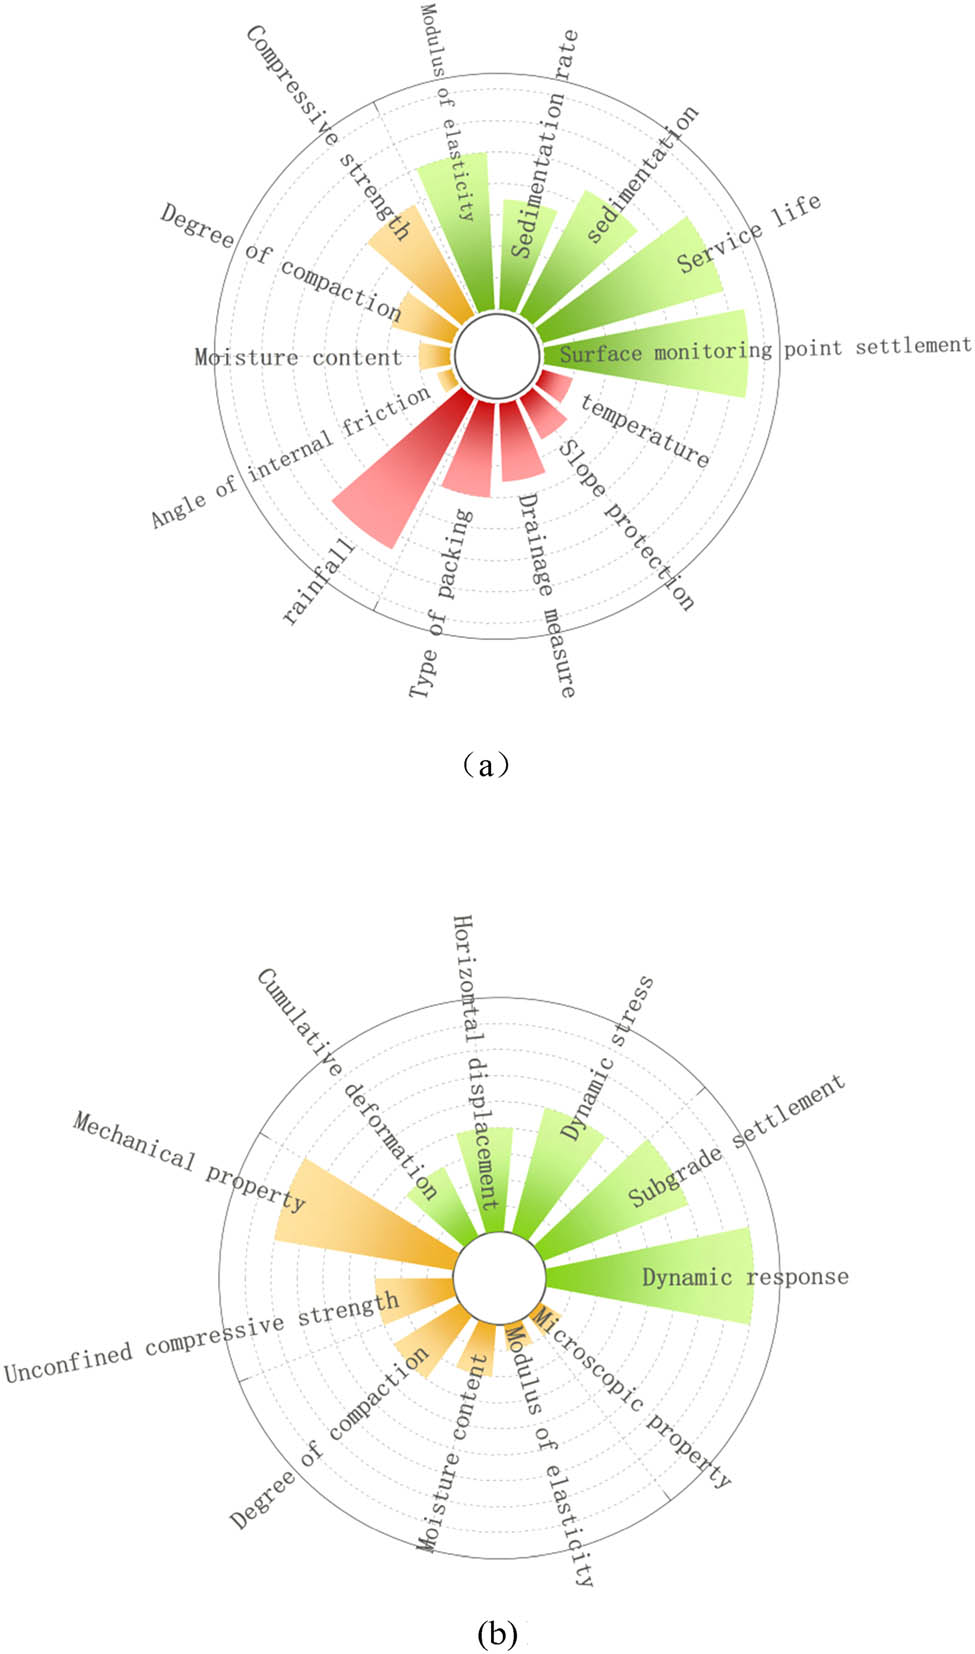
Comparison of evaluation indicators. (a) Specification requirement. (b) Literature research.
The reported progress ranking values were linearly fitted, and the slope value was used to explain the overall resolution level of the ranking findings, as shown in Figure [45]. It shows the evaluation findings and ranking fitting curves for each evaluation model. A comparative examination of the stability of aeolian roadbeds was conducted using the entropy value approach, the AHP-TOPSIS model, and gray connection theory, all of which are extensively utilized in contemporary roadbed evaluation and are suited for small samples and systems with limited information. The results show that the AHP-TOPSIS model has a high correlation with the ranking results of the entropy value method and gray relationship theory, and the evaluation results are highly consistent with each other, with both indicating that scenarios 8 and 9 are more stable roadbeds, indicating the proposed model’s reliability. The slope values of the linear fit of the evaluation model results are 0.028, 0.028, and 0.022, respectively, indicating that the mathematical evaluation model used in this study outperforms other mathematical evaluation models at the evaluation and resolution levels, making it more conducive to decision-making and judgment. Compared to other machine learning assessment approaches, its optimal model prediction is more accurate [46]. However, for small samples, machine learning introduces the issue of data bias, and there is an engineering risk of data distribution sensitivity, making it impossible to estimate the priority (Figure 19).
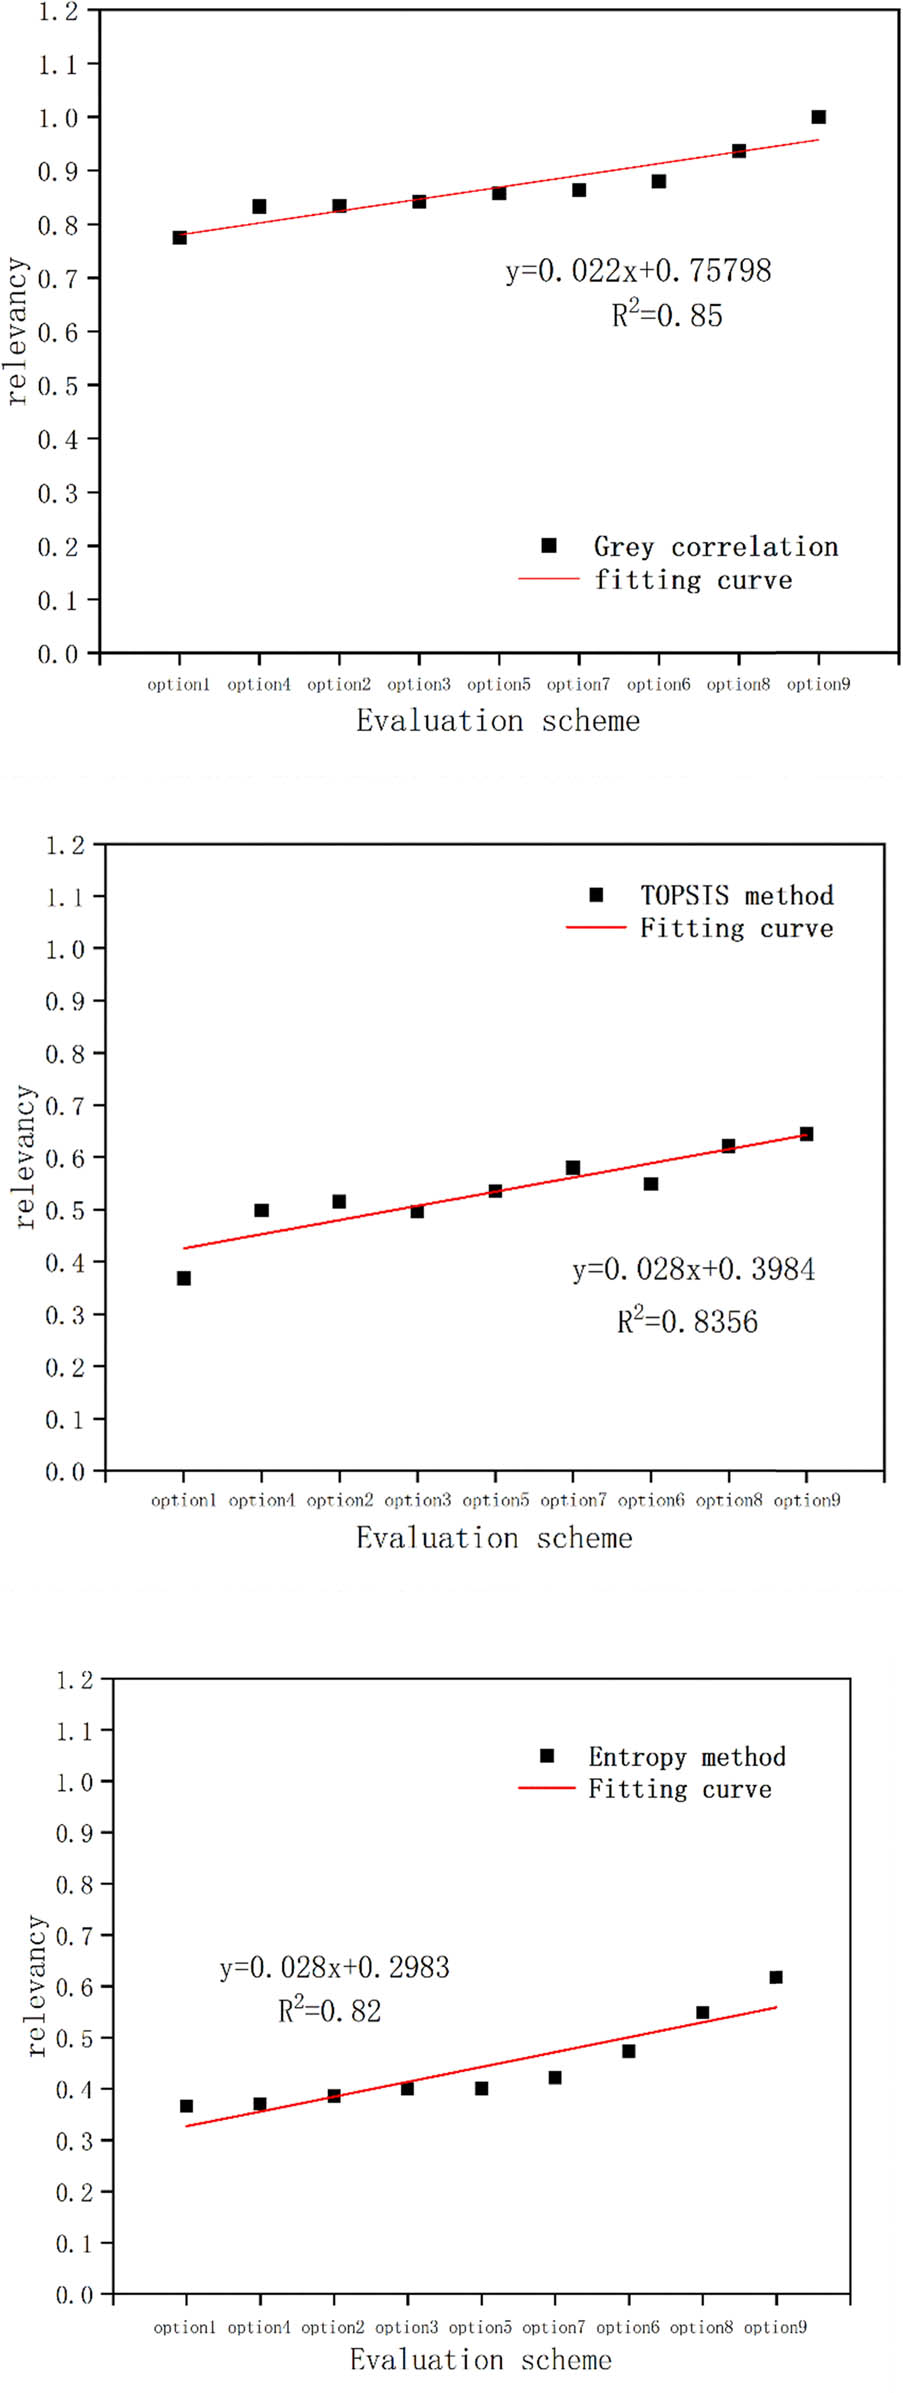
Correlation proximity fitting comparison.
In summary, the method presented in this work integrates theories and methods from various disciplines into a comprehensive evaluation to become a development trend, which can improve the scientific nature of the method, meet the advantages of comprehensiveness, foresight, and high resolution, and is applicable to the quantitative analysis of roadbeds. It aids in resource optimization, error reduction, and result credibility, and the assessment results can be used to construct a cement-improved aeolian sand high-speed railway roadbed.
7 Conclusion
Based on existing evaluation indexes for aeolian sand roadbeds, this study proposes a strategy for optimizing the proportioning of cement-improved aeolian sand roadbeds. The model is used to assess the proportioning scheme for cement-improved sandy roadbed and optimize the proportioning parameters. The primary conclusions are as follows:
A three-level index system for sandy roadbed stability was developed using the hierarchical analysis method and knowledge mapping principles. The evaluation indexes impacting roadbed stability are divided into two categories: mechanical indexes and dynamic reaction indexes, with surface settlement and unconfined compressive strength having the largest weight and serving as the project’s primary monitoring indices.
Using a finite element model, this study examines the impact of cement and pulverized soil on improved soil roadbeds and concludes that pulverized soil and cement have a reinforcing effect on dynamic displacement, which is not conducive to the dynamic stress response, and that the dynamic acceleration response is related to the strength of roadbed material. Cement exerts a greater impact than pulverized earth does.
A comprehensive evaluation of the roadbed using the AHP-TOPSIS method is proposed by synthesizing the various indexes above, and it is concluded that 4:6 pulverized soil ratio and 5% cement mixing are the best for comprehensive stability, with a 5% improvement in stability, but 3:7 pulverized soil ratio and 6% cement mixing are favorable for both field construction and stability. The suggested model’s evaluation findings are consistent with the real project, demonstrating the model’s reliability and the stability of the project roadbed. The research results provide data support for the simulation of aeolian sand and the design of aeolian sand improved soil, offering new ideas for subgrade evaluation
-
Funding information: This work was supported by Major project of China Railway Beijing Engineering Group Co., Ltd (Grant No.2023A-Major project-005),National Natural Science Foundation of China (Grant No. 42277187), and the Basic Research Program of Natural Sciences of Shaanxi Province (Grants No. 2022JM-280).
-
Author contributions: The order of authors of this article is: Yonggang Wang, Hui Wang, Guangying Yuan, Kexin Ren, Xunchang Li, and Wei Yang. Yonggang Wang and Hui Wang Guangying processed the data and wrote the article. Yuan completed the experiment. Kexin Ren conducted experiments and data processing, and revised the article. Xunchang Li helped complete the experiment and revise the article. Wei Yang proposed the idea of the experiment and revised the article.
-
Conflict of interest: The authors state no conflict of interest.
-
Data availability statement: The data underlying this article will be shared on reasonable request to the corresponding author.
References
[1] Du W, Nie R, Qi Y, Ruan B, Mo F. Investigation on the static performance of geogrid reinforced aeolian sand railway embankment: Field test and discrete element simulation. Geotext Geomembr. 2024;52(4):736–52. 10.1016/j.geotexmem.2024.03.012.Search in Google Scholar
[2] Bai L, Yang Z, Wu Y, Anbarlouie M, Pan Z. Stabilization of aeolian sand for pavement subbase applications using alkali-activated fly ash and slag. Minerals. 2023;13(3):453. 10.3390/min13030453.Search in Google Scholar
[3] Mingjun C, Yuhang L, Dongqing L, Feng M. Review on modification measures and evaluation indicators of subgrade fill materials in seasonal frozen soil areas. Highway. 2022;67(9):89–100 (in Chinese).Search in Google Scholar
[4] Buritatum A, Horpibulsuk S, Udomchai A, Suddeepong A, Takaikaew T, Vichitcholchai N, et al. Durability improvement of cement stabilized pavement base using natural rubber latex. Transp Geotech. 2021;28:100518. 10.1016/j.trgeo.2021.100518.Search in Google Scholar
[5] Arulrajah A, Mohammadinia A, D'Amico A, Horpibulsuk S. Cement kiln dust and fly ash blends as an alternative binder for the stabilization of demolition aggregates. Constr Build Mater. 2017;145:218–25. 10.1016/j.conbuildmat.2017.04.007.Search in Google Scholar
[6] Chen M, Shen SL, Arulrajah A, Wu HN, Hou DW, Xu YS. Laboratory evaluation on the effectiveness of polypropylene fibers on the strength of fiber-reinforced and cement-stabilized Shanghai soft clay. Geotext Geomembr. 2015;43(6):515–23. 10.1016/j.geotexmem.2015.05.004.Search in Google Scholar
[7] Arulrajah A, Disfani MM, Haghighi H, Mohammadinia A, Horpibulsuk S. Modulus of rupture evaluation of cement stabilized recycled glass/recycled concrete aggregate blends. Constr Build Mater. 2015;84:146–55. 10.1016/j.conbuildmat.2015.03.048.Search in Google Scholar
[8] Liu J, Pan J, Gao B, Liu J, Hu C, Du H. Field study on vibration characteristics of geocell-reinforced aeolian sand subgrades. Sci Rep. 2024;14:19564. 10.1038/s41598-024-69683-y.Search in Google Scholar PubMed PubMed Central
[9] Yaghoubi E, Al-Taie A, Disfani M, Fragomeni S, Guerrieri M, Gmehling E. Cement and fly ash-treated recycled aggregate blends for backfilling trenches in trafficable areas. Transp Geotech. 2023;42:42. 10.1016/j.trgeo.2023.101091.Search in Google Scholar
[10] Al-Obaydi MA, Abdulnafaa MD, Atasoy OA, Cabalar AF. Improvement in field CBR values of subgrade soil using construction-demolition materials. Transp Infrastruct Geotechnol. 2022;9(2):185–205. 10.1007/s40515-021-00170-x.Search in Google Scholar
[11] Cabalar AF, Omar RA. Stabilizing a silt using waste limestone powder. Bull Eng Geol Environ. 2023;82:300. 10.1007/s10064-023-03302-4.Search in Google Scholar
[12] Dapeng L, Jing W, Qiangqiang C, Mengxi L. Response difference of aeolian sand and gravel soil low embankment under vehicle loading. Geotech Eng Technol. 2023;37(4):443–8. 10.3969/j.issn.1007-2993.2023.04.012.Search in Google Scholar
[13] Mengqian M, Rusong N, Chong Q, Bo R, Yanlu Q. Study on long-term dynamic stability of aeolian sand filling at the bottom layer of railway subgrade bed. J Railw Sci Eng. 2024;21(6):2284–94. 10.19713/j.carol carroll nki/u.T 20231466.43-1423.Search in Google Scholar
[14] Yang X, Hu Z, Wang Y, Wang X. Aeolian sand stabilized by using fiber- and silt-reinforced cement: Mechanical properties, microstructure evolution, and reinforcement mechanism. Constr Build Mater. 2024;411:134750. 10.1016/j.conbuildmat.2023.134750.Search in Google Scholar
[15] Zhang X, Geng J, Hu G, Su L, Li T, Wang Y, et al. Toughening characteristics of rubber granule-improved alkali-activated slag-stabilized aeolian sand. Constr Build Mater. 2024;438:137059. 10.1016/j.conbuildmat.2024.137059.Search in Google Scholar
[16] Cabalar AF, Karabash Z. Influence of cement type and sample preparation on the small-strain behaviour of sands. Arab J Sci Eng. 2019;44:8835–48. 10.1007/s13369-019-04070-8.Search in Google Scholar
[17] Chuxuan T, Jie L, Yino F, Xuan W, Yang Z, Zheng L. Dynamic response of unsaturated wind-sand subgrade to traffic loads. J Civ Eng. 2023;56(S1):194–202. 10.15951/j.t.MGCXB.2023.S1.T44 (in Chinese).Search in Google Scholar
[18] Yang Z. Research on the application of aeolian sand and improved aeolian sand in the subgrade engineering of Menghua heavy haul railway. Master's thesis, Lanzhou Jiaotong University, China, 2017 (in Chinese).Search in Google Scholar
[19] Zhu XW, Tian B, Quan L, Lisi L, Lihui L. Permafrost roadbed stability evaluation based on improved matter-element extension model. J Highw Transp Res Dev. 24;41(12):77–85. 10.3969/j.issn.1002-0268.2024.12.009.Search in Google Scholar
[20] Zhang H, Zheng S, Jing P, Yuan C, Li Y. Influence of pore structure characteristics on the strength of aeolian sand concrete. GRAĐEVINAR. 2024;76(1):34–45. 10.14256/JCE.3602.2022.Search in Google Scholar
[21] Liyang Z, Yingxin H, Jukun G, Sheng Y, Xuguang D. Mechanical deformation characteristics of fly ash embankment and moisture content of comprehensive study. J Silicate Bull. 2025;44(4):1486–94+1524. 10.16552/j.carolcarrollnkiissn1001-1625.2024.1132.Search in Google Scholar
[22] Zheng Y, Bao X. The safety analysis of the Qinghai-Tibet railway permafrost subgrade based on ANP and the extension of TOPSIS method. J Railw Sci Eng. 2018;15(3):605–13. 10.7522/j.issn.1000-0240.2022.0155 (in Chinese).Search in Google Scholar
[23] Bai H, Hu X, Li R, Chen F, Liao Z. Automated particle shape identification and quantification for DEM simulation of rockfill materials in subgrade construction. Adv Mater Sci Eng. 2022;2022(1):5043729, 16. 10.1155/2022/5043729.Search in Google Scholar
[24] Li J, Zhang Z, Liu X, Jiao X, Li J. Assessment on eco-solidified alkali residue reinforced soft soils for intelligent subgrade constructions. Transp Geotech. 2025;51:101516. 10.1016/j.trgeo.2025.101516.Search in Google Scholar
[25] Xin L, Dongning S, Xin X, Lei D, Baoning H. Test and evaluation method for filling quality of foamed mixture lightweight filler subgrade. J Southwest Jiaotong Univ. 2021;56(03):526–33. 10.3969/j.issn.0258-2724.20190678.Search in Google Scholar
[26] Yaping R, Hongnan S, Jing C, Jin Z, Yiwei G. Research on the evaluation method of the operation level of high-speed railway EMUs based on TOPSIS entropy. Weight Method Railw Transp Econ. 2024;46(6):1–7. 10.16668/j.cnki.issn.1003-1421.2024.06.01.Search in Google Scholar
[27] Qinglai H, Kwang-shan Y. Lecture notes in economics and mathematical systems. Berlin, Heidelberg: Springer; 1981. 10.1007/978-3-642-48318-9.Search in Google Scholar
[28] Jie W. Characteristic research on strength of cement improved aeolian sand and deformation of aeolian sand used to fill subgrade for heavy haul railway. Master's thesis, Lanzhou Jiaotong University; 2017.Search in Google Scholar
[29] Pietrasanta AM, Shaaban MF, Aguirre PA, Mussati SF, Hamouda MA. Simulation and optimization of renewable energy-powered desalination: A bibliometric analysis and highlights of recent research. Sustainability. 2023;15(12):9180. 10.3390/su15129180.Search in Google Scholar
[30] China Railway Corporation. Code for design of railway subgrade. China: China Railway Publishing House; 2016.Search in Google Scholar
[31] China Railway Corporation. Observation and evaluation specification for settlement deformation of railway engineering. China: China Railway Publishing House; 2016.Search in Google Scholar
[32] China Railway Corporation. Technical specification for construction of high speed railway roadbed. China: China Railway Publishing House; 2015.Search in Google Scholar
[33] Nie R, Leng W, Yang Q, Chen YF, Xu F. Comparison and evaluation of railway subgrade quality detection methods. Proc Inst Mech Eng Part F: J Rail Rapid Transit. 2018;232(2):356–68. 10.1177/0954409716671551.Search in Google Scholar
[34] Academy of Railway Sciences Corporation Limited, Railway Engineering Research Institute. Test and Inspection Report on Improved Soil for the Bao-Yin High-Speed Railway: Y-2023-009[R]. 2023.Search in Google Scholar
[35] Yonghui S, Linrong X, Yu C, Zhaofeng C. Study on reliability of cement-modified soil subgradefiller for the heavy-haul railway. Railw Stand Des. 2019;63(8):10–5. 10.13238/j.iSSN.1004-2954.201708240001.Search in Google Scholar
[36] Dong J, Yang Y, Zhang X, Yaoyao M. Study on dynamic response of different improvement thickness of subgrade bed of heavy haul railway. Railw Stand Des. 2019;63(10):33–9. 10.13238/j.iSSN.1004-2954.201812010004.Search in Google Scholar
[37] Asteris PG, Skentou AD, Bardhan A, Samui P, Pilakoutas K. Predicting concrete compressive strength using hybrid ensembling of surrogate machine learning models. Cem Concr Res. 2021;145:106449. 10.1016/j.cemconres.2021.106449.Search in Google Scholar
[38] Yanjun L, Wenhua Y. Experimental study on static and dynamic characteristics of aeolian sand. Heilongjiang Sci. 24;15(16):1–4+11. 10.3969/j.issn.1674-8646.2024.16.001.Search in Google Scholar
[39] Cui Q, Liu G, Zhang Z, Fang Y, Gu X. Experimental investigation on the strength and microscopic properties of cement-stabilized aeolian sand. Buildings. 2023;13(2):395. 10.3390/buildings13020395.Search in Google Scholar
[40] Liu W, Tian Z, Lu Y, Jian X,Zhuanding G, Yanjun W. Improvement of triaxial compression characteristics of aeolian sand with cement-mixed silt. Prog Water Resour Hydropower Sci Technol. 2023;43(2):51–7.Search in Google Scholar
[41] Zou B. Lee product packing elastic strain and train load forecasting model. J Railw Sci Eng. 2024;21(6):2511–22. 10.19713/j.carolcarrollnki/u.T20231470.43-1423.Search in Google Scholar
[42] Li P, Jian X, Zhuanding G, Shimao Z, Runze T, Tao G. Study on compaction and shear characteristics of silt modified aeolian sand as embankment filling material. Water Resour Hydropower Eng. 2023;54(5):187–95. 10.13928/j.carolcarrollnkiwrahe.2023.05.018.Search in Google Scholar
[43] Yisi L, Laihong J, Dengming Y, Xinying F, Yu Z. Comprehensive impact evaluation of the western route project of the south-to-north water diversion project on the water source area. J Hohai Univ (Nat Sci Ed). 2025;53(04):10–17. 10.3876/j.issn.1000-1980.2025.04.002.Search in Google Scholar
[44] Zongmin W, Chuangheng L, Xinyi L, Yifan L, Lei J, Yingchun C,et al. Building method of multi-disaster knowledge graph in the upper reaches of the yellow river based on multi-source information fusion. Yellow River. 2025;47(7):103–7+115. 103969/jissn1000–1379202507.017.Search in Google Scholar
[45] Wang L, Zu Q, Zhang Q. Comprehensive impact assessment of the West Route of the South-to-North Water Diversion Project on water source area. PLoS One. 2023;18(6):0287750. 10.1371/journal.pone.0287750.Search in Google Scholar PubMed PubMed Central
[46] Asteris PG, Apostolopoulou M, Armaghani DJ, Cavaleri L, Zhou J. On the metaheuristic models for the prediction of cement-metakaolin mortars compressive strength. 2020. 10.12989/mca.2020.1.1.063.Search in Google Scholar
© 2025 the author(s), published by De Gruyter
This work is licensed under the Creative Commons Attribution 4.0 International License.
Articles in the same Issue
- Research Articles
- Seismic response and damage model analysis of rocky slopes with weak interlayers
- Multi-scenario simulation and eco-environmental effect analysis of “Production–Living–Ecological space” based on PLUS model: A case study of Anyang City
- Remote sensing estimation of chlorophyll content in rape leaves in Weibei dryland region of China
- GIS-based frequency ratio and Shannon entropy modeling for landslide susceptibility mapping: A case study in Kundah Taluk, Nilgiris District, India
- Natural gas origin and accumulation of the Changxing–Feixianguan Formation in the Puguang area, China
- Spatial variations of shear-wave velocity anomaly derived from Love wave ambient noise seismic tomography along Lembang Fault (West Java, Indonesia)
- Evaluation of cumulative rainfall and rainfall event–duration threshold based on triggering and non-triggering rainfalls: Northern Thailand case
- Pixel and region-oriented classification of Sentinel-2 imagery to assess LULC dynamics and their climate impact in Nowshera, Pakistan
- The use of radar-optical remote sensing data and geographic information system–analytical hierarchy process–multicriteria decision analysis techniques for revealing groundwater recharge prospective zones in arid-semi arid lands
- Effect of pore throats on the reservoir quality of tight sandstone: A case study of the Yanchang Formation in the Zhidan area, Ordos Basin
- Hydroelectric simulation of the phreatic water response of mining cracked soil based on microbial solidification
- Spatial-temporal evolution of habitat quality in tropical monsoon climate region based on “pattern–process–quality” – a case study of Cambodia
- Early Permian to Middle Triassic Formation petroleum potentials of Sydney Basin, Australia: A geochemical analysis
- Micro-mechanism analysis of Zhongchuan loess liquefaction disaster induced by Jishishan M6.2 earthquake in 2023
- Prediction method of S-wave velocities in tight sandstone reservoirs – a case study of CO2 geological storage area in Ordos Basin
- Ecological restoration in valley area of semiarid region damaged by shallow buried coal seam mining
- Hydrocarbon-generating characteristics of Xujiahe coal-bearing source rocks in the continuous sedimentary environment of the Southwest Sichuan
- Hazard analysis of future surface displacements on active faults based on the recurrence interval of strong earthquakes
- Structural characterization of the Zalm district, West Saudi Arabia, using aeromagnetic data: An approach for gold mineral exploration
- Research on the variation in the Shields curve of silt initiation
- Reuse of agricultural drainage water and wastewater for crop irrigation in southeastern Algeria
- Assessing the effectiveness of utilizing low-cost inertial measurement unit sensors for producing as-built plans
- Analysis of the formation process of a natural fertilizer in the loess area
- Machine learning methods for landslide mapping studies: A comparative study of SVM and RF algorithms in the Oued Aoulai watershed (Morocco)
- Chemical dissolution and the source of salt efflorescence in weathering of sandstone cultural relics
- Molecular simulation of methane adsorption capacity in transitional shale – a case study of Longtan Formation shale in Southern Sichuan Basin, SW China
- Evolution characteristics of extreme maximum temperature events in Central China and adaptation strategies under different future warming scenarios
- Estimating Bowen ratio in local environment based on satellite imagery
- 3D fusion modeling of multi-scale geological structures based on subdivision-NURBS surfaces and stratigraphic sequence formalization
- Comparative analysis of machine learning algorithms in Google Earth Engine for urban land use dynamics in rapidly urbanizing South Asian cities
- Study on the mechanism of plant root influence on soil properties in expansive soil areas
- Simulation of seismic hazard parameters and earthquakes source mechanisms along the Red Sea rift, western Saudi Arabia
- Tectonics vs sedimentation in foredeep basins: A tale from the Oligo-Miocene Monte Falterona Formation (Northern Apennines, Italy)
- Investigation of landslide areas in Tokat-Almus road between Bakımlı-Almus by the PS-InSAR method (Türkiye)
- Predicting coastal variations in non-storm conditions with machine learning
- Cross-dimensional adaptivity research on a 3D earth observation data cube model
- Geochronology and geochemistry of late Paleozoic volcanic rocks in eastern Inner Mongolia and their geological significance
- Spatial and temporal evolution of land use and habitat quality in arid regions – a case of Northwest China
- Ground-penetrating radar imaging of subsurface karst features controlling water leakage across Wadi Namar dam, south Riyadh, Saudi Arabia
- Rayleigh wave dispersion inversion via modified sine cosine algorithm: Application to Hangzhou, China passive surface wave data
- Fractal insights into permeability control by pore structure in tight sandstone reservoirs, Heshui area, Ordos Basin
- Debris flow hazard characteristic and mitigation in Yusitong Gully, Hengduan Mountainous Region
- Research on community characteristics of vegetation restoration in hilly power engineering based on multi temporal remote sensing technology
- Identification of radial drainage networks based on topographic and geometric features
- Trace elements and melt inclusion in zircon within the Qunji porphyry Cu deposit: Application to the metallogenic potential of the reduced magma-hydrothermal system
- Pore, fracture characteristics and diagenetic evolution of medium-maturity marine shales from the Silurian Longmaxi Formation, NE Sichuan Basin, China
- Study of the earthquakes source parameters, site response, and path attenuation using P and S-waves spectral inversion, Aswan region, south Egypt
- Source of contamination and assessment of potential health risks of potentially toxic metal(loid)s in agricultural soil from Al Lith, Saudi Arabia
- Regional spatiotemporal evolution and influencing factors of rural construction areas in the Nanxi River Basin via GIS
- An efficient network for object detection in scale-imbalanced remote sensing images
- Effect of microscopic pore–throat structure heterogeneity on waterflooding seepage characteristics of tight sandstone reservoirs
- Environmental health risk assessment of Zn, Cd, Pb, Fe, and Co in coastal sediments of the southeastern Gulf of Aqaba
- A modified Hoek–Brown model considering softening effects and its applications
- Evaluation of engineering properties of soil for sustainable urban development
- The spatio-temporal characteristics and influencing factors of sustainable development in China’s provincial areas
- Application of a mixed additive and multiplicative random error model to generate DTM products from LiDAR data
- Gold vein mineralogy and oxygen isotopes of Wadi Abu Khusheiba, Jordan
- Prediction of surface deformation time series in closed mines based on LSTM and optimization algorithms
- 2D–3D Geological features collaborative identification of surrounding rock structural planes in hydraulic adit based on OC-AINet
- Spatiotemporal patterns and drivers of Chl-a in Chinese lakes between 1986 and 2023
- Land use classification through fusion of remote sensing images and multi-source data
- Nexus between renewable energy, technological innovation, and carbon dioxide emissions in Saudi Arabia
- Analysis of the spillover effects of green organic transformation on sustainable development in ethnic regions’ agriculture and animal husbandry
- Factors impacting spatial distribution of black and odorous water bodies in Hebei
- Large-scale shaking table tests on the liquefaction and deformation responses of an ultra-deep overburden
- Impacts of climate change and sea-level rise on the coastal geological environment of Quang Nam province, Vietnam
- Reservoir characterization and exploration potential of shale reservoir near denudation area: A case study of Ordovician–Silurian marine shale, China
- Seismic prediction of Permian volcanic rock reservoirs in Southwest Sichuan Basin
- Application of CBERS-04 IRS data to land surface temperature inversion: A case study based on Minqin arid area
- Geological characteristics and prospecting direction of Sanjiaoding gold mine in Saishiteng area
- Research on the deformation prediction model of surrounding rock based on SSA-VMD-GRU
- Geochronology, geochemical characteristics, and tectonic significance of the granites, Menghewula, Southern Great Xing’an range
- Hazard classification of active faults in Yunnan base on probabilistic seismic hazard assessment
- Characteristics analysis of hydrate reservoirs with different geological structures developed by vertical well depressurization
- Estimating the travel distance of channelized rock avalanches using genetic programming method
- Landscape preferences of hikers in Three Parallel Rivers Region and its adjacent regions by content analysis of user-generated photography
- New age constraints of the LGM onset in the Bohemian Forest – Central Europe
- Characteristics of geological evolution based on the multifractal singularity theory: A case study of Heyu granite and Mesozoic tectonics
- Soil water content and longitudinal microbiota distribution in disturbed areas of tower foundations of power transmission and transformation projects
- Oil accumulation process of the Kongdian reservoir in the deep subsag zone of the Cangdong Sag, Bohai Bay Basin, China
- Investigation of velocity profile in rock–ice avalanche by particle image velocimetry measurement
- Optimizing 3D seismic survey geometries using ray tracing and illumination modeling: A case study from Penobscot field
- Sedimentology of the Phra That and Pha Daeng Formations: A preliminary evaluation of geological CO2 storage potential in the Lampang Basin, Thailand
- Improved classification algorithm for hyperspectral remote sensing images based on the hybrid spectral network model
- Map analysis of soil erodibility rates and gully erosion sites in Anambra State, South Eastern Nigeria
- Identification and driving mechanism of land use conflict in China’s South-North transition zone: A case study of Huaihe River Basin
- Evaluation of the impact of land-use change on earthquake risk distribution in different periods: An empirical analysis from Sichuan Province
- A test site case study on the long-term behavior of geotextile tubes
- An experimental investigation into carbon dioxide flooding and rock dissolution in low-permeability reservoirs of the South China Sea
- Detection and semi-quantitative analysis of naphthenic acids in coal and gangue from mining areas in China
- Comparative effects of olivine and sand on KOH-treated clayey soil
- YOLO-MC: An algorithm for early forest fire recognition based on drone image
- Earthquake building damage classification based on full suite of Sentinel-1 features
- Potential landslide detection and influencing factors analysis in the upper Yellow River based on SBAS-InSAR technology
- Assessing green area changes in Najran City, Saudi Arabia (2013–2022) using hybrid deep learning techniques
- An advanced approach integrating methods to estimate hydraulic conductivity of different soil types supported by a machine learning model
- Hybrid methods for land use and land cover classification using remote sensing and combined spectral feature extraction: A case study of Najran City, KSA
- Streamlining digital elevation model construction from historical aerial photographs: The impact of reference elevation data on spatial accuracy
- Analysis of urban expansion patterns in the Yangtze River Delta based on the fusion impervious surfaces dataset
- A metaverse-based visual analysis approach for 3D reservoir models
- Late Quaternary record of 100 ka depositional cycles on the Larache shelf (NW Morocco)
- Integrated well-seismic analysis of sedimentary facies distribution: A case study from the Mesoproterozoic, Ordos Basin, China
- Study on the spatial equilibrium of cultural and tourism resources in Macao, China
- Urban road surface condition detecting and integrating based on the mobile sensing framework with multi-modal sensors
- Application of improved sine cosine algorithm with chaotic mapping and novel updating methods for joint inversion of resistivity and surface wave data
- The synergistic use of AHP and GIS to assess factors driving forest fire potential in a peat swamp forest in Thailand
- Dynamic response analysis and comprehensive evaluation of cement-improved aeolian sand roadbed
- Rock control on evolution of Khorat Cuesta, Khorat UNESCO Geopark, Northeastern Thailand
- Gradient response mechanism of carbon storage: Spatiotemporal analysis of economic-ecological dimensions based on hybrid machine learning
- Comparison of several seismic active earth pressure calculation methods for retaining structures
- Mantle dynamics and petrogenesis of Gomer basalts in the Northwestern Ethiopia: A geochemical perspective
- Study on ground deformation monitoring in Xiong’an New Area from 2021 to 2023 based on DS-InSAR
- Paleoenvironmental characteristics of continental shale and its significance to organic matter enrichment: Taking the fifth member of Xujiahe Formation in Tianfu area of Sichuan Basin as an example
- Equipping the integral approach with generalized least squares to reconstruct relict channel profile and its usage in the Shanxi Rift, northern China
- InSAR-driven landslide hazard assessment along highways in hilly regions: A case-based validation approach
- Attribution analysis of multi-temporal scale surface streamflow changes in the Ganjiang River based on a multi-temporal Budyko framework
- Maps analysis of Najran City, Saudi Arabia to enhance agricultural development using hybrid system of ANN and multi-CNN models
- Hybrid deep learning with a random forest system for sustainable agricultural land cover classification using DEM in Najran, Saudi Arabia
- Long-term evolution patterns of groundwater depth and lagged response to precipitation in a complex aquifer system: Insights from Huaibei Region, China
- Remote sensing and machine learning for lithology and mineral detection in NW, Pakistan
- Spatial–temporal variations of NO2 pollution in Shandong Province based on Sentinel-5P satellite data and influencing factors
- Numerical modeling of geothermal energy piles with sensitivity and parameter variation analysis of a case study
- Stability analysis of valley-type upstream tailings dams using a 3D model
- Variation characteristics and attribution analysis of actual evaporation at monthly time scale from 1982 to 2019 in Jialing River Basin, China
- Investigating machine learning and statistical approaches for landslide susceptibility mapping in Minfeng County, Xinjiang
- Investigating spatiotemporal patterns for comprehensive accessibility of service facilities by location-based service data in Nanjing (2016–2022)
- A pre-treatment method for particle size analysis of fine-grained sedimentary rocks, Bohai Bay Basin, China
- Study on the formation mechanism of the hard-shell layer of liquefied silty soil
- Comprehensive analysis of agricultural CEE: Efficiency assessment, mechanism identification, and policy response – A case study of Anhui Province
- Simulation study on the damage and failure mechanism of the surrounding rock in sanded dolomite tunnels
- Towards carbon neutrality: Spatiotemporal evolution and key influences on agricultural ecological efficiency in Northwest China
- Review Articles
- Humic substances influence on the distribution of dissolved iron in seawater: A review of electrochemical methods and other techniques
- Applications of physics-informed neural networks in geosciences: From basic seismology to comprehensive environmental studies
- Ore-controlling structures of granite-related uranium deposits in South China: A review
- Shallow geological structure features in Balikpapan Bay East Kalimantan Province – Indonesia
- A review on the tectonic affinity of microcontinents and evolution of the Proto-Tethys Ocean in Northeastern Tibet
- Advancements in machine learning applications for mineral prospecting and geophysical inversion: A review
- Special Issue: Natural Resources and Environmental Risks: Towards a Sustainable Future - Part II
- Depopulation in the Visok micro-region: Toward demographic and economic revitalization
- Special Issue: Geospatial and Environmental Dynamics - Part II
- Advancing urban sustainability: Applying GIS technologies to assess SDG indicators – a case study of Podgorica (Montenegro)
- Spatiotemporal and trend analysis of common cancers in men in Central Serbia (1999–2021)
- Minerals for the green agenda, implications, stalemates, and alternatives
- Spatiotemporal water quality analysis of Vrana Lake, Croatia
- Functional transformation of settlements in coal exploitation zones: A case study of the municipality of Stanari in Republic of Srpska (Bosnia and Herzegovina)
- Hypertension in AP Vojvodina (Northern Serbia): A spatio-temporal analysis of patients at the Institute for Cardiovascular Diseases of Vojvodina
- Regional patterns in cause-specific mortality in Montenegro, 1991–2019
- Spatio-temporal analysis of flood events using GIS and remote sensing-based approach in the Ukrina River Basin, Bosnia and Herzegovina
- Flash flood susceptibility mapping using LiDAR-Derived DEM and machine learning algorithms: Ljuboviđa case study, Serbia
- Geocultural heritage as a basis for geotourism development: Banjska Monastery, Zvečan (Serbia)
- Assessment of groundwater potential zones using GIS and AHP techniques – A case study of the zone of influence of Kolubara Mining Basin
- Impact of the agri-geographical transformation of rural settlements on the geospatial dynamics of soil erosion intensity in municipalities of Central Serbia
- Where faith meets geomorphology: The cultural and religious significance of geodiversity explored through geospatial technologies
- Applications of local climate zone classification in European cities: A review of in situ and mobile monitoring methods in urban climate studies
- Complex multivariate water quality impact assessment on Krivaja River
- Ionization hotspots near waterfalls in Eastern Serbia’s Stara Planina Mountain
- Shift in landscape use strategies during the transition from the Bronze age to Iron age in Northwest Serbia
- Assessing the geotourism potential of glacial lakes in Plav, Montenegro: A multi-criteria assessment by using the M-GAM model
- Flash flood potential index at national scale: Susceptibility assessment within catchments
- SWAT modelling and MCDM for spatial valuation in small hydropower planning