Hydroelectric simulation of the phreatic water response of mining cracked soil based on microbial solidification
-
Ying Gao
 ,
Mohd Ashraf Mohamad Ismail
,
Mohd Ashraf Mohamad Ismail
 ,
Tao Li
,
Bo Li
,
Tao Li
,
Bo Li

Abstract
Coal mining in ecologically fragile areas results in the failure of aquiclude layers and the loss of surface water bodies. Herein, research was conducted on the microbial solidification of cracked soils and the corresponding response of the ecological water table. A simulation of mining-induced cracked soils was performed via microbial solidification. The mechanical and hydrological properties of cracked soil samples repaired with different filling materials were compared via unconfined compressive strength and falling head permeability tests. Hydraulic-electric similarity modeling techniques were employed to evaluate the effectiveness of microbial solidification in the aquiclude layers. After low-temperature acclimation, Bacillus megaterium adapted to the geological environment of the study area, exhibiting a high viable cell density. When the cracked soil was filled with a 1:1 ratio of aeolian sand to clay particles, the microbially remediated soil demonstrated optimal mechanical and hydraulic properties. Hydraulic-electric similarity numerical simulations revealed that the ecological water table at the coalface remained within a reasonable range following microbial solidification, suggesting that microbial solidification achieved water-preserving coal mining. These findings provide a reference for restoring aquiclude layers damaged by coal mining.
1 Introduction
Currently, China’s main coal mining areas are concentrated in ecologically fragile areas (Shanxi, Shaanxi, Ningxia, Inner Mongolia, Xinjiang, Guizhou, and other areas), causing damage to aquiclude layers [1], leading to the loss of surface ecological water [2], and further exacerbating environmental degradation in these regions [3]. Research has been conducted on repairing cracked soil and reconstructing aquifers [4], including natural restoration [5,6], mechanical repair [7], and chemical grouting [8]. However, owing to issues such as cost, environmental protection, and grouting technology, large-scale application is not yet possible.
Microbially induced calcium carbonate precipitation (MICP), as an emerging environmentally friendly geotechnical restoration technology, is currently widely used in studies on seabed solidification, concrete crack repair, loose sand stabilization, ancient building crack restoration, island reef soil reinforcement, and desertification prevention [9,10,11,12]. Soil stabilization is a key area of interest [13]. MICP technology utilizes bacterial metabolic pathways to naturally produce nontoxic calcite minerals that bind soil particles, thereby increasing the stiffness, strength, water retention, and fertility of the soil [14,15]. Zhang et al. [1] explored the impact of coal mining on surface ecology, particularly soil moisture distribution and vegetation, and proposed the use of crack-filling restoration and shrub planting to reduce soil moisture loss and restore the structure of mined soils. Ji et al. [16] investigated the restoration of soil structures in loess-aeolian sand mining areas and reported that fungal communities of the Ascomycota phylum promoted the recovery of the original soil structure. Yao et al. [17] employed MICP to stabilize aeolian sand, in which the dry density, permeability, and water retention of the sand were significantly improved. MICP binds soil particles, fills soil pores, and alters the particle arrangement and pore size distribution, solidifying the soil and changing its microstructure [18]. Current microbial solidification experiments focus mainly on stabilizing loose soils, with few studies on the stabilization of filled cracked soils caused by mining activities.
There are many soil stabilization techniques [19,20], but combinations of multiple methods, particularly for the filling of cracks in coal mining areas, have rarely been reported. Therefore, the ecologically fragile Ningxiaota coal mine was used as a case study, the characteristics of fractured soil were simulated, and MICP remediation experiments were conducted on the fractured soil. This research reveals the changes in the physical, chemical, and mechanical parameters of soil after solidification, providing a reference for microbial mineralization restoration in ecologically fragile areas.
The research process (Figure 1) is divided into four parts: (a) field investigation (the depth and width of cracks and the filling characteristics) and sampling (the moisture content and preparation of cracked soil samples); (b) microbial acclimatization (strain selection and low-temperature acclimation); (c) the unconfined compressive strength (UCS) and permeability of the solidified cracked soils; and (d) hydraulic-electric similarity simulation experiments to evaluate the effectiveness of microbial solidification in repairing aquiclude layers disturbed by coal mining.

Research process chart.
2 Background of microbial solidification in coal-mining crack soils
The study area is located in the ecologically fragile Ningtiaota coal mine in northern Shaanxi Province, with Kaokaowusu Gou as the boundary, aeolian sand landforms in the south, and the loess mount landform in the north. According to previous research, the aquiclude of this mine is generally thick (40–120 m), but the thickness of the bedrock is relatively limited. Coal-mining water-conducting cracks are guided through the bedrock, and the aquiclude is damaged to different degrees. Therefore, the study of microbial curing of the aquiclude was carried out, and the background analysis of solidification was as follows.
2.1 Geological background of coal mining
The geological background of this study area was the Ningtiaota coal mine in the Shennan mining area, Yulin City, Shaanxi Province, China. The 2–2 coal is first mined in the southern area of the Ningtiaota Coal Mine, and its area location and mining geological background are shown in Figure 2. The mining thickness of the 2–2 coal is approximately 4 m, and the average thickness of the overlying strata is 198.4 m. There is no significant geological structure in the study area, and the dip angle of the strata is approximately 1°. The overlying strata of 2–2 coal can be generalized into four main hydrogeological layers from bottom to top: the relative aquifuge of the bedrock of the Yan’an Formation of the Jurassic (J2y, averaging approximately 77.9 m), the weathered bedrock aquifer of the Zhiluo Formation of the Jurassic (J 2z , averaging approximately 19.5 m), the aquifuge of loess (the Q2 Lishi loess and N2 Baode loess, averaging approximately 91 m), and the sand layer of the submersible aquifer (the Q3 Salawusu Formation aquifer and the Q4 Quaternary aeolian sand aquifer, averaging approximately 10 m). Sandy submerged aquifers play an important role in supporting surface ecology, but the cracks caused by coal mining lead to a decrease in the level of sandy aquifers. In this process, the thicker loess aquifuge in the study area is particularly important for seepage. Therefore, the use of MICP technology to repair the damaged loess aquitard caused by coal mining is of great significance.

Location of the study area and geologic histograms.
2.2 Characteristics of coal mining crack soil development
Huang Qingxiang reported that cracks formed by coal mining can be categorized into “upward cracks” and “downward cracks” [6,21,22]. The two types of cracks are believed to be directly related, and the development directions of “upward cracks” and “downward cracks” were found to be the same by the microresistivity scanning images of the boreholes [8], as shown in Figure 3 (with a difference of 3–6° in the crack direction). It is difficult to observe “upward cleavage” directly, and the “downward cleavage” feature was observed on the surface in this study, which represents the characteristics of the cleavage soil induced by coal mining.

Comparison of scanning electron microscopy and ground observations of coal mining cracks.
To fully simulate the solidification law of shallow soil cracks under in situ conditions, field geological investigations and onsite measurements were carried out on the soil cracks in the loess-covered area in the northern part of the study area. Combined with the existing research results, the following conclusions regarding the characteristics of the soil bodies in coal-mining cracks in the study area were drawn.
2.2.1 Geometric features
The depth and width of four groups of representative soil cracks during coal mining were observed [6,8,22], as shown in Figures 4 and 5 (the coal mining working line is 10 m away from the crack at the time 0 point, followed by 1 observation every 2 days and consecutive observations for 10 days). The width and depth of the soil cracks were affected by the mining process, exhibiting a trend of first increasing, then decreasing, and finally stabilizing at 0.085 and 0.1775 m, respectively.

Dynamic change in the soil crack depth.

Dynamic change in the soil crack width.
2.2.2 Characteristics of filling
After the stable period of coal mining collapse, the restoration of mining crack soil is concentrated. Field geological investigation and field measurement were performed on the filling characteristics of the coal mining face after the completion of 1a, as listed in Table 1. The fill in the crack consists of aeolian sand and loess, with a filling density between 1.44 and 1.51 g/cm3 and a filling rate between 9.4 and 100%.
Characteristics of crack soil filling in the study area
| Landforms | Filling | Average filling rate (%) | Average filling density (g/cm3) |
|---|---|---|---|
| Aeolian sand | Aeolian sand and loess | 100 | 1.51 |
| Loess ridge | Aeolian sand and loess | 9.4 | 1.44 |
2.3 Geological environment characteristics of microbial remediation
To fully simulate the microbial remediation of coal-mining cracked soils in the in situ geologic environment, the geologic environment characteristics of the cracked soils were analyzed, and the experimental conditions were set on the basis of the geologic environment characteristics.
2.3.1 Temperature characteristics
The temperature conditions are critical for microbial work. The temperature difference between day and night in spring and autumn in Yulin City is significant, which requires temperature adjustments to simulate the in situ characteristics. The experimental temperature for microbial remediation of soil cracks was manually adjusted via a biochemical incubator, and the temperature ephemeral curve of daily adjustment is displayed in Figure 6.

Temperature curve of the soil restoration process.
2.3.2 Characterization of the soil moisture content
The moisture content of the cracked soil was tested via onsite sampling. The sampling and testing process was as follows: after the completion of the 1a coal mining, ten groups of soil samples (five groups were soil samples far from the crack area, and the other five groups were soil samples near the crack area) were obtained within a depth range of 0–2 m on the surface of the coal mining subsidence area. The natural moisture content of the soil samples was tested, as listed in Table 2. The average moisture contents of the soils away from the cracks (Y1 to Y5) and near the cracks were 23.3 and 16.7%, respectively. The natural moisture content of the soil near the cracks (Y6–Y10) generally decreased due to evaporation. The moisture content variance was large, and the degree of dispersion was high. Therefore, the initial moisture content of the soil samples used in the experiments in this study was 16.7%.
Test results of the moisture content of the soil samples in the mining subsidence area
| Distance to crack (m) | No. | Moisture content (%) | Average moisture content (%) | Variance |
|---|---|---|---|---|
| 5.4 | Y1 | 26.5 | 23.3 | 3.4024 |
| 5.0 | Y2 | 22.6 | ||
| 4.4 | Y3 | 24.0 | ||
| 3.7 | Y4 | 21.5 | ||
| 3.1 | Y5 | 21.7 | ||
| 0.3 | J1 | 14.8 | 16.7 | 3.4264 |
| 0.3 | J2 | 17.6 | ||
| 0.4 | J3 | 16.9 | ||
| 0.1 | J4 | 14.5 | ||
| 0.6 | J5 | 19.5 |
3 Preparation of experimental materials
3.1 Bacterial strain culture and adaptability test
Among the species tested thus far, anaerobic fermenters, anaerobic respiratory bacteria, and specialized aerobic bacteria may be suitable for geotechnical applications. Notably, parthenogenetic anaerobes and microaerobes are the most suitable microorganisms for soil bioconjugation [23]. Northern Shaanxi is perennially cold, and the study area is close to the Maowusu Desert, with an average annual temperature of 7.3°C and an annual precipitation of 365 mL, which is a typical arid/semiarid area [24]. Bacillus megaterium (purchased from the China General Microbiological Culture Collection Center, CGMCC strain No. CGMCC1.16094) was selected for this experiment, which is a heat-resistant and thermophilic bacterium and a parthenogenetic anaerobe. The strain is commonly used in the production of organic fertilizers for crops and the treatment of polluted water and is an environmentally friendly microorganism [25]. Compared with other strains, B. megaterium grows and reproduces faster at low temperatures (10 and 15°C) and has greater urease activity. Therefore, B. megaterium is more suitable for low-temperature environments [26,27].
Inoculation refers to the original bacterial mixture from which a small amount of natural selection of microorganisms was pumped into the new medium The purchased strains were inoculated three times (Figure 7), and each time was used in the temperature curve shown in Figure 6 for cultivation. A ultra violet‒visible spectrophotometer was used to determine the absorbance value of the bacterial fluid samples at a wavelength of 600 nm (OD600 value) every 13 days. The OD600 value reflects the activity of microorganisms, with a positive correlation between the two. In addition, the conductivity of the mixture of bacterial mixture and urea was employed to determine the urease activity of B. megaterium. The larger the value is, the better the activity of the bacterium. As shown in Figure 8, after three rounds of inoculation, the local adaptability of the microorganisms increased, the density of the active bacteria increased substantially, and the bacteria could be used to restore mining cracked soil. Compared with the literature [28], the peak of the OD600 was pushed back and decreased under the fluctuating temperature conditions, but the stabilization period of the bacterial activity was longer, i.e., the microbial action was more durable. In summary, all subsequent microbial curing experiments were carried out 7 days after inoculation with three generations of microorganisms, and then the soil characterization test was performed after solidification for 8 days.

Microbial inoculation.

Observation results of the microbial OD600 and urease activity in different generations.
3.2 Preparation of cracked soil samples
Synthesizing the characteristics of the cracked soil induced by coal mining in Section 2.2, the geometry of the cracked soil samples for this indoor experiment was set as follows: the width of the crack was 1 cm, the depth of the crack was 2.1 cm (2.1 times the width), and the crack was pointed out downwards (soil cracks made via 3D-printed thin slices). The filler inside the crack was aeolian sand and loess with different mixing ratios. The bacterial solution and cement solution were injected into the cracked soil. The process is shown in Figure 9.

Cracked soil sample preparation process.
Based on the crack characteristics of the soil described in Section 2.2, cracked soil samples for the uniaxial compressive strength test and falling head permeability test were prepared, and the moisture content of the soil samples was determined to be 16.7%. The main soil samples were those of the Lishi Formation and Baode Formation. In addition, aeolian sand and loess particles with ratios of 2:1, 1:1, and 1:2 (both taken from the study area and dried and sieved) served as the fillers for the cracks. The crack was filled with three layers of well-mixed filling materials and compacted to control the density of 1.9–2.1 g/cm3 after compaction. The sample groups were subjected to microbial solidification (Table 3), with three samples in each group and a total of 36 solidified remediation soil samples. The comparison group without microbial solidification was prepared with 36 blank soil samples corresponding to the solidified samples in Table 3 one by one.
Preparation of cracked soil samples
| Grouping | Soil type | Filling sand-to-soil ratio | Test items |
|---|---|---|---|
| 1 | Baode laterite | 2:1 | Uniaxial compressive strength |
| 2 | Baode laterite | 1:1 | Uniaxial compressive strength |
| 3 | Baode laterite | 1:2 | Uniaxial compressive strength |
| 4 | Baode laterite | 2:1 | Falling head permeability |
| 5 | Baode laterite | 1:1 | Falling head permeability |
| 6 | Baode laterite | 1:2 | Falling head permeability |
| 7 | Lishi loess | 2:1 | Uniaxial compressive strength |
| 8 | Lishi loess | 1:1 | Uniaxial compressive strength |
| 9 | Lishi loess | 1:2 | Uniaxial compressive strength |
| 10 | Lishi loess | 2:1 | Falling head permeability |
| 11 | Lishi loess | 1:1 | Falling head permeability |
| 12 | Lishi loess | 1:2 | Falling head permeability |
4 Experimental methods
4.1 Uniaxial compression test
The third-generation bacterial liquid and cementing liquid (calcium chloride and urea concentrations of 0.1 mol/L) cultivated for 7 days were injected into the cracked soil samples described in Section 3.2 at a volume ratio of 1:1.5, and the samples were prepared according to the fabrication steps in Figure 9. The maintenance was carried out according to the temperature ephemeral curve in Figure 6. After 8 days of maintenance, the uniaxial compressive strength test was conducted using an electric lime soil unconfined compression tester (YYW-II), and the loading rate was controlled at 1 mm/min.
4.2 Falling head permeability test
The third-generation bacterial liquid and cementing liquid (calcium chloride and urea concentrations of 0.1 mol/L) cultivated for 7 days were injected into the cracked soil samples described in Section 2.2 at a volume ratio of 1:1.5, and the samples were generated according to the fabrication steps in Figure 9. The maintenance was performed according to the temperature ephemeral curve in Figure 6. After 8 days of maintenance, the permeability test was carried out using a South-55 falling head permeameter with an initial head height of 100 mm. The changes in the water head and time were recorded, and the test was repeated 5 times.
4.3 Similar numerical simulation tests for hydropower
4.3.1 Principles of similar simulation
4.3.1.1 Hydropower similarity principle
The simulation of hydropower selection is similar to simulation technology (with the current field used to simulate the groundwater seepage field) but different from traditional physical circuit simulation. The virtual circuit model in MATLAB for hydropower is similar to the simulation. One of the main simulation principles is that the seepage of water in the soil conforms to Darcy’s law and Laplace’s equation. Moreover, the current flows in the conducting medium according to Ohm’s law and Laplace’s equation. Owing to the similarity of the equations, the current field can be used to simulate the groundwater seepage field [29,30]. Similar equations for the seepage field and electric field are shown in equation (1). Figure 10 shows the difference cell of the seepage field and the R‒C cell of the circuit field.
where V denotes the voltage of the circuit field, H is the head of the seepage field, and R xx and R yy represent the horizontal resistance of the circuit field. The x direction is the direction of 0–6 in Figure 13, and the y direction is 0–2. K xx and K yy refer to the horizontal permeability coefficient of the seepage field, R zz represents the vertical resistance of the circuit field, and the z direction is the direction of 0–3 in Figure 13. K zz indicates the vertical permeability coefficient of the seepage field; C represents the circuit of the circuit field, s is the water storage rate of the seepage field containing the water barrier, I denotes the current of the circuit field, Q signifies the flow rate of the seepage field, t m is the time of the circuit field, and t is the time of the seepage field. ɑ, β, and γ represent the three similarity coefficients, where ɑ = 1, β = 10−2, and γ = 10−4. Δx, Δy, and Δz are the differences in spacing in the three directions.

Hydropower similarity simulation unit. Hydropower similarity simulation unit. (a) the difference cell of the seepage field; and (b) the R‒C cell of the circuit field.
Simulation flow of synchronous operation.
Compared with traditional geotechnical and hydrological simulation techniques, this technique can realize additional hydrological boundary conditions and simulate the seepage field under the evolution of the hydrological parameters of an aquifer under mining disturbance. Thus, hydroelectric similarity simulations are particularly suited for hydrologic dynamics where aquifer and aquiclude conditions undergo mutual changes. The principle of specifically simulating the ecological water level response of coal mining and MICP restoration is as follows.
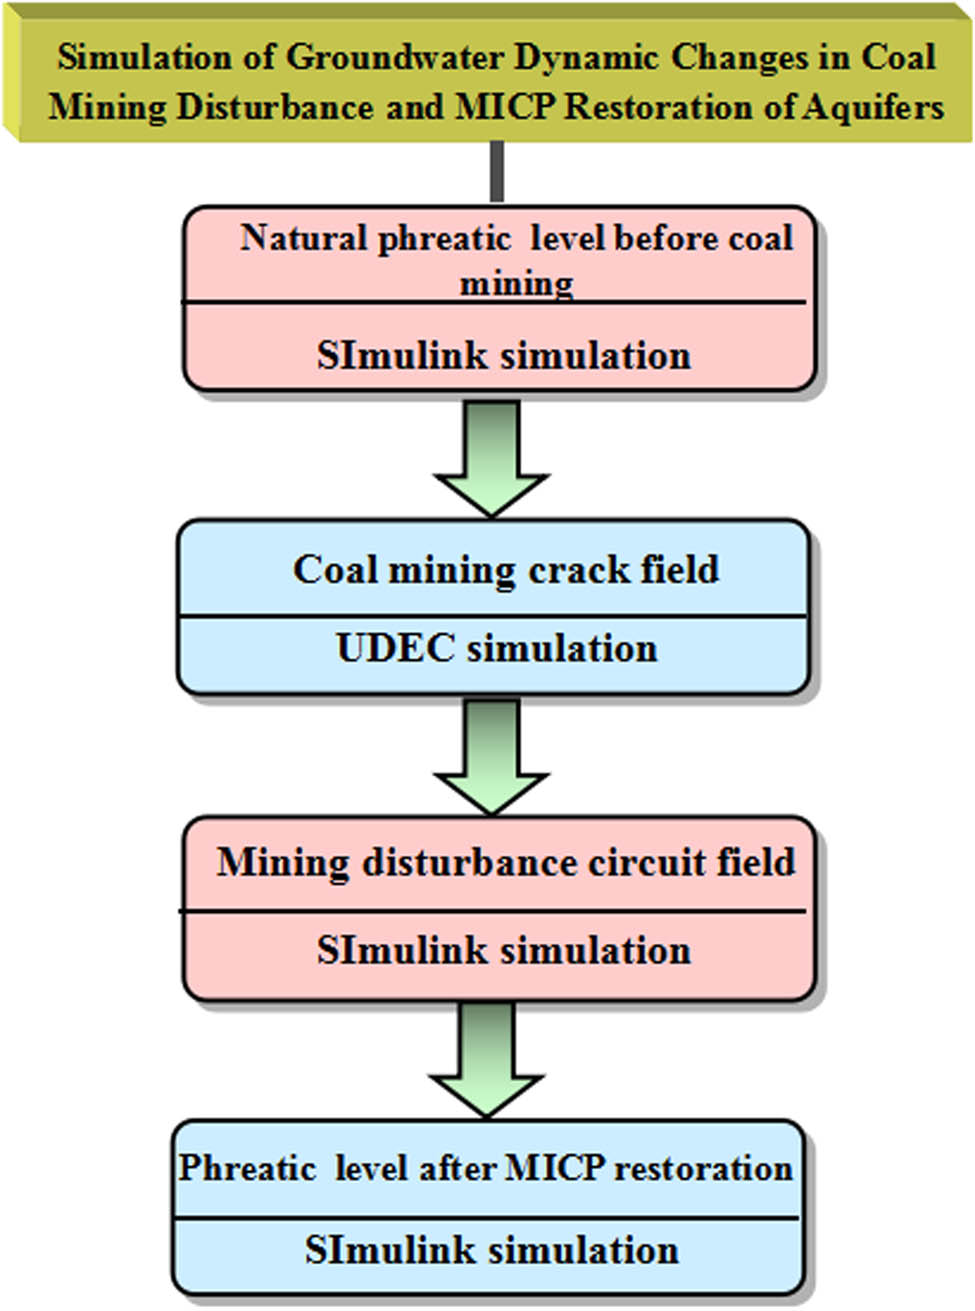
4.3.1.2 Mining similarity principle
To simulate the hydrological dynamic response of coal mining disturbances and MICP restoration of the water barrier accurately, the principles of synchronous operation of geotechnical simulation and circuit simulation were adopted. The synchronous simulation process is shown in Figure 11. (1) Based on the original hydrogeological data, Simulink software was used to construct the natural circuit field model before coal mining and simulate the natural diving level. (2) According to the original engineering geological data, the geotechnical model was constructed via UDEC software, and the coal mining crack field was simulated. (3) The coal mining crack field was transplanted into the circuit field (adjusting parameters such as resistance and capacitance in the range of the crack field to 0) and the inversion was simulated via Simulink software to obtain the coal mining water level. (4) On the basis of the experimental law of MICP restoration, the resistance parameters of the recovery area were adjusted using Simulink software, and then the water levels of different areas were reversed after recovery.
Characteristic change curves for different fillings.
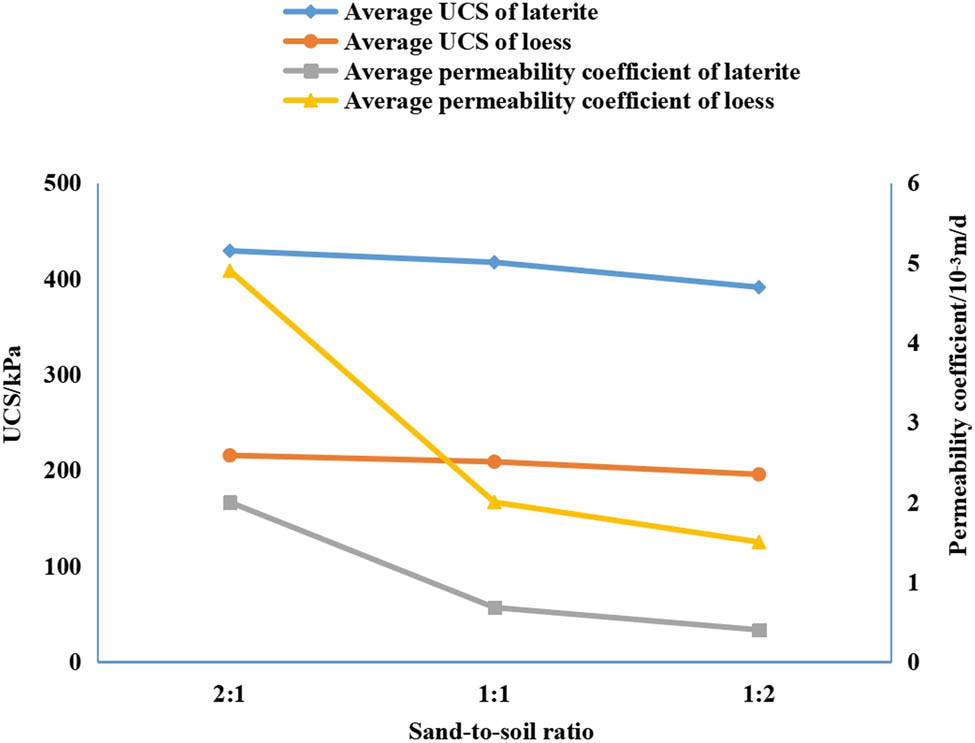
4.3.2 Construction of a simulation prototype
The microbial solidification of cracked soil aims to improve the strength and waterproofness of the soil simultaneously, thus effectively reducing water leakage in coal mining subsidence areas. Combined with the measured uniaxial compressive strength and permeability coefficient data (Figure 12), a 1:1 mass ratio of filler sand to soil can account for both strength and hydrological properties, which is suitable for coal mining cracked soil remediation. Therefore, the following similar simulation tests were carried out under this ratio to study the microbial remediation of the coal mining face.
Circuit model based on water‒electricity similarity.
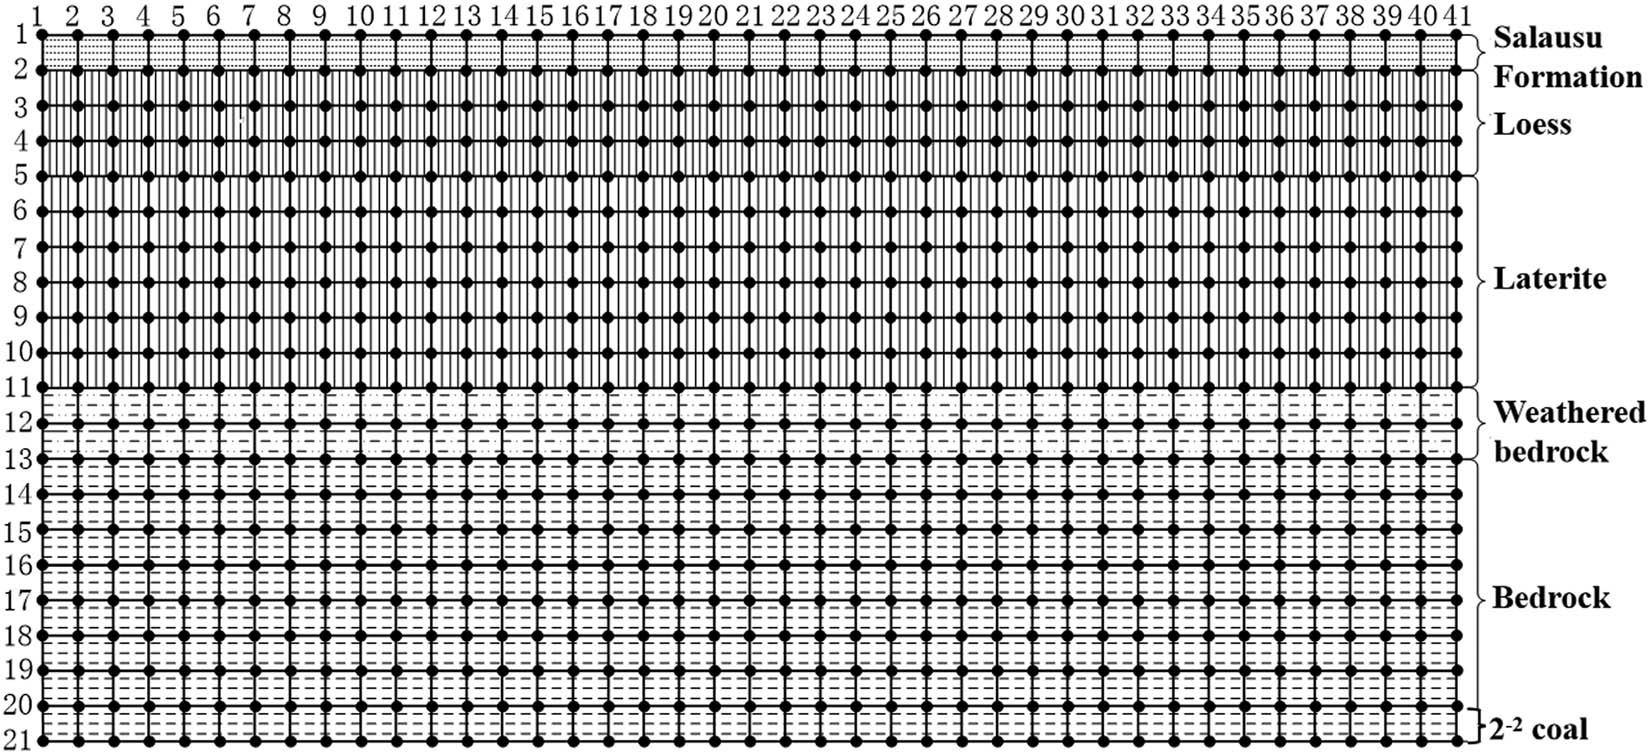
This simulation took the typical hydrogeological conditions of the Ningtiaota coal mine in northern Shaanxi as the model background (Tables 4 and 5). Combined with the hydroelectric similarity rules, the circuit and geotechnical models are shown in Figures 13–14. Among them, the water level of the sand layer (ecological diving level) is the target level for water conservation and coal mining. The underlying loess and laterite constitute the aquiclude, which is the target for restoration in this study. Coal mining destroys bedrock, and it inevitably causes the sand layer water level to fall. In this simulation, 100 m of coal pillars was left at each end without mining.
Hydrogeological parameters of typical aquifers in the study area
| No. | Stratum | Layer thickness (m) | Permeability coefficient (m/day) | Water storage rate (1/m) | Hydrological boundary conditions |
|---|---|---|---|---|---|
| 1 | Salawusu Formation | 10 | 3.88 | 1.7 × 10⁻⁴ | Fixed water levels 198 m and 195 m for Nos. 1 and 41 |
| 2 | Lishi loess | 30 | 0.017 | 1.3 × 10⁻³ | — |
| 3 | Baode laterite | 60 | 0.0016 | 2.6 × 10⁻³ | — |
| 4 | Weathered bedrock | 20 | 0.0838 | 4 × 10⁻⁵ | fixed water levels 183 and 180 m for Nos. 1 and 41 |
| 5 | Bedrock | 80 | 0.001 | 3 × 10⁻³ | — |
Electric field parameters corresponding to typical hydrogeological conditions in the study area
| No. | Stratum | Voltage (V) | Horizontal resistance (Ω) | Vertical resistance (Ω) | Capacitance/10−6F |
|---|---|---|---|---|---|
| 1 | Salawusu Formation | Fixed voltages 198 and 195 V for Nos. 1 and 41 | 0.0026 | 0.0026 | 1 |
| 2 | Lishi loess | — | 0.59 | 0.59 | 13 |
| 3 | Baode laterite | — | — | 6.25 | 26 |
| 4 | Weathered bedrock | Fixed voltage 183 and 180 V for Nos. 1 and 41 | 0.12 | 0.12 | 0.4 |
| 5 | Bedrock | — | 10 | 10 | 30 |

Synchronized constructed geotechnical mode.
5 Comprehensive analysis
5.1 Analysis of the uniaxial compressive strength results
Currently, the application of MICP is focused primarily on loose soils [31,32], with limited studies available on the stabilization of cracked soils. According to structural surface control theory, the key factor influencing the improvement in UCS in cracked soils lies in the filling materials within the cracks and the effectiveness of their interface solidification [33,34]. Kulanthaivel et al. [32] reported that MICP is more effective at enhancing the mechanical strength of coarse-grained soils than fine-grained soils. Hataf and Jamali [35] further demonstrated that the UCS of treated soils significantly increased when fine grains were incorporated. Therefore, the ratio of coarse particles (sand) to fine particles (soil) in the filling materials of cracked soils is a critical parameter that requires further investigation. The results of the UCS tests on cracked soils are shown in Figure 15.

Uniaxial compressive strength of microbial solidification with different filling ratios: (a) Baode laterite and (b) Lishi loess.
Effectiveness of microbial mineralization: MICP significantly improved the UCS of cracked soils. Compared with untreated samples, samples solidified by MICP showed substantial increases in UCS. The UCS of cracked red soils from the Baode Formation and cracked loess from the Lishi Formation increased by 202–329 kPa and 206–325 kPa, respectively.
Improvement in mechanical uniformity: Before solidification, the standard deviations of the UCS for cracked red soils from the Baode Formation and cracked loess from the Lishi Formation were 10.95 and 24.51 kPa, respectively. After microbial solidification, these values decreased to 10.08 and 4.52 kPa, respectively. Cracked soils exhibited poor mechanical uniformity before MICP treatment, but MICP significantly enhanced their uniformity.
Influence of the particle size ratio: The ratio of coarse to fine particles in the crack-filling materials had a considerable effect on MICP solidification. A higher proportion of sand in the filling material led to an increase in overall strength, although the improvement is relatively modest, with the red soil of the Baode Formation showing a maximum increase of 49 kPa and the loess of the Lishi Formation showing a maximum increase of 60 kPa.
Mechanism of strength enhancement: The mechanical strength after microbial solidification was significantly improved due to the naturally low UCS of cracked soils. MICP-induced calcite minerals effectively bonded loose particles into a solid mass, forming a cohesive structure with the surrounding soils. As shown in Figure 16, the cluster formations between the sand particles consisted of calcite, indicating a clear cementation effect. Furthermore, given the same amount of cementation, the particle size influenced the mechanical strength of the samples, with an increase in the sand content leading to a slight improvement in strength.

Magnified micrograph of fillings.
5.2 Analysis of the falling head permeability results
Currently, research on MICP primarily focuses on improving the impermeability of single-type soil [36,37]. In contrast, cracked soil, once filled, represents a mixed-type soil, and studies on the permeability changes of such mixed soil bodies after MICP treatment are lacking. According to Darcy’s law, the porosity characteristics of the filling material in cracks are the key controlling factor for permeability changes in mixed soils. Therefore, the ratio of coarse particles (sand) to fine particles (soil) in the filling material is a critical parameter that requires further investigation to increase the impermeability of mixed soil bodies through MICP solidification. The permeability coefficient test results for cracked soil bodies are shown in Figure 17, and the findings can be summarized as follows:
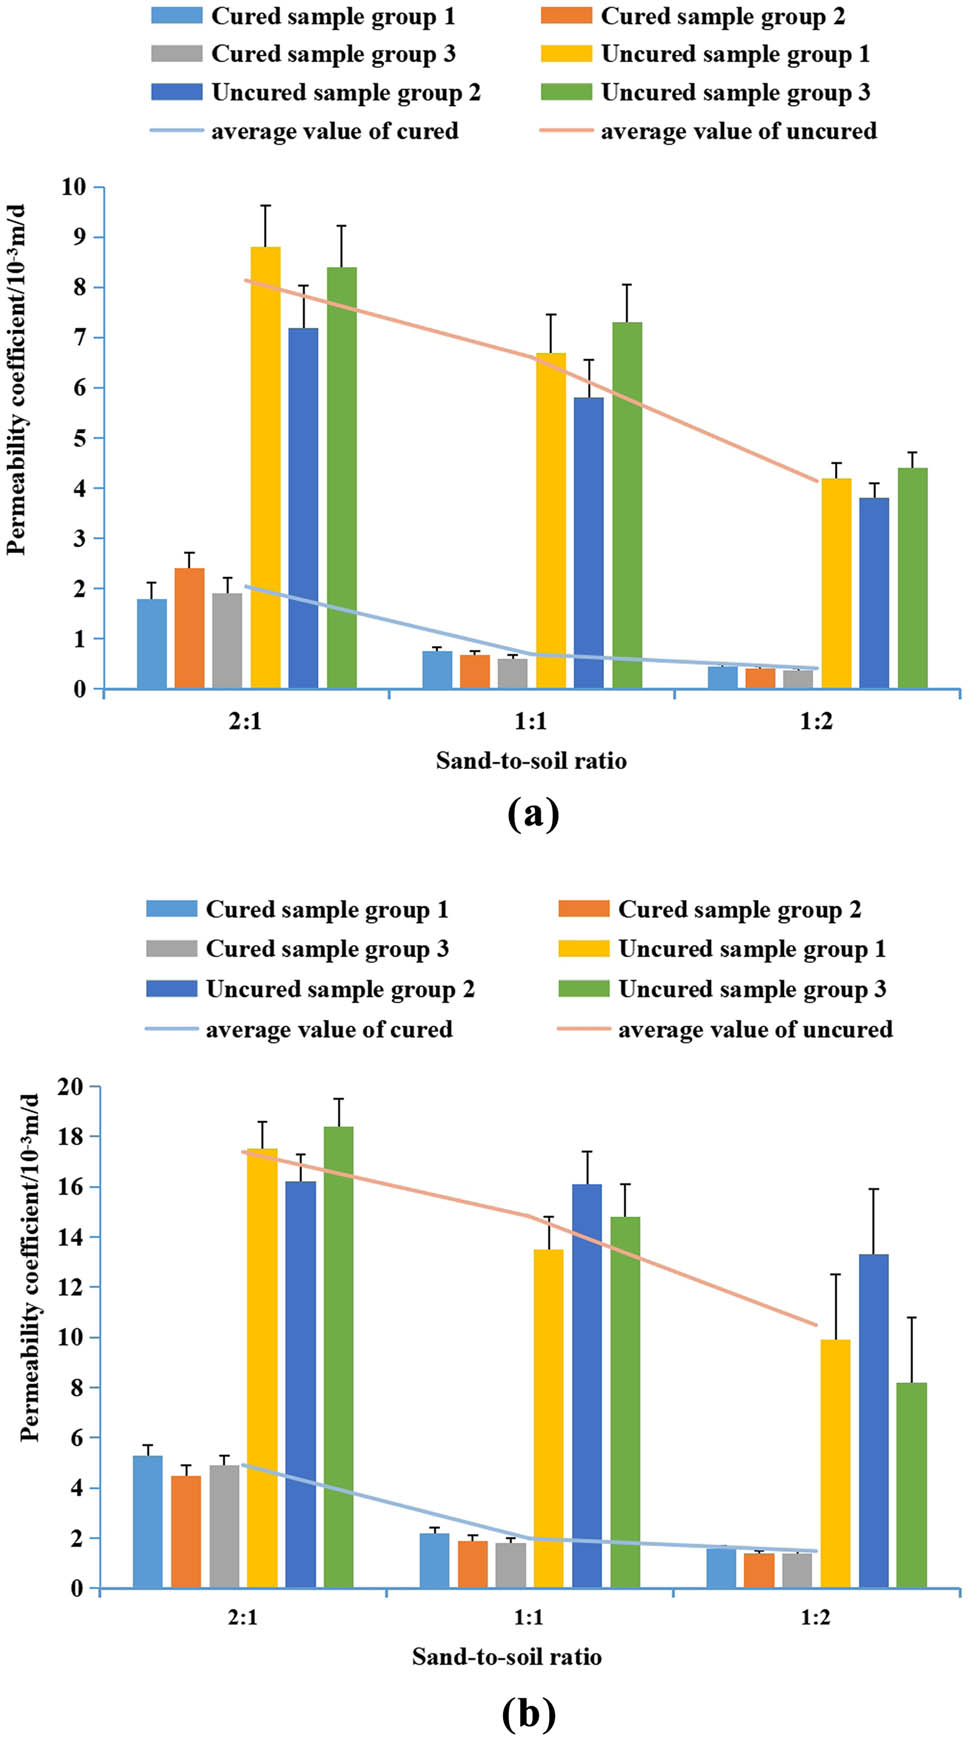
Permeability coefficient of microbial solidification with different filling ratios: (a) Baode laterite and (b) Lishi loess.
Significant reduction in permeability after MICP treatment: Compared with that of the untreated samples, the permeability coefficient of the microbially treated cracked soil decreased significantly, by more than one order of magnitude.
Improved hydraulic uniformity posttreatment: Before solidification, the standard deviations of the permeability coefficient of the cracked Baode Formation red soil and cracked Lishi Formation loess were 0.63 and 1.67, respectively. After MICP treatment, the standard deviation decreased to 0.15 for the Baode Formation and 0.64 for the Lishi Formation, which indicated that the hydraulic uniformity of cracked soils was poor prior to MICP treatment but significantly improved after solidification.
Effect of the sand content on the permeability: As the sand content in the filling material increased, the reduction in permeability became less pronounced, with changes limited to within one order of magnitude. However, when the sand-to-soil ratio changed from 2:1 to 1:1, the permeability significantly decreased by 59.80–66.50%.
Impact of calcite precipitation on permeability: Cheng et al. [38] reported that the permeability of all samples decreased as the amount of CaCO3 precipitation increased. In cracked soil, calcite precipitation from MICP solidification blocked cracks and pores, significantly enhancing impermeability. Additionally, the inherent porosity of the filling material played a direct role in this result.
5.3 Results of hydroelectric similarity simulation
Currently, Visual Modflow is the primary software used to simulate the impact of mining on water levels. Fan et al. [39] used this software to study the effects of coal mining on groundwater and spring points. Visual Modflow, a hydrological modeling tool, treats the mining area as an abstraction activity, making it challenging to simulate changes in the hydrological characteristics of the strata. In this study, a hydroelectric analogy simulation method was used, which allowed for the modeling of hydrological characteristics across different strata. The simulation results and analysis are as follows:
5.3.1 Water level change after coal mining
With coal mining, the crack field in the overburden was translated into an electrical circuit field (Figure 18, where positions 1–6 on the right correspond to the Salawusu Formation, Lishi Formation loess, Baode Formation red soil, weathered bedrock, bedrock, and the 2-2# coal seam, respectively). The simulation results of water level changes in the Salawusu Formation (a sandy layer aquifer) are depicted in Figure 19. Due to the periodic pressure caused by coal mining, only key points of water level change were presented. As shown in Figure 19, the water level decreased to varying degrees after coal mining, with a maximum drawdown of 2.4 m. The cracks caused by coal mining facilitated the drainage of groundwater, resulting in overflow within the Salawusu Formation above the soil layer. This finding aligns with the results of Fan et al. [40].

Coal-mining crack field transplanted to the circuit field.

Simulation results of coal mining dive level changes.
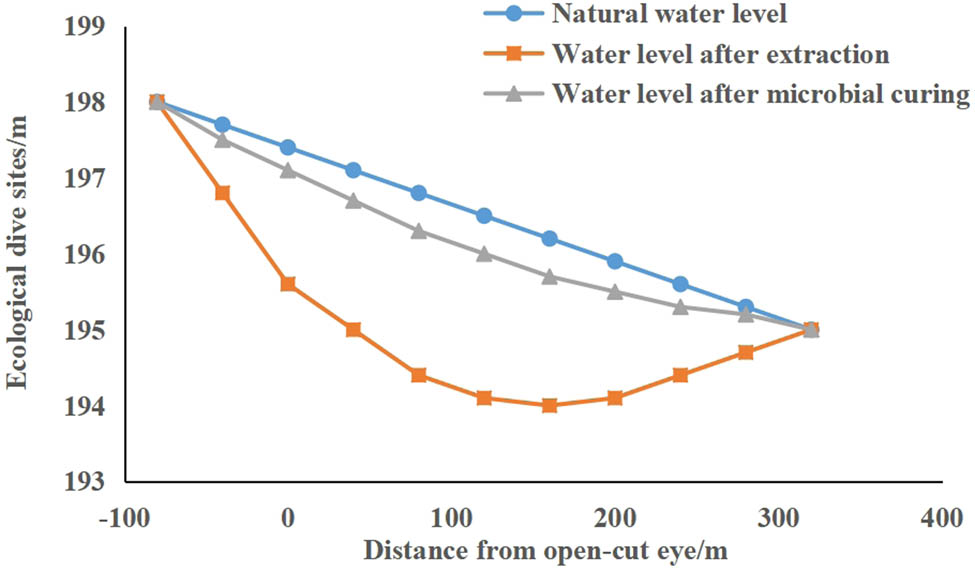
5.3.2 Water level recovery after microbial solidification
To evaluate the effectiveness of microbial solidification in preserving groundwater, the strata within the crack zone were solidified based on laboratory experimental results. This process reduced the permeability coefficient by more than one order of magnitude, effectively retaining some hydraulic resistance. The simulation results are shown in Figure 20, where the water level drawdown was successfully controlled, with a maximum drawdown of only 0.5 m. According to the ecological water level theory [40–42], a 0.5-m drawdown remains within the ecological viability range, indicating that microbial solidification can effectively restore the aquiclude and protect the overlying ecological groundwater. This simulation demonstrated that microbial solidification had a significant effect on controlling overflow, similar to the findings of Li et al. [43], who proposed aquiclude reconstruction.
Results of the numerical simulation of the water level in the Salawusu Formation.
6 Conclusion
The depth of the soil cracks produced by coal mining in the study area is 2.1 times greater than the width. The filling material consists of aeolian sand and loess, with a filling density between 1.44 and 1.51 g/cm3 and a filling rate between 9.4 and 100%. Under these characteristics, microbial solidification of filling materials had a better application foundation.
Through three rounds of low-temperature domestication and inoculation, the B. megaterium used in the experiment can adapt to the environment of the region where the experiment was carried out, remain active for a long period of time at their peak, and have a high density of viable bacteria.
The uniaxial compressive strength and permeability coefficient of the cracked soil were tested at different filling ratios, with an optimal performance at the 1:1 sand-soil mass ratio.
The numerical simulation of the hydropower similarity of the microbial remediation of the quarried crack soil layer reveals that the maximum depth of the ecological submergence level after microbial restoration was only 0.5 m. Microbial remediation technology can effectively repair the aquiclude and then protect the overlying ecological submergence level.
Acknowledgments
The authors gratefully acknowledge the financial support and thank Limin Fan and Liqiang Ma Professor for assisting in conducting this research.
-
Funding information: This article was funded by the National Natural Science Foundation of China ( 42162022), Guizhou Provincial Science and Technology Project, QKHJC-ZK [2022]-YB529 and QKHJC-ZK [2023]-YB445, and the Project of Liupanshui Science and Technology, 52020-2023-0-2-14.
-
Author contributions: Analyzed the data and wrote the paper Y.G.; investigation, JR.Z.; funding acquisition, B.L.; performed the model experiments, T.L.; corrected the grammar errors and provided some suggestions for improving the manuscript, M.A. All authors have read and agreed to the published version of the manuscript.
-
Conflict of interest: The authors declare no conflicts of interest.
References
[1] Zhang K, Yang K, Wu X, Bai L, Zhao J, Zheng X. Effects of underground coal mining on soil spatial water content distribution and plant growth type in Northwest China. ACS Omega. 2022;7(22):18688–98. 10.1021/acsomega.2c01369.Search in Google Scholar PubMed PubMed Central
[2] Song S, Zheng B, Sun T, Du L, Wei J. Influence of different mining damage types on soil erodibility in coal mining areas of northern shaanxi in the middle reaches of the Yellow River in China. Sustainability. 2023;15(6):5434. 10.3390/su15065434.Search in Google Scholar
[3] Bai L, Wang Y, Zhang K, Yang Y, Bao K, Zhao J, et al. Spatial variability of soil moisture in a mining subsidence area of northwest China. Int J Coal Sci Technol. 2022;9(1):64. 10.1007/s40789-022-00517-w.Search in Google Scholar
[4] Li T, Gao Y, Zhang JR, Li DX, Chen W, Zhang P, et al. Experimental study on reconstruction of aquiclude by MICP under the background of water preserved coal mining in Northern Shaanxi. J China Coal Soc (China). 2021;46(9):2984–94.Search in Google Scholar
[5] Cai Y, Li H, Yan J, Huang H, Feng Y, Huang H. Experimental study on prevention and control of ground fissures in coal mining subsidence in Huaibei Plain of China. Sustainability. 2022;14(19):12932. 10.3390/su141912932.Search in Google Scholar
[6] Fu Y, Wu Y, Yin X. A Study on the movement and deformation law of overlying strata and the self-healing characteristics of ground fissures in non-pillar mining in the Aeolian Sand Area. Sustainability. 2023;15(20):15136. 10.3390/su152015136.Search in Google Scholar
[7] Zhu C, Zhang J, Taheri A, Zhou N, Li Z, Li M. Control effect of coal mining solid-waste backfill for ground surface movement in slice mining: A case study of the nantun coal mine. Environ Sci Pollut Res. 2022;30(10):27270–88. 10.1007/s11356-022-24164-5.Search in Google Scholar PubMed
[8] Li X, Ji D, Han P, Li Q, Zhao H, He F. Study of water-conducting fractured zone development law and assessment method in longwall mining of shallow coal seam. Sci Rep. 2022;12(1):7994. 10.1038/s41598-022-12023-9.Search in Google Scholar PubMed PubMed Central
[9] Pourfallahi M, Nohegoo-Shahvari A, Salimizadeh M. Effect of direct addition of two different bacteria in concrete as self-healing agent. Structures. 2020;28:2646–60.10.1016/j.istruc.2020.10.070Search in Google Scholar
[10] Deng Z, Zhang L, Tang Q, Xu Y, Liu S, Li H. Preliminary study on repairing tabia cracks by using microbially induced carbonate precipitation. Constr Build Mater. 2020;248:118611–221.10.1016/j.conbuildmat.2020.118611Search in Google Scholar
[11] Yu X, Hui R. Seawater based MICP cements two/one-phase cemented sand blocks. Appl Ocean Res. 2022;118:102972.10.1016/j.apor.2021.102972Search in Google Scholar
[12] Chang I, Prasidhi AK, Im J, Shin HD, Cho GC. Soil treatment using microbial biopolymers for anti-desertification purposes. Geoderma. 2015;253:39–47.10.1016/j.geoderma.2015.04.006Search in Google Scholar
[13] Zhang H, Jia C, Wang G, Su F, Sun Y, Fan C. Physical-mechanical properties of microbially induced calcite precipitation-treated loess and treatment mechanism. J Mt Sci. 2022;19:2952–67.10.1007/s11629-022-7336-3Search in Google Scholar
[14] Atashgahi S, Tabarsa A, Shahryari A, Hosseini SS. Effect of carbonate precipitating bacteria on strength and hydraulic characteristics of loess soil. Bull Eng Geol Environ. 2020;79(9):4749–63.10.1007/s10064-020-01857-0Search in Google Scholar
[15] Liu X, Pan C, Yu J, Fan J. Study on micro-characteristics of microbe-induced calcium carbonate solidified loess. Crystals. 2021;11(12):1492.10.3390/cryst11121492Search in Google Scholar
[16] Ji C, Huang J, Yu H, Tian Y, Rao X, Zhang X. Do the reclaimed fungal communities succeed toward the original structure in eco-fragile regions of coal mining disturbances? a case study in north china loess – aeolian sand area. Front Microbiol. 2022;13:770715. 10.3389/fmicb.2022.770715.Search in Google Scholar PubMed PubMed Central
[17] Yao J, Wu Y, Chen Z, Du JG, Zhao XJ, Tian KL. Experimental study on water retention properties of microbially stabilized aeolian sand soil. Bull Soil Water Conserv (china). 2023;43(2):104–112+128.Search in Google Scholar
[18] Liu J, Li G, Li X. Geotechnical engineering properties of soils solidified by microbially induced CaCO3 precipitation (MICP). Adv Civ Eng. 2021;1:6683930.10.1155/2021/6683930Search in Google Scholar
[19] Amaludin AE, Asrah H, Mohamad HM, Bin Amaludin HZ, Bin Amaludin NA. Physicochemical and microstructural characterization of Klias Peat, Lumadan POFA, and GGBFS for geopolymer based soil stabilization. High Tech Innovation J. 2023;4(2):327–48. 10.28991/HIJ-2023-04-02-07.Search in Google Scholar
[20] Zaika Y, Kololikiye GR. The PVD-accelerated soil deposit consolidation based on elliptic cylindrical model. Civ Eng J. 2023;9(7):1660–8. 10.28991/CEJ-2023-09-07-08.Search in Google Scholar
[21] Huang QX, Wei BN, Zhang WZ. Study of downward crack closing of clay aquiclude in shallowly buried coal seam. J Min Saf Eng (China). 2010;27(1):35–9.Search in Google Scholar
[22] Xie XS, Hou EK, Feng D, Cong T, Hou PF, Chen QJ, et al. Development law and characteristics of surface cracks caused by coal mining in Yushenfu mining ar-ea. Chin J Eng (China). 2023;45(1):44–53. 10.13374/j.issn2095-9389.2021.06.29.001.Search in Google Scholar
[23] Ivanov V, Chu J. Applications of microorganisms to geotechnical engineering for bioclogging and biocementation of soil in situ. Rev Environ Sci Bio/Technol. 2008;7(2):139–53. 10.1007/s11157-007-9126-3.Search in Google Scholar
[24] Bi Y, Wang K, Wang J. Effect of different inoculation treatments on AM fungal communities and the sustainability of soil remediation in Daliuta coal mining subsidence area in northwest China. Appl Soil Ecol. 2018;132:107–13. 10.1016/j.apsoil.2018.08.009.Search in Google Scholar
[25] Goodwin AL, Michel FM, Phillips BL, Keen DA, Dove MT, Reeder RJ. Nanoporous structure and medium-range order in synthetic amorphous calcium carbonate. Chem Mater. 2010;22(10):3197–205. 10.1021/cm100294d.Search in Google Scholar
[26] Sun X, Miao L, Wu L, Chen R. Improvement of bio-cementation at low temperature based on Bacillus megaterium. Appl Microbiol Biotechnol. 2019;103(17):7191–202. 10.1007/s00253-019-09986-7.Search in Google Scholar PubMed
[27] Sun X, Miao L. Application of bio-remediation with bacillus megaterium for crack repair at low temperature. J Adv Concr Technol. 2020;18(5):307–19. 10.3151/jact.18.307.Search in Google Scholar
[28] Chang X, Wang M, Zhu W, Fan J, Liu M. Study on height development characteristics of water-conducting fracture zone in fully mechanized mining of shallow thick coal seam under water. Sustainability. 2023;15(9):7370.10.3390/su15097370Search in Google Scholar
[29] Li T, Wang SJ, Han L, Gao Y. Reasonable thickness of protected loess under loose aquifer in ecologically fragile mining area. J China Coal Soc (Chin). 2017;42(1):98–105.Search in Google Scholar
[30] Ji G, Chen S, Zhou T, Huang Z, Li F. A new method of predicting network fracture conductivity based on the similitude principle of water and electricity. Phys Fluids. 2021;33(11):116605. 10.1063/5.0073291.Search in Google Scholar
[31] Chen Y, Tan L, Xiao N, Liu K, Jia P, Zhang W. The hydro-mechanical characteristics and micro-structure of loess enhanced by microbially induced carbonate precipitation. Geomech Energy Environ. 2023;34:100469. 10.1016/j.gete.2023.100469.Search in Google Scholar
[32] Kulanthaivel P, Soundara B, Das A. Performance study on stabilization of fine grained clay soils using calcium source producing microbes. KSCE J Civ Eng. 2020;24(9):2631–42. 10.1007/s12205-020-2028-4.Search in Google Scholar
[33] Li Y, Yu G, Xu M, Ou W, Niu C, Jiang H, et al. Interfacial strength between ice and sediment: A solution towards fracture-filling hydrate system. Fuel. 2022;330:125553. 10.1016/j.fuel.2022.125553.Search in Google Scholar
[34] Wang L, Yang X, Diao Y, Guo C. Study on bonding characteristics of polymer grouted con-crete-soil interface. Polymers. 2024;16(15):2207. 10.3390/polym16152207.Search in Google Scholar PubMed PubMed Central
[35] Hataf N, Jamali R. Effect of fine-grain percent on soil strength properties improved by biological method. Geomicrobiol J. 2018;35(8):695–703. 10.1080/01490451.2018.1454554.Search in Google Scholar
[36] Deng J, Deng H, Zhang Y, Luo Y. Experimental study on microbial-induced calcium carbonate precipitation repairing fractured rock under different temperatures. Sustainability. 2022;14(18):11770. 10.3390/su141811770.Search in Google Scholar
[37] Cheng YJ, Tang CS, Pan XH, Liu B, Xie YH, Cheng Q, et al. Application of microbial induced carbonate precipitation for loess surface erosion control. Eng Geol. 2021;294:106387. 10.1016/j.enggeo.2021.106387.Search in Google Scholar
[38] Cheng L, Shahin MA, Mujah D. Influence of key environmental conditions on microbially induced cementation for soil stabilization. J Geotech Geoenviron Eng. 2017;143(1):04016083. 10.1061/(ASCE)GT.1943-5606.0001586.Search in Google Scholar
[39] Fan L, Sun Q, Ma LQ, Li T,Chen HF, Jiang ZQ. Technological system of water-conserving coal mining. Coal Geol Explor (China). 2023;51(1):196–204.Search in Google Scholar
[40] Fan GW, Fan ZL, Zhang DS, Zhang SZ. Rock strength and permeability under compression-shear coupling corresponding to different loading angles. J China Coal Soc. 2024;49(7):3090–101. 10.13225/j.cnki.jccs.2023.1555.Search in Google Scholar
[41] Wang SM, Geng JS, Li PF, Sun Q, Fan ZQ, Li D. Construction of geological guarantee system for green coal mining. Coal Geol Explor. 2023;51(1):33–43.Search in Google Scholar
[42] Wang SM, Wei J, Song SJ, Wang SQ, Sun T. Influence of thick sandstone on development of overburden mining fissures in northern Shaanxi coal mining area of Yellow River Basin and suggestions on water-preserved coal mining. Coal Geol Explor. 2022;50(12):1–11.Search in Google Scholar
[43] Li WP, Wang QQ, Li XQ. Reconstruction of aquifuge: The engineering geological study of N2 laterite located in key aquifuge concerning coal mining with water protection in northwest China. J China Coal Soc (China) 201742(1):88–97.Search in Google Scholar
© 2025 the author(s), published by De Gruyter
This work is licensed under the Creative Commons Attribution 4.0 International License.
Articles in the same Issue
- Research Articles
- Seismic response and damage model analysis of rocky slopes with weak interlayers
- Multi-scenario simulation and eco-environmental effect analysis of “Production–Living–Ecological space” based on PLUS model: A case study of Anyang City
- Remote sensing estimation of chlorophyll content in rape leaves in Weibei dryland region of China
- GIS-based frequency ratio and Shannon entropy modeling for landslide susceptibility mapping: A case study in Kundah Taluk, Nilgiris District, India
- Natural gas origin and accumulation of the Changxing–Feixianguan Formation in the Puguang area, China
- Spatial variations of shear-wave velocity anomaly derived from Love wave ambient noise seismic tomography along Lembang Fault (West Java, Indonesia)
- Evaluation of cumulative rainfall and rainfall event–duration threshold based on triggering and non-triggering rainfalls: Northern Thailand case
- Pixel and region-oriented classification of Sentinel-2 imagery to assess LULC dynamics and their climate impact in Nowshera, Pakistan
- The use of radar-optical remote sensing data and geographic information system–analytical hierarchy process–multicriteria decision analysis techniques for revealing groundwater recharge prospective zones in arid-semi arid lands
- Effect of pore throats on the reservoir quality of tight sandstone: A case study of the Yanchang Formation in the Zhidan area, Ordos Basin
- Hydroelectric simulation of the phreatic water response of mining cracked soil based on microbial solidification
- Spatial-temporal evolution of habitat quality in tropical monsoon climate region based on “pattern–process–quality” – a case study of Cambodia
- Early Permian to Middle Triassic Formation petroleum potentials of Sydney Basin, Australia: A geochemical analysis
- Micro-mechanism analysis of Zhongchuan loess liquefaction disaster induced by Jishishan M6.2 earthquake in 2023
- Prediction method of S-wave velocities in tight sandstone reservoirs – a case study of CO2 geological storage area in Ordos Basin
- Ecological restoration in valley area of semiarid region damaged by shallow buried coal seam mining
- Hydrocarbon-generating characteristics of Xujiahe coal-bearing source rocks in the continuous sedimentary environment of the Southwest Sichuan
- Hazard analysis of future surface displacements on active faults based on the recurrence interval of strong earthquakes
- Structural characterization of the Zalm district, West Saudi Arabia, using aeromagnetic data: An approach for gold mineral exploration
- Research on the variation in the Shields curve of silt initiation
- Reuse of agricultural drainage water and wastewater for crop irrigation in southeastern Algeria
- Assessing the effectiveness of utilizing low-cost inertial measurement unit sensors for producing as-built plans
- Analysis of the formation process of a natural fertilizer in the loess area
- Machine learning methods for landslide mapping studies: A comparative study of SVM and RF algorithms in the Oued Aoulai watershed (Morocco)
- Chemical dissolution and the source of salt efflorescence in weathering of sandstone cultural relics
- Molecular simulation of methane adsorption capacity in transitional shale – a case study of Longtan Formation shale in Southern Sichuan Basin, SW China
- Evolution characteristics of extreme maximum temperature events in Central China and adaptation strategies under different future warming scenarios
- Estimating Bowen ratio in local environment based on satellite imagery
- 3D fusion modeling of multi-scale geological structures based on subdivision-NURBS surfaces and stratigraphic sequence formalization
- Comparative analysis of machine learning algorithms in Google Earth Engine for urban land use dynamics in rapidly urbanizing South Asian cities
- Study on the mechanism of plant root influence on soil properties in expansive soil areas
- Simulation of seismic hazard parameters and earthquakes source mechanisms along the Red Sea rift, western Saudi Arabia
- Tectonics vs sedimentation in foredeep basins: A tale from the Oligo-Miocene Monte Falterona Formation (Northern Apennines, Italy)
- Investigation of landslide areas in Tokat-Almus road between Bakımlı-Almus by the PS-InSAR method (Türkiye)
- Predicting coastal variations in non-storm conditions with machine learning
- Cross-dimensional adaptivity research on a 3D earth observation data cube model
- Geochronology and geochemistry of late Paleozoic volcanic rocks in eastern Inner Mongolia and their geological significance
- Spatial and temporal evolution of land use and habitat quality in arid regions – a case of Northwest China
- Ground-penetrating radar imaging of subsurface karst features controlling water leakage across Wadi Namar dam, south Riyadh, Saudi Arabia
- Rayleigh wave dispersion inversion via modified sine cosine algorithm: Application to Hangzhou, China passive surface wave data
- Fractal insights into permeability control by pore structure in tight sandstone reservoirs, Heshui area, Ordos Basin
- Debris flow hazard characteristic and mitigation in Yusitong Gully, Hengduan Mountainous Region
- Research on community characteristics of vegetation restoration in hilly power engineering based on multi temporal remote sensing technology
- Identification of radial drainage networks based on topographic and geometric features
- Trace elements and melt inclusion in zircon within the Qunji porphyry Cu deposit: Application to the metallogenic potential of the reduced magma-hydrothermal system
- Pore, fracture characteristics and diagenetic evolution of medium-maturity marine shales from the Silurian Longmaxi Formation, NE Sichuan Basin, China
- Study of the earthquakes source parameters, site response, and path attenuation using P and S-waves spectral inversion, Aswan region, south Egypt
- Source of contamination and assessment of potential health risks of potentially toxic metal(loid)s in agricultural soil from Al Lith, Saudi Arabia
- Regional spatiotemporal evolution and influencing factors of rural construction areas in the Nanxi River Basin via GIS
- An efficient network for object detection in scale-imbalanced remote sensing images
- Effect of microscopic pore–throat structure heterogeneity on waterflooding seepage characteristics of tight sandstone reservoirs
- Environmental health risk assessment of Zn, Cd, Pb, Fe, and Co in coastal sediments of the southeastern Gulf of Aqaba
- A modified Hoek–Brown model considering softening effects and its applications
- Evaluation of engineering properties of soil for sustainable urban development
- The spatio-temporal characteristics and influencing factors of sustainable development in China’s provincial areas
- Application of a mixed additive and multiplicative random error model to generate DTM products from LiDAR data
- Gold vein mineralogy and oxygen isotopes of Wadi Abu Khusheiba, Jordan
- Prediction of surface deformation time series in closed mines based on LSTM and optimization algorithms
- 2D–3D Geological features collaborative identification of surrounding rock structural planes in hydraulic adit based on OC-AINet
- Spatiotemporal patterns and drivers of Chl-a in Chinese lakes between 1986 and 2023
- Land use classification through fusion of remote sensing images and multi-source data
- Nexus between renewable energy, technological innovation, and carbon dioxide emissions in Saudi Arabia
- Analysis of the spillover effects of green organic transformation on sustainable development in ethnic regions’ agriculture and animal husbandry
- Factors impacting spatial distribution of black and odorous water bodies in Hebei
- Large-scale shaking table tests on the liquefaction and deformation responses of an ultra-deep overburden
- Impacts of climate change and sea-level rise on the coastal geological environment of Quang Nam province, Vietnam
- Reservoir characterization and exploration potential of shale reservoir near denudation area: A case study of Ordovician–Silurian marine shale, China
- Seismic prediction of Permian volcanic rock reservoirs in Southwest Sichuan Basin
- Application of CBERS-04 IRS data to land surface temperature inversion: A case study based on Minqin arid area
- Geological characteristics and prospecting direction of Sanjiaoding gold mine in Saishiteng area
- Research on the deformation prediction model of surrounding rock based on SSA-VMD-GRU
- Geochronology, geochemical characteristics, and tectonic significance of the granites, Menghewula, Southern Great Xing’an range
- Hazard classification of active faults in Yunnan base on probabilistic seismic hazard assessment
- Characteristics analysis of hydrate reservoirs with different geological structures developed by vertical well depressurization
- Estimating the travel distance of channelized rock avalanches using genetic programming method
- Landscape preferences of hikers in Three Parallel Rivers Region and its adjacent regions by content analysis of user-generated photography
- New age constraints of the LGM onset in the Bohemian Forest – Central Europe
- Characteristics of geological evolution based on the multifractal singularity theory: A case study of Heyu granite and Mesozoic tectonics
- Soil water content and longitudinal microbiota distribution in disturbed areas of tower foundations of power transmission and transformation projects
- Oil accumulation process of the Kongdian reservoir in the deep subsag zone of the Cangdong Sag, Bohai Bay Basin, China
- Investigation of velocity profile in rock–ice avalanche by particle image velocimetry measurement
- Optimizing 3D seismic survey geometries using ray tracing and illumination modeling: A case study from Penobscot field
- Sedimentology of the Phra That and Pha Daeng Formations: A preliminary evaluation of geological CO2 storage potential in the Lampang Basin, Thailand
- Improved classification algorithm for hyperspectral remote sensing images based on the hybrid spectral network model
- Map analysis of soil erodibility rates and gully erosion sites in Anambra State, South Eastern Nigeria
- Identification and driving mechanism of land use conflict in China’s South-North transition zone: A case study of Huaihe River Basin
- Evaluation of the impact of land-use change on earthquake risk distribution in different periods: An empirical analysis from Sichuan Province
- A test site case study on the long-term behavior of geotextile tubes
- An experimental investigation into carbon dioxide flooding and rock dissolution in low-permeability reservoirs of the South China Sea
- Detection and semi-quantitative analysis of naphthenic acids in coal and gangue from mining areas in China
- Comparative effects of olivine and sand on KOH-treated clayey soil
- YOLO-MC: An algorithm for early forest fire recognition based on drone image
- Earthquake building damage classification based on full suite of Sentinel-1 features
- Potential landslide detection and influencing factors analysis in the upper Yellow River based on SBAS-InSAR technology
- Assessing green area changes in Najran City, Saudi Arabia (2013–2022) using hybrid deep learning techniques
- An advanced approach integrating methods to estimate hydraulic conductivity of different soil types supported by a machine learning model
- Hybrid methods for land use and land cover classification using remote sensing and combined spectral feature extraction: A case study of Najran City, KSA
- Streamlining digital elevation model construction from historical aerial photographs: The impact of reference elevation data on spatial accuracy
- Analysis of urban expansion patterns in the Yangtze River Delta based on the fusion impervious surfaces dataset
- A metaverse-based visual analysis approach for 3D reservoir models
- Late Quaternary record of 100 ka depositional cycles on the Larache shelf (NW Morocco)
- Integrated well-seismic analysis of sedimentary facies distribution: A case study from the Mesoproterozoic, Ordos Basin, China
- Study on the spatial equilibrium of cultural and tourism resources in Macao, China
- Urban road surface condition detecting and integrating based on the mobile sensing framework with multi-modal sensors
- Application of improved sine cosine algorithm with chaotic mapping and novel updating methods for joint inversion of resistivity and surface wave data
- The synergistic use of AHP and GIS to assess factors driving forest fire potential in a peat swamp forest in Thailand
- Dynamic response analysis and comprehensive evaluation of cement-improved aeolian sand roadbed
- Rock control on evolution of Khorat Cuesta, Khorat UNESCO Geopark, Northeastern Thailand
- Gradient response mechanism of carbon storage: Spatiotemporal analysis of economic-ecological dimensions based on hybrid machine learning
- Comparison of several seismic active earth pressure calculation methods for retaining structures
- Mantle dynamics and petrogenesis of Gomer basalts in the Northwestern Ethiopia: A geochemical perspective
- Study on ground deformation monitoring in Xiong’an New Area from 2021 to 2023 based on DS-InSAR
- Paleoenvironmental characteristics of continental shale and its significance to organic matter enrichment: Taking the fifth member of Xujiahe Formation in Tianfu area of Sichuan Basin as an example
- Equipping the integral approach with generalized least squares to reconstruct relict channel profile and its usage in the Shanxi Rift, northern China
- InSAR-driven landslide hazard assessment along highways in hilly regions: A case-based validation approach
- Attribution analysis of multi-temporal scale surface streamflow changes in the Ganjiang River based on a multi-temporal Budyko framework
- Maps analysis of Najran City, Saudi Arabia to enhance agricultural development using hybrid system of ANN and multi-CNN models
- Hybrid deep learning with a random forest system for sustainable agricultural land cover classification using DEM in Najran, Saudi Arabia
- Long-term evolution patterns of groundwater depth and lagged response to precipitation in a complex aquifer system: Insights from Huaibei Region, China
- Remote sensing and machine learning for lithology and mineral detection in NW, Pakistan
- Spatial–temporal variations of NO2 pollution in Shandong Province based on Sentinel-5P satellite data and influencing factors
- Numerical modeling of geothermal energy piles with sensitivity and parameter variation analysis of a case study
- Stability analysis of valley-type upstream tailings dams using a 3D model
- Variation characteristics and attribution analysis of actual evaporation at monthly time scale from 1982 to 2019 in Jialing River Basin, China
- Investigating machine learning and statistical approaches for landslide susceptibility mapping in Minfeng County, Xinjiang
- Investigating spatiotemporal patterns for comprehensive accessibility of service facilities by location-based service data in Nanjing (2016–2022)
- A pre-treatment method for particle size analysis of fine-grained sedimentary rocks, Bohai Bay Basin, China
- Study on the formation mechanism of the hard-shell layer of liquefied silty soil
- Comprehensive analysis of agricultural CEE: Efficiency assessment, mechanism identification, and policy response – A case study of Anhui Province
- Simulation study on the damage and failure mechanism of the surrounding rock in sanded dolomite tunnels
- Towards carbon neutrality: Spatiotemporal evolution and key influences on agricultural ecological efficiency in Northwest China
- High-frequency cycles drive the cyclical enrichment of oil in porous carbonate reservoirs: A case study of the Khasib Formation in E Oilfield, Mesopotamian Basin, Iraq
- Reconstruction of digital core models of granular rocks using mathematical morphology
- Spatial–temporal differentiation law of habitat quality and its driving mechanism in the typical plateau areas of the Loess Plateau in the recent 30 years
- A machine-learning-based approach to predict potential oil sites: Conceptual framework and experimental evaluation
- Review Articles
- Humic substances influence on the distribution of dissolved iron in seawater: A review of electrochemical methods and other techniques
- Applications of physics-informed neural networks in geosciences: From basic seismology to comprehensive environmental studies
- Ore-controlling structures of granite-related uranium deposits in South China: A review
- Shallow geological structure features in Balikpapan Bay East Kalimantan Province – Indonesia
- A review on the tectonic affinity of microcontinents and evolution of the Proto-Tethys Ocean in Northeastern Tibet
- Advancements in machine learning applications for mineral prospecting and geophysical inversion: A review
- Special Issue: Natural Resources and Environmental Risks: Towards a Sustainable Future - Part II
- Depopulation in the Visok micro-region: Toward demographic and economic revitalization
- Special Issue: Geospatial and Environmental Dynamics - Part II
- Advancing urban sustainability: Applying GIS technologies to assess SDG indicators – a case study of Podgorica (Montenegro)
- Spatiotemporal and trend analysis of common cancers in men in Central Serbia (1999–2021)
- Minerals for the green agenda, implications, stalemates, and alternatives
- Spatiotemporal water quality analysis of Vrana Lake, Croatia
- Functional transformation of settlements in coal exploitation zones: A case study of the municipality of Stanari in Republic of Srpska (Bosnia and Herzegovina)
- Hypertension in AP Vojvodina (Northern Serbia): A spatio-temporal analysis of patients at the Institute for Cardiovascular Diseases of Vojvodina
- Regional patterns in cause-specific mortality in Montenegro, 1991–2019
- Spatio-temporal analysis of flood events using GIS and remote sensing-based approach in the Ukrina River Basin, Bosnia and Herzegovina
- Flash flood susceptibility mapping using LiDAR-Derived DEM and machine learning algorithms: Ljuboviđa case study, Serbia
- Geocultural heritage as a basis for geotourism development: Banjska Monastery, Zvečan (Serbia)
- Assessment of groundwater potential zones using GIS and AHP techniques – A case study of the zone of influence of Kolubara Mining Basin
- Impact of the agri-geographical transformation of rural settlements on the geospatial dynamics of soil erosion intensity in municipalities of Central Serbia
- Where faith meets geomorphology: The cultural and religious significance of geodiversity explored through geospatial technologies
- Applications of local climate zone classification in European cities: A review of in situ and mobile monitoring methods in urban climate studies
- Complex multivariate water quality impact assessment on Krivaja River
- Ionization hotspots near waterfalls in Eastern Serbia’s Stara Planina Mountain
- Shift in landscape use strategies during the transition from the Bronze age to Iron age in Northwest Serbia
- Assessing the geotourism potential of glacial lakes in Plav, Montenegro: A multi-criteria assessment by using the M-GAM model
- Flash flood potential index at national scale: Susceptibility assessment within catchments
- SWAT modelling and MCDM for spatial valuation in small hydropower planning
- Disaster risk perception and local resilience near the “Duboko” landfill: Challenges of governance, management, trust, and environmental communication in Serbia