Study on the spatial equilibrium of cultural and tourism resources in Macao, China
-
Shufang Zhao


Abstract
This study systematically analyzes the spatial distribution characteristics of tourism resources and the equilibrium of cultural tourism development in Macau using a geographic information system (GIS). Through methods such as kernel density analysis, average nearest neighbor index, Thiessen polygons, and standard deviation ellipse, the spatial patterns and influencing factors of Macau’s tourism resources are revealed. The findings indicate that Macau’s tourism resources exhibit significant spatial clustering, primarily concentrated in the historic urban area of the Macau Peninsula, forming a “single-core center + secondary ring-shaped” distribution pattern centered on cultural heritage. Architectural landscapes and World Heritage resources are highly aggregated, while geological, aquatic, and biological landscape resources are dispersed. Spatial equilibrium analysis shows that Taipa and Coloane, due to differences in development timelines, are dominated by modern entertainment facilities and natural ecological resources, respectively, forming a complementary yet non-equilibrium tourism structure with the Peninsula. Natural and social factors jointly shape the distribution characteristics of Macau’s tourism resources. The study recommends future integrated planning for heritage conservation in the Peninsula and tourism development in emerging areas, enhanced regional collaboration, and optimized resource allocation to promote high-quality, balanced tourism development in Macau. This research provides spatial decision-making support for Macau’s goal of becoming a world-class tourism and leisure hub while expanding the application of GIS technology in micro-scale tourism resource analysis.
1 Introduction
The popularization of the cultural heritage concept has propelled tourism into a flourishing emerging cultural industry [1]. Governments worldwide attach great importance to the integrated development of cultural and tourism resources to meet the diverse needs of tourists and promote sustainable socio-economic development [2,3]. Tourist preferences exhibit significant differences, stemming from the diversity of their experiential goals and psychological demands [4]. Consequently, creating diverse activities, optimizing facilities [5], and shaping destination images to attract visitors [6] have become crucial tasks for countries to showcase their cultural brands [7]. Hailed as the contemporary “smokeless industry” [8], tourism, as a cultural treasure prioritized for development, sees its resource types and development strategies vary distinctly due to differences in national environments, histories, and cultures, with spatial distribution also showing marked regional characteristics [9]. Despite differing development paths, a high degree of consensus exists among nations in cultural-tourism development, emphasizing scientific planning and context-specific resource allocation.
With the deepening of global cultural heritage conservation concepts and the vigorous development of the cultural tourism industry [10,11], the spatial distribution characteristics and equilibrium of tourism resources have become significant issues for regional sustainable development [12]. International research underscores the critical role of resource integration and spatial optimization in enhancing tourism competitiveness. For instance, Japanese scholars analyzed tourism destination competitiveness in the Miyagi Zao Mountain area of Japan [13]. Chinese scholars explored the ecological integration of urban tourism with new approaches, studying resource integration in “spatial resources - Nanning Water City tourism spaces” [14]. Scholars also researched the impact of the urban heat island effect on the spatial distribution of tourism resources in Novi Sad, Serbia [15]. Geographic information systems (GIS), as an essential tool for studying spatial structures [16], can intuitively reveal patterns and relationships within geographical space and hold significant value for understanding and interpreting complex geographical phenomena. For example, many scholars have designed GIS-based tourism planning information systems by discussing the current state of GIS and tourism planning [17,18]. Some have proposed kernel density analysis of tourist flows based on GIS [19] and conducted hotspot analyses of tourist attractions [20,21]. Others have assessed tourism carrying capacity [22,23] and optimized route planning [20,21]. These approaches can identify peak activity areas while providing a scientific basis for the rational distribution and utilization of tourism resources. Similarly, through spatial autocorrelation analysis [24], researchers can detect the spatial agglomeration characteristics of tourism development, offering guidance for formulating regional tourism cooperation and development strategies. These research outcomes provide robust technical support and practical guidance for the sustained and diversified development of the tourism industry.
To address the aforementioned research gaps, this study focuses on Macao. The core scientific questions are: what spatial distribution pattern do its tourism resources exhibit? Is its spatial development balanced? How can the spatial structure be optimized to achieve balanced development? Based on this, the research objectives are clearly defined as: (1) utilizing GIS spatial analysis techniques (such as density analysis, average nearest neighbor (ANN) index, and standard deviational ellipse) to analyze the spatial distribution characteristics and structural patterns of Macao’s tourism resources; (2) assessing the issue of spatial equilibrium in Macao’s tourism development; and (3) proposing targeted strategies to optimize Macao’s tourism spatial structure and promote balanced regional development.
The core innovation and contribution of this study lie in the pioneering systematic application of GIS-based spatial equilibrium analysis methods to tourism research in Macao. Breaking through the limitations of traditional descriptive or economic statistical analyses, the study quantitatively characterizes resource spatial configuration; innovatively measures the level of spatial equilibrium in Macao’s tourism; empirically diagnoses development imbalances based on spatial analysis; and ultimately proposes resource optimization and regional balanced development strategies. This not only directly addresses the lack of research focusing on the spatial dimension of tourism in Macao but also provides methodological references for research on similar high-density urban tourism destinations.
2 Data sources and research methodology
2.1 Overview of the study area
The Macau Special Administrative Region is situated on the western bank of the Pearl River estuary on the southeastern coast of China. It comprises the Macau Peninsula, Taipa Island, and Coloane Island, which are connected by the Cotai area – reclaimed land forming a single landmass. Its total land area is 33.3 km2 (2023).
Physically, Macau features an undulating landscape of low hills interspersed with alluvial plains. Its highest point is Coloane Peak (Altinho de Coloane) on Coloane Island, standing at 170.6 m. The climate is subtropical monsoon, with an annual average temperature of 23.4°C and an average annual precipitation of 2176.8 mm. The region is frequently impacted by typhoons during summer and relies on external sources for its freshwater supply [25].
Socially and geographically, Macau is characterized by the world’s highest population density (20531.53 people per square kilometer). Its 683,000 permanent residents are highly concentrated on the Macau Peninsula. The economy is heavily dependent on gaming and tourism (accounting for over 70% of GDP), with a per capita GDP of approximately US$69,000. This has resulted in a unique spatial pattern: “high-density mixed development in the Historic Centre + functional zoning on the outlying islands.” The territory preserves sixteenth-century Portuguese colonial architectural complexes (22 UNESCO World Heritage sites) while also hosting large-scale integrated gaming resorts and emerging residential communities [25].
As a micro-city economy shaped by over 400 years of Sino-Western cultural fusion, the functional dislocation and spatial fragmentation between these elements reflect developmental tensions arising from high-intensity human-land interaction. This makes Macau a prime case study for research on the spatial equilibrium of cultural and tourism resources in coastal cities.
2.2 Data sources
The data for this study primarily originate from multiple data platforms. Information concerning the Historic Centre of Macao, as documented in the World Heritage List, is primarily based on the resolution adopted at the 29th Session of the World Heritage Committee held in South Africa on July 15, 2005 [26,27].
Administrative boundary vector polygon data were collected and organized using the National Geomatics Center of China (NGCC) Geographic Information Resource Directory Service System. This ensured the acquisition of the latest and most accurate administrative boundary information. Figure 1 clearly depicts the national borders, provincial boundaries, and the extent of the Macao Special Administrative Region relevant to the study.
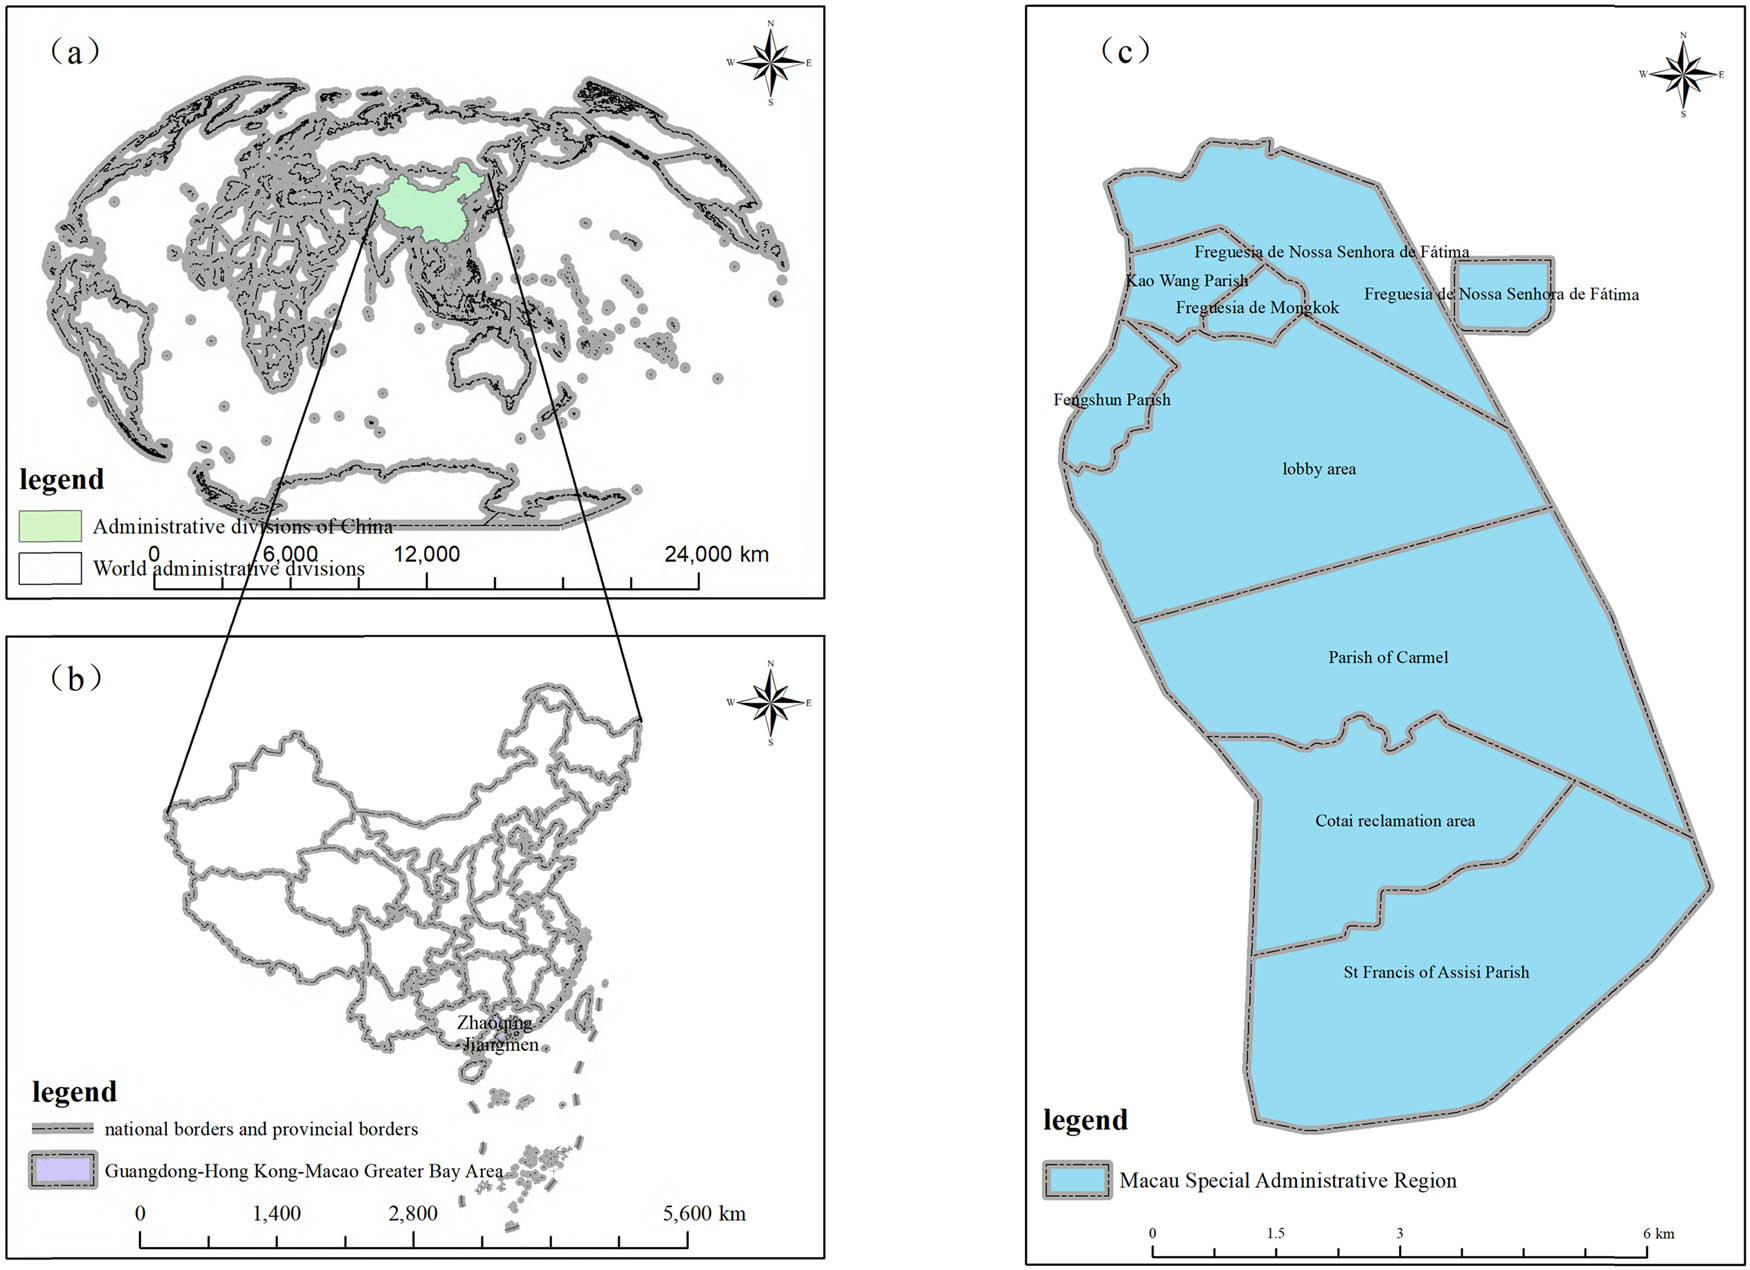
Overview of the study area.
Furthermore, tourism resource data were obtained using the Points of Interest (POI) dataset from Amap (AutoNavi Map). Preprocessing was performed on the acquired POI data. From the original 351 tourism resource data points, effective information was extracted to generate a table containing latitude and longitude coordinates. This tabular data was imported into ArcGIS and converted into a shapefile (shp) format. Subsequently, the tabular data were transformed into a point vector layer under the WGS84 coordinate system and reprojected to the CGCS2000 coordinate system. Data cleaning was conducted, including the removal of duplicate and irrelevant data. The remaining valid data were then classified and integrated, resulting in a final effective dataset comprising 209 samples.
The classification of the valid data was performed according to the Classification, Investigation, and Evaluation of Tourism Resources (GB/T 18972-2017) standard and the specific characteristics of Macao’s tourism resources. Based on these criteria, the Macao tourism resource POI data were categorized into six classes, as detailed in Table 1.
Statistical classification of Macau’s tourism resources
| Category | Samples | Content |
|---|---|---|
| Geological landscape | 7 | Mountains, beaches |
| Architectural landscape | 134 | Religious places of worship, cultural activities, the former residences of famous people, and historical memorial buildings |
| Water landscape | 3 | Rivers, lakes |
| Biological landscape | 3 | Wetlands |
| Site ruins | 32 | Human activity sites, military sites, and cultural relic scattering sites |
| Macau’s World Heritage | 30 | Macau’s World Heritage |
Finally, through the integration and synthesis of these data sources, a comprehensive GIS database was constructed. The entire data processing workflow and methodological framework are illustrated in Figure 2.
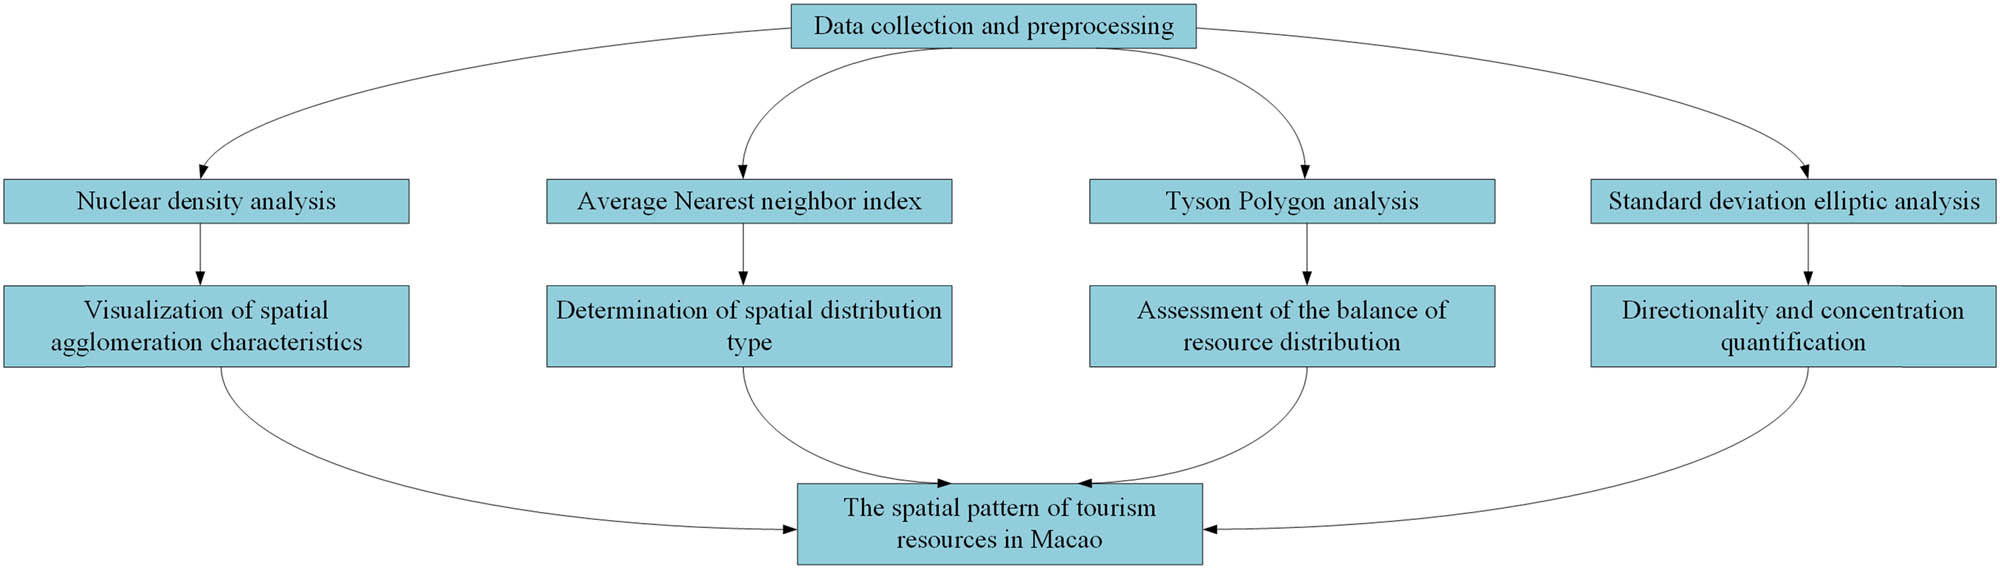
Flowchart.
2.3 Research methodology
2.3.1 Kernel density analysis
Kernel density analysis is a method for visualizing spatial point data, characterized by its ability to reflect the clustering state of point elements within a region. It can be used to analyze the density distribution of tourism resources in Macau, as calculated by equation (1) [28].
f(x) represents the estimated value of f at point x, derived from sample points; k() is the kernel function; h is the search radius; and (x − x i ) is the standardized Euclidean distance between the point to be estimated and the sample point. Kernel density analysis uses this function to quantify the spatial clustering characteristics of tourism resources. The calculation results effectively reflect the continuous spatial distribution patterns of geographic elements [29].
In this study, ArcGIS software was utilized to visualize the spatial distribution of tourism resources in Macao. Spatial distribution characteristics of tourism resources within the region were analyzed using the kernel density tool. Areas with darker colors indicate a higher concentration of tourism resources.
2.3.2 ANN index
The ANN index provides an intuitive, clear, and accurate reflection of the degree of clustering or dispersion of point features in space [30,31]. This method was first proposed by the two ecologists Evans and Clark in 1954 and subsequently gained recognition in academia [32]. Numerous scholars now employ this method to explore the irregular distribution patterns of large numbers of points within a given space [33], analyzing and interpreting various problems accordingly. For instance, scholars have used the ANN index to reveal ancient household settlement patterns within 23 centers in the Maya Lowlands [34]. This method helps researchers identify differences between the actual distribution within a region and a hypothetical random distribution, thereby providing pathways and evidence for decision-making. This study employs the ANN tool in ArcGIS 10.8 to calculate and model the organizational patterns of Macao’s tourism space.
The nearest neighbor index (NNI) is one of the effective methods for describing the mutual proximity of point features to determine their spatial distribution type, as shown in equation (2) [35].
In the formula,
The ANN tool in ArcGIS software adds p-value and z-score on the basis of NNI, which is designed to test and correct the results of NNI. z-Value refers to the difference in the number of standard deviations between the sample value and the overall mean. z-Score is a statistic commonly used in spatial autocorrelation analysis, which is used to test the significance of the spatial data and to determine the pattern of its distribution. The z-score can help researchers determine the type of distribution of spatial data and provide a scientific basis and analysis of samples for spatial planning and decision-making. z-Value is closer to 0, indicating that the sample value is closer to the overall mean, and z-value is larger or smaller, indicating that the sample value is more deviated from the overall mean. p-Value refers to the probability that the observed spatial pattern is generated by a random process, and it is usually used to assess whether the spatial pattern is significant or not. When the p-value is very small, it can be assumed that the observed spatial pattern is highly unlikely to have been generated randomly and that some spatial pattern or distribution is likely to exist. Therefore, the p-value can be an important indicator of the significance of a spatial pattern and is often used in conjunction with other indicators such as the z-score.
2.3.3 Tyson polygons
Voronoi diagrams, also known as Thiessen polygons, can be used to study Macao’s tourism resources. This method visually presents the concentration of tourism resources and can effectively verify the scientific basis of the Gini coefficient, thereby facilitating an in-depth discussion on the equilibrium of tourism resource distribution [37]. Voronoi diagrams are formed by connecting the perpendicular bisectors of adjacent points, creating contiguous polygons where each polygon contains only one discrete point. Any location within a polygon is closer to its generating point than to any other discrete point in an adjacent polygon [38]. This article employs the Voronoi diagram method to illustrate issues related to the spatial balance structure of tourism resources in Macao. The smaller the area of a Voronoi polygon, the denser the distribution of sample points within that area.
Geometrically, a Tyson polygon is a dissection of the space plane. There exists a set of discrete points (i, j = 1, 2, 3, …, k) in the plane, where k is the number of discrete points, and if the region is divided into k mutually neighboring polygons by a set of straight line segments such that the following three conditions hold [39]:
Each polygon can contain only one discrete point.
Assume that a point (x′, y′) in the plane lies within the polygon containing the discrete point (x j , y j ), which holds at i ≠ j by equation (3).
(3)Equation (4) holds if the point (x′, y′) lies on the common side of two polygons of the discrete point (x j , y j ).
2.3.4 Standard deviation ellipse
The standard deviation ellipse is an algorithm used to measure the direction and distribution of a dataset, first proposed in 1926 by Lefever, a sociology professor at the University of Southern California [40]. As a classic spatial statistical method for analyzing the spatial distribution patterns of geographic elements, it quantifies distribution characteristics primarily through parameters including the center point, major axis, minor axis, and azimuth angle [41]. The resulting output is an ellipse where the semi-major axis indicates the direction of data distribution, while the semi-minor axis represents the spread of the distribution. A larger difference between the semi-major and semi-minor axes (higher flatness) signifies a more pronounced directional tendency in the data. Conversely, when the semi-major and semi-minor axes are similar in length, the directional tendency becomes less evident. The standard deviation ellipse is calculated using the following formulas [42,43]:
The azimuth angle of the ellipse’s major axis indicates the primary direction of the data distribution. (xᵢ, yᵢ) coordinates of the ith point. (x̄, ȳ) coordinates of the mean center of the dataset. σₓ (standard deviation of the semi-major axis) measures the dispersion of data along the primary direction. σᵧ (standard deviation of the semi-minor axis) measures the dispersion of data perpendicular to the primary direction. cosθ and sinθ (elements of the coordinate rotation matrix): project the original coordinates onto the principal axes of the ellipse. n is the sample size.
3 Spatial distribution characteristics of Macau’s tourism resources
3.1 Quantitative analysis
Macao’s tourism resources possess distinct advantages in geographical location and unique cultural elements. Its most prominent features stem from the integration of Eastern and Western multicultural components, manifested in cultural, religious, and natural landscapes [44]. Unlike neighboring destinations, visitors can appreciate the cultural heritage of Sino-Western exchange since the Ming and Qing dynasties without leaving the country [45], experiencing Portuguese-inspired architecture and Southeast Asian cultural customs that fulfill travelers’ desire for foreign cultural immersion. A prime example is the “Historic Centre of Macao” – a UNESCO World Heritage site centered around the old city [46]. As China’s oldest, largest, best-preserved, and most concentrated collection of coexisting Eastern and Western architectural landmarks [47], it vividly exemplifies East-West cultural synthesis. Furthermore, Macao’s strategic position within the Guangdong-Hong Kong-Macao Greater Bay Area ensures proximity to neighboring cities like Hong Kong and Zhuhai, with highly convenient transportation meeting short-term visitors’ experiential needs [48,49]. For mainstream tourists, Macao offers an exceptional value proposition: minimal cost and travel time to witness distinctive Portuguese and Southeast Asian tropical charm without transoceanic journeys. Crucially, the spatial distribution of Macao’s tourism resources – characterized by diversity and concentration – creates exceptionally favorable conditions for high-frequency visitor flows and immersive travel experiences.
According to official statistics, Macau has witnessed explosive growth in tourist arrivals, reflecting its unique appeal. In 2023, Macau received 28.213 million (28,213,000) inbound visitors, recovering to 71.6% of pre-pandemic 2019 levels. Overnight and same-day visitors totaled 14.227 million and 13.986 million, increasing by 4.7- and 3.3-fold year-on-year, respectively. Among these, 19.049 million visitors (67.5% of total arrivals) were from mainland China, a 2.7-fold increase. Notably, travelers from the nine Pearl River Delta cities in the Greater Bay Area surged by 1.8-fold to 9.305 million. Visitors from Hong Kong and international markets reached 7.196 million (25.5%) and 1.46 million (5.2%), rising by 13- and 105.9-fold, respectively. By November 2024, preliminary data indicate that Macau’s tourist arrivals exceeded 30 million, underscoring the industry’s robust growth potential [25].
A classification of tourism resources across the Macau Peninsula, Taipa, and Coloane reveals significant spatial disparities influenced by historical development [50], economic activities [36], population distribution [51], and urban planning [52,53]. While resources are concentrated in the Macau Peninsula, all three regions possess unique resource potentials and opportunities for coordinated development. The classification of tourism resources is detailed in Table 2.
Statistical classification of Macau’s tourism resources
| Area | Tourism resource classification | |||||
|---|---|---|---|---|---|---|
| Geological landscape | Architectural landscape | Water landscape | Biological landscape | Site ruins | Macau’s World Heritage | |
| Freguesia de Mongkok | 1 | 14 | 0 | 0 | 4 | 1 |
| Kao Wang Parish | 0 | 34 | 0 | 0 | 5 | 0 |
| Freguesia de Nossa Senhora de Fátima | 1 | 36 | 0 | 0 | 1 | 0 |
| Parish of Carmel | 2 | 14 | 0 | 0 | 0 | 0 |
| St Francis of Assisi Parish | 2 | 8 | 1 | 2 | 3 | 8 |
| Cotai reclamation area | 0 | 0 | 0 | 1 | 0 | 0 |
| Lobby area | 0 | 9 | 2 | 0 | 13 | 8 |
| Fengshun parish | 1 | 10 | 0 | 0 | 6 | 13 |
According to Table 2, architectural landscape resources constitute the most abundant category of tourism resources in Macau, totaling 125 sites, reflecting the diversity and uniqueness of Macau’s architectural heritage. The Kao Wang Parish contains the highest concentration of resources, with 39 sites, followed closely by the Freguesia de Nossa Senhora de Fátima with 38 tourism resource points. This distribution aligns with the historical and cultural significance of these two regions. In contrast, the Cotai Reclamation Area has the fewest tourism resources, with only one site, primarily due to its late development and peripheral location relative to traditional urban centers. Nevertheless, the Cotai Reclamation Area has emerged as a modern tourism and entertainment hub, characterized by high-density contemporary architecture and integrated casino resorts. These modern facilities complement the heritage-focused resources of the Macau Peninsula, creating a diversified tourism landscape that caters to varied visitor demands. As evidenced by the statistics in Table 2, tourism resources in the Macao Peninsula and Cotai exhibit distinct characteristics. The former centers around UNESCO World Heritage sites – exemplified by the Ruins of St. Paul’s (Figure 3) – featuring ancient church relics and cultural landscapes reflecting East-West fusion. In contrast, Cotai is characterized by modern gaming-entertainment complexes represented by integrated resorts such as Sands Cotai Resort (Figure 4). Together, they form Macao’s unique tourism landscape, creating optimal conditions for visitors to experience both the cultural synthesis of Eastern and Western civilizations and the thrilling excitement of contemporary gaming entertainment.

Ruins of St. Paul’s.

Sands Macao resort.
Historical site ruins rank as the second most prevalent resource type, with 32 sites. The lobby area alone hosts 13 historical sites, reflecting its historical prominence and central urban location. These landmarks, such as the seventeenth-century Mount Fortress (1617), the Baroque-style Ruins of St. Paul’s, the neo-classical Senado Square, A-Ma Temple, and the Mandarin’s House, serve as vital windows into Macau’s multicultural evolution and are key attractions for understanding its Sino-Western heritage.
Despite its limited territory, Macau features distinctive geological landscapes. Guia Hill (94 m, 308 ft), the highest peak on the peninsula, integrates historical landmarks like the Guia Fortress, Chapel of Our Lady of Guia, and Guia Lighthouse into an iconic urban vista that once served defensive and observational purposes. Taipa’s highest point, Grande Taipa Hill, offers panoramic views of modern casino resorts alongside ecological hiking trails, while Coloane’s highest peak, Alto de Coloane, preserves pristine natural scenery that contrasts sharply with urbanized areas. These geological features – spanning historical, recreational, and ecological dimensions – collectively enhance Macau’s tourism appeal.
Macau also hosts three biological landscapes (e.g., wetlands and biodiversity reserves) and three water-based landscapes (e.g., coastal zones and beaches). These natural resources, combined with cultural and entertainment assets, create a multifaceted tourism environment that supports ecological tourism and coastal leisure activities. As a historic international port city and the first Portuguese-administered enclave in China, Macau’s 400-year history of global exchange has fostered a unique cultural synthesis. The peninsula concentrates UNESCO-listed World Heritage sites reflecting this hybrid identity, while Taipa and Coloane showcase modern entertainment and natural conservation, respectively. This spatial imbalance in resource distribution highlights Macau’s dual character as both a cultural repository and a contemporary tourism destination.
3.2 Spatial pattern of Macau’s tourism resources
The ANN index analysis of Macao’s world heritage tourism resources (Figure 5) reveals that the observed mean distance (107.9519 m) is significantly smaller than the expected mean distance (244.0127 m), with an R-value of 0.442403 (<1). Furthermore, the highly significant z-score (<−15.421429) and p-value (<0.01) collectively confirm a clustered spatial pattern. This clustering phenomenon stems from Macao’s unique geographical constraints, centuries-long historical evolution, and targeted heritage conservation policies. As an international port city with over 400 years of history, Macao’s immovable core cultural assets – particularly UNESCO-listed architectural ensembles and archaeological sites – are predominantly concentrated within the Peninsula’s Historic Centre. These heritage resources testify to Macao’s historical transformations and cultural syncretism, while preservation, restoration, and adaptive reuse policies have reinforced this centralized distribution pattern.
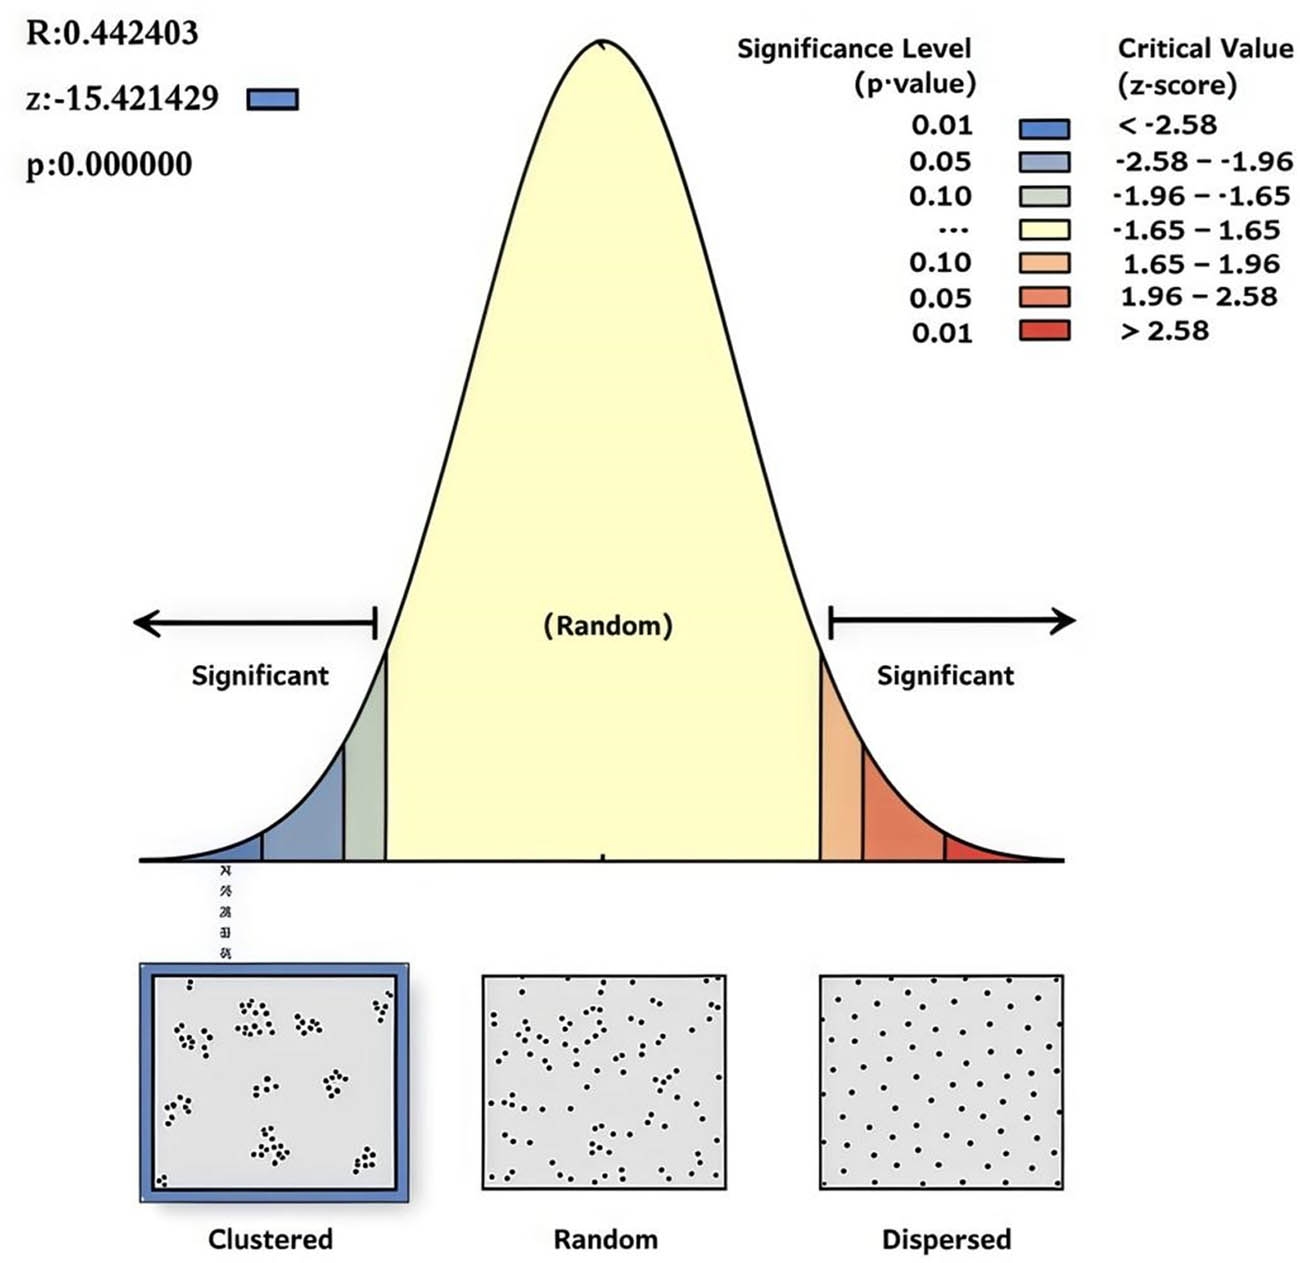
Average nearest neighbor index of Macao’s tourism resources.
Further analysis of nearest neighbor indices across resource categories (Table 3) demonstrates significant typological variations: architectural landscapes, site ruins, and world heritage properties exhibit clustered distributions, whereas geological, aquatic, and biological landscapes display dispersed patterns with relative spatial sparsity. This divergence reflects distinct regional historical trajectories, cultural characteristics, and implemented tourism planning strategies.
Average nearest neighbor index of various tourist resources in Macao
| Region name | Observed nearest distance | Theoretical nearest neighbor distance | Nearest neighbor index | z-Value | Type of space structure |
|---|---|---|---|---|---|
| Geological landscape | 1395.0007 | 901.4384 | 1.547528 | 2.771315 | Dispersed |
| Architectural landscape | 109.9714 | 297.7118 | 0.369389 | −13.96513 | Clustered |
| Water landscape | 2956.9414 | 711.8719 | 4.153755 | 10.450077 | Dispersed |
| Biological landscape | 2008.2164 | 600.5032 | 3.344223 | −4.522969 | Dispersed |
| Site ruins | 250.6186 | 484.5248 | 0.517246 | −5.224342 | Clustered |
| Macau’s World Heritage | 85.0556 | 132.0667 | 0.644035 | −3.729912 | Clustered |
To visually elucidate spatial characteristics, Voronoi diagram analysis was applied to tourism attractions using ArcGIS (Figure 6). Results indicate: (1) high-density clustering in northern Peninsula parishes (Freguesia de Nossa Senhora de Fátima, Santo António, São Lázaro, and São Lourenço), evidenced by smaller Voronoi cells and concentrated attractions; (2) extensive exposed areas in Cotai reclamation zones and casino lobby districts, indicating sparse resource distribution – particularly pronounced in coastal lobby areas; and (3) relatively homogeneous Voronoi tessellation in Freguesia do Carmo and São Francisco parishes, suggesting balanced attraction distribution despite moderate quantity, providing favorable conditions for integrated tourism development.
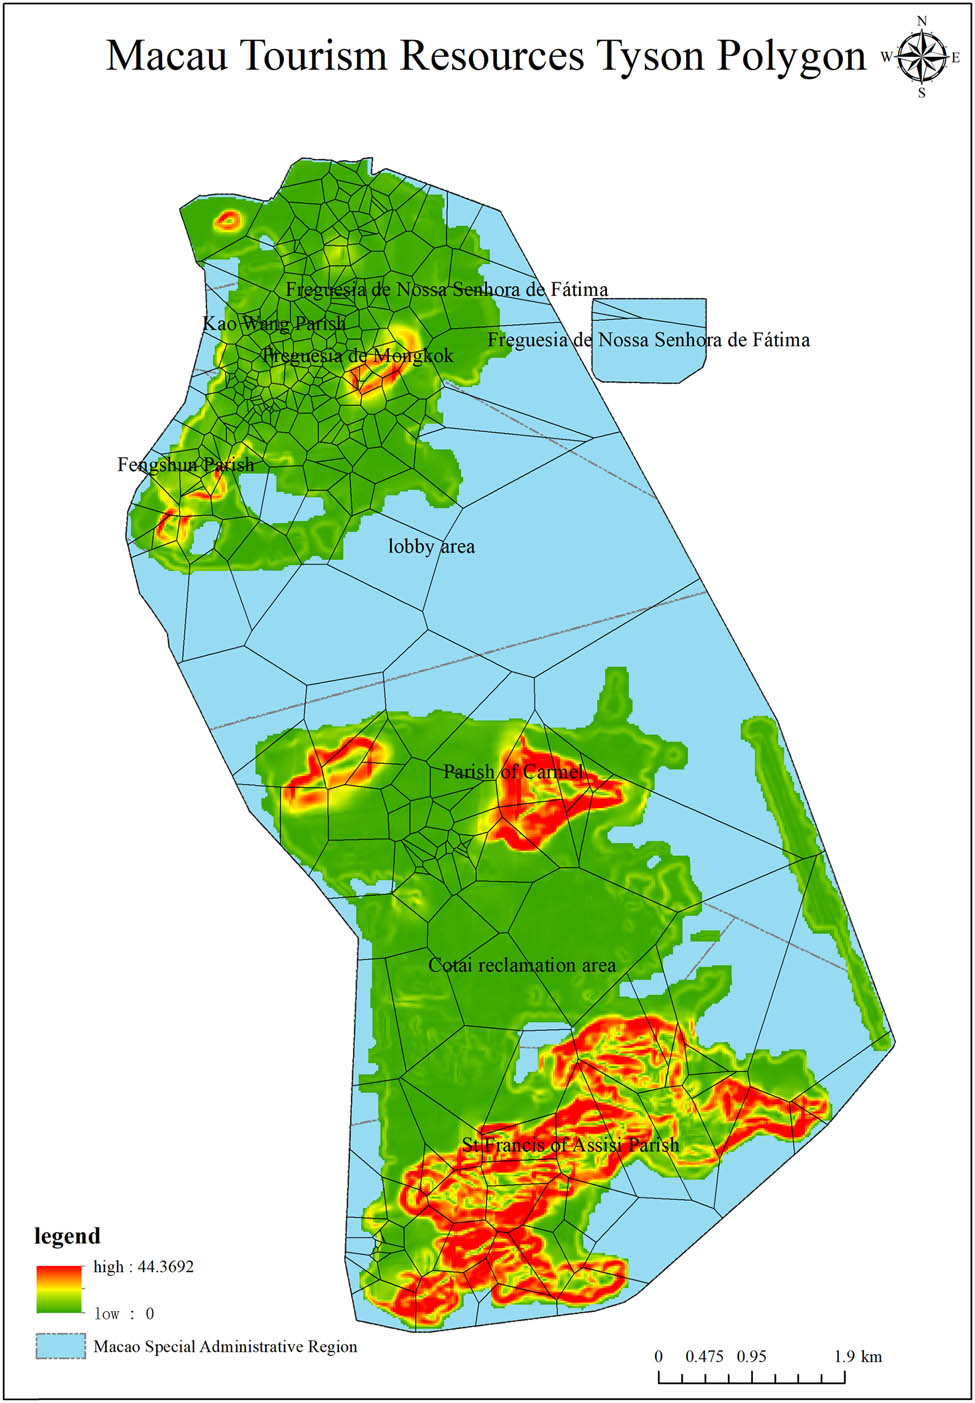
Thiessen polygons of Macao’s tourism resources.
This clustered distribution – especially of core heritage assets – delivers significant visitor advantages: proximity between major attractions enables efficient multi-destination itineraries with minimized time and cost, effectively addressing key tourist demands. Such spatial synergy enhances Macao’s destination appeal as a premier must-visit location. Crucially, attraction clustering generates synergistic effects where sites mutually reinforce visitation, allowing tourists to experience diverse cultural-natural offerings efficiently. This amplifies experiential satisfaction, creates destination hot spots, and establishes exemplary models for regional tourism development.
3.3 Kernel density analysis of Macau tourism resource spatial distribution
In studying the spatial distribution of Macau’s tourism resources, the application of kernel density analysis provides clear insights into the relationship between Macau’s World Heritage sites and its tourist attractions. As shown in Figure 7, Macau’s tourism resources exhibit an uneven distribution pattern characterized by secondary centers forming a concentric arrangement around a single core. Currently, the highest concentration of tourism resources is observed in the surrounding areas of the Macau Peninsula. The ring-shaped distribution of secondary centers indicates that while these areas possess relatively lower tourism attractiveness, they still play crucial roles in the overall tourism landscape. For instance, Taipa’s advantageous geographical position and the construction of large-scale hotels and entertainment venues have transformed it into a tourism and leisure hub, attracting visitors seeking modern recreational experiences. In contrast, Coloane remains relatively underdeveloped, retaining more natural landscapes and traditional fishing village features that appeal to tourists desiring tranquility away from urban bustle. Moreover, the development of secondary centers provides diversified options for visitors, allowing them to experience Macau’s unique blend of Chinese-Western multiculturalism while enjoying distinctive entertainment and leisure facilities from modern tourism and gaming infrastructure. This spatial distribution pattern not only alleviates visitor congestion pressure at the single core but also fosters economic interactions and cultural exchanges between different regions, forming mutually reinforcing relationships.
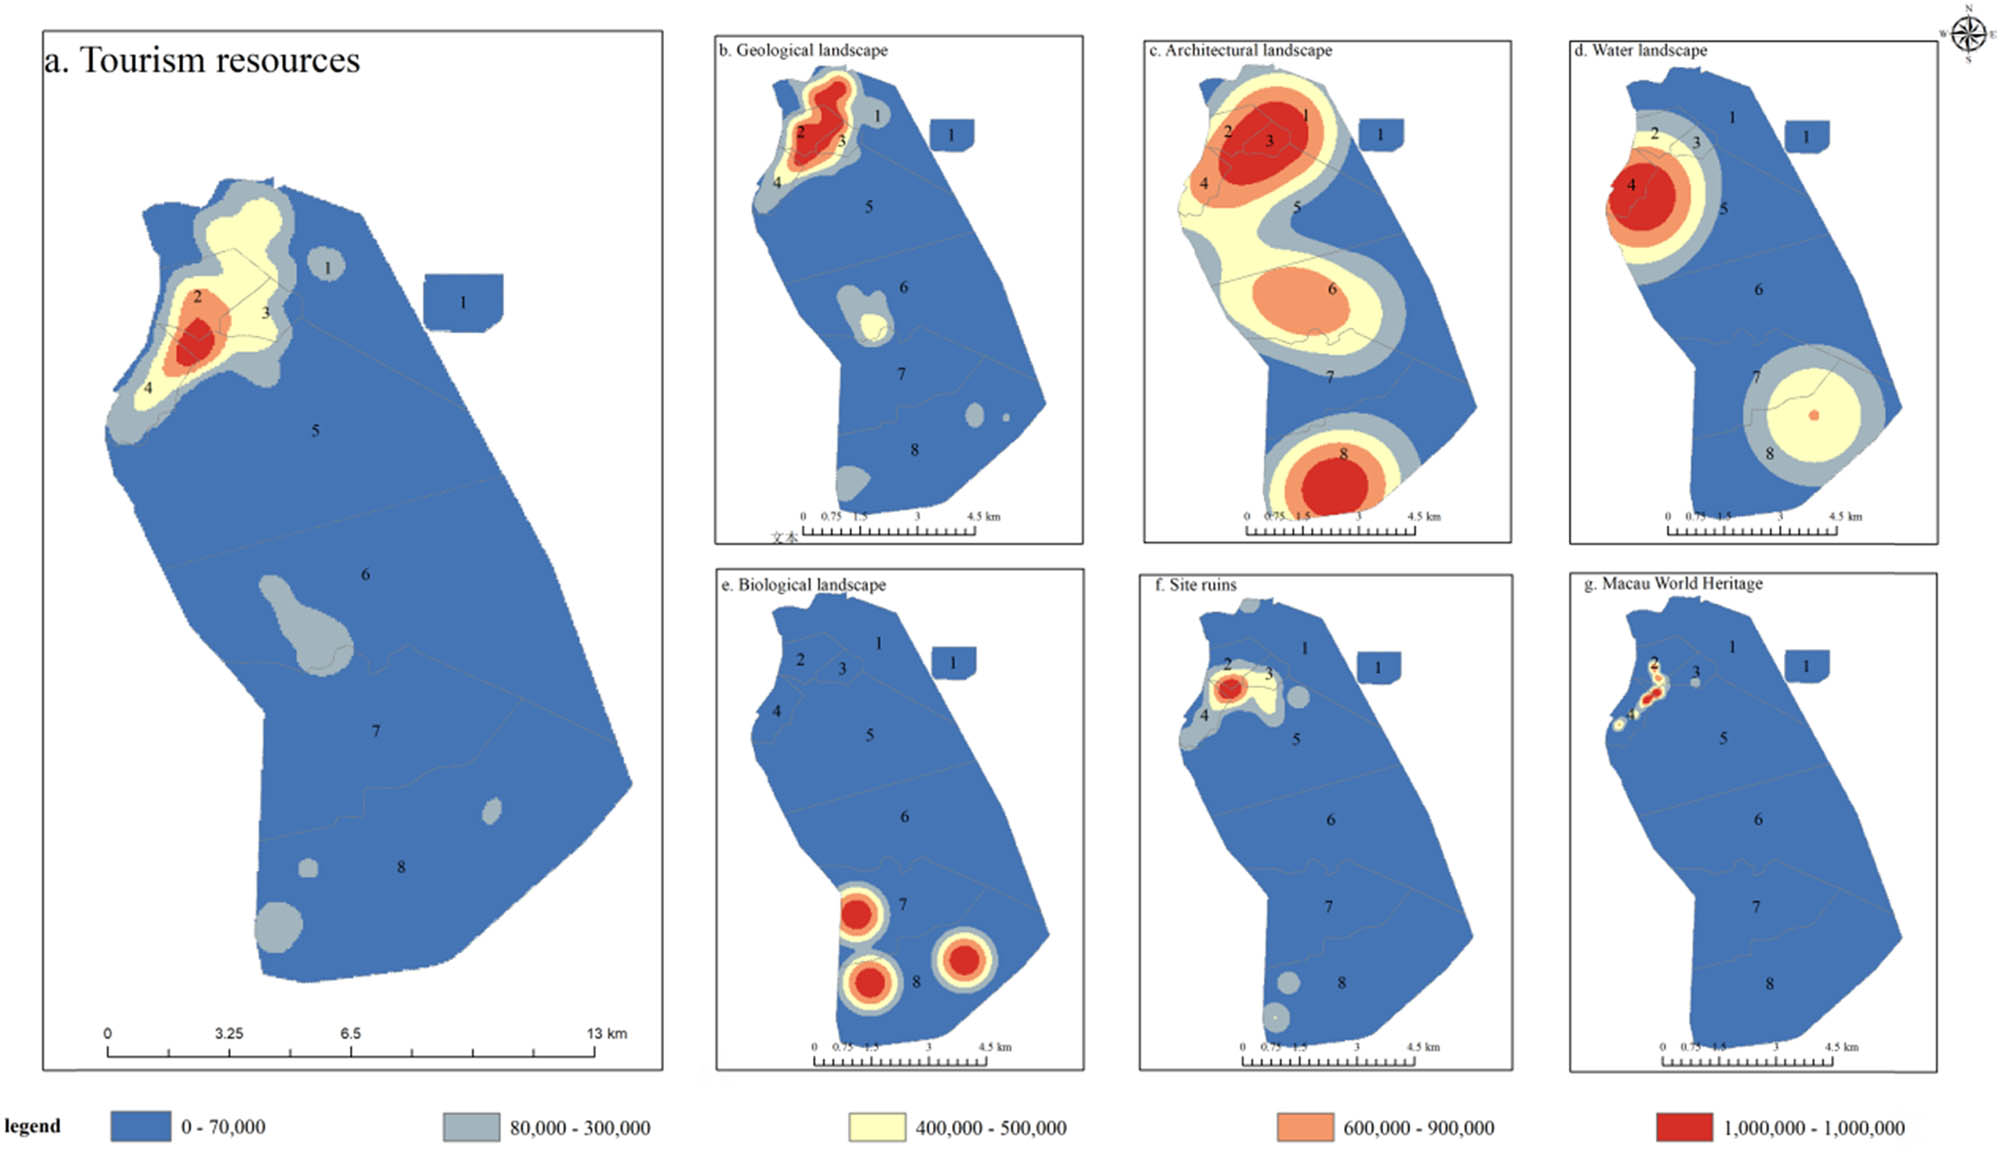
Comparative analysis of kernel density for Macao’s World Heritage sites and tourist attractions: (a) Tourism resource, (b) geological landscape, (c) architectural landscape, (d) water landscape, (e) biological landscape, (f) site ruins, and (g) Macau World Heritage.
Macao’s geological landscapes comprise tourism resources primarily featuring peaks and beaches, with high-density clusters concentrated within the Macao Peninsula. As indicated in Figure 7, beach resources predominantly occur in Zone 8 (Freguesia de São Francisco); water landscapes form high-density clusters along the Nam Van Lake waterfront; and biological landscapes in Zones 7 (Cotai Reclamation Area) and 8 consist of wetlands and ecological reserves. Site ruins and Macao’s World Heritage resources share identical distribution areas in the Peninsula’s historic core. Crucially, heritage ruins are interspersed among architectural and cultural activity hubs – a spatial pattern mirroring Macao’s historical trajectory that showcases epoch-defining cultural elements.
The Historic Centre of Macao, designated a UNESCO World Heritage site, exemplifies this convergence. Its recognition underscores both exceptional historical-cultural value and tangible testimonies to Macao’s global significance: Every brick, street, and structure – including churches, theaters, residences, praças, and gardens of distinctive European classical architecture [54] – along with religious relics, embodies Macao’s legacy as an international trading port and crucible of East-West cultural synthesis. These physical remnants preserve profound narratives of historical figures and events, enabling visitors to witness panoramic historical processes through immersive, time-travel experiences that transform tourism into meaningful engagement with living heritage [55].
3.4 Tourism resource distribution and development trends
Based on the spatial distribution characteristics of Macau’s tourism resources, the standard deviation ellipse analysis tool in ArcGIS software can be applied to study and predict future development directions and trends. As illustrated in Figure 8, the distribution of six major tourism resource categories exhibits a distinct northwest-southeast orientation, closely aligned with Macau’s geographical and urban planning layout [56]. This unique pattern is tied to historical urban development during the Portuguese administration period, where key historical buildings and cultural heritage sites were concentrated in the central peninsula area, often distributed along major roads and squares, forming the pronounced northwest-southeast directional trend. Additionally, southern Macau’s coastal zones, constrained by natural marine factors, have limited tourism development but retain coastal resources such as beaches and seascapes, which also follow a similar directional distribution [57].
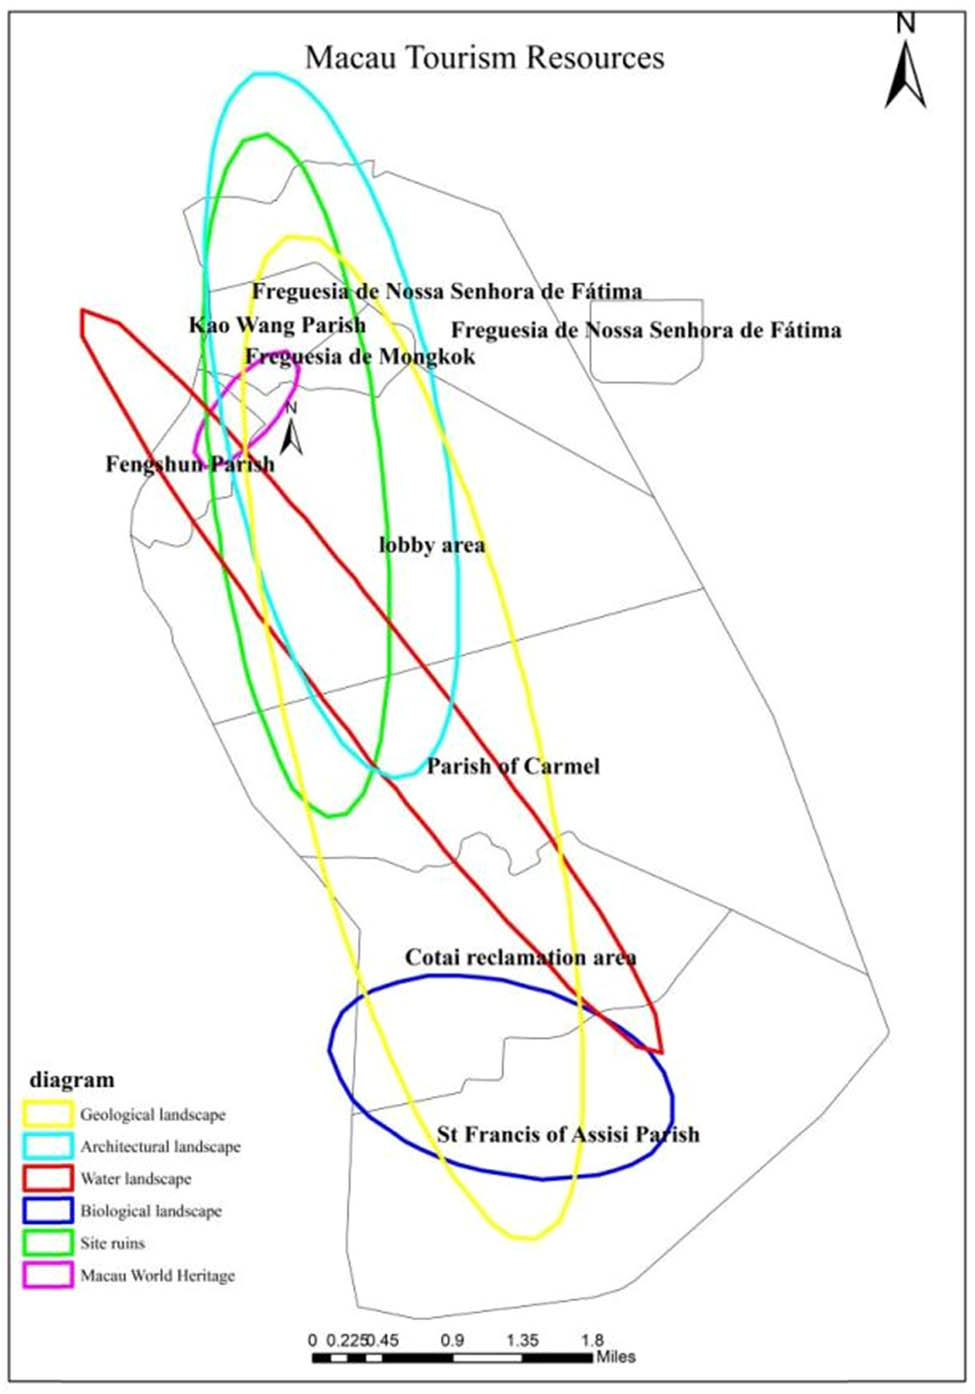
Standard deviational ellipse of Macao’s tourism resource categories.
The length of the X-axis reflects the spatial spread and centrality of tourism resources. A longer X-axis indicates broader distribution and weaker centrality, while a shorter X-axis suggests higher concentration and stronger centrality. According to Table 4, the biological landscape has the longest X-axis, indicating its widespread distribution and minimal centrality. This is followed by geological landscape, architectural landscape, site ruins, water landscape, and Macau’s World Heritage, which occupy progressively shorter ranges. Notably, Macau’s World Heritage has the shortest X-axis, reflecting its compact spatial distribution and strong centrality.
Results of standard deviation ellipse analysis for Macau tourism resources
| Category | X-axis length (km) | Y-axis length (km) | Deflection angle θ (°) | Flat rate |
|---|---|---|---|---|
| Geological landscape | 0.011256 | 0.04833 | 166.344177 | 0.767101179 |
| Architectural landscape | 0.00998 | 0.0336 | 168.59881 | 0.70297619 |
| Water landscape | 0.004634 | 0.044222 | 142.140976 | 0.895210529 |
| Biological landscape | 0.016454 | 0.008861 | 104.455191 | 0.461468336 |
| Site ruins | 0.007959 | 0.032261 | 173.517781 | 0.75329345 |
| Macau’s World Heritage | 0.002671 | 0.006937 | 41.133445 | 0.614963241 |
The length of the Y-axis represents the directional alignment of resource distribution. All tourism resource categories in Macau exhibit a northwest-southeast orientation, consistent with the territorial shape of the region. Among the six categories, water landscape displays the most pronounced directional alignment, while Macau’s World Heritage shows the least directional distinctiveness. The remaining categories – geological landscape, architectural landscape, site ruins, and biological landscape – fall between these extremes.
The rotation angles of the ellipses are ranked as follows: site ruins (173.52°), architectural landscape, geological landscape, water landscape, biological landscape, and Macau’s World Heritage (smallest angle). The largest rotation angle for site ruins aligns with Macau’s historical development trajectory, reflecting over four centuries of multicultural integration. Conversely, the minimal rotation angle for Macau’s World Heritage underscores its spatially concentrated and compact distribution, highlighting its role as a core cultural and historical hub.
4 Discussion on tourism resource development and integration in Macao
4.1 Necessity and feasibility of tourism resource development
Necessity: The post-pandemic era has seen tourists increasingly favoring flexible travel modes like independent travel, presenting an opportunity for the development of short-haul tourism. Analysis of Macao’s tourism resource distribution characteristics using the ANN index and the Thiessen polygon method reveals that Macao has a compact territory with densely concentrated attractions, making resource development and integration particularly necessary. Through integration, Macao can optimize resource allocation, enhance the quality and diversity of tourism products, and strengthen its tourism appeal and competitiveness. This approach can increase the depth and breadth of tourism, attracting visitors for repeat visits and consumption, while also improving the overall tourism experience. Facing intensifying global tourism market competition, Macao needs to integrate its dispersed tourism resources to build a more distinctive and influential tourism brand, thereby countering competitive pressures from neighboring regions (such as Zhuhai and Hong Kong) and other international tourism destinations. Kernel Density Analysis of Macao’s tourism resources indicates that although resources are relatively concentrated, the competitive pressure stemming from the booming tourism industries in nearby cities cannot be ignored. To maintain a competitive edge, Macao must leverage resource integration to fully utilize its unique characteristics, avoid homogenized competition, and promote the high-quality development of its tourism industry.
Feasibility: Macao is situated in the subtropical zone and features a typical maritime monsoon climate. Moderated by the ocean in summer, temperatures are high but not intensely hot; winters are cool but rarely severely cold. The climate is distinct across the four seasons, with summers being warm and humid and winters cool and dry, making it suitable for year-round tourism. With rising consumption levels and the popularization of travel culture, the number of visitors to Macao continues to grow. In recent years, Macao’s tourism economy has developed steadily, with most tourism sectors achieving positive growth, laying a foundation for sustainable development. Macao possesses a rich cultural heritage, a unique history blending Eastern and Western influences, and modern entertainment facilities, providing a solid foundation for the comprehensive development of tourism resources. Particularly in the Macao Peninsula, the core tourism area, infrastructure is continuously improving. Standard Deviational Ellipse analysis shows that Macao’s tourism resources are oriented in a northwest-southeast direction, aligning with the layout of the road network in the Macao Special Administrative Region, creating favorable conditions for resource development and integration. The Macao SAR Government attaches great importance to tourism development, investing corresponding funds and policy resources to ensure the integration process. The improvement of transportation infrastructure, such as the Hong Kong-Zhuhai-Macao Bridge, has also strengthened Macao’s connectivity with surrounding regions, creating advantageous conditions for the in-depth development and integration of tourism resources.
4.2 Macao tourism resources spatial optimization strategies
Based on the preceding assessment of tourism resource spatial integrity and analysis of tourism spatial elements, the following spatial optimization strategies are proposed to achieve the research objectives – promoting the initiation and continuation of tourist spatiotemporal behaviors, fulfilling behavioral motivation needs, optimizing time allocation, extending dwell time, and stimulating multi-destination exploration: (1) rational resource development and core tourism circle enhancement fully harness the value of historical-cultural heritage and modern urban landscapes through scientifically planned protective utilization of tourism resources. While enhancing the appeal of core attractions like the Ruins of St. Paul’s and The Venetian Macao, focus on developing new tourism nodes such as art exhibitions and cultural experiences. This will establish an interconnected multi-node pattern, comprehensively boosting the attractiveness of area-wide tourism. (2) Transportation corridor improvement and accessibility enhancement expand road networks connecting major scenic areas and introduce direct bus or rail transit routes to key attractions. Optimize pedestrian environments and signage systems to facilitate walking exploration. Upgrade port facilities, streamline entry procedures, and improve customs clearance efficiency to strengthen the appeal for international tourists. (3) Service system optimization and spatial coverage expansion providing high-quality services is crucial for visitor retention. Strengthen multilingual service training for staff to ensure international service standards implementation. Expand service facilities (rest areas, restrooms, information centers) with priority coverage in popular attractions and tourist gathering zones, achieving comprehensive service network penetration across the destination.
5 Concluding remarks
This study, leveraging POI data and GIS spatial analysis, unveils the spatial pattern of Macau’s tourism resources characterized by “a single-core concentration with complementary but uneven distribution across the islands.” Key findings reveal: The historical urban area of Macau Peninsula exhibits a high concentration of cultural heritage and architectural landscapes (ANN index R = 0.44, p < 0.01), forming an absolute core. Dangan relies on the development of the Lu-Dangan City for modern gaming entertainment, while Luhuán retains natural ecological resources, both serving as secondary centers distributed in a ring formation. Despite their complementary functions to the peninsula, there are significant differences in resource density and type. The distribution of resource types is highly differentiated, with cultural resources highly concentrated on the peninsula (agglomerated) and natural resources relatively scattered across the outlying islands and peripheries (dispersed, e.g., water bodies with R = 4.15). Overall, spatial equilibrium faces challenges, with the peninsula bearing significant pressure, and the diversity and development level of resources on the islands requiring enhancement.
The spatial analysis method employed in this study effectively delineates the micro-scale pattern, and the identified model of “single-core concentration with complementary islands” holds reference value for similar micro-sized tourist cities. Based on these findings, spatial optimization recommendations include: strengthening the protection and cultural function diversion of the peninsula’s core, guiding the formation of multiple nodes; promoting Dangan beyond its singular focus on gaming, integrating diverse cultures to create an “entertainment + culture” fusion zone; prioritizing the development of eco-tourism and slow living in Luhuán, improving transportation connectivity; optimizing cross-regional transportation corridors (aligned with the northwest-southeast resource axis) and comprehensive tourism service facility coverage.
Limitations of the study include potential omissions or classification biases in POI data; a focus on static spatial analysis, lacking dynamic evolution and visitor behavior data support. Future research could integrate multi-temporal remote sensing images, time-series POI, and large-scale visitor behavior data for dynamic monitoring; combine socioeconomic data to deepen the study of visitor preferences and resource matching; conduct comparative studies with the Greater Bay Area or international counterparts to explore coordination strategies; and assess policy impacts within the spatial analytical framework.
In summary, Macau needs to promote core area quality improvement, characteristic development of the islands, and upgrade of full-domain services through scientific spatial planning, resource integration, and regional collaboration, transitioning from “single-core concentration” to a “multi-core driven, functionally complementary, and territorially balanced” model, thereby consolidating its position as a World Tourism and Leisure Center.
-
Funding information: This research was supported by the Research Projects of Macao Polytechnic University (grant number RP/ESCHS-03/2020).
-
Author contributions: SZ: conceptualization, data curation, formal analysis, methodology, software, and writing – original draft. XL: conceptualization, data curation, validation, visualization, and writing – review and editing. XW: conceptualization, data curation, funding acquisition, investigation, methodology, supervision, and writing – review and editing. CL: investigation, validation, and writing – review and editing. RC: conceptualization, data curation, investigation, methodology, validation, and writing – review and editing.
-
Conflict of interest: The authors declare that the research was conducted in the absence of any commercial or financial relationships that could be construed as a potential conflict of interest.
References
[1] Oktyabrskaya IV, Alymkulova SK, Nazarov II, Samushkina EV. The kyrgyz republic: concept, strategies, and practices for the preservation of the national cultural heritage. Archaeol Ethnol Anthropol Eurasia. 2022;50:128–39.10.17746/1563-0110.2022.50.2.128-139Search in Google Scholar
[2] Dmitrienko NM, Edakina DA, Chernyak EI. Museum AND cultural heritage. Vestnik Tomskogo Gosudarstvennogo Universiteta-Kulturologiya I Iskusstvovedenie-Tomsk State University. J Cult Stud Art Hist. 2022;48:301–14.Search in Google Scholar
[3] Shi D, Guan JW, Wan DJ, Liu JP. Assessing the ecological security of tourism in Northeast China. Open Geosci. 2024;16(1).10.1515/geo-2022-0545Search in Google Scholar
[4] Kattiyapornpong U, Miller K. Differences within and between travel preference, planned travel and choice behavior of Australians traveling to Asian and oversea destinations. Council for Australian University Tourism and Hospitality Education Annual Conference. Sydney: University of Technology; 2007.Search in Google Scholar
[5] Lyu T, Geng Q, Chen H, Xu M. Psychological resistance or seeking values? Exploring the role of technology paternalism on consumers’ willingness to intelligent vehicle purchase. Transp Res Part F: Traffic Psychol Behav. 2025;114:182–99.10.1016/j.trf.2025.06.001Search in Google Scholar
[6] Ekinci Y. From destination image to destination branding: An emerging area of research. E-review Tour Res. 2003;1:21–4.Search in Google Scholar
[7] Manhas PS, Manrai LA, Manrai AK. Role of tourist destination development in building its brand image: A conceptual model. J Econ Financ Admin Sci. 2016;21:25–9.10.1016/j.jefas.2016.01.001Search in Google Scholar
[8] Huang D, Song Y, Qiao P. Evaluation on the development level and spatial pattern of tourism industry in Guangdong-Hong Kong-Macao Greater Bay Area based on spatial dependence analysis. For Chem Rev. 2021;1303–27.Search in Google Scholar
[9] Sofronov B. The development of the travel and tourism industry in the world. Ann Spiru Haret Univ Econ Ser. 2018;18:123–37.10.26458/1847Search in Google Scholar
[10] Araoz GF. Preserving heritage places under a new paradigm. J Cult Herit Manag Sustainablity Dev. 2011;1:55–60.10.1108/20441261111129933Search in Google Scholar
[11] Quan XQ. The supply-side reform perspective is a fusion of the development and protection of ancient towns. 5th International Education, Economics, Social Science, Arts, Sports and Management Engineering Conference (IEESASM). Qingdao, Peoples R China; 2017. p. 224–30.Search in Google Scholar
[12] Shakeela A, Ruhanen L, Breakey N. Human resource policies: striving for sustainable tourism outcomes in the Maldives. Tour Recreat Res. 2012;37:113–22.10.1080/02508281.2012.11081696Search in Google Scholar
[13] Murayama T, Brown G, Hallak R, Matsuoka K. Tourism destination competitiveness: analysis and strategy of the Miyagi Zao Mountains Area, Japan. Sustainability. 2022;14:9124.10.3390/su14159124Search in Google Scholar
[14] Huang YZ, Chen CJ. Ecological integration of new ideas for urban tourism space resources-Nanning Watertown tourism space resources integration. 4th International Conference on Technology of Architecture and Structure (ICTAS 2011); 2011 Sep 22-24. Xian, Peoples R China: Xian Univ Architecture & Technol; 2012. p. 1889.10.4028/www.scientific.net/AMR.368-373.1889Search in Google Scholar
[15] Stankov U, Markovic V, Savic S, Dolinaj D, Pantelic M, Arsenovic D. Tourism resources in urban heat island: a gis analysis of Novi Sad, Serbia. 5th Jubilee International Conference on Cartography and GIS. Riviera, Bulgaria; 2014. p. 559–67.Search in Google Scholar
[16] Bailey TC, Fotheringham S, Rogerson P. A review of statistical spatial analysis in geographical information systems. Spat Anal GIS. 1994;13–44.10.4324/9780203221563_chapter_2Search in Google Scholar
[17] Xie HY, Shi X. GIS-Based Tourism Planning Information System Research. 2nd International Conference on Computer and Automation Engineering (ICCAE). Singapore: 2010. p. 643–6.10.1109/ICCAE.2010.5451547Search in Google Scholar
[18] Xie HY, Shi X. GIS-Based Tourism Information System Design and Implementation. International Conference on e-Education, e-Business, e-Management and e-Learning. Sanya, Peoples R China: IEEE; 2010. p. 582–5.10.1109/IC4E.2010.150Search in Google Scholar
[19] Nistor MM, Nicula AS, Dezsi S, Petrea D, Kamarajugedda SA, Carebia IA. GIS-Based Kernel Analysis for Tourism Flow Mapping. J Settl Spat Plan. 2020;11:137–45.10.24193/JSSP.2020.2.07Search in Google Scholar
[20] Shen MJ. GIS positioning based on optical sensing detection and simulation of tourism route planning in rural tourism scenic areas. Opt Quantum Electron. 2024;56:284.10.1007/s11082-024-07638-3Search in Google Scholar
[21] Chen C, Chen C, Sun XL. Application of GIS Digital Technology in Planning of Tourism Scenic Spot. International Conference on Civil, Architectural and Hydraulic Engineering (ICCAHE 2012). Zhangjiajie, Peoples R China: 2012. p. 2796–9.10.4028/www.scientific.net/AMM.204-208.2796Search in Google Scholar
[22] Nino K, Mamo Y, Mengesha G, Kibret KS. GIS based ecotourism potential assessment in Munessa Shashemene Concession Forest and its surrounding area, Ethiopia. Appl Geogr. 2017;82:48–58.10.1016/j.apgeog.2017.02.010Search in Google Scholar
[23] Moghaddam MD, Ahmadzadeh H, Valizadeh R. A GIS-Based assessment of urban tourism potential with a branding approach utilizing hybrid modeling. Spat Inf Res. 2022;30:399–416.10.1007/s41324-022-00439-4Search in Google Scholar
[24] Chhetri A, Arrowsmith C, Chhetri P, Corcoran J. Mapping spatial tourism and hospitality employment clusters: an application of spatial autocorrelation. Tour Anal. 2013;18:559–73.10.3727/108354213X13782245307830Search in Google Scholar
[25] Yearbook Of Statistical 2024. at https://www.dsec.gov.mo/zh-MO/Home/Publication/YearbookOfStatistics.).Search in Google Scholar
[26] Labadi S. World heritage: challenges for the millennium. Unesco: World Heritage Centre; 2007.Search in Google Scholar
[27] Pleerux N. GIS-based analysis to detect road accident hotspots using network kernel density estimation. Suranaree J Sci Technol. 2021;28(4):300656.Search in Google Scholar
[28] Liu L, Jiang C, Zhou S, Liu K, Xu C, Cao J. Multi-scale spatio-temporal pattern analysis of urban burglary crime: based on a case study of DP peninsula in H City, China. Geogr Res. 2017;36:2451–64.Search in Google Scholar
[29] Buckley R. Sustainable tourism: research and reality. Ann Tour Res. 2012;39:528–46.10.1016/j.annals.2012.02.003Search in Google Scholar
[30] Mocnik FB. An improved algorithm for dynamic nearest-neighbour models. J Spat Sci. 2022;67:411–38.10.1080/14498596.2020.1739575Search in Google Scholar
[31] Song S, Wang HY, Meng Y. Study on spatial pattern of tourism landscape resources in county cities of Yangtze River Economic Belt. Open Geosci. 2023;15:20220569.10.1515/geo-2022-0569Search in Google Scholar
[32] Rossbacher LA. Nearest-neighbour analysis: a technique for quantitative evaluation of polygonal ground patterns. Geografiska Annaler: Series A. Phys Geogr. 1986;68:101–5.10.1080/04353676.1986.11880162Search in Google Scholar
[33] Lee J, Li S, Wang S, Wang J, Li J. Spatio-temporal nearest neighbor index for measuring space-time clustering among geographic events. Pap Appl Geogr. 2021;7:117–30.10.1080/23754931.2020.1810112Search in Google Scholar
[34] Thompson AE, Walden JP, Chase AS, Hutson SR, Marken DB, Cap B, et al. Ancient Lowland Maya neighborhoods: Average Nearest Neighbor analysis and kernel density models, environments, and urban scale. PLoS one. 2022;17:e0275916.10.1371/journal.pone.0275916Search in Google Scholar PubMed PubMed Central
[35] Wang L, Liu J-M Wang L-E, Zhu H, Lin J. Tourism resource assessment and spatial analysis of wine tourism development: A case study of the eastern foothills of China’s Helan Mountains. J Mt Sci. 2018;15:645–56.10.1007/s11629-016-4350-3Search in Google Scholar
[36] Xie YC, Meng XZ, Cenci J, Zhang JZ. Spatial pattern and formation mechanism of rural tourism resources in China: Evidence from 1470 national leisure villages. ISPRSInt J Geo-Inf. 2022;11:455.10.3390/ijgi11080455Search in Google Scholar
[37] Chen C, Zhang CY, Chen Q. Analysis of Rainfall Distribution in Watershed based on GIS. International Conference on Algorithms, High Performance Computing, and Artificial Intelligence (AHPCAI). Sanya, Peoples R China: 2021.10.1117/12.2626630Search in Google Scholar
[38] Bi XM. Tyson polygon construction based on spatio-temporal data network. Int J Wireless Inf Network. 2020;27:289–98.10.1007/s10776-019-00461-8Search in Google Scholar
[39] Gong GF, Wei Z, Zhang FT, Li Y, An Y, Yang Q, et al. Analysis of the spatial distribution and influencing factors of China national forest villages. Environ Monit Assess. 2022;194:428.10.1007/s10661-022-10087-8Search in Google Scholar PubMed
[40] Lefever DW. Measuring geographic concentration by means of the standard deviational ellipse. Am J Sociol. 1926;32:88–94.10.1086/214027Search in Google Scholar
[41] Zhao Y, Wu Q, Wei P, Zhao H, Zhang X, Pang C. Explore the mitigation mechanism of urban thermal environment by integrating geographic detector and standard deviation ellipse (SDE). Remote Sens. 2022;14:3411.10.3390/rs14143411Search in Google Scholar
[42] Zhang Y, Jiang P, Cui L, Yang Y, Ma Z, Wang Y, et al. Study on the spatial variation of China’s territorial ecological space based on the standard deviation ellipse. Front Environ Sci. 2022;10:982734.10.3389/fenvs.2022.982734Search in Google Scholar
[43] Li Q, Lu L. Spatial pattern characteristics and influencing factors of state-level sports industry bases in China. Sci Rep. 2025;15:9719.10.1038/s41598-025-94302-9Search in Google Scholar PubMed PubMed Central
[44] Mok KK. Walk to global vision: driving heritage development by world heritage award: Macau-a colony with east west culture, ICOMOS 17th General Assembly, Paris, France, 2012.Search in Google Scholar
[45] Li YT, Yang YL, Huang KL. The visual art characteristics of chinese qing dynasty export fans in the cultural and philosophical perspective. Trans-Form-Acao. 2025;48:e025055.10.1590/0101-3173.2025.v48.n5.e025055Search in Google Scholar
[46] Wang YC, Yamaguchi K, Kawasaki M. Urban revitalization in highly localized squares: A case study of the Historic Centre of Macao. Urban Des Int. 2018;23:34–53.10.1057/s41289-016-0009-5Search in Google Scholar
[47] Dewar K, Du Cros H, Li W. The search for World Heritage brand awareness beyond the iconic heritage: a case study of the Historic Centre of Macao. J Herit Tour. 2012;7:323–39.10.1080/1743873X.2012.722640Search in Google Scholar
[48] Yu H. The Guangdong-Hong Kong-Macau greater bay area in the making: Development plan and challenges. Camb Rev Int Aff. 2021;34:481–509.10.1080/09557571.2019.1679719Search in Google Scholar
[49] Lin PQ, He YT, Pei MY. Data-driven analysis of traffic volume and hub city evolution of cities in the guangdong-hong Kong-Macao Greater Bay Area. Ieee Access. 2020;8:12043–56.10.1109/ACCESS.2020.2963852Search in Google Scholar
[50] Li YJ. Characteristics and protection experience of historical buildings in Macao. Asia-Pacific Social Science and Modern Education Conference (SSME). Shanghai, Peoples R China: 2018. p. 84–8.10.2991/ssme-18.2018.15Search in Google Scholar
[51] Lei KP, Hu D, Wang Z, Yu YY, Zhao YH. An analysis of ecological footprint trade and sustainable carrying capacity of the population in Macao. Int J Sustainable Dev World Ecol. 2009;16:127–36.10.1080/13504500902808685Search in Google Scholar
[52] Wan YKP, Pinheiro FV. Planning for tourism under uncertainty: lessons from Macao, China (2002-2022). Tour RecreatRes. 2024;50(4):876–9.10.1080/02508281.2024.2346864Search in Google Scholar
[53] Deng XD, Gao F, Liao SY, Liu Y, Chen WY. Spatiotemporal evolution patterns of urban heat island and its relationship with urbanization in Guangdong-Hong Kong-Macao greater bay area of China from 2000 to 2020. Ecol Indic. 2023;146:109817.10.1016/j.ecolind.2022.109817Search in Google Scholar
[54] Wan YKP, Pinheiro FV, Korenaga M. Planning for heritage conservation in Macao. Plan Dev. 2007;22:17–26.Search in Google Scholar
[55] Tan Y, Zhang Y, Li M, Liu S. Architectural color conservation and renewal strategies in historic urban areas: an analysis based on the historic City of Macao. Tehnički Vjesn. 2024;31:657–64.10.17559/TV-20231127001153Search in Google Scholar
[56] Reis C. A governor and his action - aspects of the government of Maia Magalhaes in Macao. Rev De Historia Da Sociedade E Da Cultura. 2017;17:315–35.10.14195/1645-2259_17_14Search in Google Scholar
[57] Chang Y, Li DB, Simayi Z, Yang ST, Abulimiti M, Ren YW. Spatial pattern analysis of xinjiang tourism resources based on electronic map points of interest. Int J Environ Res Public Health. 2022;19(13):7666.10.3390/ijerph19137666Search in Google Scholar PubMed PubMed Central
© 2025 the author(s), published by De Gruyter
This work is licensed under the Creative Commons Attribution 4.0 International License.
Articles in the same Issue
- Research Articles
- Seismic response and damage model analysis of rocky slopes with weak interlayers
- Multi-scenario simulation and eco-environmental effect analysis of “Production–Living–Ecological space” based on PLUS model: A case study of Anyang City
- Remote sensing estimation of chlorophyll content in rape leaves in Weibei dryland region of China
- GIS-based frequency ratio and Shannon entropy modeling for landslide susceptibility mapping: A case study in Kundah Taluk, Nilgiris District, India
- Natural gas origin and accumulation of the Changxing–Feixianguan Formation in the Puguang area, China
- Spatial variations of shear-wave velocity anomaly derived from Love wave ambient noise seismic tomography along Lembang Fault (West Java, Indonesia)
- Evaluation of cumulative rainfall and rainfall event–duration threshold based on triggering and non-triggering rainfalls: Northern Thailand case
- Pixel and region-oriented classification of Sentinel-2 imagery to assess LULC dynamics and their climate impact in Nowshera, Pakistan
- The use of radar-optical remote sensing data and geographic information system–analytical hierarchy process–multicriteria decision analysis techniques for revealing groundwater recharge prospective zones in arid-semi arid lands
- Effect of pore throats on the reservoir quality of tight sandstone: A case study of the Yanchang Formation in the Zhidan area, Ordos Basin
- Hydroelectric simulation of the phreatic water response of mining cracked soil based on microbial solidification
- Spatial-temporal evolution of habitat quality in tropical monsoon climate region based on “pattern–process–quality” – a case study of Cambodia
- Early Permian to Middle Triassic Formation petroleum potentials of Sydney Basin, Australia: A geochemical analysis
- Micro-mechanism analysis of Zhongchuan loess liquefaction disaster induced by Jishishan M6.2 earthquake in 2023
- Prediction method of S-wave velocities in tight sandstone reservoirs – a case study of CO2 geological storage area in Ordos Basin
- Ecological restoration in valley area of semiarid region damaged by shallow buried coal seam mining
- Hydrocarbon-generating characteristics of Xujiahe coal-bearing source rocks in the continuous sedimentary environment of the Southwest Sichuan
- Hazard analysis of future surface displacements on active faults based on the recurrence interval of strong earthquakes
- Structural characterization of the Zalm district, West Saudi Arabia, using aeromagnetic data: An approach for gold mineral exploration
- Research on the variation in the Shields curve of silt initiation
- Reuse of agricultural drainage water and wastewater for crop irrigation in southeastern Algeria
- Assessing the effectiveness of utilizing low-cost inertial measurement unit sensors for producing as-built plans
- Analysis of the formation process of a natural fertilizer in the loess area
- Machine learning methods for landslide mapping studies: A comparative study of SVM and RF algorithms in the Oued Aoulai watershed (Morocco)
- Chemical dissolution and the source of salt efflorescence in weathering of sandstone cultural relics
- Molecular simulation of methane adsorption capacity in transitional shale – a case study of Longtan Formation shale in Southern Sichuan Basin, SW China
- Evolution characteristics of extreme maximum temperature events in Central China and adaptation strategies under different future warming scenarios
- Estimating Bowen ratio in local environment based on satellite imagery
- 3D fusion modeling of multi-scale geological structures based on subdivision-NURBS surfaces and stratigraphic sequence formalization
- Comparative analysis of machine learning algorithms in Google Earth Engine for urban land use dynamics in rapidly urbanizing South Asian cities
- Study on the mechanism of plant root influence on soil properties in expansive soil areas
- Simulation of seismic hazard parameters and earthquakes source mechanisms along the Red Sea rift, western Saudi Arabia
- Tectonics vs sedimentation in foredeep basins: A tale from the Oligo-Miocene Monte Falterona Formation (Northern Apennines, Italy)
- Investigation of landslide areas in Tokat-Almus road between Bakımlı-Almus by the PS-InSAR method (Türkiye)
- Predicting coastal variations in non-storm conditions with machine learning
- Cross-dimensional adaptivity research on a 3D earth observation data cube model
- Geochronology and geochemistry of late Paleozoic volcanic rocks in eastern Inner Mongolia and their geological significance
- Spatial and temporal evolution of land use and habitat quality in arid regions – a case of Northwest China
- Ground-penetrating radar imaging of subsurface karst features controlling water leakage across Wadi Namar dam, south Riyadh, Saudi Arabia
- Rayleigh wave dispersion inversion via modified sine cosine algorithm: Application to Hangzhou, China passive surface wave data
- Fractal insights into permeability control by pore structure in tight sandstone reservoirs, Heshui area, Ordos Basin
- Debris flow hazard characteristic and mitigation in Yusitong Gully, Hengduan Mountainous Region
- Research on community characteristics of vegetation restoration in hilly power engineering based on multi temporal remote sensing technology
- Identification of radial drainage networks based on topographic and geometric features
- Trace elements and melt inclusion in zircon within the Qunji porphyry Cu deposit: Application to the metallogenic potential of the reduced magma-hydrothermal system
- Pore, fracture characteristics and diagenetic evolution of medium-maturity marine shales from the Silurian Longmaxi Formation, NE Sichuan Basin, China
- Study of the earthquakes source parameters, site response, and path attenuation using P and S-waves spectral inversion, Aswan region, south Egypt
- Source of contamination and assessment of potential health risks of potentially toxic metal(loid)s in agricultural soil from Al Lith, Saudi Arabia
- Regional spatiotemporal evolution and influencing factors of rural construction areas in the Nanxi River Basin via GIS
- An efficient network for object detection in scale-imbalanced remote sensing images
- Effect of microscopic pore–throat structure heterogeneity on waterflooding seepage characteristics of tight sandstone reservoirs
- Environmental health risk assessment of Zn, Cd, Pb, Fe, and Co in coastal sediments of the southeastern Gulf of Aqaba
- A modified Hoek–Brown model considering softening effects and its applications
- Evaluation of engineering properties of soil for sustainable urban development
- The spatio-temporal characteristics and influencing factors of sustainable development in China’s provincial areas
- Application of a mixed additive and multiplicative random error model to generate DTM products from LiDAR data
- Gold vein mineralogy and oxygen isotopes of Wadi Abu Khusheiba, Jordan
- Prediction of surface deformation time series in closed mines based on LSTM and optimization algorithms
- 2D–3D Geological features collaborative identification of surrounding rock structural planes in hydraulic adit based on OC-AINet
- Spatiotemporal patterns and drivers of Chl-a in Chinese lakes between 1986 and 2023
- Land use classification through fusion of remote sensing images and multi-source data
- Nexus between renewable energy, technological innovation, and carbon dioxide emissions in Saudi Arabia
- Analysis of the spillover effects of green organic transformation on sustainable development in ethnic regions’ agriculture and animal husbandry
- Factors impacting spatial distribution of black and odorous water bodies in Hebei
- Large-scale shaking table tests on the liquefaction and deformation responses of an ultra-deep overburden
- Impacts of climate change and sea-level rise on the coastal geological environment of Quang Nam province, Vietnam
- Reservoir characterization and exploration potential of shale reservoir near denudation area: A case study of Ordovician–Silurian marine shale, China
- Seismic prediction of Permian volcanic rock reservoirs in Southwest Sichuan Basin
- Application of CBERS-04 IRS data to land surface temperature inversion: A case study based on Minqin arid area
- Geological characteristics and prospecting direction of Sanjiaoding gold mine in Saishiteng area
- Research on the deformation prediction model of surrounding rock based on SSA-VMD-GRU
- Geochronology, geochemical characteristics, and tectonic significance of the granites, Menghewula, Southern Great Xing’an range
- Hazard classification of active faults in Yunnan base on probabilistic seismic hazard assessment
- Characteristics analysis of hydrate reservoirs with different geological structures developed by vertical well depressurization
- Estimating the travel distance of channelized rock avalanches using genetic programming method
- Landscape preferences of hikers in Three Parallel Rivers Region and its adjacent regions by content analysis of user-generated photography
- New age constraints of the LGM onset in the Bohemian Forest – Central Europe
- Characteristics of geological evolution based on the multifractal singularity theory: A case study of Heyu granite and Mesozoic tectonics
- Soil water content and longitudinal microbiota distribution in disturbed areas of tower foundations of power transmission and transformation projects
- Oil accumulation process of the Kongdian reservoir in the deep subsag zone of the Cangdong Sag, Bohai Bay Basin, China
- Investigation of velocity profile in rock–ice avalanche by particle image velocimetry measurement
- Optimizing 3D seismic survey geometries using ray tracing and illumination modeling: A case study from Penobscot field
- Sedimentology of the Phra That and Pha Daeng Formations: A preliminary evaluation of geological CO2 storage potential in the Lampang Basin, Thailand
- Improved classification algorithm for hyperspectral remote sensing images based on the hybrid spectral network model
- Map analysis of soil erodibility rates and gully erosion sites in Anambra State, South Eastern Nigeria
- Identification and driving mechanism of land use conflict in China’s South-North transition zone: A case study of Huaihe River Basin
- Evaluation of the impact of land-use change on earthquake risk distribution in different periods: An empirical analysis from Sichuan Province
- A test site case study on the long-term behavior of geotextile tubes
- An experimental investigation into carbon dioxide flooding and rock dissolution in low-permeability reservoirs of the South China Sea
- Detection and semi-quantitative analysis of naphthenic acids in coal and gangue from mining areas in China
- Comparative effects of olivine and sand on KOH-treated clayey soil
- YOLO-MC: An algorithm for early forest fire recognition based on drone image
- Earthquake building damage classification based on full suite of Sentinel-1 features
- Potential landslide detection and influencing factors analysis in the upper Yellow River based on SBAS-InSAR technology
- Assessing green area changes in Najran City, Saudi Arabia (2013–2022) using hybrid deep learning techniques
- An advanced approach integrating methods to estimate hydraulic conductivity of different soil types supported by a machine learning model
- Hybrid methods for land use and land cover classification using remote sensing and combined spectral feature extraction: A case study of Najran City, KSA
- Streamlining digital elevation model construction from historical aerial photographs: The impact of reference elevation data on spatial accuracy
- Analysis of urban expansion patterns in the Yangtze River Delta based on the fusion impervious surfaces dataset
- A metaverse-based visual analysis approach for 3D reservoir models
- Late Quaternary record of 100 ka depositional cycles on the Larache shelf (NW Morocco)
- Integrated well-seismic analysis of sedimentary facies distribution: A case study from the Mesoproterozoic, Ordos Basin, China
- Study on the spatial equilibrium of cultural and tourism resources in Macao, China
- Urban road surface condition detecting and integrating based on the mobile sensing framework with multi-modal sensors
- Application of improved sine cosine algorithm with chaotic mapping and novel updating methods for joint inversion of resistivity and surface wave data
- The synergistic use of AHP and GIS to assess factors driving forest fire potential in a peat swamp forest in Thailand
- Dynamic response analysis and comprehensive evaluation of cement-improved aeolian sand roadbed
- Rock control on evolution of Khorat Cuesta, Khorat UNESCO Geopark, Northeastern Thailand
- Gradient response mechanism of carbon storage: Spatiotemporal analysis of economic-ecological dimensions based on hybrid machine learning
- Comparison of several seismic active earth pressure calculation methods for retaining structures
- Mantle dynamics and petrogenesis of Gomer basalts in the Northwestern Ethiopia: A geochemical perspective
- Study on ground deformation monitoring in Xiong’an New Area from 2021 to 2023 based on DS-InSAR
- Paleoenvironmental characteristics of continental shale and its significance to organic matter enrichment: Taking the fifth member of Xujiahe Formation in Tianfu area of Sichuan Basin as an example
- Equipping the integral approach with generalized least squares to reconstruct relict channel profile and its usage in the Shanxi Rift, northern China
- InSAR-driven landslide hazard assessment along highways in hilly regions: A case-based validation approach
- Attribution analysis of multi-temporal scale surface streamflow changes in the Ganjiang River based on a multi-temporal Budyko framework
- Maps analysis of Najran City, Saudi Arabia to enhance agricultural development using hybrid system of ANN and multi-CNN models
- Hybrid deep learning with a random forest system for sustainable agricultural land cover classification using DEM in Najran, Saudi Arabia
- Long-term evolution patterns of groundwater depth and lagged response to precipitation in a complex aquifer system: Insights from Huaibei Region, China
- Remote sensing and machine learning for lithology and mineral detection in NW, Pakistan
- Spatial–temporal variations of NO2 pollution in Shandong Province based on Sentinel-5P satellite data and influencing factors
- Numerical modeling of geothermal energy piles with sensitivity and parameter variation analysis of a case study
- Stability analysis of valley-type upstream tailings dams using a 3D model
- Variation characteristics and attribution analysis of actual evaporation at monthly time scale from 1982 to 2019 in Jialing River Basin, China
- Investigating machine learning and statistical approaches for landslide susceptibility mapping in Minfeng County, Xinjiang
- Investigating spatiotemporal patterns for comprehensive accessibility of service facilities by location-based service data in Nanjing (2016–2022)
- A pre-treatment method for particle size analysis of fine-grained sedimentary rocks, Bohai Bay Basin, China
- Study on the formation mechanism of the hard-shell layer of liquefied silty soil
- Comprehensive analysis of agricultural CEE: Efficiency assessment, mechanism identification, and policy response – A case study of Anhui Province
- Simulation study on the damage and failure mechanism of the surrounding rock in sanded dolomite tunnels
- Towards carbon neutrality: Spatiotemporal evolution and key influences on agricultural ecological efficiency in Northwest China
- High-frequency cycles drive the cyclical enrichment of oil in porous carbonate reservoirs: A case study of the Khasib Formation in E Oilfield, Mesopotamian Basin, Iraq
- Reconstruction of digital core models of granular rocks using mathematical morphology
- Spatial–temporal differentiation law of habitat quality and its driving mechanism in the typical plateau areas of the Loess Plateau in the recent 30 years
- A machine-learning-based approach to predict potential oil sites: Conceptual framework and experimental evaluation
- Review Articles
- Humic substances influence on the distribution of dissolved iron in seawater: A review of electrochemical methods and other techniques
- Applications of physics-informed neural networks in geosciences: From basic seismology to comprehensive environmental studies
- Ore-controlling structures of granite-related uranium deposits in South China: A review
- Shallow geological structure features in Balikpapan Bay East Kalimantan Province – Indonesia
- A review on the tectonic affinity of microcontinents and evolution of the Proto-Tethys Ocean in Northeastern Tibet
- Advancements in machine learning applications for mineral prospecting and geophysical inversion: A review
- Special Issue: Natural Resources and Environmental Risks: Towards a Sustainable Future - Part II
- Depopulation in the Visok micro-region: Toward demographic and economic revitalization
- Special Issue: Geospatial and Environmental Dynamics - Part II
- Advancing urban sustainability: Applying GIS technologies to assess SDG indicators – a case study of Podgorica (Montenegro)
- Spatiotemporal and trend analysis of common cancers in men in Central Serbia (1999–2021)
- Minerals for the green agenda, implications, stalemates, and alternatives
- Spatiotemporal water quality analysis of Vrana Lake, Croatia
- Functional transformation of settlements in coal exploitation zones: A case study of the municipality of Stanari in Republic of Srpska (Bosnia and Herzegovina)
- Hypertension in AP Vojvodina (Northern Serbia): A spatio-temporal analysis of patients at the Institute for Cardiovascular Diseases of Vojvodina
- Regional patterns in cause-specific mortality in Montenegro, 1991–2019
- Spatio-temporal analysis of flood events using GIS and remote sensing-based approach in the Ukrina River Basin, Bosnia and Herzegovina
- Flash flood susceptibility mapping using LiDAR-Derived DEM and machine learning algorithms: Ljuboviđa case study, Serbia
- Geocultural heritage as a basis for geotourism development: Banjska Monastery, Zvečan (Serbia)
- Assessment of groundwater potential zones using GIS and AHP techniques – A case study of the zone of influence of Kolubara Mining Basin
- Impact of the agri-geographical transformation of rural settlements on the geospatial dynamics of soil erosion intensity in municipalities of Central Serbia
- Where faith meets geomorphology: The cultural and religious significance of geodiversity explored through geospatial technologies
- Applications of local climate zone classification in European cities: A review of in situ and mobile monitoring methods in urban climate studies
- Complex multivariate water quality impact assessment on Krivaja River
- Ionization hotspots near waterfalls in Eastern Serbia’s Stara Planina Mountain
- Shift in landscape use strategies during the transition from the Bronze age to Iron age in Northwest Serbia
- Assessing the geotourism potential of glacial lakes in Plav, Montenegro: A multi-criteria assessment by using the M-GAM model
- Flash flood potential index at national scale: Susceptibility assessment within catchments
- SWAT modelling and MCDM for spatial valuation in small hydropower planning
- Disaster risk perception and local resilience near the “Duboko” landfill: Challenges of governance, management, trust, and environmental communication in Serbia