Trace elements and melt inclusion in zircon within the Qunji porphyry Cu deposit: Application to the metallogenic potential of the reduced magma-hydrothermal system
-
Zizhen Zhang
 and
Rui Liu
and
Rui Liu

Abstract
The Qunji porphyry copper (Cu) deposit, located within the Awulale metallogenic belt (AMB) in the western Tianshan orogenic belt, exhibits distinct geochemical and mineralogical characteristics that have not been fully understood. Despite its contribution to our understanding of Cu mineralization mechanisms in reductive metallogenic systems, the oxygen fugacity and ore-forming potential of this deposit are lower than those of typical porphyry Cu deposits. Therefore, there is a need to further investigate the unique features of this deposit. The primary objective of this study was to analyze minerals and trace elements in zircon to quantify the oxidation states of the magma and investigate the presence of reduced porphyry-type magmas and ore-forming fluids in the western AMB. Through this research, we aimed to provide insights into the metallogenic mechanisms and contribute to the understanding of similar deposits in reductive environments. The zircon grains from the Qunji albite porphyry have a Ce4+/Ce3+ ratio of 37.0, indicating that the deposit likely formed in a reduced magmatic–hydrothermal system, which is common in the western Tianshan orogenic belt. Our analytical methods included the use of a cathodoluminescence scanning electron microscope and laser ablation multi-collector inductively coupled plasma mass spectrometry (LA-MC-ICP-MS) to analyze trace elements in situ. The results revealed a distinct enrichment of heavy rare earth elements and a relative deficit of light rare earth elements, with a positive Eu anomaly. The zircon crystallization environment was determined to be a continental crust environment. Additionally, the Qunji albite porphyry exhibited an A-type granite geochemical affinity and was formed within an extensional environment following tectonic collisions. The oxygen fugacity of the Qunji albite porphyry was notably low, which is a significant characteristic distinguishing it from typical porphyry Cu deposits. Consequently, the Qunji Cu deposit qualifies as a reduced porphyry Cu deposit with relatively low ore-forming potential.
1 Introduction
Zircon is a ubiquitous mineral in nature. For example, it occurs in magmatic, sedimentary, and metamorphic rocks [1,2,3,4,5,6]. Zircon possesses an exceptionally stable crystal structure and can be well preserved in complex geological environments [7,8,9,10]. Furthermore, zircon exhibits high weathering resistance and interference immunity. This property not only allows for the determination of the age of single-grain zircon but also provides insights into the trace element composition of zircon [11,12,13,14,15]. Studies indicate that rare earth elements and trace elements in zircon play a crucial role in reflecting the magmatic formation and properties of zircon [16,17,18].
The Awulale metallogenic belt (AMB) hosts significant copper–gold (Cu–Au) deposits, which are located in the western Tianshan region of China. Geological surveys [19,20] indicate the presence of substantial Paleozoic iron ore deposits in the eastern part of the AMB, as well as significant porphyry Cu deposits in the western segment of the belt [21,22,23]. Accordingly, the Qunji porphyry Cu deposit can be analyzed to investigate the Cu mineralization mechanisms within reductive metallogenic systems.
Aiming to investigate the characteristics of the ore-bearing intrusion associated with the Qunji porphyry Cu deposit in the Western Tianshan Orogenic Belt, minerals and trace elements in zircon were analyzed to quantify the oxidation states of the magma. The primary objective of the present study was to investigate the presence of reduced porphyry-type magmas and ore-forming fluids in the western AMB, originating from an extensional tectonic setting during the late Carboniferous period, and to analyze the variation of the fO 2 composition during the deposition of sulfides in the reduced ore-forming system.
2 Regional geological background
As illustrated in Figure 1a, the Central Asian orogenic belt is adjacent to the European Plate to the west, the Siberian Plate to the east, and the Tarim and North China Plates to the south [24]. Moreover, Figure 1b reveals that the AMB is situated in the southwestern part of the Central Asian Orogenic Belt and is sandwiched between the Junggar Plate to the north, the Tarim Plate to the south, and the Kazakhstan–Yili Plate to the west. The strata exposed on a large scale in the AMB mainly consist of two sets of Carboniferous–Permian strata, with a sporadic distribution of Mesoproterozoic, Devonian, Triassic, Jurassic strata, and Quaternary sediments.
![Figure 1
(a) Geographical location of the Central Asian orogenic belt [52]; and (b) tectonic geographical location map of AMB [56].](/document/doi/10.1515/geo-2025-0796/asset/graphic/j_geo-2025-0796_fig_001.jpg)
Among the previously mentioned sediments, Carboniferous strata, which are rich in Au, iron (Fe), Cu, lead (Pb), and zinc (Zn) deposits, are widely distributed in the Awulal area. The AMB primarily comprises the late Carboniferous sequence and includes the Dahalajunshan (C1d), Akshak (C1a), and Yishenjilike (C2y) formations.
Similarly, the Permian strata are widely distributed in the Awulale area, whereas this stratum is relatively rare in Mount Ishkiri. In the study area, the Permian strata can be categorized into the Wulang Formation (P1w) and Taerdetao Formation (P1t) of the Lower Permian, as well as the Xiaoshansayi Formation (P2x) and Tamuqisayi Formation (P2t) of the Upper Permian. The main components of each formation are presented in Table 1.
The main composition of different formations
| Formation | Composition |
|---|---|
| C1d | Volcanic-sedimentary rocks, rhyolite, trachyte, trachyandesite, and ignimbrite |
| C1a | Purple-colored tuff, andesite, volcanic breccia, silty shale, grayish-green limestone, and grayish-green marl |
| C2y | Quartz syenite porphyry felsic volcanic rocks (rhyolite) and rhyolite-intruded minor basalts |
| P1w | Continental intermediate-mafic and felsic volcanic rocks such as andesite, dacite, rhyolite, olivine basalt, felsite, volcanic breccia, ignimbrite, and tuff |
| P1t | Bimodal volcanic rocks, basalt, and rhyolite, while P2x contains purplish red and gray thick-bedded conglomerate, pebbly sandstone, sandstone, siltstone, and mudstone |
| P2t | Red and gray thick-bedded conglomerate, sandstone, siltstone, and mudstone |
The Hamisite Formation is primarily composed of a relatively homogeneous mixture of volcaniclastic sedimentary rocks, including conglomerate, pebbly sandstone, and sandstone. Moreover, the Basiergan Formation is predominantly comprised of red thick-bedded conglomerate and sandstone. As depicted in Figure 2a, the intermediate to felsic pluton (296–306 Ma) is widely distributed in the western AMB. Notably, the AMB exhibits well-developed folds, faults, and dome structures. An E-W-trending tectonic belt formed in the late Early Paleozoic to early Late Paleozoic, which can be considered the earliest stratum compared to others. Figure 2a further illustrates that this stratum is well-developed and forms the axis of the Carboniferous folds. During the Permian, the E-W-trending tectonic belt was transformed by the N-E and N-W-trending tectonic belts, resulting in numerous folds, faults, and dome structures. Considering the influence of regional structures, rocks are mainly oriented parallel to the structure and have a dominant distribution in the intrusive porphyries and mineral deposits. The Changuoer iron deposit is primarily influenced by NW, NWW, and NE fractures [25], and the porphyry Cu ore bodies predominantly form near these structures [26].
![Figure 2
Tectonic features and magmatic rock distribution in the Western Amur-More Basin. Detailed map illustrating the tectonics and distribution of magmatic rocks in the western AMB, highlighting key geological formations and relationships [19,20].](/document/doi/10.1515/geo-2025-0796/asset/graphic/j_geo-2025-0796_fig_002.jpg)
The exposed strata comprise the Wulang Formation of the Lower Permian, characterized by basaltic andesite; the Taerdetao Formation of the Lower Permian, which includes basalt and rhyolite; and the Xiaoshansayi Formation of the Upper Permian, exhibiting a conglomerate structure. The primary structure is the Tosba anticline, followed by fault structures, with a stratigraphic trend directed to the north and east, and a dip angle ranging from 50° to 80°. The intrusive rocks primarily consist of alkali-rich acid granite-albite porphyry, with most of the Cu deposits in the study area developed within the intrusive body. The Qunji albite porphyry is oriented in the north–south direction, with the rock mass controlled by a fault in the north that is 1,000 m long and 200 m wide, a narrow fault to the south, and an 80 m wide fault in the middle. Figure 3 illustrates that it intruded into the strata of the Taerdetao Formation of the Lower Permian and established intrusive contact with the basalts of the Taerdetao Formation.
![Figure 3
Stratigraphic and albite porphyry distribution map of Qunji copper area [19,20].](/document/doi/10.1515/geo-2025-0796/asset/graphic/j_geo-2025-0796_fig_003.jpg)
The western part of the AMB hosts numerous Cu deposits that share striking similarities with the surrounding rocks, alteration zones, and ore minerals [27]. Accordingly, these deposits are significantly different from typical porphyry Cu deposits. This difference is particularly pronounced in the Qunji Cu deposit. In the western part of AMB, volcanic–subvolcanic hydrothermal Cu deposits are associated with Permian terrestrial intermediate and volcanic rocks, such as the Nulasai and Kezikezang deposits. However, porphyry Cu deposits are found within Late Paleozoic intermediate to acidic intrusive rocks, such as the Yinulasai, Qiongbulake, Qunjisayi, Qunji, and Heishantou deposits [19,20,22,26].
3 Petrography and mineralogy
The Qunji albite porphyry is maroon, featuring a fluidal structure and porphyritic texture. As depicted in Figure 4, nearly parallel ore veinlets are developed at the edge of the rock mass. These compositions mainly consist of hydrothermal minerals (such as calcite) or sulfides. The porphyry of the albite porphyry primarily consists of albite (50%), with a high Na2O content in the whole rock (Table A1). The subsequent alteration is characterized by potassic minerals rather than sodium minerals (Figure 5a), exhibiting a platy structure with highly euhedral crystals, featuring twin crystal development, and showing signs of erosion at the edges (Figure 5b and d), indicating that the albite porphyry is formed by crystal differentiation [28]. The average particle size of albite is 2 mm × 0.2 mm (Figure 5). The matrix primarily consists of feldspar (20%) and quartz (30%), with accessory minerals including zircon, while dark minerals are rare in the rock mass.
![Figure 4
Field photos of Qunji albite porphyry [19,20] with a maroon Qunji albite porphyry: (a) development of parallel veins with nearly horizontal pairs at the edge of the albite porphyry, (b) filled vein with hydrothermal minerals, (c) filled vein with sulfide, and (d) albite porphyry with rhyolite structure.](/document/doi/10.1515/geo-2025-0796/asset/graphic/j_geo-2025-0796_fig_004.jpg)
Field photos of Qunji albite porphyry [19,20] with a maroon Qunji albite porphyry: (a) development of parallel veins with nearly horizontal pairs at the edge of the albite porphyry, (b) filled vein with hydrothermal minerals, (c) filled vein with sulfide, and (d) albite porphyry with rhyolite structure.
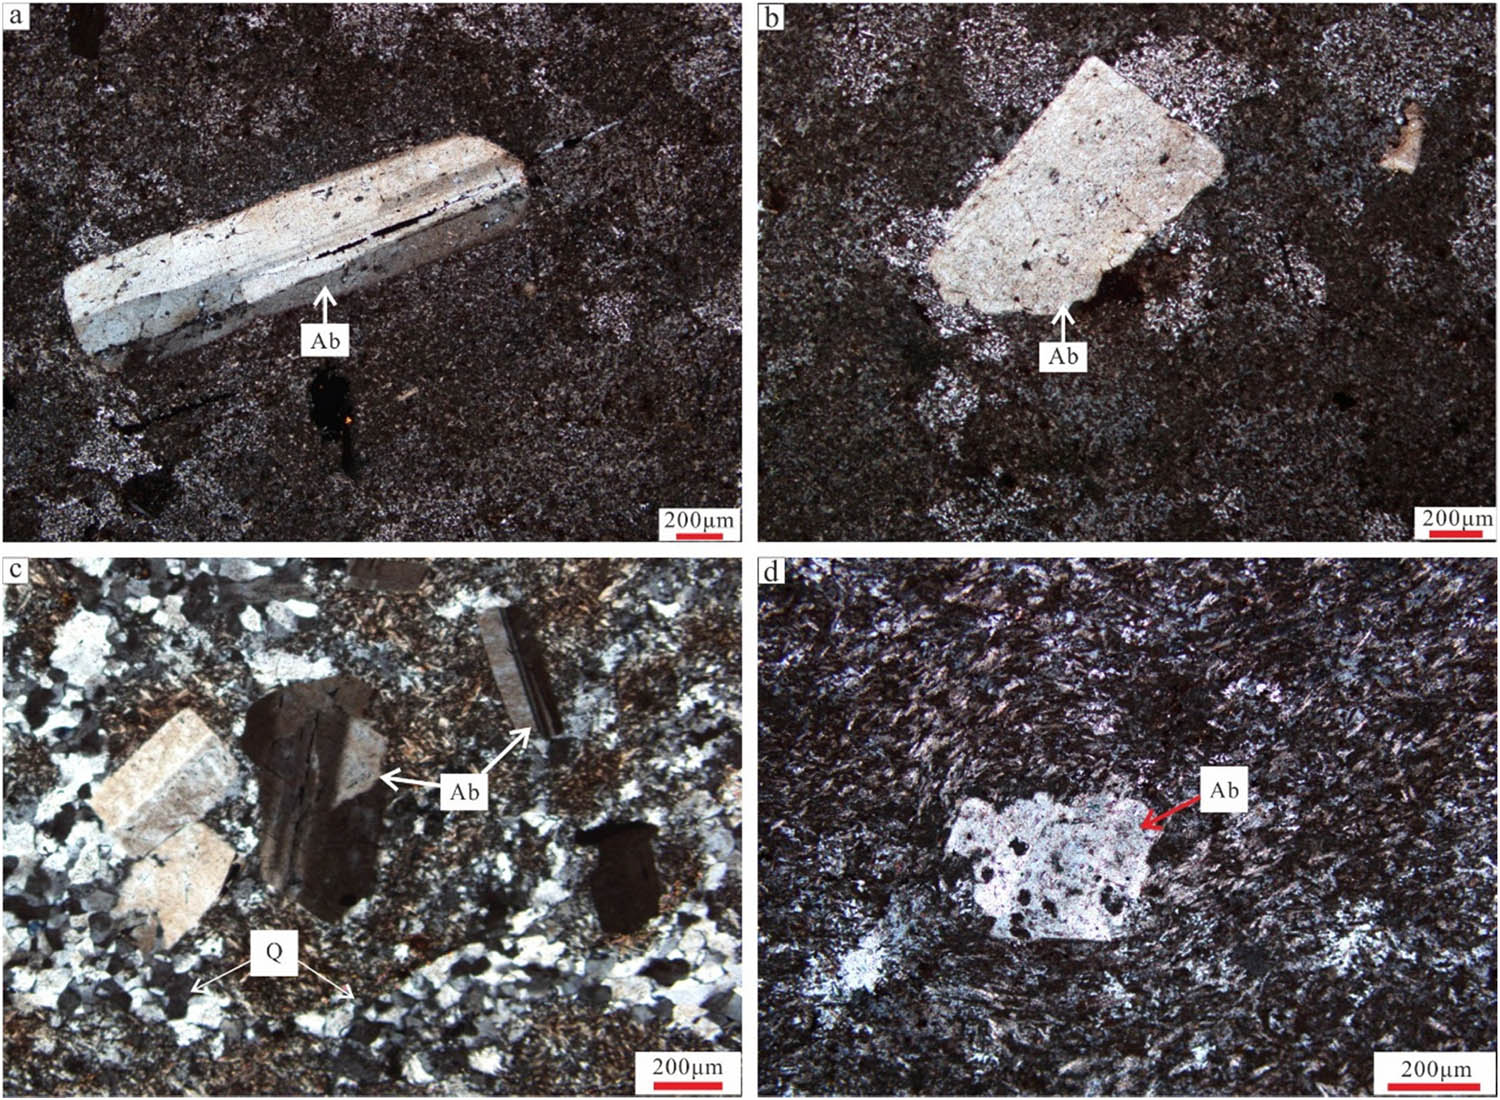
Microscopic characteristics of Qunji albite porphyry: (a) plate-like albite phenocrysts in albite porphyry with cryptic matrix and cross-polarized light; (b) albite phenocrysts in albite porphyry, cross-polarized light; (c) albite double crystals and quartz phenocrysts, cross-polarized light; and (d) albite feldspar in albite porphyry with eroded structure, flowing matrix, cross-polarized light (Ab: albite; Q: quartz).
The Qunji porphyry Cu deposit is located within fault-controlled albite porphyry. The occurrence of the orebody is similar to that of the albite porphyry, featuring veins, lentils, and lenticular shapes that range from 30 to 130 m in length and 5 to 10 m in width. Figure 6 indicates that the orebody near the fault has a Cu grade ranging from 0.2 to 1.5%, which is suitable for industrial applications.

Section map of No. 0 exploration line of Qunji porphyry copper deposit.
As illustrated in Figure 7, the ores can be primarily divided into veinlet and disseminated types located at the edges and within the rock mass, respectively. Sulfide compounds in the disseminated ore are distributed in a spot-like manner throughout the albite porphyry rock mass, while minerals in the vein ore are filled in the fractures of the rock mass in a ribbon-like manner. Since bornite is the most abundant mineral in the area, some veinlets are completely filled with bornite. The alteration observed in the Qunji porphyry Cu deposit is notably weak, with nearly no evident alteration in the disseminated ores. Consequently, only a very narrow potassic feldspathization is developed at the edges of the vein ores.

Field geological characteristics of Qunji porphyry copper deposit under different conditions: (a) no alteration in the contact zone between the ore-body and the surrounding rock; (b) disseminated ore, dark sulfide is distributed in porphyry copper deposits in speckles; (c) parallel veined ores; and (d) vein-like ore, dark sulfide is filled in the vein-like body, and narrow potassiation appears at the edge of the vein-like body.
The main ore minerals of the Qunji porphyry Cu deposit include pyrite, chalcopyrite, bornite, and chalcocite. Figure 8 shows that pyrite is a bright yellow material, which is generally speckled and embedded in other sulfides, with a particle size ranging from 50 to 200 μm. This mineral is mainly distributed in the albite porphyry matrix of disseminated ores and is associated with gangue minerals in vein ores. Moreover, chalcopyrite is distributed in ores and schistose rocks with no obvious crystal structure and is often associated with pyrite. Meanwhile, bornite is flaky, generally exhibits a complete crystal structure, and is often associated with chalcopyrite and pyrite. Since chalcocite forms from hydrothermal alteration in the later stage, it only develops at the edges of bornite, resulting in a very low concentration in the vein. The metasomatic texture of the minerals in the ore is well developed. The pyrite in the infected ore has a cubic euhedral–granular texture and is metasomatized by chalcopyrite along the internal fissures or edges (Figure 8a). Solid solution metasomatism is observed in chalcopyrite, with its replacement by bornite or a combination of chalcopyrite and bornite, while bornite itself is replaced by chalcocite (Figure 8a). The pyrite often occurs paragenetically with chalcopyrite and bornite, but there are also paragenetic combinations of chalcopyrite and bornite (Figure 8b).

(a) and (b) Mineral types and structural characteristics of Qunji porphyry copper deposit (Bo: bornite; Py: pyrite; Cpy: chalcopyrite; Cc: chalcocite).
4 Analytical methods
4.1 Whole-rock major and trace elements
The selected samples were first identified under a light slice microscope, and appropriate rock samples were chosen for pretreatment. Subsequently, some samples were selected for corrosion testing and broken into small pieces. In this regard, the samples were cleaned with MILI-Q ultrapure water, then dried and crushed to less than 200 mesh using an agate mortar in an uncontaminated environment for geochemical analyses. In the present study, elemental geochemical analyses were conducted at ALS Mineral/ALS Chemex Co. Ltd. To this end, X-ray fluorescence spectrometry (Rigaku 100e, Country) was employed to measure the concentration of major oxides, with an analytical accuracy of 2%. Furthermore, trace elements were tested using inductively coupled plasma mass spectrometry (ICP-MS, PE Elan 6000, Los Angeles, USA). The accuracy of this device for rare earth elements and other trace elements is 5% and 5–10%, respectively. Trace elements were measured using an ICP-MS (PE Elan 6000, Los Angeles, USA). The measurement accuracy of the device for rare earth elements and other trace elements was between 5 and 10%, respectively.
4.2 Zircon U–Pb dating and trace elements
The zircon selection process for ore-bearing porphyries in the Qunji Cu deposit includes artificial crushing (60–80 mesh), washing with clean water, separating zircon using conventional gravity and magnetic separation methods, purifying with a binocular microscope, and selecting zircon particles with reasonable transparency and good crystal shape. The zircon particles from the tested samples were placed on a target made of epoxy resin, and the reflected and transmitted light were photographed under the microscope. Subsequently, a cathodoluminescence scanning electron microscope (Chongqing Yujin Technology Co., Tokyo, Japan) was employed to analyze the internal structure of the zircon. LA-ICP-MS zircon U–Pb dating was carried out at the Key Laboratory of Isotope Geochemistry, Guangzhou Institute of Geochemistry, Chinese Academy of Sciences, China. The experiments are carried out using a 193 nm ArF-excimer laser system (GeoLas 2005, Göttingen, Germany) with a laser frequency and denudation spot of 6 Hz and 30 μm, respectively. The requirements of 91,500 GJ and NIST610 standards were followed in the test. The 206Pb/238U ratio was calculated using the GLITTER program (Macquarie University). Meanwhile, the Harvard zircon 91,500 was used as an external reference material to correct instrumental mass bias and depth-dependent elemental and isotopic fractionation [8]. The selection of blank signals for samples, instrument sensitivity drift correction, element content, and U–Th–Pb isotope ratio and age calculations were carried out offline using ICPMSDataCal software [29,30]. The weighted average age diagram and harmonic diagram were completed using Ludwig’s Isoplot3.0 [31].
Concurrent with U–Pb age tests on zircon samples, LA-MC-ICP-MS was used to analyze trace elements in situ. A laser denudation system (GeoLas 2005 of 193 nm ArF-excimer) with a denuded beam diameter of 30 μm and a laser frequency of 6 Hz/s was used in the experiment. Argon was used as the make-up gas and mixed with the carrier gas via a T-connector before entering the ICP [16]. The analysis procedure is according to that described by Yuan et al. [32]. Helium was used as a carrier gas to transport the ablated sample from the laser-ablation cell to the ICP MS torch via a mixing chamber where it was mixed with argon. It should be indicated that NIST SRM 610 was used as a reference material, and 29Si was used as the internal calibrant [24].
4.3 Zircon melt inclusions composition test
Before testing the composition of zircon melt inclusions, its petrography was studied. To this end, the selected zircon samples were observed under the microscope, and relatively complete and more inclusions were selected as the research objects.
The gas phase composition was studied directly by laser Raman spectroscopy (XPLORA PLUS Visible, HORIBA, France) with a light source of 532 nm argon laser and an output power of 44 mV. Furthermore, the size of the laser beam spot was 1 μm, and the spectral resolution was 1 cm−1. The counting time was 10 s, and the spectrum of the whole band from 100 to 400 cm−1 was captured once. Before the test, the laser Raman spectroscopy was calibrated by monocrystalline silicon slices. After calibration, the Raman shifts of the monocrystalline silicon slices corresponded to 520.7 cm−1.
Before analyzing the solid components of the melt inclusions, the inclusions were first exposed and then applied to zircon targets for electron probe analysis using an electron microprobe (JEOL JXA-8230, Tokyo, Japan) with an acceleration voltage of 20 kV, a current of 20 nA, a beam spot diameter of 1 μm, and a detection limit of 100–300 × 10−6. The standard samples used in the test process are selected according to the different objects tested, and the error of the major element is ±2%.
5 Results
5.1 Whole-rock major and trace element compositions
The samples from the Qunji albite porphyritic pluton mainly contains SiO2 (66.4–76.9 wt%), Na2O (3.23–7.16 wt%), and total alkali (6.02–9.66 wt%), with small amounts of other compositions such as low MgO (0.13–0.26 wt%), P2O5 (0.06–0.08 wt%), and CaO (0.47–1.84 wt%), with an Mg# concentration of (0.08–0.23 wt%) [22], FeOT/MgO ratio of 6.01–21.4, and (Na2O + K2O)/CaO ratio of 4.61–17.7 (Table A1). The relatively high SiO2 and total alkali contents indicate a peralkaline signature for these samples. Furthermore, the A/CNK ratio varies in the range of 0.78–1.22, implying that these samples mostly belong to the metaluminous series. Figure 9a shows the evolution of samples from alkaline to the peralkaline field, which is consistent with the characteristics of alkaline rocks. The Al-index map demonstrates that the Qunji albite porphyry falls in the transition region from metaluminous to peraluminous (Figure9b). These samples were slightly enriched in light rare earth elements (LREEs) with negative Eu anomalies (Eu/Eu* = 0.39–0.66). The normalized diagrams of trace elements in the primitive mantle in Figure 10b reveal that Ba, Nb, Ta, Sr, P, and Ti are depleted, while Rb, Th, U, K, Zr, and Hf are relatively enriched and have high Ga/Al ratio and other geochemical characteristics, which are considered as typical characteristics of A-type granites. Figure 11 shows the distribution of studied samples in the A-type granite. Accordingly, it is inferred that the Qunji albite porphyry has an A-type granite geochemical affinity. From a mineralogy perspective, the main mineral combination of A-type granite consists of quartz + dark-colored femic minerals ± alkali feldspar, with little or no potassic feldspar, while Qunji albite porphyry is mainly composed of quartz and albite, similar to A-type granite. In summary, Qunji albite porphyry can be classified as an A-type granite.

Geochemical diagram of Qunji albite porphyry. (a) SiO2 vs Na2O + K2O diagram; (b) A/NK vs A/CNK diagram.

(a) Distribution patterns of normalized rare earth elements in Qunji albite porphyry chondrites and (b) mantle normalized diagrams of trace elements.

Discriminant diagram of the A-type granite of the Qunji albite porphyry. (a) 10000Ga/Al vs Zr; (b) 10000Ga/Al vs Nb; (c) Zr+Nb+Ce+Y vs (K2O+ Na2O)/CaO; and (d) Zr+Nb+Ce+Y vs FeOT/MgO.
In this article, 18 points were analyzed for 18 zircons in sample QJ008. The data are shown in Table 2, and the cathodoluminescence (CL) images are shown in Figure 12. It is observed that the prepared zircon grains in Qunji albite porphyry are usually colorless and transparent, and most zircon grains are either long or short columnar with relatively complete and crystal angles. The length of the longer axis of zircon grains is in the range of 50–150 μm. Moreover, the grains have an average length-to-width ratio of 1.2–1.5, a Th/U ratio of 0.7–1.4, and include oscillatory magmatic zoning with few fissures. The majority of these zircons remain unmetamorphosed, which reflects their magmatic origin. In the present study, 18 tests were carried out, and the obtained results in Table 2 and Figure 13 confirm that the mean squared weighted deviation (MSWD) is 1.3 and the age range of 206Pb/238U are 295–319 Ma with a weighted mean age of 303 ± 3 Ma (2σ; n = 11).
LA-ICPMS zircon U-Pb dating data of Qunji albite porphyry
| Point | Content (×10−6) | Th/U | Isotope ratio | Isotope age (Ma) | |||||||||||
|---|---|---|---|---|---|---|---|---|---|---|---|---|---|---|---|
| Th | U | 207Pb/206Pb | 1σ | 207Pb/235U | 1σ | 206Pb/238U | 1σ | 207Pb/206Pb | 1σ | 207Pb/235U | 1σ | 206Pb/238U | 1σ | ||
| qj008-1 | 34.23 | 46.83 | 0.73 | 0.0511 | 0.0092 | 0.3410 | 0.0614 | 0.0483 | 0.0037 | 243 | 370 | 298 | 46 | 304 | 23 |
| qj008-2 | 31.50 | 47.45 | 0.66 | 0.0540 | 0.0033 | 0.3485 | 0.0199 | 0.0481 | 0.0010 | 369 | 134 | 304 | 15 | 303 | 6 |
| qj008-3 | 63.51 | 68.82 | 0.92 | 0.0504 | 0.0020 | 0.3338 | 0.0133 | 0.0484 | 0.0008 | 213 | 93 | 292 | 10 | 305 | 5 |
| qj008-4 | 85.59 | 86.79 | 0.99 | 0.0505 | 0.0023 | 0.3383 | 0.0162 | 0.0484 | 0.0008 | 217 | 106 | 296 | 12 | 305 | 5 |
| qj008-5 | 39.31 | 52.79 | 0.74 | 0.0577 | 0.0087 | 0.3859 | 0.0580 | 0.0483 | 0.0030 | 520 | 335 | 331 | 43 | 304 | 19 |
| qj008-6 | 72.14 | 74.38 | 0.97 | 0.0579 | 0.0026 | 0.3837 | 0.0166 | 0.0483 | 0.0007 | 528 | 100 | 330 | 12 | 304 | 5 |
| qj008-7 | 106.19 | 108.10 | 0.98 | 0.0515 | 0.0021 | 0.3472 | 0.0150 | 0.0485 | 0.0009 | 261 | 93 | 303 | 11 | 305 | 5 |
| qj008-8 | 47.28 | 58.19 | 0.81 | 0.0515 | 0.0024 | 0.3360 | 0.0152 | 0.0475 | 0.0008 | 265 | 107 | 294 | 12 | 299 | 5 |
| qj008-9 | 298.14 | 321.35 | 0.93 | 0.0511 | 0.0013 | 0.3439 | 0.0093 | 0.0484 | 0.0005 | 256 | 59 | 300 | 7 | 305 | 3 |
| qj008-10 | 38.53 | 51.60 | 0.75 | 0.0475 | 0.0028 | 0.3177 | 0.0193 | 0.0484 | 0.0009 | 76 | 133 | 280 | 15 | 304 | 6 |
| qj008-11 | 52.86 | 77.61 | 0.68 | 0.0532 | 0.0024 | 0.3550 | 0.0166 | 0.0484 | 0.0008 | 345 | 102 | 308 | 12 | 305 | 5 |
| qj008-12 | 188.40 | 175.57 | 1.07 | 0.0539 | 0.0017 | 0.3498 | 0.0110 | 0.0471 | 0.0006 | 369 | 72 | 305 | 8 | 297 | 4 |
| qj008-13 | 53.31 | 63.27 | 0.84 | 0.0508 | 0.0028 | 0.3352 | 0.0168 | 0.0483 | 0.0009 | 232 | 126 | 294 | 13 | 304 | 5 |
| qj008-14 | 169.84 | 161.10 | 1.05 | 0.0572 | 0.0017 | 0.3690 | 0.0110 | 0.0468 | 0.0007 | 498 | 67 | 319 | 8 | 295 | 4 |
| qj008-15 | 76.40 | 94.12 | 0.81 | 0.0553 | 0.0064 | 0.3669 | 0.0419 | 0.0484 | 0.0024 | 433 | 257 | 317 | 31 | 305 | 15 |
| qj008-16 | 217.89 | 155.97 | 1.40 | 0.0586 | 0.0050 | 0.3953 | 0.0342 | 0.0484 | 0.0018 | 554 | 187 | 338 | 25 | 305 | 11 |
| qj008-17 | 35.91 | 49.05 | 0.73 | 0.0571 | 0.0027 | 0.3906 | 0.0175 | 0.0499 | 0.0010 | 494 | 104 | 335 | 13 | 314 | 6 |
| qj008-18 | 91.10 | 114.84 | 0.79 | 0.0585 | 0.0024 | 0.4107 | 0.0179 | 0.0508 | 0.0008 | 546 | 87 | 349 | 13 | 319 | 5 |

Typical CL images of zircon from the Qunji albite porphyry.

(a) and (b) LA-ICPMS zircon U-Pb age of Qunji albite porphyry.
The concentration of trace elements and the ratio of Ce4+/Ce3+ in zircon samples were meticulously analyzed, and the results are presented in Table A2. This analysis revealed a distinct enrichment of heavy rare earth elements (HREE) and a relative deficit of LREE, resulting in a positive anomaly, while the element Eu exhibited a negative anomaly (as depicted in Figure 14a). The variation range of the Ce4+/Ce3+ ratio and its average are 16.2–93.0 and 37.0, respectively. Furthermore, the whole-rock Zr-saturation temperature calculated by whole-rock Zr content and whole-rock principal composition is 873–919°C, with an average of 903°C (Figure 14b), the high crystallization temperature is also an important characteristic of A-type granites.

(a) Chondrite normalized rare-earth partitioning diagram of zircons from the Qunji albite porphyry and (b) zirconium saturation temperature diagram of the albite porphyry.
The porphyry composition in porphyry was analyzed, and the results showed that the porphyry was mainly albite, with low content of An and Or components, mainly Ab component (Table A3), and the chemical formula was NaAl0.9–1.2Si3.1–3.9O7.9–10.1. The results of the analysis are shown in Table A3. Trace element analysis was carried out on albite porphyry, and the results of the analysis are shown in Table A4. It is noteworthy that the content of trace elements in the Qunji albite porphyry is relatively low, with notable elements including Rb, Sr, Zr, Sn, Ba, La, Ce, Pb, and Ga.
5.2 Characteristics of melt inclusions in zircon
Figure 15 shows the chemical composition analysis of melt inclusions in zircon. It should be indicated that the gas and solid phase composition analysis was carried out by laser Raman spectroscopy and electron probe, respectively. The test results are shown in Table 3.
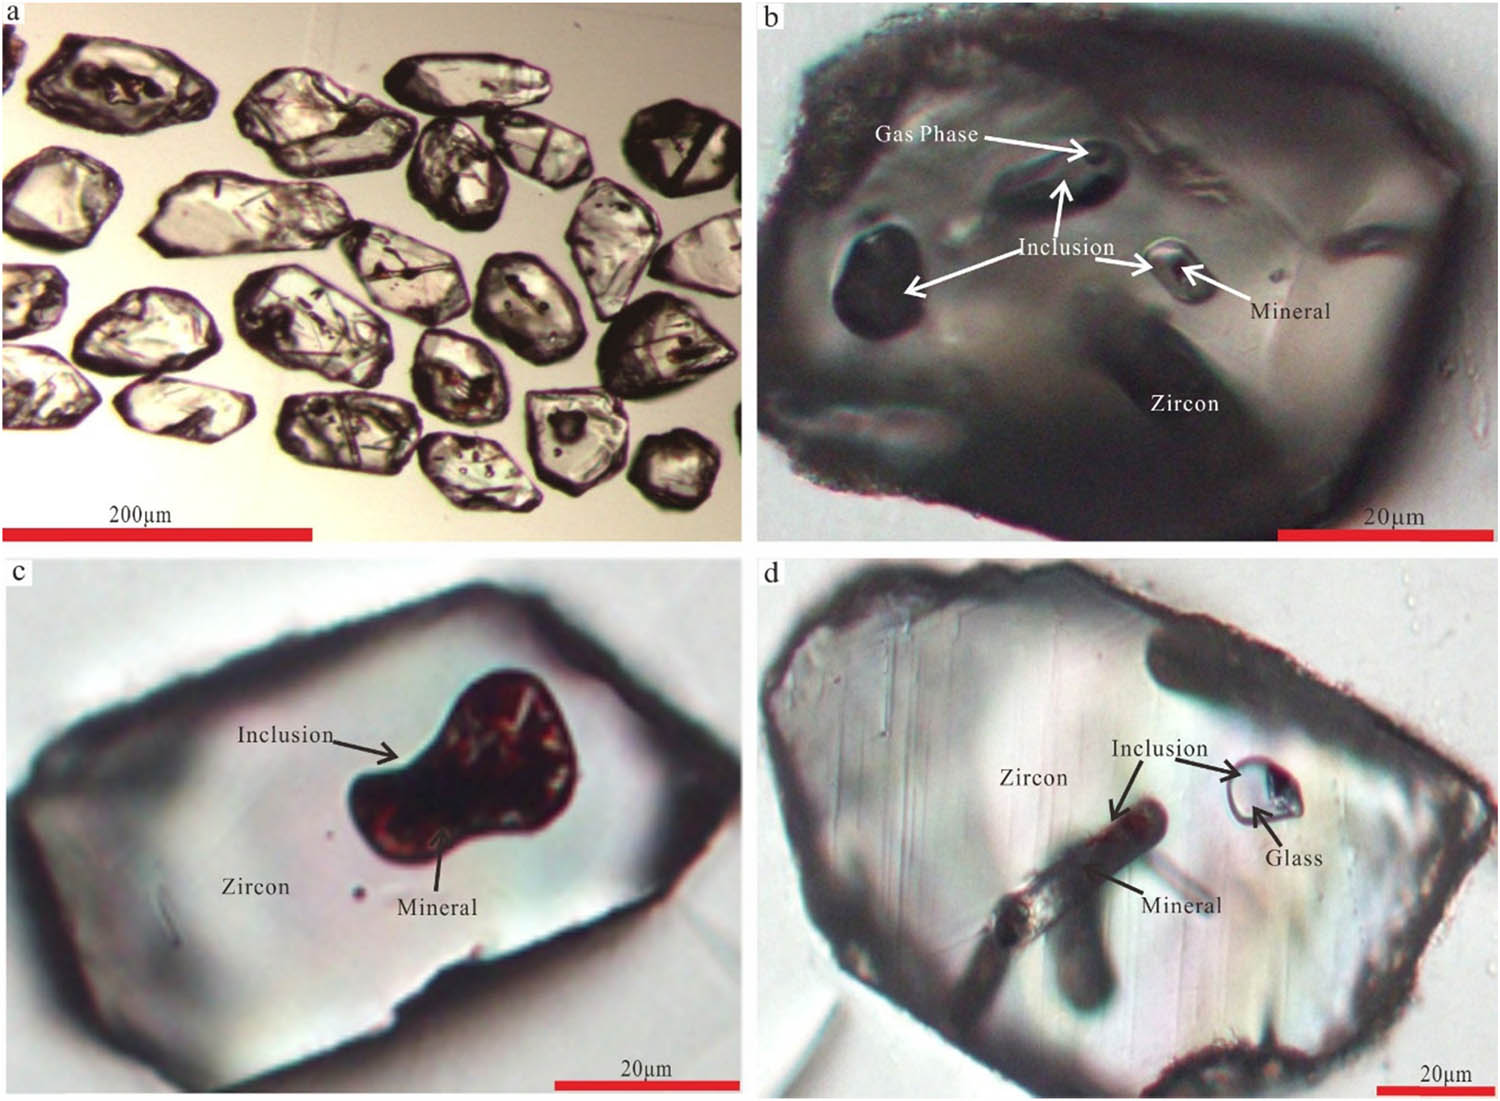
(a) Micrograph of zircon inclusions of Qunji albite porphyry. (b–d) Multiphase inclusions in zircon.
Zircon melt inclusion composition analysis data of Qunji albite porphyry (wt%)
| Inclusion type | Glass | Mineral | |||||||
|---|---|---|---|---|---|---|---|---|---|
| Sample | QJ008-1 | QJ008-1-1 | QJ008-13-1 | Qj008-3-2 | QJ008-19-1 | QJ008-16-1 | Qj008-08-1 | QJ008-05-1 | QJ008-05-2 |
| SiO2 | 74.14 | 76.60 | 74.96 | 72.81 | 68.11 | 56.22 | 0.06 | 0.00 | 1.45 |
| TiO2 | 0.03 | 0.02 | 0.07 | 0.04 | 0.12 | 0.05 | 6.74 | 15.81 | 90.60 |
| Al2O3 | 12.75 | 12.74 | 14.52 | 14.60 | 13.20 | 12.31 | 1.86 | 0.25 | 1.61 |
| FeO | 0.56 | 0.63 | 0.50 | 0.54 | 2.20 | 0.17 | 77.27 | 69.54 | 1.16 |
| MgO | 0.01 | 0.01 | 0.00 | 0.01 | 0.00 | 0.00 | 0.22 | 2.27 | 0.01 |
| MnO | 0.00 | 0.00 | 0.03 | 0.00 | 0.03 | 0.00 | 0.91 | 1.81 | 0.02 |
| K2O | 5.36 | 3.74 | 5.38 | 5.30 | 4.89 | 3.53 | 0.00 | 0.02 | 0.00 |
| Na2O | 4.54 | 0.86 | 4.30 | 4.43 | 5.12 | 7.38 | 0.02 | 0.00 | 0.00 |
| CaO | 0.45 | 0.43 | 0.63 | 0.67 | 0.58 | 1.79 | 0.00 | 0.00 | 0.02 |
| P2O5 | 0.03 | 0.05 | 0.01 | 0.05 | 0.00 | 4.32 | 0.00 | 0.00 | 0.00 |
| NiO | 0.00 | 0.00 | 0.00 | 0.00 | 0.00 | 0.00 | 0.00 | 0.00 | 0.00 |
| SO3 | 0.01 | 0.00 | 0.02 | 0.05 | 0.00 | 0.00 | 0.00 | 0.00 | 0.00 |
| Cl | 0.57 | 0.50 | 0.55 | 0.54 | 0.37 | 0.35 | 0.00 | 0.02 | 0.00 |
| F | 0.00 | 0.00 | 0.01 | 0.00 | 0.00 | 0.06 | 0.00 | 0.00 | 0.00 |
| ZrO2 | 0.00 | 3.43 | 0.30 | 0.11 | 4.78 | 1.76 | 0.01 | 0.05 | 1.90 |
| CuO | 0.00 | 0.03 | 0.02 | 0.01 | 0.00 | 0.05 | 0.00 | 0.06 | 0.00 |
| Total | 98.33 | 98.93 | 101.17 | 99.02 | 99.32 | 87.88 | 87.09 | 89.81 | 96.76 |
As a result, the melt inclusions were not subjected to heating and quenching, and it was assumed that the composition of the melt inclusions accurately represents the composition of the formation melt, in line with previous findings [33]. The obtained results in Figure 16 demonstrate that the Raman spectra of zircon melt inclusions have two peaks at 2,100 and 3,200 cm−1, reflecting the presence of CO, C–H organic matters, and other relatively reduced gases such as CO, and acetylene in the inclusions. Table 3 indicates that the solid glass components of the inclusions are mainly Si, Al, K, and Na, which are similar to those of porphyry. It also shows that the daughter minerals in the inclusions are minerals containing Fe and Ti, which may be Ti-containing magnetite and rutile. Thus, melt inclusions are effective indices to determine the origin of zircon and the physicochemical environment in which it was formed.

Raman diagram of gas composition of zircon melt inclusions of albite porphyry: (a) Peak of zircon inclusions around 2,100 cm−1 and (b) Peaks of zircon inclusions at 2,100 and 3,200 cm−1.
6 Discussion
6.1 Genetic type of zircon
The w(Th)/w(U) value of zircon is often employed as an indicator of its origin, enabling the differentiation between magmatic, metamorphic, and hydrothermal environments, as demonstrated by previous studies [35]. The radius of the Th4+ ion is very close to that of the Zr4+ ion, and their electricity valences are the same. As a result, Th4+ ions can easily penetrate into the zircon structure. Since the neutron radius of U4+ is smaller than the radius of Th4+ ions and close to that of Zr4+, the content of U in zircon is often higher than that of Th [35]. The Th and U contents, along with their zircon ratios, exhibit significant variations across different origins. Generally, the w(Th)/w(U) values of magmatic zircons are >0.4, and the w(Th)/w(U) values of hydrothermal zircons are <0.1 [36,37,38,39]. Combined with the value of w(Th)/w(U) in Table 2, it is inferred that the above 16 kinds of zircons belong to typical magmatic zircons. However, Hidaka et al. [40] found that some typical magmatic zircons have very low w(Th)/w(U) values. Therefore, the host rock types of zircons cannot be distinguished solely based on the w(Th)/w(U) values of zircons. Leng et al. [41] studied the geochemical characteristics of trace elements in zircon and confirmed that the ratio of w(Th)/w(U) mainly reflects the characteristics of the parent or the local chemical environment at the time of formation or even the fluid source region.
Based on (Sm/La)N–La (Figure 17a) and δ(Ce)–(Sm/La)N diagrams (Figure 17b), magmatic zircons from hydrothermal zircons can be detected accurately (data in Table A5). Accordingly, it is concluded that zircons of intrusive rocks in the Qunji mining area are mainly magmatic.

(a) (Sm/La)N–La diagram and (b) δ(Ce)–(Sm/La) N diagram.
6.2 Magma crystallization environment
The trace elements in zircon reflect the crystallization environment of the host rock. The trace element uranium (U) and rare earth elements in zircon are combined to construct U–Yb and U/Yb–Y diagrams, allowing for the identification of zircon with oceanic crust and continental crust origins. This analytical method aids in determining whether zircon crystals precipitated from magma associated with continental or oceanic crust, thereby elucidating the provenance of zircon within intrusive rocks [21]. As depicted in Figure 18, zircon data from 16 distinct types of intrusive rocks in the Qunji mining area have been superimposed onto the U–Pb and U/Yb–Y diagrams. Figure 18 illustrates that all zircon measurement points from 18 types of intrusive rocks in the Qunji mining area fall within the continental crust area, suggesting that the studied zircon crystallization environment is a continental crust environment.

(a) U/Yb–Y diagram and (b) U–Yb diagram.
6.3 Geological significance of the western AMB
The Qunji albite porphyry has an age of 303 ± 3 Ma and exhibits affinities with A-type granite. On the contrary, other porphyries, including the 109 Pluton, have similar compositions and ages [28]. Consequently, it is inferred that these materials were formed under similar tectonic conditions during the late Carboniferous. Typically, A-type magmatism is associated with extensional settings [42]. As a result, it is reasonable to conclude that these rock plutons formed within an extensional environment following tectonic collisions.
The Paleo-Asian Ocean in the Tianshan area had closed during the Carboniferous (316 ± 3 Ma) and entered the post-collision extensional (extensional) stage [43,44]. The formation environment of bimodal volcanic rocks of the Taerdetao Formation in this area may originate from the post-collision extensional (extensional) stage [45]. The Qunji albite porphyry was formed after the closure of the Paleo-Asian Ocean in the Tianshan area. The field geological relationship shows that the ore-bearing porphyries intruded into the volcanic rocks of the Taerdetao Formation so the Qunji ore-bearing porphyries may be formed in the extensional stage after the collision. These results confirm that A-type granites usually form in an extensional environment.
The obtained results indicate that the Qunji albite porphyry has a geochemical affinity for A-type granite, which is an important rock type within the granite classification. Eby [45] introduced a tectonic environment map (Figure 19) for alkaline (A-type) granite types, using criteria such as Rb/Nb–Y/Nb, Nb-Y-3Ga, and Nb–Y–Ce discrimination maps. These elements are characteristic of alkaline (A-type) granite, marked by the enrichment of Nb, Yb, Y, and Ga. In the above diagram, alkaline (A-type) granite samples are divided into two types: A1 and A2. Type A1 belongs to non-orogenic intraplate granites, which are related to continental rift environments, mantle hot spots, or mantle plumes. On the contrary, Type A2 is associated with post-collision or post-orogenic environments, generally near continental margins. According to the location of data points in the figure, it is concluded that the crystalline environment of Qunji albite porphyry is predominantly a continental crust environment. Figure 19a reveals that most of the data points for albite porphyry are distributed in the Rb/Nb–Y/Nb diagram. Meanwhile, Figure 19b and c show that Nb–Y–3Ga and Nb–Y–Ce fall within the A2-type granite area, indicating that the albite formed during the post-collision extension stage.
![Figure 19
Discriminant map of trace element tectonic environment of A-type granite. A1: Non-orogenic intraslab granite; A2: Post-collision or post-orogenic environment [45].](/document/doi/10.1515/geo-2025-0796/asset/graphic/j_geo-2025-0796_fig_019.jpg)
Discriminant map of trace element tectonic environment of A-type granite. A1: Non-orogenic intraslab granite; A2: Post-collision or post-orogenic environment [45].
Zircon is an abundant mineral in granite and is resistant to the physicochemical reaction of hydrothermal fluids in the later stage [46,47,48]. Therefore, zircon trace elements can be used to reflect the oxygen fugacity of magma [16,17,24,49,50,51]. Compared with Ce3+ and Ce4+, the substitution of Zr4+ by zircon and the oxidation of Ce3+ to Ce4+ are facilitated under oxidizing conditions. Therefore, the oxygen fugacity of magma can be determined by the Ce4+/Ce3+ ratio in zircon [15,49,52]. Table A2 and Figure 20 show that this parameter in ore-bearing porphyry in the Qunji area is 16.2–55.0, which is lower than that in Chile (>200), but similar to the Ce4+/Ce3+ value of poor ore-bearing porphyry in Chile. Accordingly, it is inferred that the oxygen fugacity of the Qunji ore-bearing porphyry is relatively low.
![Figure 20
(a) and (b) Schematic diagram of oxygen fugatism of porphyry in the western section of Auwulale metallogenic (Data from [15,28,34]).](/document/doi/10.1515/geo-2025-0796/asset/graphic/j_geo-2025-0796_fig_020.jpg)
The specific values of saturation temperature and oxygen fugacity (logfO2) of Ti zircons can be calculated based on the trace elements in the zircon structure [53,54]. The saturation temperature of Ti zircons of ore-bearing porphyry is 743–828°C, and the oxygen fugacity is −14.2 to −16.1. The comparison of these values with those of the buffer reveals that the oxygen fugacity of Qunji ore-bearing porphyry is mostly below the FMQ line, indicating that the oxygen fugacity is less than ΔFMQ. Accordingly, it can be inferred that the source of this porphyry is deep.
The presence of two peaks in the Raman spectra of zircon melt inclusions indicates the existence of CO, C–H organic matter, and other relatively reduced gases such as CO and acetylene. Meanwhile, the solid glass components in the inclusions are primarily composed of Si, Al, K, and Na, with minerals being Ti-bearing magnetite and rutile. It is worth noting that these materials formed in an environment with low oxygen fugacity, indicating that the ore-bearing porphyry of the Qunji Cu deposit has low oxygen fugacity. Additionally, the term ΔFMQ was estimated following the method proposed by Loucks et al. [50]. The results revealed that ΔFMQ ranges from −0.73 to 3.29 (Table A6). These findings consistently indicate that the oxygen fugacity of Qunji albite porphyry is notably low, which is a significant characteristic for metallogenic potential assessment.
6.4 Zircon characteristics indicate metallogenic potential
In the western AMB, several late Paleozoic porphyritic plutons associated with mineralization can be found, including the Qunjisayi, the 109, the Mosizote plutons, and the Yuntoushan. These plutons have identical alteration and ore assemblages (chalcopyrite–bornite–chalcocite) and lack primary hematite and sulfate minerals [28]. Typically, zircon particles in these plutons display Ce4+/Ce3+ ratios of <200 and fO2 values around ΔFMQ + 2. It is inferred that reduced ore systems widely occur in the western AMB. Given the post-collision extensional environment of the region, it is possible that the asthenospheric mantle is closer to the surface and more likely to penetrate into the lower crust. The asthenospheric mantle is known for having low oxygen fugacity values, which could contribute to the relatively low oxygen fugacity values observed in the melts generated within the extensional setting [55].
Shen et al. [57] showed that in the Cu tonnage of the CAOB porphyry Cu deposit, the ratio of Ce4+/Ce3+ and Eu/Eu* in individual zircon grains gradually decreases. The performed analyses on Qunji, Qunjisayi, and 109 reveals that the lower the Ce4+/Ce3+ and Eu/Eu* (Figure 21), the lower the reserves of Cu deposits. Consequently, in comparison to typical porphyry Cu deposits, the ore-bearing porphyry of the Qunji porphyry Cu deposit exhibits relatively low oxygen fugacity and a poorer metallogenic potential. Furthermore, the characteristics of zircon can effectively serve as indicators of metallogenic potential.
![Figure 21
(a) and (b) Ratios of Ce4+/Ce3+ and Eu/Eu* for individual zircon grains versus the Cu tonnage of porphyry Cu deposits in the CAOB (Data from [57]), Qunji, Qunjisayi, and 109 data points.](/document/doi/10.1515/geo-2025-0796/asset/graphic/j_geo-2025-0796_fig_021.jpg)
(a) and (b) Ratios of Ce4+/Ce3+ and Eu/Eu* for individual zircon grains versus the Cu tonnage of porphyry Cu deposits in the CAOB (Data from [57]), Qunji, Qunjisayi, and 109 data points.
7 Conclusions
The conducted analyses reveal that the Qunji albite porphyry, dated at 303 ± 3 Ma, was formed in an extensional environment following the Late Carboniferous collision. It exhibits metaluminous to peraluminous characteristics with an alkaline composition. Furthermore, it demonstrates the typical traits of an A-type granite and is the result of the remelting of the lower crust that is of recent origin. The Ce4+/Ce3+ ratio of zircon is 16.2, which is significantly lower than that of typical porphyry Cu deposits and ore-bearing porphyry (>200). The zircon crystallization of the intrusion rocks in the Qunji mining area primarily originates from the continental crust. Additionally, the mineral assemblages of the Qunji porphyry Cu deposit are mainly reactive minerals that formed under low oxygen fugacity conditions.
Furthermore, the presence of C–H assemblages of reducing organic matter in the zircon inclusions of Qunji albite porphyry suggests a reductive nature of the ore-forming hydrothermal process. Consequently, it can be inferred that the Qunji Cu deposit qualifies as a reduced porphyry Cu deposit. Compared with the ore-bearing porphyries of typical porphyry Cu deposits, the oxygen fugacity of the Qunji porphyry Cu deposit is relatively low, and the mineralization potential is poor. However, porphyry Cu deposit in the western AMB can explain the Cu mineralization mechanism in the reductive metallogenic system.
Based on the performed analyses and the obtained results, it is concluded that the zircon characteristics reflect the metallogenic potential of porphyry Cu deposits, so they can be used as an accurate indicator in metallogenic investigations.
Acknowledgments
The Sinomate Institute of Materials Research (Guangzhou) Co., Ltd. (SIMR) provided assistance with data explanation, which also indirectly supported this research.
-
Funding information: This study was financially supported by multiple sources. The National Natural Science Foundation of China provided funding under Grant No. 42102076. The Shandong Provincial Natural Science Foundation also contributed to the research with Project No. ZR2021QD037.
-
Author contributions: Methodology, Zhengxi Gao and Yushan Zuo; Zizhen Zhang, Lei Zuo and Rui Liu, writing–review and editing; Ru Liu, funding acquisition. All authors have read and agreed to the published version of the manuscript.
-
Conflict of interest: Authors state no conflict of interest.
-
Data availability statement: The data are available from the corresponding author on reasonable request.
Data of main content (%) and trace elements (×10−6) of Qunji albite porphyry (the data labeled and * is referenced from Liu and Chen [22] and Wang et al. [23], respectively)
| Sample | qj09† | qj09-1† | qj12† | qj13† | QJ02* | QJ09* | QJ10* | QJ11* | QJ13* | QJ14* | QJ15* | QJ19 | QJ20 | QJ21 | QJ22* | QJ26* | QJ28 | QJ32* | QJ008 | QJ100* |
|---|---|---|---|---|---|---|---|---|---|---|---|---|---|---|---|---|---|---|---|---|
| SiO2 | 76.9 | 76.5 | 67.9 | 72.7 | 76.9 | 71.0 | 69.0 | 71.3 | 70.8 | 66.4 | 65.3 | 69.5 | 70.0 | 70.6 | 70.6 | 71.5 | 69.7 | 72.3 | 70.5 | 71.5 |
| TiO2 | 0.41 | 0.38 | 0.57 | 0.42 | 0.42 | 0.51 | 0.53 | 0.53 | 0.53 | 0.61 | 0.54 | 0.35 | 0.35 | 0.50 | 0.49 | 0.51 | 0.53 | 0.42 | 0.52 | 0.49 |
| Al2O3 | 11.7 | 11.6 | 14.4 | 13.7 | 9.8 | 14.7 | 14.6 | 13.5 | 13.0 | 15.6 | 14.1 | 14.0 | 14.3 | 14.3 | 14.2 | 13.7 | 13.5 | 13.2 | 14.0 | 14.5 |
| TFe2O3 | 3.13 | 4.23 | 3.57 | 2.51 | 3.04 | 3.25 | 3.01 | 3.23 | 3.29 | 3.81 | 4.04 | 3.99 | 3.19 | 3.07 | 2.96 | 4.03 | 2.76 | 3.22 | 2.22 | 2.08 |
| Fe2O3 | 2.28 | 2.90 | 3.00 | 2.48 | 1.09 | 1.37 | 0.37 | 0.32 | 0.28 | 0.68 | 1.31 | 1.21 | 1.43 | 0.97 | 1.31 | 1.68 | 0.79 | 1.39 | 0.29 | 0.77 |
| FeO | 1.10 | 1.65 | 0.90 | 0.30 | 1.04 | 0.90 | 1.74 | 1.94 | 2.02 | 1.98 | 1.53 | 1.58 | 0.80 | 1.18 | 1.53 | 1.14 | 1.14 | 0.86 | 1.26 | 0.68 |
| MgO | 0.14 | 0.12 | 0.21 | 0.10 | 0.13 | 0.21 | 0.45 | 0.21 | 0.24 | 0.16 | 0.19 | 0.51 | 0.48 | 0.22 | 0.22 | 0.24 | 0.10 | 0.23 | 0.38 | 0.26 |
| MnO | 0.02 | 0.03 | 0.05 | 0.05 | 0.11 | 0.11 | 0.10 | 0.10 | 0.10 | 0.08 | 0.09 | 0.17 | 0.10 | 0.11 | 0.13 | 0.11 | 0.09 | 0.10 | 0.05 | 0.03 |
| CaO | 0.43 | 0.39 | 2.96 | 1.24 | 0.72 | 0.55 | 0.67 | 0.57 | 0.55 | 0.63 | 1.84 | 0.56 | 0.63 | 1.18 | 1.21 | 0.47 | 0.91 | 0.75 | 0.88 | 0.58 |
| Na2O | 4.70 | 4.52 | 6.68 | 7.92 | 3.23 | 6.66 | 7.16 | 5.27 | 5.37 | 6.96 | 5.49 | 2.99 | 3.07 | 5.99 | 5.33 | 4.92 | 5.22 | 3.98 | 5.19 | 5.69 |
| K2O | 2.88 | 3.05 | 1.98 | 0.13 | 2.79 | 2.66 | 0.94 | 3.02 | 3.25 | 2.70 | 2.99 | 7.00 | 6.92 | 3.43 | 4.27 | 3.38 | 3.24 | 5.27 | 2.75 | 3.72 |
| P2O5 | 0.06 | 0.05 | 0.08 | 0.05 | 0.06 | 0.08 | 0.07 | 0.06 | 0.06 | 0.07 | 0.06 | 0.05 | 0.05 | 0.07 | 0.06 | 0.06 | 0.07 | 0.06 | 0.06 | 0.06 |
| LOI | 0.38 | 0.37 | 2.05 | 1.12 | 0.95 | 0.26 | 1.40 | 0.25 | 0.49 | 0.26 | 0.77 | 0.86 | 1.12 | 0.39 | 0.52 | 0.71 | 0.77 | 0.31 | 1.18 | 0.90 |
| ∑ | 104 | 106 | 104 | 103 | 98.2 | 100 | 97.9 | 98.0 | 97.7 | 97.4 | 95.4 | 100 | 100 | 99.8 | 100 | 99.7 | 96.9 | 99.9 | 97.8 | 99.8 |
| Na2O + K2O | 7.58 | 7.57 | 8.66 | 8.05 | 6.02 | 9.32 | 8.10 | 8.29 | 8.62 | 9.66 | 8.48 | 9.99 | 9.99 | 9.42 | 9.60 | 8.30 | 8.46 | 9.25 | 7.90 | 9.40 |
| (Na2O + K2O)/CaO | 17.7 | 19.3 | 2.93 | 6.49 | 8.36 | 17.0 | 12.09 | 14.5 | 15.7 | 15.3 | 4.61 | 17.8 | 15.9 | 7.98 | 7.93 | 17.7 | 9.30 | 12.3 | 9.98 | 16.2 |
| A/CNK | 1.01 | 1.01 | 0.78 | 0.89 | 1.02 | 0.99 | 1.04 | 1.04 | 0.97 | 1.01 | 0.90 | 1.03 | 1.05 | 0.91 | 0.91 | 1.16 | 1.11 | 1.08 | 1.22 | 1.08 |
| A/NK | 1.08 | 1.08 | 1.09 | 1.04 | 1.18 | 1.07 | 1.14 | 1.13 | 1.05 | 1.09 | 1.15 | 1.12 | 1.14 | 1.05 | 1.06 | 8.30 | 8.46 | 9.25 | 7.90 | 9.40 |
| Mg# | 4.64 | 3.03 | 6.16 | 4.20 | 4.54 | 6.70 | 14.25 | 6.74 | 7.50 | 4.46 | 4.97 | 12.44 | 14.33 | 7.38 | 7.63 | 6.21 | 3.87 | 7.35 | 16.0 | 12.2 |
| TZr(°C) | 917 | 903 | 873 | 898 | 898 | 895 | 913 | 915 | 912 | 917 | 895 | 908 | 911 | 889 | 891 | 918 | 903 | 885 | 919 | 907 |
| F | 289 | 289 | 343 | 329 | 315 | 374 | 391 | 343 | 329 | 374 | 358 | 265 | 308 | 301 | 343 | 315 | ||||
| Cl | 35.8 | 48.3 | 49.7 | 89.1 | 28.6 | 89.1 | 96.4 | 61.4 | 89.1 | 37.3 | 29.3 | 31.0 | 23.6 | 50.2 | 35.8 | 48.3 | ||||
| CIA | 50.2 | 50.3 | 43.7 | 47.1 | 50.4 | 49.8 | 51.0 | 50.9 | 49.3 | 50.2 | 47.5 | 50.8 | 51.1 | 47.6 | 47.7 | 52.0 | 49.4 | 49.2 | 51.7 | 50.0 |
| Li | 6.36 | 5.84 | 3.66 | 4.33 | 10.10 | 3.75 | 8.15 | 6.08 | 9.68 | 3.58 | 4.41 | 6.66 | 6.66 | 6.64 | 5.59 | 7.29 | 5.18 | 6.21 | 11.0 | 9.82 |
| Be | 1.60 | 1.75 | 2.98 | 1.82 | 2.77 | 2.75 | 3.42 | 2.70 | 2.53 | 2.60 | 2.44 | 1.60 | 1.60 | 1.95 | 2.35 | 2.23 | 4.18 | 3.35 | 4.04 | 3.88 |
| Sc | 8.58 | 7.37 | 10.20 | 8.74 | 5.90 | 6.80 | 6.80 | 7.40 | 5.30 | 6.30 | 7.00 | 12.50 | 12.5 | 12.7 | 6.5 | 7.40 | 5.40 | 5.40 | 6.80 | 6.70 |
| V | 15 | 12.5 | 28.8 | 16.7 | 24.6 | 36.3 | 40.1 | 34.6 | 30.5 | 45.5 | 25.3 | 16.3 | 16.3 | 10.9 | 31.7 | 35.6 | 29.3 | 29.1 | 31.2 | 34.5 |
| Cr | 16 | 22.6 | 12.1 | 12.6 | 27.25 | 16.6 | 9.68 | 7.73 | 23.6 | 6.36 | 11 | 16.7 | 16.7 | 1.93 | 29.9 | 5.37 | 16.5 | 21.2 | 0.34 | 1.47 |
| Co | 1.56 | 2.64 | 2.58 | 1.79 | 2.77 | 3.12 | 2.34 | 1.78 | 1.62 | 1.15 | 1.87 | 2.88 | 2.88 | 2.40 | 1.85 | 1.68 | 2.15 | 3.04 | 1.76 | 1.86 |
| Ni | 2.80 | 7.91 | 4.36 | 1.91 | 2.93 | 2.65 | 2.00 | 2.01 | 2.28 | 1.91 | 1.33 | 1.70 | 1.70 | 0.35 | 1.88 | 1.99 | 1.60 | 2.48 | 0.57 | 0.74 |
| Cu | 3,325 | 2,059 | 547 | 1,158 | 10,087 | 9.59 | 18,261 | 11,479 | 18,957 | 15,479 | 14,609 | 258.00 | 258 | 136 | 621 | 3,304 | 5,913 | 43.80 | 6,609 | 1,565 |
| Zn | 13.0 | 9.83 | 26.5 | 11.1 | 22.7 | 36.7 | 43.9 | 26.8 | 15.6 | 19.3 | 18 | 53.2 | 53.2 | 57.5 | 14.3 | 20.2 | 17.2 | 47.4 | 33.3 | 18.6 |
| Ga | 14.2 | 13.8 | 21.2 | 17.6 | 11.2 | 17.8 | 19.7 | 15.8 | 15.2 | 17.7 | 14.2 | 17.2 | 17.2 | 18 | 16.4 | 16.6 | 15.0 | 13.9 | 17.0 | 16.2 |
| Rb | 58.8 | 62.2 | 45 | 2.75 | 72.9 | 52.9 | 26.9 | 66.1 | 69.8 | 57.3 | 56.9 | 197 | 197 | 192 | 68.2 | 71.7 | 65.8 | 114 | 57.2 | 69.9 |
| Sr | 32.3 | 30.2 | 74.4 | 38.2 | 44.2 | 71 | 89.1 | 60 | 43.3 | 41.9 | 40.4 | 38.6 | 38.6 | 40.3 | 27.4 | 35.6 | 47.0 | 49.7 | 61.5 | 49.7 |
| Y | 38.5 | 33.9 | 56.5 | 41.4 | 91.4 | 40.8 | 41.6 | 21.2 | 27.4 | 32.8 | 40.0 | 49.9 | 49.9 | 47.1 | 37.8 | 20.7 | 32.9 | 41.8 | 38.4 | 36.2 |
| Nb | 17.1 | 15.2 | 22.6 | 19.3 | 57.7 | 21.3 | 22.3 | 23.3 | 23.5 | 26.9 | 25.0 | 13.9 | 13.9 | 13.5 | 25.1 | 24.4 | 23.8 | 23.6 | 22.6 | 24.0 |
| Mo | 1.59 | 2.25 | 0.94 | 0.64 | 1.64 | 2.21 | 1.94 | 2.39 | 1.54 | 2.36 | 0.89 | 1.31 | 1.31 | 1.06 | 2.65 | 2.02 | 1.36 | 2.10 | 1.90 | 1.85 |
| Cd | 0.13 | 0.10 | 0.04 | 0.07 | 0.04 | 0.02 | 0.11 | 0.11 | 0.23 | 0.06 | 0.15 | 0.03 | 0.030 | 0.032 | 0.038 | 0.10 | 0.03 | 0.06 | 0.10 | 0.04 |
| In | 0.04 | 0.03 | 0.08 | 0.02 | 0.04 | 0.05 | 0.12 | 0.05 | 0.05 | 0.06 | 0.10 | 0.09 | 0.09 | 0.16 | 0.06 | 0.05 | 0.06 | 0.05 | 0.05 | 0.04 |
| Sb | 0.54 | 0.86 | 1.11 | 0.39 | 0.54 | 0.71 | 0.42 | 0.41 | 0.48 | 0.45 | 0.50 | 0.28 | 0.28 | 0.21 | 0.56 | 0.42 | 0.42 | 0.82 | 0.30 | 0.38 |
| Cs | 0.51 | 0.51 | 0.73 | 0.16 | 0.83 | 0.61 | 0.30 | 0.43 | 0.44 | 0.28 | 0.43 | 1.00 | 1.00 | 1.02 | 0.40 | 0.48 | 0.38 | 1.10 | 0.41 | 0.51 |
| Ba | 245 | 266 | 201 | 16.7 | 337 | 261 | 158 | 355 | 316 | 241 | 232 | 557 | 557 | 544 | 241 | 316 | 303 | 523 | 294 | 331 |
| La | 28.7 | 24.5 | 47.7 | 11.5 | 33.6 | 23.0 | 63.6 | 20.9 | 54.0 | 27.7 | 16.4 | 10.8 | 10.8 | 21.8 | 51.7 | 33.6 | 15.9 | 18.6 | 17.2 | 31.9 |
| Ce | 64.5 | 55.0 | 103.0 | 38.6 | 68.4 | 53.2 | 98.2 | 42.0 | 104.0 | 49.0 | 40.8 | 28.3 | 28.3 | 57.2 | 87.3 | 67.4 | 41.5 | 36.7 | 41.9 | 72.2 |
| Pr | 7.51 | 6.89 | 11.80 | 6.50 | 11.30 | 7.01 | 11.66 | 5.30 | 11.5 | 6.43 | 5.50 | 3.15 | 3.15 | 6.44 | 11.0 | 7.88 | 6.51 | 5.26 | 6.01 | 9.44 |
| Nd | 29.2 | 24.5 | 42.6 | 26.6 | 50.5 | 27.9 | 40.9 | 19.4 | 41.1 | 24.1 | 22.4 | 14.6 | 14.6 | 26.7 | 41.3 | 26.8 | 28.1 | 21.8 | 25.0 | 36.7 |
| Sm | 5.52 | 4.82 | 8.29 | 6.59 | 12.49 | 5.61 | 6.49 | 4.13 | 7.04 | 5.40 | 4.82 | 4.92 | 4.92 | 6.33 | 7.34 | 4.85 | 6.18 | 5.08 | 6.13 | 7.05 |
| Eu | 0.82 | 0.74 | 1.34 | 0.90 | 2.21 | 0.86 | 1.17 | 0.80 | 1.29 | 1.13 | 0.93 | 1.10 | 1.10 | 0.93 | 1.53 | 0.92 | 1.21 | 0.65 | 1.29 | 1.39 |
| Gd | 4.84 | 4.40 | 7.32 | 5.40 | 11.10 | 5.28 | 6.19 | 3.40 | 5.99 | 4.91 | 4.61 | 5.70 | 5.70 | 6.16 | 6.61 | 4.11 | 5.29 | 4.91 | 5.32 | 6.19 |
| Tb | 1.00 | 0.90 | 1.58 | 1.02 | 2.17 | 1.01 | 1.03 | 0.64 | 0.91 | 0.88 | 0.88 | 1.20 | 1.20 | 1.24 | 1.09 | 0.63 | 0.97 | 1.00 | 1.04 | 1.02 |
| Dy | 5.89 | 5.52 | 9.79 | 6.03 | 14.47 | 6.72 | 6.55 | 4.04 | 5.23 | 5.70 | 5.90 | 8.46 | 8.46 | 8.18 | 6.71 | 3.84 | 6.01 | 6.85 | 6.54 | 6.27 |
| Ho | 1.27 | 1.07 | 1.80 | 1.37 | 3.17 | 1.41 | 1.36 | 0.81 | 0.95 | 1.16 | 1.26 | 1.76 | 1.76 | 1.68 | 1.29 | 0.76 | 1.20 | 1.46 | 1.30 | 1.26 |
| Er | 4.35 | 3.87 | 6.00 | 4.89 | 10.44 | 4.42 | 4.37 | 2.61 | 2.95 | 3.68 | 3.97 | 5.41 | 5.41 | 5.34 | 4.07 | 2.53 | 3.82 | 4.54 | 3.97 | 3.97 |
| Tm | 0.79 | 0.63 | 0.97 | 0.89 | 1.97 | 0.84 | 0.80 | 0.50 | 0.53 | 0.73 | 0.74 | 0.96 | 0.96 | 0.98 | 0.74 | 0.51 | 0.70 | 0.87 | 0.75 | 0.76 |
| Yb | 5.33 | 4.80 | 6.66 | 6.42 | 13.51 | 5.47 | 5.34 | 3.27 | 3.50 | 4.93 | 4.95 | 6.25 | 6.25 | 6.28 | 4.88 | 3.53 | 4.57 | 5.69 | 4.88 | 5.02 |
| Lu | 0.84 | 0.75 | 0.95 | 1.00 | 2.32 | 0.96 | 0.94 | 0.58 | 0.64 | 0.90 | 0.87 | 1.11 | 1.11 | 1.13 | 0.86 | 0.66 | 0.80 | 1.03 | 0.84 | 0.88 |
| Ta | 1.28 | 1.13 | 1.68 | 1.50 | 4.36 | 1.57 | 1.62 | 1.53 | 1.53 | 1.82 | 1.66 | 1.01 | 1.01 | 0.99 | 1.54 | 1.63 | 1.63 | 1.69 | 1.54 | 1.64 |
| W | 1.22 | 1.12 | 1.16 | 0.94 | 1.37 | 1.31 | 1.02 | 0.84 | 1.13 | 1.93 | 1.28 | 0.85 | 0.85 | 1.16 | 1.67 | 0.86 | 0.86 | 1.31 | 0.85 | 1.12 |
| Tl | 0.23 | 0.29 | 0.18 | 0.02 | 0.27 | 0.23 | 0.10 | 0.25 | 0.26 | 0.20 | 0.24 | 0.39 | 0.39 | 0.41 | 0.24 | 0.30 | 0.26 | 0.43 | 0.24 | 0.32 |
| Pb | 3.25 | 3.34 | 9.58 | 3.37 | 4.49 | 2.96 | 7.57 | 1.24 | 7.30 | 3.31 | 4.77 | 4.74 | 4.74 | 3.21 | 4.45 | 1.54 | 1.69 | 5.83 | 9.95 | 1.94 |
| Bi | 0.34 | 0.24 | 0.15 | 0.32 | 0.70 | 0.05 | 0.91 | 0.08 | 0.50 | 1.25 | 0.94 | 0.12 | 0.12 | 0.18 | 0.04 | 0.10 | 0.05 | 0.09 | 0.19 | 0.02 |
| Th | 14.40 | 12.90 | 16.60 | 18.40 | 14.40 | 12.30 | 8.30 | 6.70 | 7.53 | 9.67 | 8.25 | 12.60 | 12.6 | 14.5 | 10.9 | 6.46 | 10.00 | 20.30 | 20.30 | 7.78 |
| U | 5.91 | 3.95 | 5.37 | 3.30 | 4.23 | 2.63 | 1.88 | 1.35 | 1.40 | 1.92 | 1.47 | 2.63 | 2.63 | 4.65 | 1.69 | 1.54 | 1.66 | 5.39 | 3.82 | 1.51 |
| Zr | 602 | 532 | 693 | 651 | 468 | 559 | 621 | 609 | 640 | 707 | 653 | 589 | 589 | 598 | 592 | 591 | 588 | 495 | 614 | 604 |
| Hf | 14.8 | 12.9 | 17.6 | 16.9 | 13.7 | 15.0 | 17.6 | 16.9 | 17.8 | 18.9 | 18.1 | 16.1 | 16.1 | 16.4 | 16.0 | 16.1 | 16.1 | 13.4 | 16.9 | 16.3 |
| ΣREE | 161 | 138 | 250 | 118 | 238 | 144 | 249 | 108 | 240 | 137 | 114 | 93.7 | 16.4 | 16.0 | 16.4 | 158 | 123 | 114 | 122 | 184 |
| (La/Yb)N | 3.63 | 3.43 | 4.83 | 1.21 | 1.67 | 2.84 | 8.01 | 4.33 | 15.9 | 22.4 | 22.5 | 28.4 | 150.4 | 226 | 207 | 16.0 | 20.8 | 25.9 | 22.2 | 22.8 |
| 10000Ga/Al | 2.28 | 2.25 | 2.78 | 2.42 | 2.15 | 2.28 | 2.55 | 2.22 | 2.21 | 2.14 | 1.90 | 2.33 | 28.50 | 22.20 | 22.0 | 2.29 | 2.11 | 1.99 | 2.29 | 2.11 |
| Zr + Nb + Ce + Y | 722 | 636 | 875 | 750 | 686 | 674 | 783 | 695 | 795 | 816 | 759 | 681 | 716 | 742 | 745 | 704 | 686 | 597 | 717 | 736 |
Note: A/CNK = Al2O3/(CaO + Na2O + K2O); A/NK = Al2O3/(Na2O + K2O); Mg# = 100MgO/(MgO + FeO); (La/Yb)N is chondrite normalized values (Sun and Mcdonough, 1989); TZr is zircon Hf saturation temperature5.2 Zircon U–Pb ages.
Trace element analysis of zircon in long porphyry of Qunji albite porphyry (×10−6)
| Sample | QJ008-1 | QJ008-2 | QJ008-3 | QJ008-4 | QJ008-5 | QJ008-6 | QJ008-7 | QJ008-8 | QJ008-9 | QJ008-10 | QJ008-11 | QJ008-12 | QJ008-13 | QJ008-14 | QJ008-15 | QJ008-16 |
|---|---|---|---|---|---|---|---|---|---|---|---|---|---|---|---|---|
| ZrO2(%) | 54.17 | 54.43 | 55.81 | 55.58 | 54.23 | 53.95 | 57.62 | 54.20 | 54.95 | 56.66 | 55.26 | 53.49 | 55.77 | 56.95 | 57.10 | 57.45 |
| P | 256.65 | 301.43 | 1188.21 | 393.30 | 318.15 | 780.39 | 305.21 | 300.54 | 399.90 | 273.23 | 398.06 | 1379.55 | 300.33 | 1687.28 | 256.98 | 1214.71 |
| Ti | 17.22 | 21.13 | 24.41 | 17.86 | 18.63 | 20.73 | 15.14 | 18.35 | 10.23 | 19.39 | 24.82 | 13.79 | 17.28 | 19.96 | 20.81 | 13.04 |
| Y | 663.74 | 655.03 | 1127.78 | 1383.65 | 623.78 | 1187.25 | 1393.14 | 898.01 | 1935.20 | 698.37 | 1002.99 | 2085.46 | 1012.60 | 1826.83 | 538.96 | 1277.09 |
| Nb | 0.73 | 0.73 | 1.00 | 0.84 | 0.68 | 0.98 | 0.85 | 0.79 | 2.08 | 0.68 | 1.41 | 1.81 | 0.79 | 1.66 | 0.67 | 1.25 |
| La | 0.01 | 0.03 | 10.74 | 1.15 | 0.01 | 3.77 | 0.06 | 0.00 | 0.03 | 0.04 | 0.08 | 13.86 | 0.04 | 22.95 | 0.21 | 4.90 |
| Ce | 7.71 | 7.44 | 35.13 | 13.85 | 8.70 | 19.91 | 12.68 | 8.43 | 21.13 | 8.31 | 9.93 | 48.58 | 8.94 | 71.18 | 8.72 | 24.20 |
| Pr | 0.06 | 0.06 | 3.25 | 0.64 | 0.06 | 1.26 | 0.28 | 0.13 | 0.27 | 0.10 | 0.13 | 4.61 | 0.19 | 7.21 | 0.09 | 1.74 |
| Nd | 1.34 | 1.41 | 17.19 | 6.03 | 1.18 | 8.36 | 4.67 | 2.39 | 4.40 | 1.60 | 2.07 | 24.25 | 3.04 | 35.33 | 1.02 | 9.14 |
| Sm | 2.58 | 2.38 | 7.18 | 7.40 | 2.18 | 6.30 | 7.48 | 4.34 | 7.82 | 2.94 | 3.61 | 13.56 | 5.08 | 14.18 | 1.79 | 6.51 |
| Eu | 0.75 | 0.78 | 2.17 | 1.99 | 0.74 | 2.05 | 1.78 | 1.17 | 1.02 | 0.85 | 1.18 | 2.61 | 1.41 | 2.18 | 0.56 | 1.29 |
| Gd | 13.74 | 14.07 | 26.76 | 33.78 | 12.30 | 29.25 | 34.60 | 21.12 | 41.10 | 14.97 | 18.91 | 52.52 | 23.47 | 49.67 | 10.54 | 28.74 |
| Tb | 4.65 | 4.67 | 8.35 | 10.98 | 4.44 | 9.39 | 11.35 | 7.20 | 14.33 | 4.99 | 6.59 | 17.12 | 7.87 | 15.28 | 3.62 | 9.59 |
| Dy | 56.65 | 56.39 | 97.13 | 127.05 | 53.63 | 107.53 | 128.88 | 80.41 | 171.45 | 60.63 | 81.68 | 194.68 | 90.64 | 173.24 | 45.53 | 115.07 |
| Ho | 22.42 | 21.90 | 38.31 | 48.30 | 20.92 | 41.07 | 48.56 | 30.88 | 66.37 | 23.50 | 33.42 | 73.36 | 34.99 | 64.21 | 18.02 | 44.14 |
| Er | 102.74 | 102.96 | 175.22 | 212.12 | 97.18 | 181.68 | 216.05 | 139.51 | 301.16 | 109.20 | 160.29 | 322.41 | 156.00 | 282.61 | 85.32 | 202.54 |
| Tm | 22.32 | 22.28 | 36.88 | 43.54 | 21.01 | 37.34 | 44.15 | 29.12 | 63.03 | 23.31 | 35.06 | 66.88 | 32.49 | 57.71 | 18.56 | 42.84 |
| Yb | 208.21 | 213.48 | 341.65 | 391.59 | 198.61 | 340.68 | 398.40 | 268.27 | 575.51 | 216.07 | 333.76 | 599.91 | 299.00 | 512.63 | 176.99 | 397.32 |
| Lu | 45.22 | 46.56 | 74.28 | 81.58 | 42.75 | 72.00 | 81.95 | 57.51 | 119.62 | 46.51 | 74.29 | 123.82 | 63.41 | 106.68 | 37.98 | 83.68 |
| Hf | 6964.84 | 6813.70 | 6491.04 | 7051.36 | 6979.46 | 6485.51 | 7533.66 | 6736.71 | 8275.99 | 7233.43 | 6635.32 | 6732.54 | 7085.85 | 7398.15 | 7692.35 | 7836.33 |
| Ta | 0.31 | 0.35 | 0.38 | 0.39 | 0.29 | 0.36 | 0.38 | 0.35 | 0.90 | 0.31 | 0.46 | 0.58 | 0.38 | 0.57 | 0.29 | 0.52 |
| Th | 34.23 | 31.50 | 63.51 | 85.59 | 39.31 | 72.14 | 106.19 | 47.28 | 298.14 | 38.53 | 52.86 | 188.40 | 53.31 | 169.84 | 35.91 | 91.10 |
| Eu/Eu* | 0.31 | 0.32 | 0.42 | 0.32 | 0.34 | 0.38 | 0.28 | 0.31 | 0.14 | 0.32 | 0.35 | 0.26 | 0.33 | 0.23 | 0.31 | 0.24 |
| Ce4+/Ce3+ | 47.32 | 55.00 | 47.85 | 18.17 | 70.16 | 32.71 | 16.23 | 22.92 | 36.77 | 40.32 | 51.48 | 30.02 | 19.44 | 35.38 | 24.21 | 43.72 |
| log(ƒO2) (zircon) | −8.94 | −11.10 | −22.95 | −20.59 | −7.84 | −22.07 | −14.50 | −8.32 | −12.95 | −12.29 | −12.38 | −25.41 | −13.54 | −24.12 | −14.64 | −24.49 |
| TTi | 791.20 | 811.36 | 826.07 | 794.74 | 798.88 | 809.45 | 778.89 | 797.40 | 743.07 | 802.79 | 827.81 | 770.08 | 791.50 | 805.69 | 809.82 | 764.92 |
Chemical composition of phenocryst of the Qunji albite porphyry (wt%)
| Sample | QJ13-1 | QJ13-2 | QJ13-3 | QJ13-4 | QJ13-5 | QJ13-6 | QI15-1 | QJ15-2 | QJ15-3 | QJ15-6 | QJ15-9 | QJ15-10 | QJ15-11 | QJ15-12 | QJ15-13 | QJ26-1 | QJ26-2 | QJ26-3 | QJ26-4 | Matrix |
|---|---|---|---|---|---|---|---|---|---|---|---|---|---|---|---|---|---|---|---|---|
| SiO2 | 69.02 | 68.62 | 69.30 | 69.90 | 69.82 | 69.80 | 67.46 | 68.92 | 69.07 | 69.22 | 68.69 | 98.63 | 68.33 | 68.73 | 69.20 | 68.64 | 68.95 | 69.70 | 69.64 | 64.77 |
| TiO2 | 0.00 | 0.00 | 0.00 | 0.01 | 0.01 | 0.00 | 0.00 | 0.00 | 0.01 | 0.00 | 0.00 | 0.00 | 0.00 | 0.00 | 0.00 | 0.02 | 0.01 | 0.00 | 0.01 | 0.01 |
| Al2O3 | 20.30 | 19.78 | 20.07 | 19.84 | 20.27 | 20.10 | 20.08 | 20.16 | 20.28 | 20.21 | 20.17 | 0.58 | 20.03 | 20.07 | 20.15 | 20.10 | 20.03 | 19.82 | 20.17 | 17.83 |
| FeO | 0.30 | 1.06 | 0.30 | 0.21 | 0.06 | 0.17 | 0.00 | 0.01 | 0.24 | 0.48 | 0.00 | 0.02 | 0.02 | 0.14 | 0.10 | 0.41 | 0.60 | 0.05 | 0.08 | 0.44 |
| MgO | 0.01 | 0.03 | 0.00 | 0.01 | 0.00 | 0.01 | 0.00 | 0.00 | 0.01 | 0.00 | 0.00 | 0.00 | 0.00 | 0.00 | 0.00 | 0.01 | 0.03 | 0.00 | 0.00 | 0.02 |
| MnO | 0.01 | 0.00 | 0.01 | 0.00 | 0.02 | 0.01 | 0.01 | 0.00 | 0.01 | 0.02 | 0.01 | 0.01 | 0.01 | 0.01 | 0.04 | 0.01 | 0.02 | 0.01 | 0.02 | 0.00 |
| CaO | 0.13 | 0.07 | 0.12 | 0.05 | 0.09 | 0.09 | 0.03 | 0.01 | 0.07 | 0.04 | 0.04 | 0.07 | 0.09 | 0.04 | 0.02 | 0.12 | 0.08 | 0.04 | 0.12 | 0.02 |
| Na2O | 8.51 | 9.27 | 9.96 | 9.08 | 9.37 | 9.46 | 11.73 | 11.56 | 9.12 | 9.84 | 11.92 | 0.02 | 11.51 | 11.67 | 11.36 | 8.50 | 9.37 | 10.31 | 9.21 | 0.22 |
| K2O | 0.07 | 0.10 | 0.10 | 0.21 | 0.15 | 0.14 | 0.04 | 0.03 | 0.06 | 0.03 | 0.05 | 0.05 | 0.00 | 0.04 | 0.01 | 0.23 | 0.11 | 0.07 | 0.07 | 16.10 |
| P2O5 | 0.00 | 0.00 | 0.00 | 0.00 | 0.00 | 0.00 | 0.00 | 0.00 | 0.00 | 0.00 | 0.00 | 0.00 | 0.00 | 0.00 | 0.00 | 0.00 | 0.00 | 0.00 | 0.00 | 0.00 |
| Total | 98.35 | 98.93 | 99.86 | 99.31 | 99.78 | 99.78 | 99.35 | 100.69 | 98.87 | 99.84 | 100.88 | 99.37 | 99.99 | 100.70 | 100.88 | 98.04 | 99.19 | 99.99 | 99.32 | 99.40 |
| Si | 12.10 | 12.05 | 12.04 | 12.15 | 12.09 | 12.10 | 11.87 | 11.94 | 12.07 | 12.03 | 11.90 | 15.91 | 11.93 | 11.93 | 11.96 | 12.09 | 12.05 | 12.09 | 12.10 | |
| Ti | 0.00 | 0.00 | 0.00 | 0.00 | 0.00 | 0.00 | 0.00 | 0.00 | 0.00 | 0.00 | 0.00 | 0.00 | 0.00 | 0.00 | 0.00 | 0.00 | 0.00 | 0.00 | 0.00 | |
| Al | 4.19 | 4.09 | 4.11 | 4.07 | 4.14 | 4.11 | 4.16 | 4.12 | 4.18 | 4.14 | 4.12 | 0.11 | 4.12 | 4.10 | 4.10 | 4.17 | 4.13 | 4.05 | 4.13 | |
| Fe2+ | 0.04 | 0.16 | 0.04 | 0.03 | 0.01 | 0.03 | 0.00 | 0.00 | 0.03 | 0.07 | 0.00 | 0.00 | 0.00 | 0.02 | 0.02 | 0.06 | 0.09 | 0.01 | 0.01 | |
| Mg | 0.00 | 0.00 | 0.00 | 0.00 | 0.00 | 0.00 | 0.00 | 0.00 | 0.00 | 0.00 | 0.00 | 0.00 | 0.00 | 0.00 | 0.00 | 0.00 | 0.00 | 0.00 | 0.00 | |
| Mn | 0.00 | 0.00 | 0.00 | 0.00 | 0.00 | 0.00 | 0.00 | 0.00 | 0.00 | 0.00 | 0.00 | 0.00 | 0.00 | 0.00 | 0.00 | 0.00 | 0.00 | 0.00 | 0.00 | |
| Ca | 0.02 | 0.01 | 0.02 | 0.01 | 0.02 | 0.02 | 0.01 | 0.00 | 0.01 | 0.01 | 0.01 | 0.01 | 0.02 | 0.01 | 0.00 | 0.02 | 0.01 | 0.01 | 0.02 | |
| Na | 2.89 | 3.15 | 3.36 | 3.06 | 3.15 | 3.18 | 4.00 | 3.88 | 3.09 | 3.32 | 4.00 | 0.01 | 3.89 | 3.92 | 3.80 | 2.90 | 3.17 | 3.46 | 3.10 | |
| K | 0.01 | 0.02 | 0.02 | 0.05 | 0.03 | 0.03 | 0.01 | 0.01 | 0.01 | 0.01 | 0.01 | 0.01 | 0.00 | 0.01 | 0.00 | 0.05 | 0.02 | 0.02 | 0.02 | |
| Total | 19.25 | 19.48 | 19.59 | 19.37 | 19.44 | 19.47 | 20.05 | 19.95 | 19.39 | 19.58 | 20.04 | 16.05 | 19.96 | 19.99 | 19.89 | 19.29 | 19.47 | 19.64 | 19.38 | |
| An | 0.85 | 0.42 | 0.63 | 0.32 | 0.50 | 0.51 | 0.15 | 0.05 | 0.39 | 0.24 | 0.20 | 41.36 | 0.41 | 0.20 | 0.09 | 0.78 | 0.47 | 0.21 | 0.72 | |
| Ab | 99.48 | 99.24 | 99.33 | 98.47 | 98.99 | 99.04 | 99.80 | 99.85 | 99.54 | 99.80 | 99.75 | 38.96 | 100.00 | 99.80 | 99.93 | 98.20 | 99.20 | 99.54 | 99.48 | |
| Or | 0.08 | 0.11 | 0.12 | 0.24 | 0.16 | 0.16 | 0.04 | 0.03 | 0.07 | 0.03 | 0.05 | 0.06 | 0.00 | 0.04 | 0.01 | 0.27 | 0.12 | 0.08 | 0.08 |
Trace element analysis data of albite in Qunji albite porphyry (×10−6)
| Sample | AQJ-1 | AQJ-2 | AQJ-3 | AQJ-4 | AQJ-5 | AQJ-6 | AQJ-7 | AQJ-8 | AQJ-9 | AQJ-10 |
|---|---|---|---|---|---|---|---|---|---|---|
| Ba | 93.03 | 36.78 | 42.50 | 55.49 | 35.84 | 61.13 | 36.92 | 47.12 | 33.00 | 39.74 |
| Sn | 2.63 | 2.10 | 2.57 | 2.72 | 2.75 | 1.83 | 2.08 | 2.51 | 1.32 | 4.79 |
| Rb | 15.71 | 13.72 | 11.22 | 6.40 | 12.85 | 16.79 | 8.79 | 22.10 | 10.41 | 15.87 |
| Sr | 90.86 | 63.82 | 100.90 | 76.07 | 64.12 | 96.60 | 60.65 | 82.68 | 73.41 | 54.27 |
| Ga | 18.51 | 20.85 | 17.19 | 18.85 | 16.91 | 18.05 | 17.34 | 19.17 | 16.67 | 18.24 |
| P | 209.63 | 142.06 | 0.00 | 0.00 | 1114.05 | 129.82 | 37.48 | 67.42 | 36.94 | 29.46 |
| Cr | 12.36 | 8.59 | 2.36 | 2.14 | 5.37 | 8.70 | 0.79 | 0.69 | 1.25 | 0.41 |
| Mn | 90.95 | 62.83 | 64.85 | 117.61 | 82.36 | 54.54 | 82.53 | 63.67 | 61.65 | 71.33 |
| Fe | 4832.14 | 2381.70 | 2518.65 | 1160.65 | 1573.09 | 1682.12 | 2396.95 | 2148.96 | 1327.22 | 1923.36 |
| Ge | 0.77 | 0.51 | 0.51 | 0.00 | 0.54 | 0.85 | 1.07 | 0.30 | 0.21 | 0.49 |
| Ti | 92.95 | 60.30 | 84.30 | 240.42 | 346.22 | 28.43 | 204.40 | 79.67 | 32.59 | 2405.51 |
| V | 2.51 | 1.49 | 0.91 | 0.33 | 0.72 | 0.58 | 1.58 | 1.46 | 0.46 | 7.43 |
| Y | 0.48 | 0.38 | 0.23 | 0.38 | 5.47 | 0.06 | 0.25 | 0.08 | 0.05 | 2.43 |
| Zr | 6.07 | 5.39 | 4.17 | 1.24 | 2.80 | 2.72 | 1.87 | 4.11 | 1.00 | 6.21 |
| Nb | 0.10 | 0.05 | 0.05 | 0.06 | 0.07 | 0.04 | 0.06 | 0.02 | 0.01 | 1.15 |
| Sb | 0.25 | 0.08 | 0.00 | 0.36 | 0.30 | 0.20 | 0.34 | 0.41 | 0.08 | 0.18 |
| Cs | 0.96 | 0.74 | 0.42 | 0.39 | 0.70 | 1.00 | 0.45 | 1.98 | 0.64 | 0.36 |
| La | 1.53 | 1.36 | 0.53 | 1.42 | 13.32 | 0.40 | 1.09 | 0.28 | 0.16 | 0.44 |
| Ce | 1.56 | 1.33 | 0.53 | 1.20 | 21.71 | 0.63 | 0.59 | 0.28 | 0.20 | 1.23 |
| Pr | 0.14 | 0.11 | 0.02 | 0.10 | 2.62 | 0.05 | 0.04 | 0.04 | 0.02 | 0.21 |
| Nd | 0.48 | 0.60 | 0.21 | 0.20 | 13.06 | 0.18 | 0.11 | 0.15 | 0.11 | 1.03 |
| Sm | 0.09 | 0.00 | 0.04 | 0.15 | 3.19 | 0.00 | 0.05 | 0.05 | 0.04 | 0.63 |
| Eu | 0.15 | 0.08 | 0.05 | 0.19 | 6.90 | 0.07 | 0.02 | 0.08 | 0.03 | 0.88 |
| Gd | 0.04 | 0.02 | 0.03 | 0.04 | 2.63 | 0.00 | 0.00 | 0.05 | 0.01 | 0.63 |
| Tb | 0.03 | 0.01 | 0.00 | 0.01 | 0.29 | 0.00 | 0.00 | 0.00 | 0.00 | 0.11 |
| Dy | 0.13 | 0.13 | 0.08 | 0.05 | 1.31 | 0.03 | 0.06 | 0.06 | 0.00 | 0.55 |
| Ho | 0.01 | 0.03 | 0.00 | 0.01 | 0.17 | 0.01 | 0.02 | 0.01 | 0.00 | 0.12 |
| Er | 0.04 | 0.09 | 0.04 | 0.08 | 0.24 | 0.00 | 0.08 | 0.00 | 0.01 | 0.33 |
| Tm | 0.01 | 0.01 | 0.00 | 0.01 | 0.05 | 0.01 | 0.01 | 0.00 | 0.01 | 0.06 |
| Yb | 0.11 | 0.08 | 0.07 | 0.07 | 0.35 | 0.03 | 0.07 | 0.02 | 0.00 | 0.28 |
| Lu | 0.02 | 0.02 | 0.01 | 0.02 | 0.02 | 0.01 | 0.02 | 0.00 | 0.01 | 0.03 |
| Hf | 0.30 | 0.23 | 0.23 | 0.07 | 0.13 | 0.23 | 0.12 | 0.29 | 0.01 | 0.47 |
| Ta | 0.01 | 0.00 | 0.02 | 0.01 | 0.01 | 0.01 | 0.00 | 0.00 | 0.00 | 0.03 |
| Pb | 11.51 | 4.46 | 3.26 | 7.45 | 31.43 | 1.41 | 4.36 | 1.86 | 1.57 | 2.02 |
| Th | 0.74 | 0.27 | 0.26 | 0.20 | 0.26 | 0.20 | 0.09 | 0.12 | 0.03 | 0.25 |
| U | 0.14 | 0.05 | 0.03 | 0.14 | 0.76 | 0.03 | 0.38 | 0.03 | 0.02 | 0.67 |
Element content normalized values of chondrite and Ce and Eu outliers [12]
| Sample | (Ce)N | (Eu)N | (Sm)N | (Gd)N | (La)N | (Pr)N | (Lu)N | Ce* | Eu* | (Sm/La) N | (Lu/Gd) N |
|---|---|---|---|---|---|---|---|---|---|---|---|
| qj008-1 | 12.60 | 12.93 | 16.86 | 66.86 | 0.04 | 0.63 | 1780.31 | 37.40 | 0.31 | 399.65 | 26.63 |
| qj008-2 | 12.16 | 13.45 | 15.56 | 68.47 | 0.13 | 0.63 | 1833.07 | 32.07 | 0.32 | 122.89 | 26.77 |
| qj008-3 | 57.40 | 37.41 | 46.93 | 130.22 | 45.32 | 34.21 | 2924.41 | 1.44 | 0.42 | 1.04 | 22.46 |
| qj008-4 | 22.63 | 34.31 | 48.37 | 164.38 | 4.85 | 6.74 | 3211.81 | 3.91 | 0.32 | 9.97 | 19.54 |
| qj008-5 | 14.22 | 12.76 | 14.25 | 59.85 | 0.04 | 0.63 | 1683.07 | 42.20 | 0.34 | 337.69 | 28.12 |
| qj008-6 | 32.53 | 35.34 | 41.18 | 142.34 | 15.91 | 13.26 | 2834.65 | 2.23 | 0.39 | 2.59 | 19.92 |
| qj008-7 | 20.72 | 30.69 | 48.89 | 168.37 | 0.25 | 2.95 | 3226.38 | 12.95 | 0.28 | 193.11 | 19.16 |
| qj008-9 | 34.53 | 17.59 | 51.11 | 200.00 | 0.13 | 2.84 | 4709.45 | 23.26 | 0.14 | 403.78 | 23.55 |
| qj008-10 | 13.58 | 14.66 | 19.22 | 72.85 | 0.17 | 1.05 | 1831.10 | 22.23 | 0.32 | 113.85 | 25.14 |
| qj008-11 | 16.23 | 20.34 | 23.59 | 92.02 | 0.34 | 1.37 | 2924.80 | 19.02 | 0.35 | 69.90 | 31.78 |
| qj008-12 | 79.38 | 45.00 | 88.63 | 255.57 | 58.48 | 48.53 | 4874.80 | 1.48 | 0.26 | 1.52 | 19.07 |
| qj008-13 | 14.61 | 24.31 | 33.20 | 114.21 | 0.17 | 2.00 | 2496.46 | 13.47 | 0.33 | 196.73 | 21.86 |
| qj008-14 | 116.31 | 37.59 | 92.68 | 241.70 | 96.84 | 75.89 | 4200.00 | 1.35 | 0.22 | 0.96 | 17.38 |
| qj008-15 | 14.25 | 9.66 | 11.70 | 51.29 | 0.89 | 0.95 | 1495.28 | 15.54 | 0.31 | 13.20 | 29.15 |
| qj008-16 | 39.54 | 22.24 | 42.55 | 139.85 | 20.68 | 18.32 | 3294.49 | 2.03 | 0.24 | 2.06 | 23.56 |
Zircon composition calculation ΔFMQ [50]
| Sample | Ce | Ti | U | ΔFMQ |
|---|---|---|---|---|
| qj008-1 | 7.71 | 17.22 | 46.83 | −0.31 |
| qj008-2 | 7.44 | 21.13 | 47.45 | −0.73 |
| qj008-3 | 35.13 | 24.41 | 68.82 | 1.71 |
| qj008-4 | 13.85 | 17.86 | 86.79 | 0.64 |
| qj008-5 | 8.70 | 18.63 | 52.79 | −0.24 |
| qj008-6 | 19.91 | 20.73 | 74.38 | 1.01 |
| qj008-7 | 12.68 | 15.14 | 108.10 | 0.77 |
| qj008-9 | 21.13 | 10.23 | 321.35 | 2.34 |
| qj008-10 | 8.31 | 19.39 | 51.60 | −0.39 |
| qj008-11 | 9.93 | 24.82 | 77.61 | −0.51 |
| qj008-12 | 48.58 | 13.79 | 175.57 | 3.27 |
| qj008-13 | 8.94 | 17.28 | 63.27 | −0.06 |
| qj008-14 | 71.18 | 19.96 | 161.10 | 3.29 |
| qj008-15 | 8.72 | 20.81 | 94.12 | −0.43 |
| qj008-16 | 24.20 | 13.04 | 155.97 | 2.15 |
References
[1] Wang XY, Cao DH, Wang ZQ, Wang AJ, Wu YD. Zircon U-Pb age, trace element and Hf isotope composition of Sepon Au-Cu deposit, Laos: tectonic and metallogenic implications. China Geol. 2018;1:36–48. 10.31035/cg2018006.Search in Google Scholar
[2] Wang XY, Cao DH, Wang JH. Zircon O isotope composition of Sepon Au-Cu deposit, Laos. China Geol. 2020;3:348–9. 10.31035/cg2020015.Search in Google Scholar
[3] Zhong SH, Feng CY, Seltmann R, Li DX, Qu HY. Can magmatic zircon be distinguished from hydrothermal zircon by trace element composition? The effect of mineral inclusions on zircon trace element composition. Lithos. 2018;314:646–57. 10.1016/j.lithos.2018.06.029.Search in Google Scholar
[4] Li H, Hu XJ, Elatikpo SM, Wu JH, Jiang WC, Sun WB, et al. Zircon as a pathfinder for ore exploration. J Geochem Explor. 2023;249:107216.10.1016/j.gexplo.2023.107216Search in Google Scholar
[5] Vincent VI, Li H, Girei MB, Förster MW, Kamaunji VD. Tourmaline and zircon trace the nature and timing of magmatic-hydrothermal episodes in granite-related Sn mineralization: Insights from the Libata Sn ore field. Am Mineralogist. 2023;108:552–71.10.2138/am-2022-8357Search in Google Scholar
[6] Cao J, Li H, Yang X, Soh Tamehe L, Esmaeili R. Multi-stage magma evolution recorded by apatite and zircon of adakite-like rocks: A case study from the Shatanjiao intrusion, Tongling region, Eastern China. Am Mineral. 2022;107:178–89.10.2138/am-2021-7871Search in Google Scholar
[7] Ballard JR, Palin JM, Campbell IH. Relative oxidation states of magmas inferred from Ce“IV”/Ce“III” in zircon: Application to porphyry copper deposits of northern Chile. Contrib Miner Pet. 2002;144(3):347–64. 10.1007/s00410-002-0402-5.Search in Google Scholar
[8] Li CM. A review on the minerageny and situ microanalytical dating techniques of zircons. Geol Surv Res. 2009;33(6):161–74 (in Chinese with English abstract).Search in Google Scholar
[9] Elatikpo SM, Li H, Liu B, Zhang WD. Metallogenesis of the Bakoshi-Kundila gold deposit in northern West Nigerian Subshield: Insights from pyrite chemical and sulfur isotopic compositions and zircon U-Pb geochronology. Precambrian Res. 2022;383:106890.10.1016/j.precamres.2022.106890Search in Google Scholar
[10] Elatikpo SM, Li H, Chen Y, Ahmed HA. Genesis and magma fertility of gold associated high-K granites: LA-ICP-MS zircon trace element and REEs constraint from Bakoshi-Gadanya granites in NW Nigeria. Acta Geochimica. 2022;41(3):351–66.10.1007/s11631-022-00528-zSearch in Google Scholar
[11] Balaram V, Rahaman W, Roy P. Recent advances in MC-ICP-MS applications in Earth and environmental sciences: Challenges and solutions. Geosyst Geoenviron. 2022;1(2):100019. 10.1016/j.geogeo.2021.100019.Search in Google Scholar
[12] Zhang HR, Hou ZQ, Yang TN, Yang ZM, Chen JL, Aghazadeh M. Multiphase porphyry intrusions in the Sungun copper deposit, NW Iran: Evidence from SHRIMP zircon U-Pb dating. China Geol. 2019;2:240–2. 10.31035/cg2018102.Search in Google Scholar
[13] Grimes CB, John BE, Kelemen PB, Mazdab FK, Wooden JL, Cheadle MJ, et al. Trace element chemistry of zircons from oceanic crust: A method for distinguishing detrital zircon provenance. Geology. 2017;35(7):643–6. 10.1130/G23603A.1.Search in Google Scholar
[14] Vincent VI, Li H, Girei MB, Ahmed HA, Ntekim EE. Genesis and age of Pb-Zn mineralization from the Ningi-Burra ring complex, North Central Nigeria: Constraints from zircon morphology, U-Pb dating and Lu-Hf isotopes. Lithos. 2021;390–391:106115.10.1016/j.lithos.2021.106115Search in Google Scholar
[15] Jiang WC, Li H, Turner S, Zhu DP, Wang C. Timing and origin of multi-stage magmatism and related W-Mo-Pb-Zn-Fe-Cu mineralization in the Huangshaping deposit, South China: An integrated zircon study. Chem Geol. 2020;552:119782.10.1016/j.chemgeo.2020.119782Search in Google Scholar
[16] Li H, Sun HS, Evans NJ, Li JW, Wu JH, Jiang WC, et al. Geochemistry and geochronology of zircons from granite-hosted gold mineralization in the Jiaodong Peninsula, North China: implications for ore genesis. Ore Geol Rev. 2019;115:103188.10.1016/j.oregeorev.2019.103188Search in Google Scholar
[17] Hanchar JM, Westrenen W. Rare earth element behavior in zircon-melt systems. Elements. 2007;3(1):37–42.10.2113/gselements.3.1.37Search in Google Scholar
[18] Hoskin PWO, Ireland TR. Rare earth element chemistry of zircon and its use as a provenance indicator. Geology. 2000;28(7):627–30. 10.1130/0091-7613(2000)028<0627:REECOZ>2.3.CO;2.Search in Google Scholar
[19] Zhao J, Zhang ZH, Zhang H, Liu M, Zhu WN. Fluid inclusion and stable isotope studies of the Qiongbulake copper deposit in western Awulale Mountain, Xinjiang. Geol China. 2012;39(5):1345–58 (in Chinese with English abstract).Search in Google Scholar
[20] Zhao J, Zhang ZH, Liu M, Zhang H. Carbon, oxygen, sulfur and lead isotope constraints on the ore source and metallogenesis of copper deposits in western Awulale Mountain metallogenic belt, Xinjiang. Miner Depos. 2012;31(5):999–1013 (in Chinese with English abstract).Search in Google Scholar
[21] Liu R, Wang LX, Chen GW. Genesis, geological significance and metallogentic potentiality of A-type granites in the Awulale area of the western Tianshan, Xinjiang. Acta Pet Sin. 2017;33(6):1741–54 (in Chinese with English abstract).Search in Google Scholar
[22] Liu R, Chen GW. Characteristics of rare earth elements, Zr, and Hf in Ore-bearing orphyries from the Western Awulale metallogenic belt, Northwestern China and their application in determining metal fertility of granitic magma. Resour Geol. 2018;69(2):1–18.10.1111/rge.12197Search in Google Scholar
[23] Wang ZL, Mao JW, Zhang ZH, Zuo GC, Wang LS. Geology, time-space distribution and metallogenic geodynamic evolution of porphyry copper (molybdenum) deposits in the Tianshan Mountains. Acta Geol Sin. 2006;7:942–55 (in Chinese with English abstract).Search in Google Scholar
[24] Zhong S, Seltmann R, Shen P. Two different types of granitoids in the Suyunhe large porphyry Mo deposit, NW China and their genetic relationships with molybdenum mineralization. Ore Geol Rev. 2017;88:116–39.10.1016/j.oregeorev.2017.04.012Search in Google Scholar
[25] Zhang ZH, Hong W, Jiang Z, Duan S, Li F, Shi FP. Geological characteristics and metallogenesis of iron deposits in western Tianshan, China. Ore Geol Rev. 2014;57:425–40. 10.1016/j.oregeorev.2013.09.012.Search in Google Scholar
[26] Zhang ZH, Hong W, Jiang ZS, Duan SG, Xu LG, Li FM, et al. Geological characteristics and zircon U-Pb dating of volcanic rocks from the Beizhan iron deposit in western Tianshan Mountains, Xinjiang, NW China. Acta Geol Sin-Engl Ed. 2012;86(3):737–47. 10.1111/j.1755-6724.2012.00699.x.Search in Google Scholar
[27] Li NB, Niu HC, Shan Q, Yang WB. Two episodes of late paleozoic A-type magmatism in the Qunjisayi area, western Tianshan: petrogenesis and tectonic implications. J Asian Earth Sci. 2015;113(1):238–53. 10.1016/j.jseaes.2014.12.015.Search in Google Scholar
[28] Liu R, Chen GW. The 109 porphyry Cu deposit in the western Tianshan orogenic belt, NW China: An example of Cu mineralization in a reduced magmatic-hydrothermal system in an extensional setting. Ore Geol Rev. 2019;112:102989.10.1016/j.oregeorev.2019.102989Search in Google Scholar
[29] Liu YS, Hu ZC, Gao S, Günther D, Xu J, Gao CG, et al. In situ analysis of major and trace elements of anhydrous minerals by LA-ICPMS without applying an internal standard. Chem Geol. 2008;257(1–2):34–43. 10.1016/j.chemgeo.2008.08.004.Search in Google Scholar
[30] Liu YS, Hu ZC, Zong KQ, Gao CG, Gao S, Xu J, et al. Reappraisement and refinement of zircon U-Pb isotope and trace element analyses by LA-ICP-MS. Chin Sci Bull. 2010;55(15):1535–46. 10.1007/s11434-010-3052-4.Search in Google Scholar
[31] Ludwig KR. Isoplot 3.00: A geochronological toolkit for Microsoft Excel. Berkeley Geochronol Cent Spec Publ. 2003;4:70.Search in Google Scholar
[32] Yuan HL, Gao S, Liu XM, Li HM, Günther D, Wu FY. Accurate U–Pb age and trace element determinations of zircon by laser ablation-inductively coupled plasma-mass spectrometry. Geost Geoanal Res. 2004;28:353–70.10.1111/j.1751-908X.2004.tb00755.xSearch in Google Scholar
[33] Thomas JB, Bodnar RJ, Shimizu N, Sinha AK. Determination of zircon/melt trace element partition coefficients from SIMS analysis of melt inclusions in zircon. Geochim Cosmochim Acta. 2002;66(16):2887–901. 10.1016/S0016-7037(02)00881-5.Search in Google Scholar
[34] Li Z, Wang LQ, Zhang Z, Luo MC, Leng QF, Kang HR, et al. Zricon trace element characteristics of intrusions in Bangpu porphyry Mo (Cu) polymetallic deposit of Tibit and their geological significance. J Earth Sci Environ. 2015;37(6):59–71 (in Chinese with English abstract).Search in Google Scholar
[35] Zhao ZH. Trace element geochemistry of accessory minerals and its applications in petrogenesis and metallogenesis. Earth Sci Front. 2010;17(1):267–86 (in Chinese with English abstract).Search in Google Scholar
[36] Peng HM, Xia F, Yan ZB. Features, genesis and geological significance of zircons from the Granite porphyry in the Dalingshang Tungsten deposit, Jiangxi Province. Acta Petrol Mineral. 2014;33(5):811–24 (in Chinese with English abstract).Search in Google Scholar
[37] Pettke T, Audetata A, Schalyegger U. Magmatic-to-hydrothermal crystallization in the W–Sn mineralized Mole Granite (NSW, Australia) Part Ⅱ: Evolving zircon and thorite trace element chemistry. Chem Geol. 2005;220(3/4):191–213.10.1016/j.chemgeo.2005.02.017Search in Google Scholar
[38] Rayner N, Stern RA, Carr SD. Grain-scale variations in trace element composition of fluid-altered zircon, Acasta Gneiss Comolex, Northwestern Canada. Contrib Mineral Petrol. 2005;184(6):721–34. 10.1007/s00410-004-0633-8.Search in Google Scholar
[39] Wei AJ, Bian F, Ma Y, Song ZS, Wang HT. The character of hydrothermal zircons and its geological significance in Dachang gold deposit. J Yangtze Univ: Nat Sci Ed. 2012;9(7):38–40 (in Chinese with English abstract).Search in Google Scholar
[40] Hidaka H, Shimizu H, Adachi M. U–Pb geochronology and REE geochemistry of zircons from Palaeoproterozoic paragneiss clasts in the Mesozoic Kamiaso conglomerate, central Japan: evidence for an Archean provenance. Chem Geol. 2002;187(3–4):279–93. 10.1016/S0009-2541(02)00058-X.Search in Google Scholar
[41] Leng QF, Wang LQ, Ying LJ, Zheng WB, Luo MC, Chen W, et al. LA-ICP-MS zircon U-Pb dating of allgovite in the Bangpu Molybdenum (Copper) deposit in Tibet and its geological significance. Acta Geoscientica Sin. 2012;33(4):559–68 (in Chinese with English abstract).Search in Google Scholar
[42] Dall’Agnol R, Frost CD, Rämö OT. IGCP Project 510 “A-type granites and related rocks through Time”: project vita, results, and contribution to granite research. Lithos. 2012;151(1–2):1–16. 10.1016/j.lithos.2012.08.003.Search in Google Scholar
[43] Xia LQ, Xu XY, Xia ZC, Li XM, Ma ZP, Wang LS. Petrogenesis of Carboniferous rift-related volcanic rocks in the Tianshan, northwestern China. Geol Soc Am Bull. 2004;116(3):419–33. 10.1130/B25243.1.Search in Google Scholar
[44] Yu XZ, He YY, Wang M, Zhang J, Zhang XJ, Fan ZG. Gravity and magnetic field characteristics and regional ore prospecting of the Yili ancient continent, West Tianshan, Xinjiang Uygur Autonomous Region, China. China Geol. 2020;3:104–12. 10.31035/cg2020023.Search in Google Scholar
[45] Eby GN. Chemical subdivision of the A-type granitoids petrogenetic and tectonic implications. Geology. 1992;20:641–4. 10.1130/0091-7613(1992)020<0641:CSOTAT>2.3.CO;2.Search in Google Scholar
[46] Zhong S, Seltmann R, Qu H, Song Y. Characterization of the zircon Ce anomaly for estimation of oxidation state of magmas: a revised Ce/Ce* method. Mineral Petrol. 2019;113(6):755–63. 10.1007/s00710-019-00682-y.Search in Google Scholar
[47] Zhong S, Li S, Seltmann R, Lai Z, Zhou J. The influence of fractionation of REE-enriched minerals on the zircon partition coefficients. Geosci Front. 2020;12(3):101094. 10.1016/j.gsf.2020.10.002.Search in Google Scholar
[48] Zhong S, Li S, Feng C, Gao Y, Qu H, Seltmann R, et al. Geochronology and geochemistry of mineralized and barren intrusive rocks in the Yemaquan polymetallic skarn deposit, northern Qinghai-Tibet Plateau: A zircon perspective. Ore Geol Rev. 2021;139:104560. 10.1016/j.oregeorev.2021.104560.Search in Google Scholar
[49] Sun WD, Huang RF, Li H, Hu YB, Zhang CC, Sun SJ, et al. Porphyry deposits and oxidized magmas. Ore Geol Rev. 2015;65:97–131. 10.1016/j.oregeorev.2014.09.004.Search in Google Scholar
[50] Loucks RR, Fiorentini ML, Henriquez GJ. New magmatic oxybarometer using trace elements in zircon. J Petrology. 2020;61(3):egaa034. 10.1093/petrology/egaa034.Search in Google Scholar
[51] Zhong S, Li S, Feng C, Liu Y, Santosh M, He S, et al. Porphyry copper and skarn fertility of the northern Qinghai-Tibet Plateau collisional granitoids. Earth-Sci Rev. 2021;214:103524. 10.1016/j.earscirev.2021.103524.Search in Google Scholar
[52] Liang HY, Campbell IH, Allen C, Sun WD, Liu CQ, Yu HX, et al. Zircon Ce4+/Ce3+ ratio and ages for Yulong ore-bearing porphyries in eastern Tibet. Miner Deposita. 2006;41(2):152–9.10.1007/s00126-005-0047-1Search in Google Scholar
[53] Watson EB, Harrison TM. Zircon saturation revisited: temperature and composition effects in a variety of crustal magma types. Earth Planet Sci Lett. 1983;64(2):295–304.10.1016/0012-821X(83)90211-XSearch in Google Scholar
[54] Burnham AD. Zircon as a recorder of the oxygen fugacity of magmas. Imperial College London; 2012. 10.25560/9979.Search in Google Scholar
[55] Wood BJ, Bryndzia LT, Johnson KE. Mantle oxidation state and its relationship to tectonic environment and fluid speciation. Science. 1990;248(4953):337.10.1126/science.248.4953.337Search in Google Scholar PubMed
[56] Gao J, Qian Q, Long LL, Zhang X, Li JL. Accretionary orogenic process of Western Tianshan, China. Geol Bull China. 2009;28(12):1804–16.Search in Google Scholar
[57] Shen P, Hattori K, Pan H, Jackson S, Seitmuratova E. Oxidation condition and metal fertility of granitic magmas: Zircon trace-element data from porphyry cu deposits in the central asian orogenic belt. Econ Geol. 2015;110(7):18. 10.2113/econgeo.110.7.1861.Search in Google Scholar
© 2025 the author(s), published by De Gruyter
This work is licensed under the Creative Commons Attribution 4.0 International License.
Articles in the same Issue
- Research Articles
- Seismic response and damage model analysis of rocky slopes with weak interlayers
- Multi-scenario simulation and eco-environmental effect analysis of “Production–Living–Ecological space” based on PLUS model: A case study of Anyang City
- Remote sensing estimation of chlorophyll content in rape leaves in Weibei dryland region of China
- GIS-based frequency ratio and Shannon entropy modeling for landslide susceptibility mapping: A case study in Kundah Taluk, Nilgiris District, India
- Natural gas origin and accumulation of the Changxing–Feixianguan Formation in the Puguang area, China
- Spatial variations of shear-wave velocity anomaly derived from Love wave ambient noise seismic tomography along Lembang Fault (West Java, Indonesia)
- Evaluation of cumulative rainfall and rainfall event–duration threshold based on triggering and non-triggering rainfalls: Northern Thailand case
- Pixel and region-oriented classification of Sentinel-2 imagery to assess LULC dynamics and their climate impact in Nowshera, Pakistan
- The use of radar-optical remote sensing data and geographic information system–analytical hierarchy process–multicriteria decision analysis techniques for revealing groundwater recharge prospective zones in arid-semi arid lands
- Effect of pore throats on the reservoir quality of tight sandstone: A case study of the Yanchang Formation in the Zhidan area, Ordos Basin
- Hydroelectric simulation of the phreatic water response of mining cracked soil based on microbial solidification
- Spatial-temporal evolution of habitat quality in tropical monsoon climate region based on “pattern–process–quality” – a case study of Cambodia
- Early Permian to Middle Triassic Formation petroleum potentials of Sydney Basin, Australia: A geochemical analysis
- Micro-mechanism analysis of Zhongchuan loess liquefaction disaster induced by Jishishan M6.2 earthquake in 2023
- Prediction method of S-wave velocities in tight sandstone reservoirs – a case study of CO2 geological storage area in Ordos Basin
- Ecological restoration in valley area of semiarid region damaged by shallow buried coal seam mining
- Hydrocarbon-generating characteristics of Xujiahe coal-bearing source rocks in the continuous sedimentary environment of the Southwest Sichuan
- Hazard analysis of future surface displacements on active faults based on the recurrence interval of strong earthquakes
- Structural characterization of the Zalm district, West Saudi Arabia, using aeromagnetic data: An approach for gold mineral exploration
- Research on the variation in the Shields curve of silt initiation
- Reuse of agricultural drainage water and wastewater for crop irrigation in southeastern Algeria
- Assessing the effectiveness of utilizing low-cost inertial measurement unit sensors for producing as-built plans
- Analysis of the formation process of a natural fertilizer in the loess area
- Machine learning methods for landslide mapping studies: A comparative study of SVM and RF algorithms in the Oued Aoulai watershed (Morocco)
- Chemical dissolution and the source of salt efflorescence in weathering of sandstone cultural relics
- Molecular simulation of methane adsorption capacity in transitional shale – a case study of Longtan Formation shale in Southern Sichuan Basin, SW China
- Evolution characteristics of extreme maximum temperature events in Central China and adaptation strategies under different future warming scenarios
- Estimating Bowen ratio in local environment based on satellite imagery
- 3D fusion modeling of multi-scale geological structures based on subdivision-NURBS surfaces and stratigraphic sequence formalization
- Comparative analysis of machine learning algorithms in Google Earth Engine for urban land use dynamics in rapidly urbanizing South Asian cities
- Study on the mechanism of plant root influence on soil properties in expansive soil areas
- Simulation of seismic hazard parameters and earthquakes source mechanisms along the Red Sea rift, western Saudi Arabia
- Tectonics vs sedimentation in foredeep basins: A tale from the Oligo-Miocene Monte Falterona Formation (Northern Apennines, Italy)
- Investigation of landslide areas in Tokat-Almus road between Bakımlı-Almus by the PS-InSAR method (Türkiye)
- Predicting coastal variations in non-storm conditions with machine learning
- Cross-dimensional adaptivity research on a 3D earth observation data cube model
- Geochronology and geochemistry of late Paleozoic volcanic rocks in eastern Inner Mongolia and their geological significance
- Spatial and temporal evolution of land use and habitat quality in arid regions – a case of Northwest China
- Ground-penetrating radar imaging of subsurface karst features controlling water leakage across Wadi Namar dam, south Riyadh, Saudi Arabia
- Rayleigh wave dispersion inversion via modified sine cosine algorithm: Application to Hangzhou, China passive surface wave data
- Fractal insights into permeability control by pore structure in tight sandstone reservoirs, Heshui area, Ordos Basin
- Debris flow hazard characteristic and mitigation in Yusitong Gully, Hengduan Mountainous Region
- Research on community characteristics of vegetation restoration in hilly power engineering based on multi temporal remote sensing technology
- Identification of radial drainage networks based on topographic and geometric features
- Trace elements and melt inclusion in zircon within the Qunji porphyry Cu deposit: Application to the metallogenic potential of the reduced magma-hydrothermal system
- Pore, fracture characteristics and diagenetic evolution of medium-maturity marine shales from the Silurian Longmaxi Formation, NE Sichuan Basin, China
- Study of the earthquakes source parameters, site response, and path attenuation using P and S-waves spectral inversion, Aswan region, south Egypt
- Source of contamination and assessment of potential health risks of potentially toxic metal(loid)s in agricultural soil from Al Lith, Saudi Arabia
- Regional spatiotemporal evolution and influencing factors of rural construction areas in the Nanxi River Basin via GIS
- An efficient network for object detection in scale-imbalanced remote sensing images
- Effect of microscopic pore–throat structure heterogeneity on waterflooding seepage characteristics of tight sandstone reservoirs
- Environmental health risk assessment of Zn, Cd, Pb, Fe, and Co in coastal sediments of the southeastern Gulf of Aqaba
- A modified Hoek–Brown model considering softening effects and its applications
- Evaluation of engineering properties of soil for sustainable urban development
- The spatio-temporal characteristics and influencing factors of sustainable development in China’s provincial areas
- Application of a mixed additive and multiplicative random error model to generate DTM products from LiDAR data
- Gold vein mineralogy and oxygen isotopes of Wadi Abu Khusheiba, Jordan
- Prediction of surface deformation time series in closed mines based on LSTM and optimization algorithms
- 2D–3D Geological features collaborative identification of surrounding rock structural planes in hydraulic adit based on OC-AINet
- Spatiotemporal patterns and drivers of Chl-a in Chinese lakes between 1986 and 2023
- Land use classification through fusion of remote sensing images and multi-source data
- Nexus between renewable energy, technological innovation, and carbon dioxide emissions in Saudi Arabia
- Analysis of the spillover effects of green organic transformation on sustainable development in ethnic regions’ agriculture and animal husbandry
- Factors impacting spatial distribution of black and odorous water bodies in Hebei
- Large-scale shaking table tests on the liquefaction and deformation responses of an ultra-deep overburden
- Impacts of climate change and sea-level rise on the coastal geological environment of Quang Nam province, Vietnam
- Reservoir characterization and exploration potential of shale reservoir near denudation area: A case study of Ordovician–Silurian marine shale, China
- Seismic prediction of Permian volcanic rock reservoirs in Southwest Sichuan Basin
- Application of CBERS-04 IRS data to land surface temperature inversion: A case study based on Minqin arid area
- Geological characteristics and prospecting direction of Sanjiaoding gold mine in Saishiteng area
- Research on the deformation prediction model of surrounding rock based on SSA-VMD-GRU
- Geochronology, geochemical characteristics, and tectonic significance of the granites, Menghewula, Southern Great Xing’an range
- Hazard classification of active faults in Yunnan base on probabilistic seismic hazard assessment
- Characteristics analysis of hydrate reservoirs with different geological structures developed by vertical well depressurization
- Estimating the travel distance of channelized rock avalanches using genetic programming method
- Landscape preferences of hikers in Three Parallel Rivers Region and its adjacent regions by content analysis of user-generated photography
- New age constraints of the LGM onset in the Bohemian Forest – Central Europe
- Characteristics of geological evolution based on the multifractal singularity theory: A case study of Heyu granite and Mesozoic tectonics
- Soil water content and longitudinal microbiota distribution in disturbed areas of tower foundations of power transmission and transformation projects
- Oil accumulation process of the Kongdian reservoir in the deep subsag zone of the Cangdong Sag, Bohai Bay Basin, China
- Investigation of velocity profile in rock–ice avalanche by particle image velocimetry measurement
- Optimizing 3D seismic survey geometries using ray tracing and illumination modeling: A case study from Penobscot field
- Sedimentology of the Phra That and Pha Daeng Formations: A preliminary evaluation of geological CO2 storage potential in the Lampang Basin, Thailand
- Improved classification algorithm for hyperspectral remote sensing images based on the hybrid spectral network model
- Map analysis of soil erodibility rates and gully erosion sites in Anambra State, South Eastern Nigeria
- Identification and driving mechanism of land use conflict in China’s South-North transition zone: A case study of Huaihe River Basin
- Evaluation of the impact of land-use change on earthquake risk distribution in different periods: An empirical analysis from Sichuan Province
- A test site case study on the long-term behavior of geotextile tubes
- An experimental investigation into carbon dioxide flooding and rock dissolution in low-permeability reservoirs of the South China Sea
- Detection and semi-quantitative analysis of naphthenic acids in coal and gangue from mining areas in China
- Comparative effects of olivine and sand on KOH-treated clayey soil
- YOLO-MC: An algorithm for early forest fire recognition based on drone image
- Earthquake building damage classification based on full suite of Sentinel-1 features
- Potential landslide detection and influencing factors analysis in the upper Yellow River based on SBAS-InSAR technology
- Assessing green area changes in Najran City, Saudi Arabia (2013–2022) using hybrid deep learning techniques
- An advanced approach integrating methods to estimate hydraulic conductivity of different soil types supported by a machine learning model
- Hybrid methods for land use and land cover classification using remote sensing and combined spectral feature extraction: A case study of Najran City, KSA
- Streamlining digital elevation model construction from historical aerial photographs: The impact of reference elevation data on spatial accuracy
- Analysis of urban expansion patterns in the Yangtze River Delta based on the fusion impervious surfaces dataset
- A metaverse-based visual analysis approach for 3D reservoir models
- Late Quaternary record of 100 ka depositional cycles on the Larache shelf (NW Morocco)
- Integrated well-seismic analysis of sedimentary facies distribution: A case study from the Mesoproterozoic, Ordos Basin, China
- Study on the spatial equilibrium of cultural and tourism resources in Macao, China
- Urban road surface condition detecting and integrating based on the mobile sensing framework with multi-modal sensors
- Application of improved sine cosine algorithm with chaotic mapping and novel updating methods for joint inversion of resistivity and surface wave data
- The synergistic use of AHP and GIS to assess factors driving forest fire potential in a peat swamp forest in Thailand
- Dynamic response analysis and comprehensive evaluation of cement-improved aeolian sand roadbed
- Rock control on evolution of Khorat Cuesta, Khorat UNESCO Geopark, Northeastern Thailand
- Gradient response mechanism of carbon storage: Spatiotemporal analysis of economic-ecological dimensions based on hybrid machine learning
- Comparison of several seismic active earth pressure calculation methods for retaining structures
- Mantle dynamics and petrogenesis of Gomer basalts in the Northwestern Ethiopia: A geochemical perspective
- Study on ground deformation monitoring in Xiong’an New Area from 2021 to 2023 based on DS-InSAR
- Paleoenvironmental characteristics of continental shale and its significance to organic matter enrichment: Taking the fifth member of Xujiahe Formation in Tianfu area of Sichuan Basin as an example
- Equipping the integral approach with generalized least squares to reconstruct relict channel profile and its usage in the Shanxi Rift, northern China
- InSAR-driven landslide hazard assessment along highways in hilly regions: A case-based validation approach
- Attribution analysis of multi-temporal scale surface streamflow changes in the Ganjiang River based on a multi-temporal Budyko framework
- Maps analysis of Najran City, Saudi Arabia to enhance agricultural development using hybrid system of ANN and multi-CNN models
- Hybrid deep learning with a random forest system for sustainable agricultural land cover classification using DEM in Najran, Saudi Arabia
- Long-term evolution patterns of groundwater depth and lagged response to precipitation in a complex aquifer system: Insights from Huaibei Region, China
- Remote sensing and machine learning for lithology and mineral detection in NW, Pakistan
- Spatial–temporal variations of NO2 pollution in Shandong Province based on Sentinel-5P satellite data and influencing factors
- Numerical modeling of geothermal energy piles with sensitivity and parameter variation analysis of a case study
- Stability analysis of valley-type upstream tailings dams using a 3D model
- Variation characteristics and attribution analysis of actual evaporation at monthly time scale from 1982 to 2019 in Jialing River Basin, China
- Investigating machine learning and statistical approaches for landslide susceptibility mapping in Minfeng County, Xinjiang
- Investigating spatiotemporal patterns for comprehensive accessibility of service facilities by location-based service data in Nanjing (2016–2022)
- A pre-treatment method for particle size analysis of fine-grained sedimentary rocks, Bohai Bay Basin, China
- Study on the formation mechanism of the hard-shell layer of liquefied silty soil
- Comprehensive analysis of agricultural CEE: Efficiency assessment, mechanism identification, and policy response – A case study of Anhui Province
- Simulation study on the damage and failure mechanism of the surrounding rock in sanded dolomite tunnels
- Towards carbon neutrality: Spatiotemporal evolution and key influences on agricultural ecological efficiency in Northwest China
- High-frequency cycles drive the cyclical enrichment of oil in porous carbonate reservoirs: A case study of the Khasib Formation in E Oilfield, Mesopotamian Basin, Iraq
- Reconstruction of digital core models of granular rocks using mathematical morphology
- Spatial–temporal differentiation law of habitat quality and its driving mechanism in the typical plateau areas of the Loess Plateau in the recent 30 years
- A machine-learning-based approach to predict potential oil sites: Conceptual framework and experimental evaluation
- Effects of landscape pattern change on waterbird diversity in Xianghai Nature Reserve
- Research on intelligent classification method of highway tunnel surrounding rock classification based on parameters while drilling
- River morphology and tectono-sedimentary analysis of a shallow river delta: A case study of Putaohua oil layer in Saertu oilfield (L. Cretaceous), China
- Review Articles
- Humic substances influence on the distribution of dissolved iron in seawater: A review of electrochemical methods and other techniques
- Applications of physics-informed neural networks in geosciences: From basic seismology to comprehensive environmental studies
- Ore-controlling structures of granite-related uranium deposits in South China: A review
- Shallow geological structure features in Balikpapan Bay East Kalimantan Province – Indonesia
- A review on the tectonic affinity of microcontinents and evolution of the Proto-Tethys Ocean in Northeastern Tibet
- Advancements in machine learning applications for mineral prospecting and geophysical inversion: A review
- Special Issue: Natural Resources and Environmental Risks: Towards a Sustainable Future - Part II
- Depopulation in the Visok micro-region: Toward demographic and economic revitalization
- Special Issue: Geospatial and Environmental Dynamics - Part II
- Advancing urban sustainability: Applying GIS technologies to assess SDG indicators – a case study of Podgorica (Montenegro)
- Spatiotemporal and trend analysis of common cancers in men in Central Serbia (1999–2021)
- Minerals for the green agenda, implications, stalemates, and alternatives
- Spatiotemporal water quality analysis of Vrana Lake, Croatia
- Functional transformation of settlements in coal exploitation zones: A case study of the municipality of Stanari in Republic of Srpska (Bosnia and Herzegovina)
- Hypertension in AP Vojvodina (Northern Serbia): A spatio-temporal analysis of patients at the Institute for Cardiovascular Diseases of Vojvodina
- Regional patterns in cause-specific mortality in Montenegro, 1991–2019
- Spatio-temporal analysis of flood events using GIS and remote sensing-based approach in the Ukrina River Basin, Bosnia and Herzegovina
- Flash flood susceptibility mapping using LiDAR-Derived DEM and machine learning algorithms: Ljuboviđa case study, Serbia
- Geocultural heritage as a basis for geotourism development: Banjska Monastery, Zvečan (Serbia)
- Assessment of groundwater potential zones using GIS and AHP techniques – A case study of the zone of influence of Kolubara Mining Basin
- Impact of the agri-geographical transformation of rural settlements on the geospatial dynamics of soil erosion intensity in municipalities of Central Serbia
- Where faith meets geomorphology: The cultural and religious significance of geodiversity explored through geospatial technologies
- Applications of local climate zone classification in European cities: A review of in situ and mobile monitoring methods in urban climate studies
- Complex multivariate water quality impact assessment on Krivaja River
- Ionization hotspots near waterfalls in Eastern Serbia’s Stara Planina Mountain
- Shift in landscape use strategies during the transition from the Bronze age to Iron age in Northwest Serbia
- Assessing the geotourism potential of glacial lakes in Plav, Montenegro: A multi-criteria assessment by using the M-GAM model
- Flash flood potential index at national scale: Susceptibility assessment within catchments
- SWAT modelling and MCDM for spatial valuation in small hydropower planning
- Disaster risk perception and local resilience near the “Duboko” landfill: Challenges of governance, management, trust, and environmental communication in Serbia