Fractal insights into permeability control by pore structure in tight sandstone reservoirs, Heshui area, Ordos Basin
-
 ,
,

Abstract
Tight sandstone reservoirs, characterized by low porosity and permeability, have long posed significant challenges for oil and gas exploration and development. This study focuses on the reservoirs in the Chang 6–Chang 8 section of the Yanchang Formation, located in the Heshui area of the Ordos Basin. These reservoirs, with their complex pore structures and diverse genesis, represent typical examples of tight sandstone reservoirs. The primary aim of this study is to systematically investigate the pore structures of these reservoirs, elucidating the mechanisms that govern permeability and thereby providing a scientific basis and technical support for the efficient development of tight sandstone oil and gas resources. Utilizing high-pressure mercury injection and nuclear magnetic resonance techniques, the study emphasizes the crucial role of pore fractal properties in controlling reservoir permeability. The results indicate that the complexity of pore structures directly influences both permeability and mobile fluid saturation. Specifically, smaller pores exhibit lower fractal dimensions, while larger pores show higher fractal dimensions, with significant impacts on both permeability and mobile fluid saturation. Additionally, the study examines the effects of different sedimentary facies and diagenetic stages on the pore structures of sandstone reservoirs. The findings reveal distinct evolutionary patterns of pore structures across various depositional environments within the braided river delta system. Furthermore, diagenetic processes and cementation play essential roles in shaping the diversity of pore structures in these reservoirs. In conclusion, this study offers new insights into the relationship between pore structure and permeability in tight sandstone reservoirs, providing valuable theoretical guidance for the exploration and development of oil and gas resources.
1 Introduction
Tight oil has emerged as a key focus in global unconventional oil and gas exploration and development. The Ordos Basin, located in the central-western part of China, is one of the most significant regions for tight oil resources in the country. According to recent statistics, tight oil resources in this basin account for 74% of China’s total unconventional oil resources [1]. Among the various formations in the basin, the Yanchang Formation is the primary tight sandstone reservoirs, but it is extremely low porosity and permeability present considerable challenges for oil and gas exploration and development [2]. As such, research on the micropore structure of these reservoirs and its influence on fluid flow has become a critical focus and challenge in tight oil development [3,4].
To date, researchers have widely employed advanced techniques such as scanning electron microscopy (SEM), high-pressure mercury injection (HPMI), nuclear magnetic resonance (NMR), and computed tomography scanning to investigate the morphology, size, distribution, and connectivity of reservoir pores [5,6,7]. However, the results from these techniques are often isolated, making it difficult to fully capture the complexity and irregularity of pore space distribution in low-permeability sandstone reservoirs [8]. Fractal theory, introduced by the French mathematician Benoît B. Mandelbrot, offers a powerful tool for quantifying the irregularity of complex structures [9]. The application of fractal theory in the study of tight sandstone reservoirs enables a more precise quantitative description of pore complexity [10,11,12].
Previous studies have shown that tight sandstone reservoirs, formed under complex geological processes, exhibit diverse and intricate pore structures, with spatial distributions that display fractal characteristics [13,14,15]. The fractal dimension of pore structures has been proposed as a quantitative parameter to describe the complexity and variability of these structures [16,17]. Although some research has explored the fractal characteristics of ultra-low permeability reservoir pore structures, studies examining the correlation between fractal dimension, reservoir permeability, and geological genesis remain limited, particularly in the context of the Ordos Basin [18,19,20,21,22].
This study integrates HPMI and NMR techniques to investigate the pore structure characteristics of tight sandstone reservoirs through the lens of fractal theory. Our primary objective is to elucidate the relationship between fractal dimension and permeability, and to further explore the geological factors responsible for the variations in sandstone pore structures. The findings of this study are significant for the quantitative characterization of tight sandstone reservoirs, providing insights into their geological causes and offering practical guidance for oil and gas exploration and development [23,24,25].
2 Geological background
The Ordos Basin is located at the junction of the eastern and western tectonic domains of China, extending in a north-south rectangular shape, with an area of approximately 37 × 104 km2, of which more than 10 × 104 km2 is available for exploration (Figure 1a). The basin currently exhibits an asymmetric large anticline with a gently sloping eastern wing and a steeply narrowing western wing (Figure 1b) [26]. It can be divided into six major structural units: the Weibei Uplift, the Yishan Slope, the Western Shanxi Fold Belt, the Yimeng Uplift, the Tianhuan Depression, and the western thrust fault zone (Figure 1b). The study area is located in the southwest part of the Yishan Slope in the Heshui region, where the structure presents a gently dipping westward monocline with a dip angle of about 0.5°.
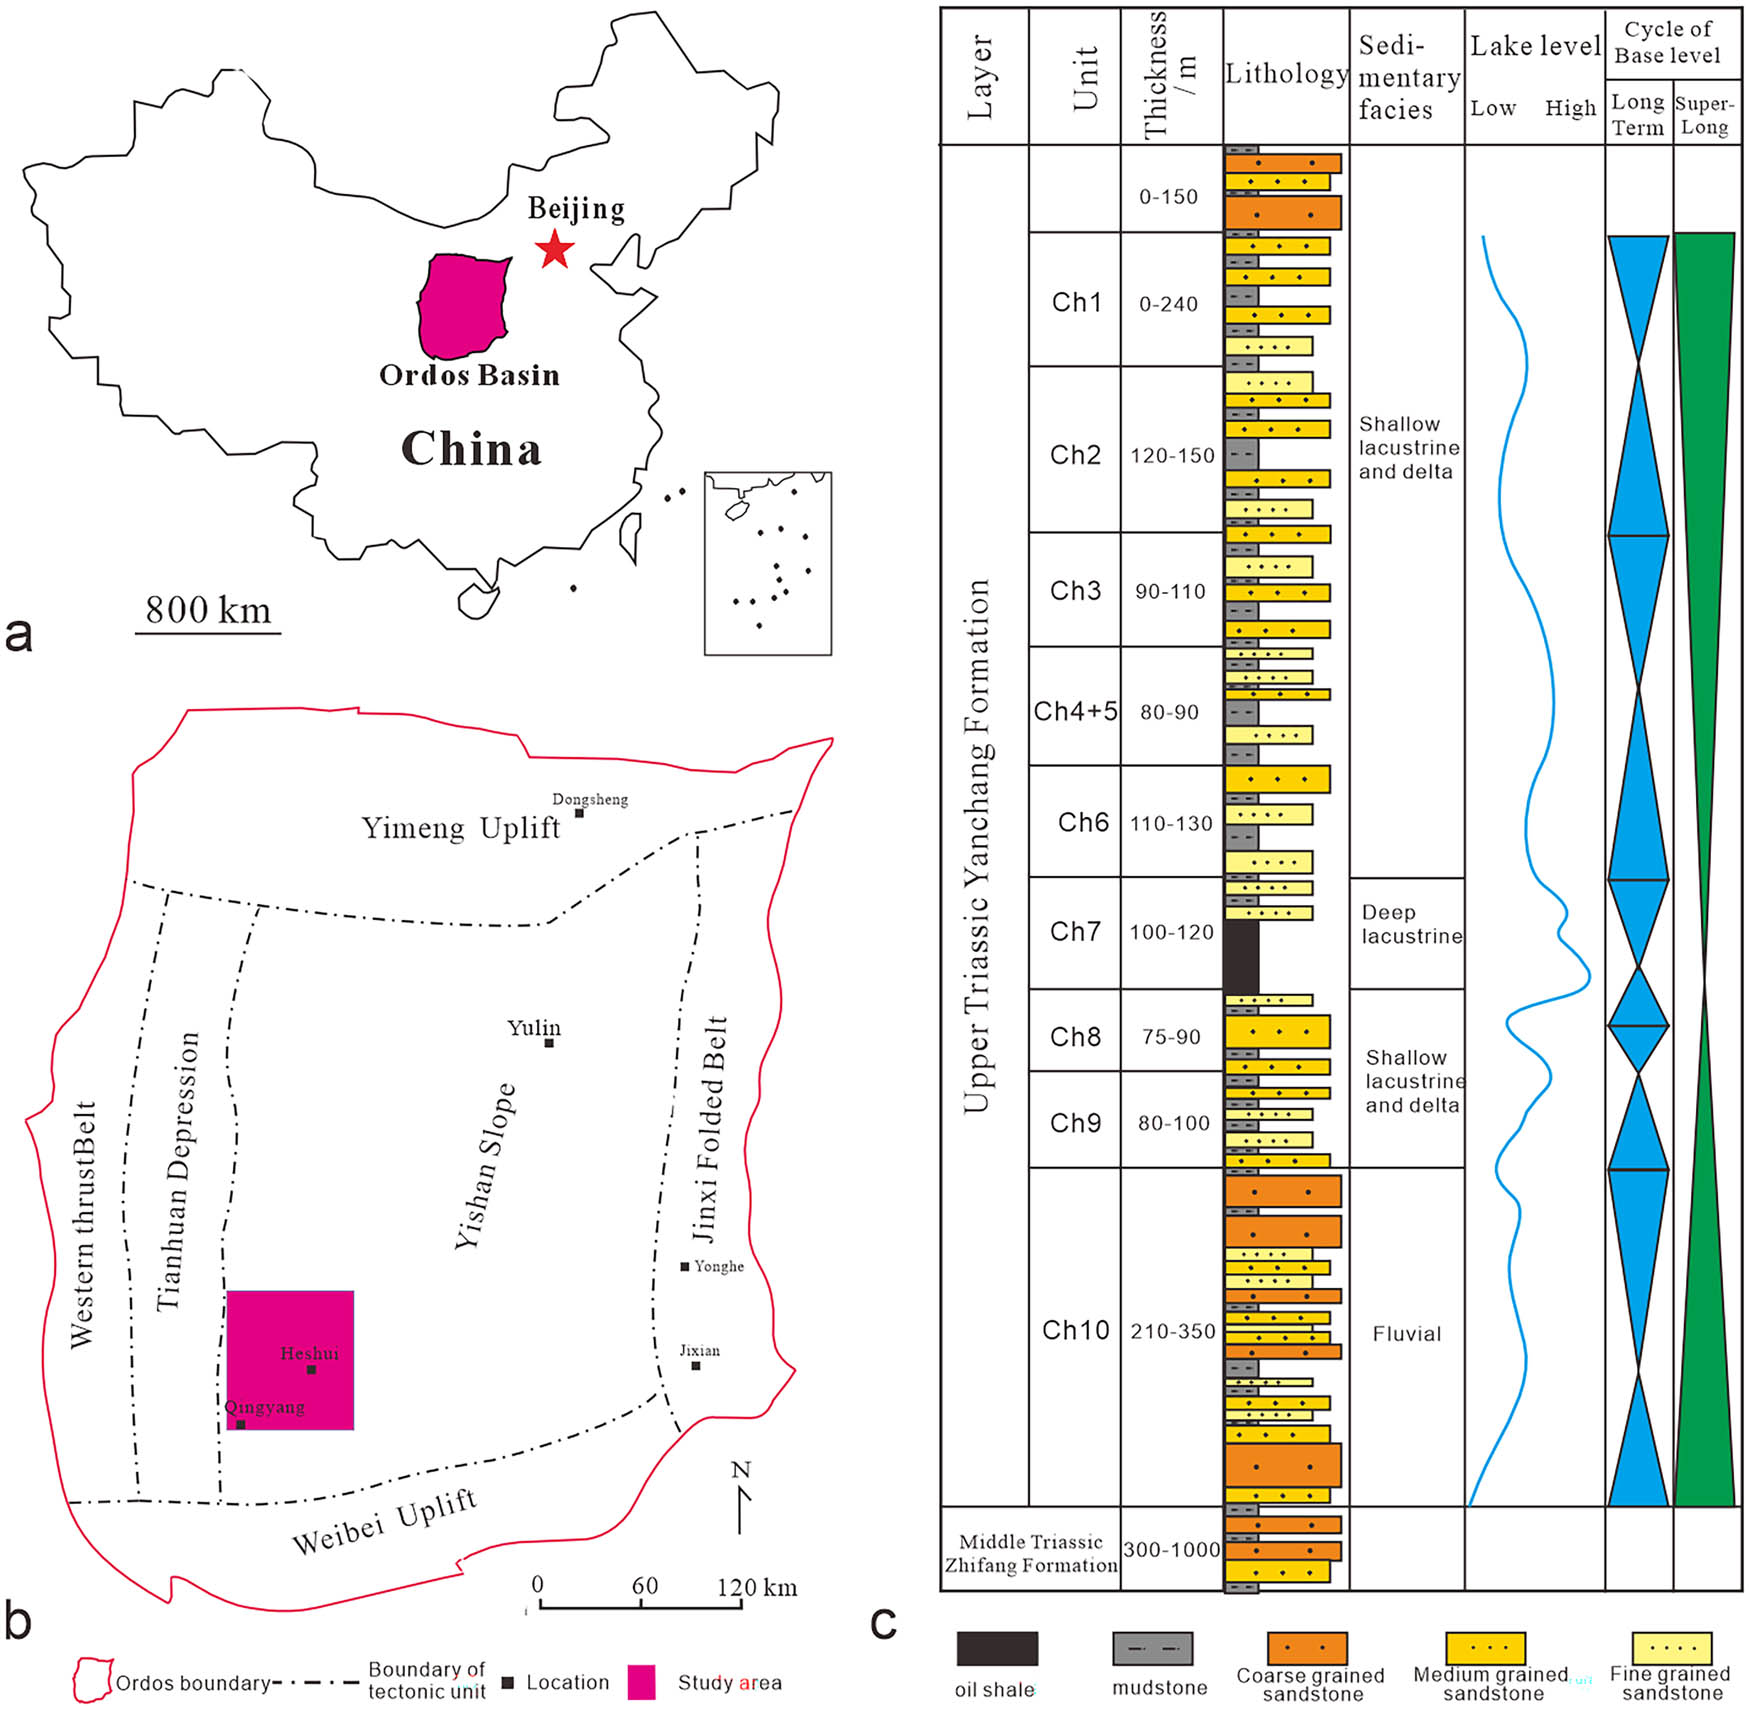
(a) Map showing the location of the Ordos Basin within China. (b) Tectonic division of the Ordos Basin. (c) Sequence stratigraphic column of the Upper Triassic Yanchang Formation in the Ordos Basin. Ch = Chang.
Since the 1990s, the Ordos Basin has been a key region for lacustrine oil and gas exploration, particularly the Yanchang Formation from the Late Triassic, which is one of the most important oil-bearing formations in the basin. Due to its dense reservoir and relatively flat structure, the oil reservoirs are mainly low-permeability lithologic reservoirs [27], characterized by widespread distribution and ubiquitous oil presence in various stratigraphic layers. The Yanchang Formation is subdivided into 10 oil layers from Chang 10 to Chang 1 (Figure 1c). During the deposition of the Chang 7 Member, the lake basin developed to its peak, with the deposition of organic-rich semi-deep lake to deep lake shales, which are the primary source rocks in the basin. The Chang 8 and Chang 6 Members consist of tight sandstone reservoirs adjacent to the source rocks, with favorable oil source conditions, making them the main accumulation zones for low-permeability tight oil. The major oil-bearing intervals in the Heshui region are concentrated in the Yanchang Formation, where high-quality, thick source rocks are found. The Chang 6 to Chang 8 oil layers were deposited in a braided river delta system, resulting in thick sandstone reservoirs. Although the permeability of these sandstones is generally lower than 0.1 × 10⁻3 μm2, they exhibit typical ultra-low permeability characteristics [12,22].
3 Samples and methods
Routine core analysis was conducted on 30 samples subjected to net confining stresses of 363 psi (2.5 MPa) and 5,800 psi (40 MPa), respectively. The analysis included parameters such as grain density, porosity, Klinkenberg-corrected permeability, and air permeability. Porosity and permeability were measured using a CMS-300 instrument. Thin section samples were impregnated with blue epifluorescent epoxy to enhance porosity visualization. Additionally, SEM was performed on freshly broken, carbon-coated surfaces to examine pore-throat characteristics.
Nuclear magnetic resonance (NMR) measurements were carried out on a subset of 23 core plug samples to analyze T 2 distributions under both saturated (100% brine) and centrifuged conditions. A MARAN Ultra instrument operating at a proton Lamor frequency of approximately 2 MHz was used. The experiments were conducted at 28°C with a waiting time of 6,000 ms and an echo spacing of 0.2 ms. A minimum signal-to-noise ratio of 100:1 was maintained for the laboratory NMR measurements. Initially, the samples were saturated with synthetic formation brine, and both incremental and cumulative NMR T 2 distributions were recorded. Afterward, the core plug samples underwent centrifugation to remove free movable water, and the resulting NMR T 2 distributions were recorded. The centrifuge operated at 9,000 rpm, corresponding to a capillary pressure of approximately 100 psi. The obtained NMR data enabled the differentiation between capillary-bound water, clay-bound water, and free water.
Finally, HPMI analysis was performed on all 30 core plug samples, each measuring 1.5 inches in diameter and 1 inch in length, at 800 psi (5.5 MPa). The sample depths ranged from 1333.48 to 1875.95 m. A mercury porosimeter with a maximum injection pressure of 55,000 psia (379 MPa) was employed to inject mercury into all accessible pore radii (>0.00196 μm) and measure the volume of mercury that infiltrated the pores. The pore volume associated with each characteristic pore radius was equal to the injected mercury volume (V hg ) at the corresponding capillary pressure.
4 Result
4.1 Physical properties and pore types
In the Yanchang Formation of the study area, the predominant pore types in sandstones are dissolution pores, which form primarily through the leaching of feldspar and rock fragments, followed by residual intergranular pores. Microscopic thin-section analysis reveals that porosity in these sandstones is generally low, with an average porosity typically below 4%. The pore size distribution is primarily between 18 and 113 μm, with the majority of pores falling below 60 μm, classifying them predominantly as micro- to mesopores. The pore morphology is largely tubular in nature, suggesting a relatively low degree of pore development and a dominant pore-throat type characterized by low variation (Figure 2) [28,29].
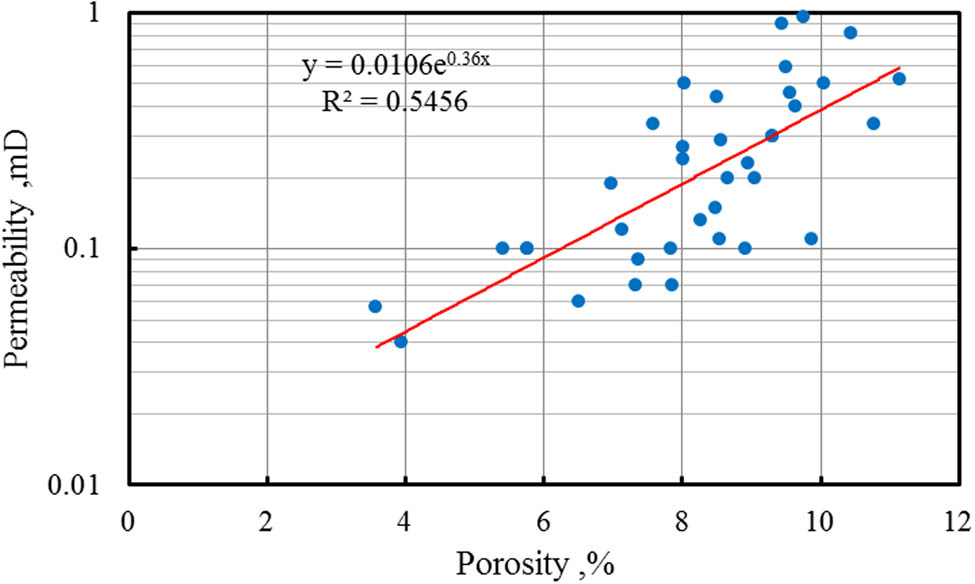
Porosity–permeability correlation plot.
The physical characteristics of the sandstones are marked by ultra-low porosity and permeability. Porosity values range from 0.52 to 13.5%, with a normal distribution observed across the dataset and a peak range concentrated between 6 and 10%. Permeability values span from 0.0006 to 21.5940 mD, with an average permeability of approximately 0.1 mD. The most frequent permeability range lies between 0.01 and 0.1 mD. Notably, a strong exponential correlation exists between porosity and permeability, which is consistent with prior studies [30,31].
4.2 Pore structure characteristics and fractal dimensions from HPMI
The internal structure of rocks forms a three-dimensional network containing complex pores and throats. In samples from the Yanchang Formation reservoir, the majority of sandstone samples exhibit high sorting coefficients and skewness, while their coefficients of variation are relatively low. This suggests a poor relationship between the pore-throat ratio, with micropores predominating. Furthermore, the maximum mercury saturation typically ranges from 50 to 95%, with an average value exceeding 65%. Although samples with better physical properties generally exhibit higher mercury injection saturation, most samples demonstrate mercury withdrawal efficiencies of less than 50%, indicating poor connectivity within the pore systems of the Yanchang Formation sandstones [32].
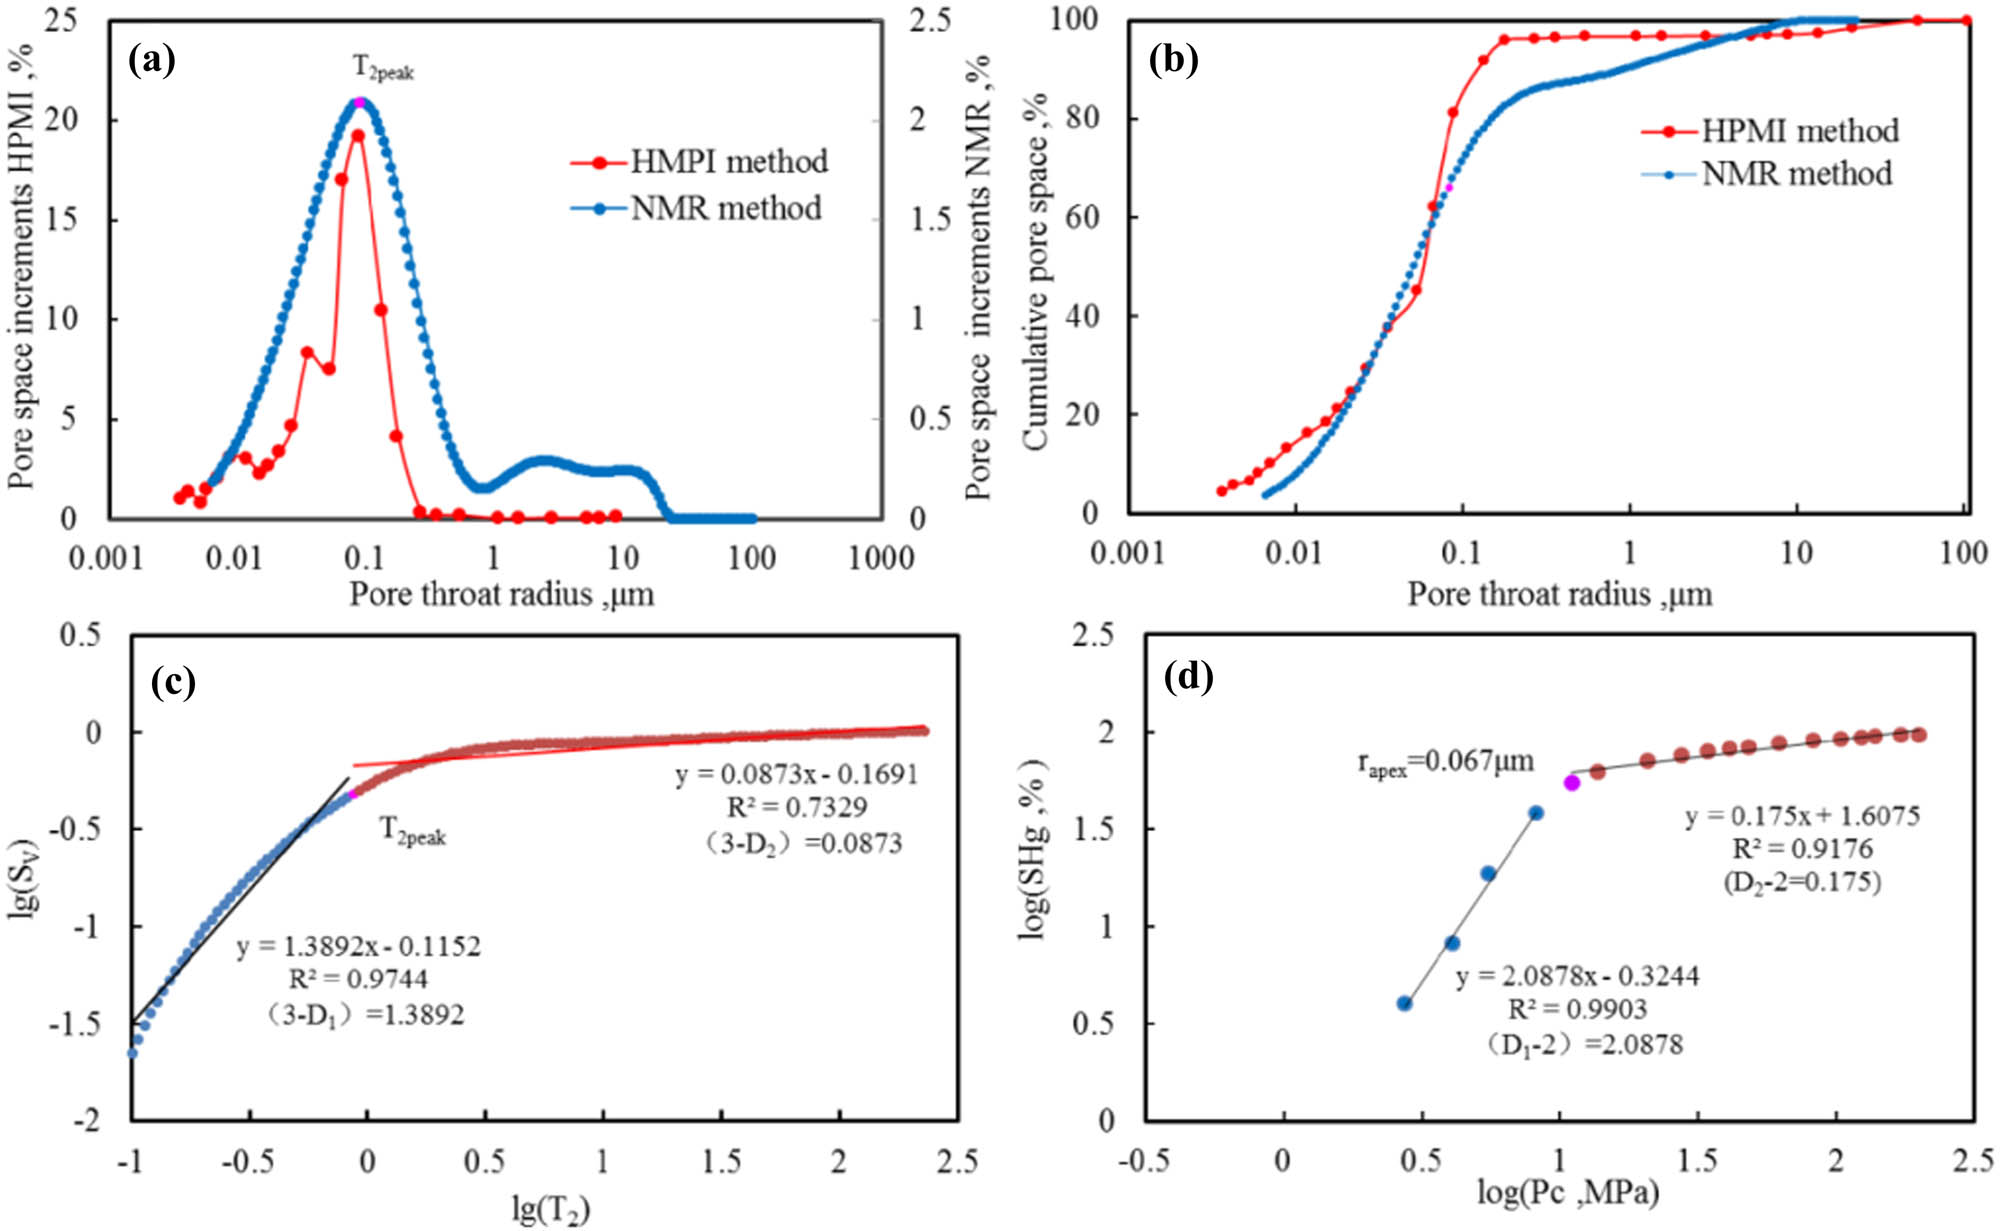
Pittman [33] identified the point of intersection of the hyperbolic curve in the capillary pressure vs mercury saturation curve as the radius corresponding to r apex (Figure 3a and b), termed “r apex” in his model. This parameter serves as a boundary between well-connected large pores and poorly connected small pores. Large pores, with diameters greater than r apex, contribute significantly to permeability. Although pores with radii greater than r apex account for only a small fraction (54.83%) of the total mercury saturation (S Hg) (Figure 3c), they contribute up to 94.45% to permeability (Figure 3d). The contribution of different pore types to permeability varies, with primary intergranular pores connected by larger throats making a significant contribution, whereas clay-dominated micropores connected by smaller throats contribute less to permeability [33,34,35].
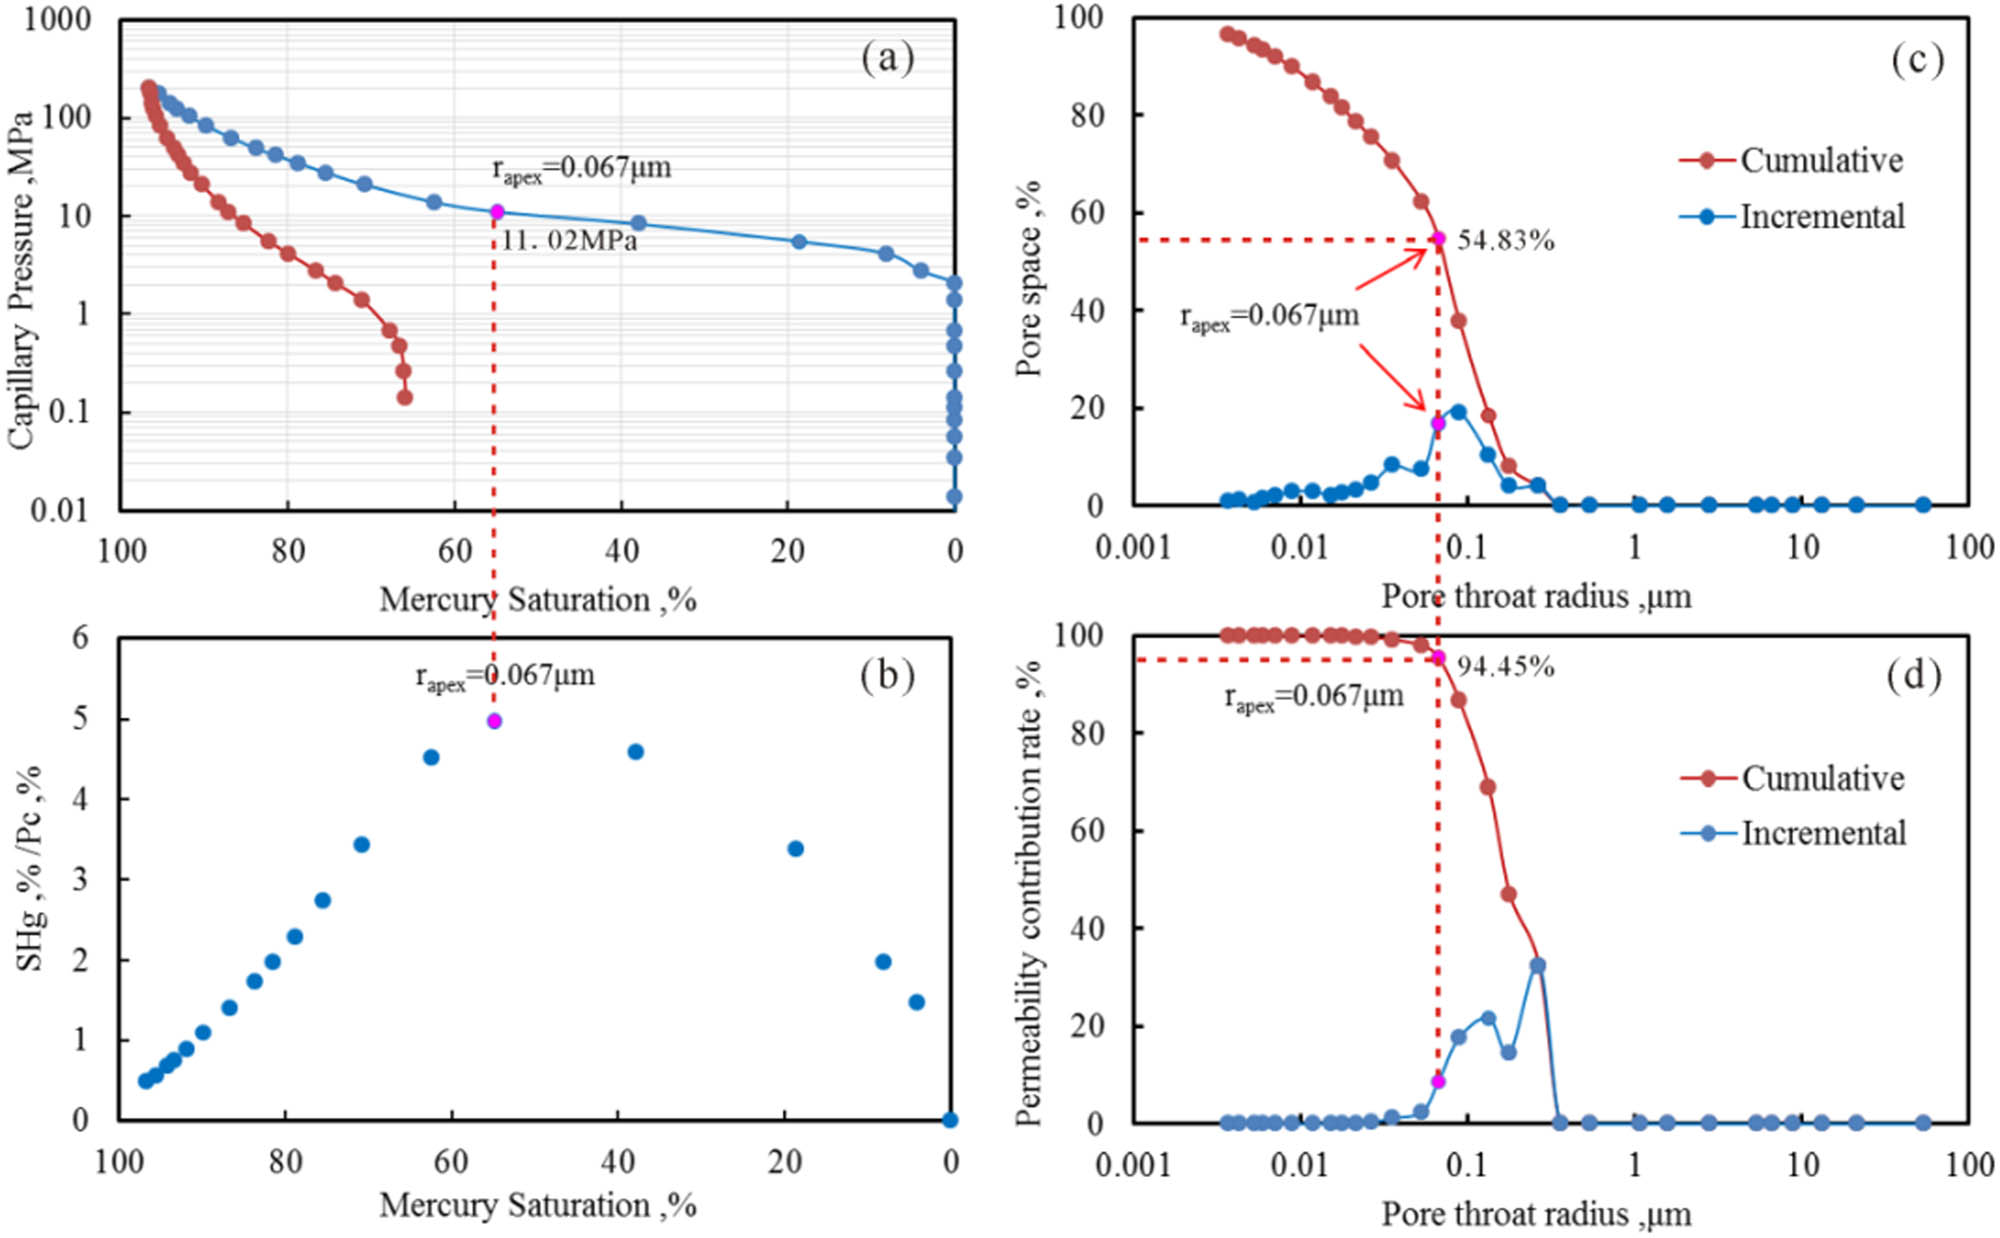
Characterization of mercury injection pressure curves.
Using experimental data such as SEM and thin section analysis, scientists both in the UK and abroad have found that the micropore structure exhibits statistical self-similarity. Thus, fractal theory can be used to quantify the complexity of reservoir pores and fractures. The internal pore structure of porous rocks typically exhibits non-integer dimensionality, with the ideal fractal dimension being between 2 and 3. A fractal dimension closer to 2 indicates a higher degree of homogeneity in the pore-throat system, whereas a dimension closer to 3 indicates greater heterogeneity. Consequently, a higher fractal dimension suggests a more complex pore structure and greater reservoir heterogeneity [36].
Using experimental data from techniques such as SEM and thin section analysis, both domestic and international researchers have observed that the micropore structure of rocks exhibits statistical self-similarity. Consequently, fractal theory can be applied to quantify the complexity of reservoir pores and fractures. The internal pore structure of porous rocks typically displays non-integer dimensionality, with the ideal fractal dimension ranging between 2 and 3. A fractal dimension closer to 2 indicates a higher degree of homogeneity within the pore-throat system, whereas a dimension closer to 3 suggests greater heterogeneity. Therefore, a higher fractal dimension corresponds to a more complex pore structure and increased reservoir heterogeneity.
According to the principle of fractal geometry, the number of pores N(r) with a pore throat radius greater than r in the reservoir follows a powerful relationship with the pore throat radius r:
The fractal dimension is commonly derived using the piezomercury curve through either the capillary approximation method or the modified iterative fractal algorithm (MIFA) method. The capillary approximation method assumes that the pore throat satisfies the conditions r min ≪ r max and r min ≪ r, where r min is the smallest pore-throat radius, r max is the largest pore-throat radius, and r represents the characteristic radius at a given pressure step. While this assumption is reasonable for high-permeability reservoirs, it does not accurately reflect the complex pore-throat systems of low-permeability tight sandstone reservoirs. In these reservoirs, the pore-throat size distribution is often more uniform, and deviations from the assumed conditions can lead to significant inaccuracies in the calculated fractal dimensions. Consequently, the results obtained using the capillary approximation method often fail to represent the true pore-throat distribution characteristics of tight sandstone reservoirs.
To address these limitations, the MIFA method is adopted in this study. Unlike the capillary approximation method, the MIFA method does not impose strict assumptions on the pore-throat size relationship. Instead, it iteratively calculates fractal dimensions by integrating the entire pore-throat size distribution, offering a more accurate representation of the fractal characteristics in low-permeability reservoirs. This approach is particularly suitable for the Yanchang Formation, where the pore systems exhibit significant heterogeneity and complex connectivity patterns.
Modeling of parallel capillary bundles based on pore structure:
From the above two equations, we obtain:
From the transformation, we get
Then, the saturation of the mercury supply is:
Taking the logarithm of both sides of the above equation gives:
The fractal dimension D can be determined from the slope of the regression line.
Using r apex as the demarcation point between large, well-connected pores and smaller, poorly connected ones, we can calculate the fractal characteristics of different pore types. In the study area, the sandstone exhibits three typical pore structure characteristics:
The fractal dimension (D) can be determined from the slope of the regression line derived from the logarithmic relationship between capillary pressure and pore throat radius. By using r apex as the demarcation point between well-connected large pores and poorly connected small pores, it is possible to calculate the fractal characteristics of different pore types. This approach provides a quantitative framework to analyze pore heterogeneity in sandstone reservoirs. In the study area, three typical pore structure types were identified:
Type A: The pore space is primarily composed of primary intergranular pores and dissolution pores (Figure 4c). These pores are characterized by low displacement pressure, typically less than 1.5 MPa, and a relatively large r apex, exceeding 0.15 μm. The corresponding Pcapex (capillary pressure at r apex) is approximately 4.1 MPa (Figure 4a). The fractal dimension for the large pore fraction ranges from 4.12 to 4.63 (Figure 4b and Table 1), reflecting relatively high pore connectivity and low heterogeneity. This pore structure type is commonly associated with better reservoir quality, as large, well-connected pores dominate fluid flow pathways.
Type B: The pore space primarily consists of secondary dissolution pores, supplemented by a few primary intergranular pores (Figure 4f). The displacement pressure ranges from 1.3 to 2.05 MPa, indicating moderate pore connectivity. The r apex is approximately 0.13 μm, with Pcapex around 5.5 MPa (Figure 4e). The fractal dimension for the large pore fraction ranges from 3.78 to 4.32 (Table 1), indicating increased heterogeneity compared to Type A. This type is often found in transitional zones, where diagenesis modifies the primary pore network but does not completely occlude fluid flow pathways.
Type C: The pore space is predominantly composed of secondary dissolution pores with smaller pore diameters and the highest displacement pressures (Figure 4i), typically greater than 2 MPa. The r apex ranges between 0.07 and 0.09 μm, with corresponding Pcapex values between 8.26 and 11 MPa (Figure 4g). The fractal dimension for the large pore fraction ranges from 3.68 to 4.29 (Figure 4h and Table 1), suggesting significant pore heterogeneity and poor connectivity. This type is typically associated with highly compacted or cemented sandstone intervals, where diagenetic processes have drastically reduced pore size and connectivity.
Comparison of test parameters and fractal characteristics of sandstone mercury compression tests
| Well | Depth (m) | Core analysis data | HPMI method | |||||||
|---|---|---|---|---|---|---|---|---|---|---|
| Porosity (%) | Permeability (mD) | Pc (MPa) | Pcapex (MPa) | r apex (μm) | Mesopores | Micropores | Entire pores | Pore structure type | ||
| D 1 | D 2 | D | ||||||||
| N124 | 1801.6 | 8.50 | 0.440 | 1.36 | 4.13 | 0.18 | 4.63 | 2.14 | 3.38 | A |
| N42 | 1572.3 | 8.49 | 0.149 | 1.36 | 4.12 | 0.18 | 4.12 | 2.18 | 3.15 | A |
| N213 | 1753 | 5.77 | 0.100 | 1.36 | 5.50 | 0.13 | 3.78 | 2.24 | 3.01 | B |
| B4 | 1710 | 9.30 | 0.300 | 1.37 | 5.50 | 0.13 | 3.91 | 2.24 | 3.07 | B |
| N185 | 1333.5 | 9.06 | 0.200 | 2.05 | 5.50 | 0.13 | 4.32 | 2.25 | 3.29 | B |
| L20 | 1562.9 | 8.01 | 0.240 | 2.74 | 11.02 | 0.07 | 3.68 | 2.25 | 2.96 | C |
| N124 | 1803 | 8.66 | 0.200 | 2.75 | 8.26 | 0.09 | 4.29 | 2.24 | 3.27 | C |
| N142 | 1697 | 9.50 | 0.590 | 2.75 | 8.26 | 0.09 | 4.12 | 2.18 | 3.15 | C |
| N124 | 1843.2 | 7.85 | 0.070 | 2.75 | 11.02 | 0.07 | 4.09 | 2.18 | 3.13 | C |
| N142 | 1695.4 | 8.04 | 0.500 | 2.05 | 8.26 | 0.09 | 4.10 | 2.21 | 3.16 | C |
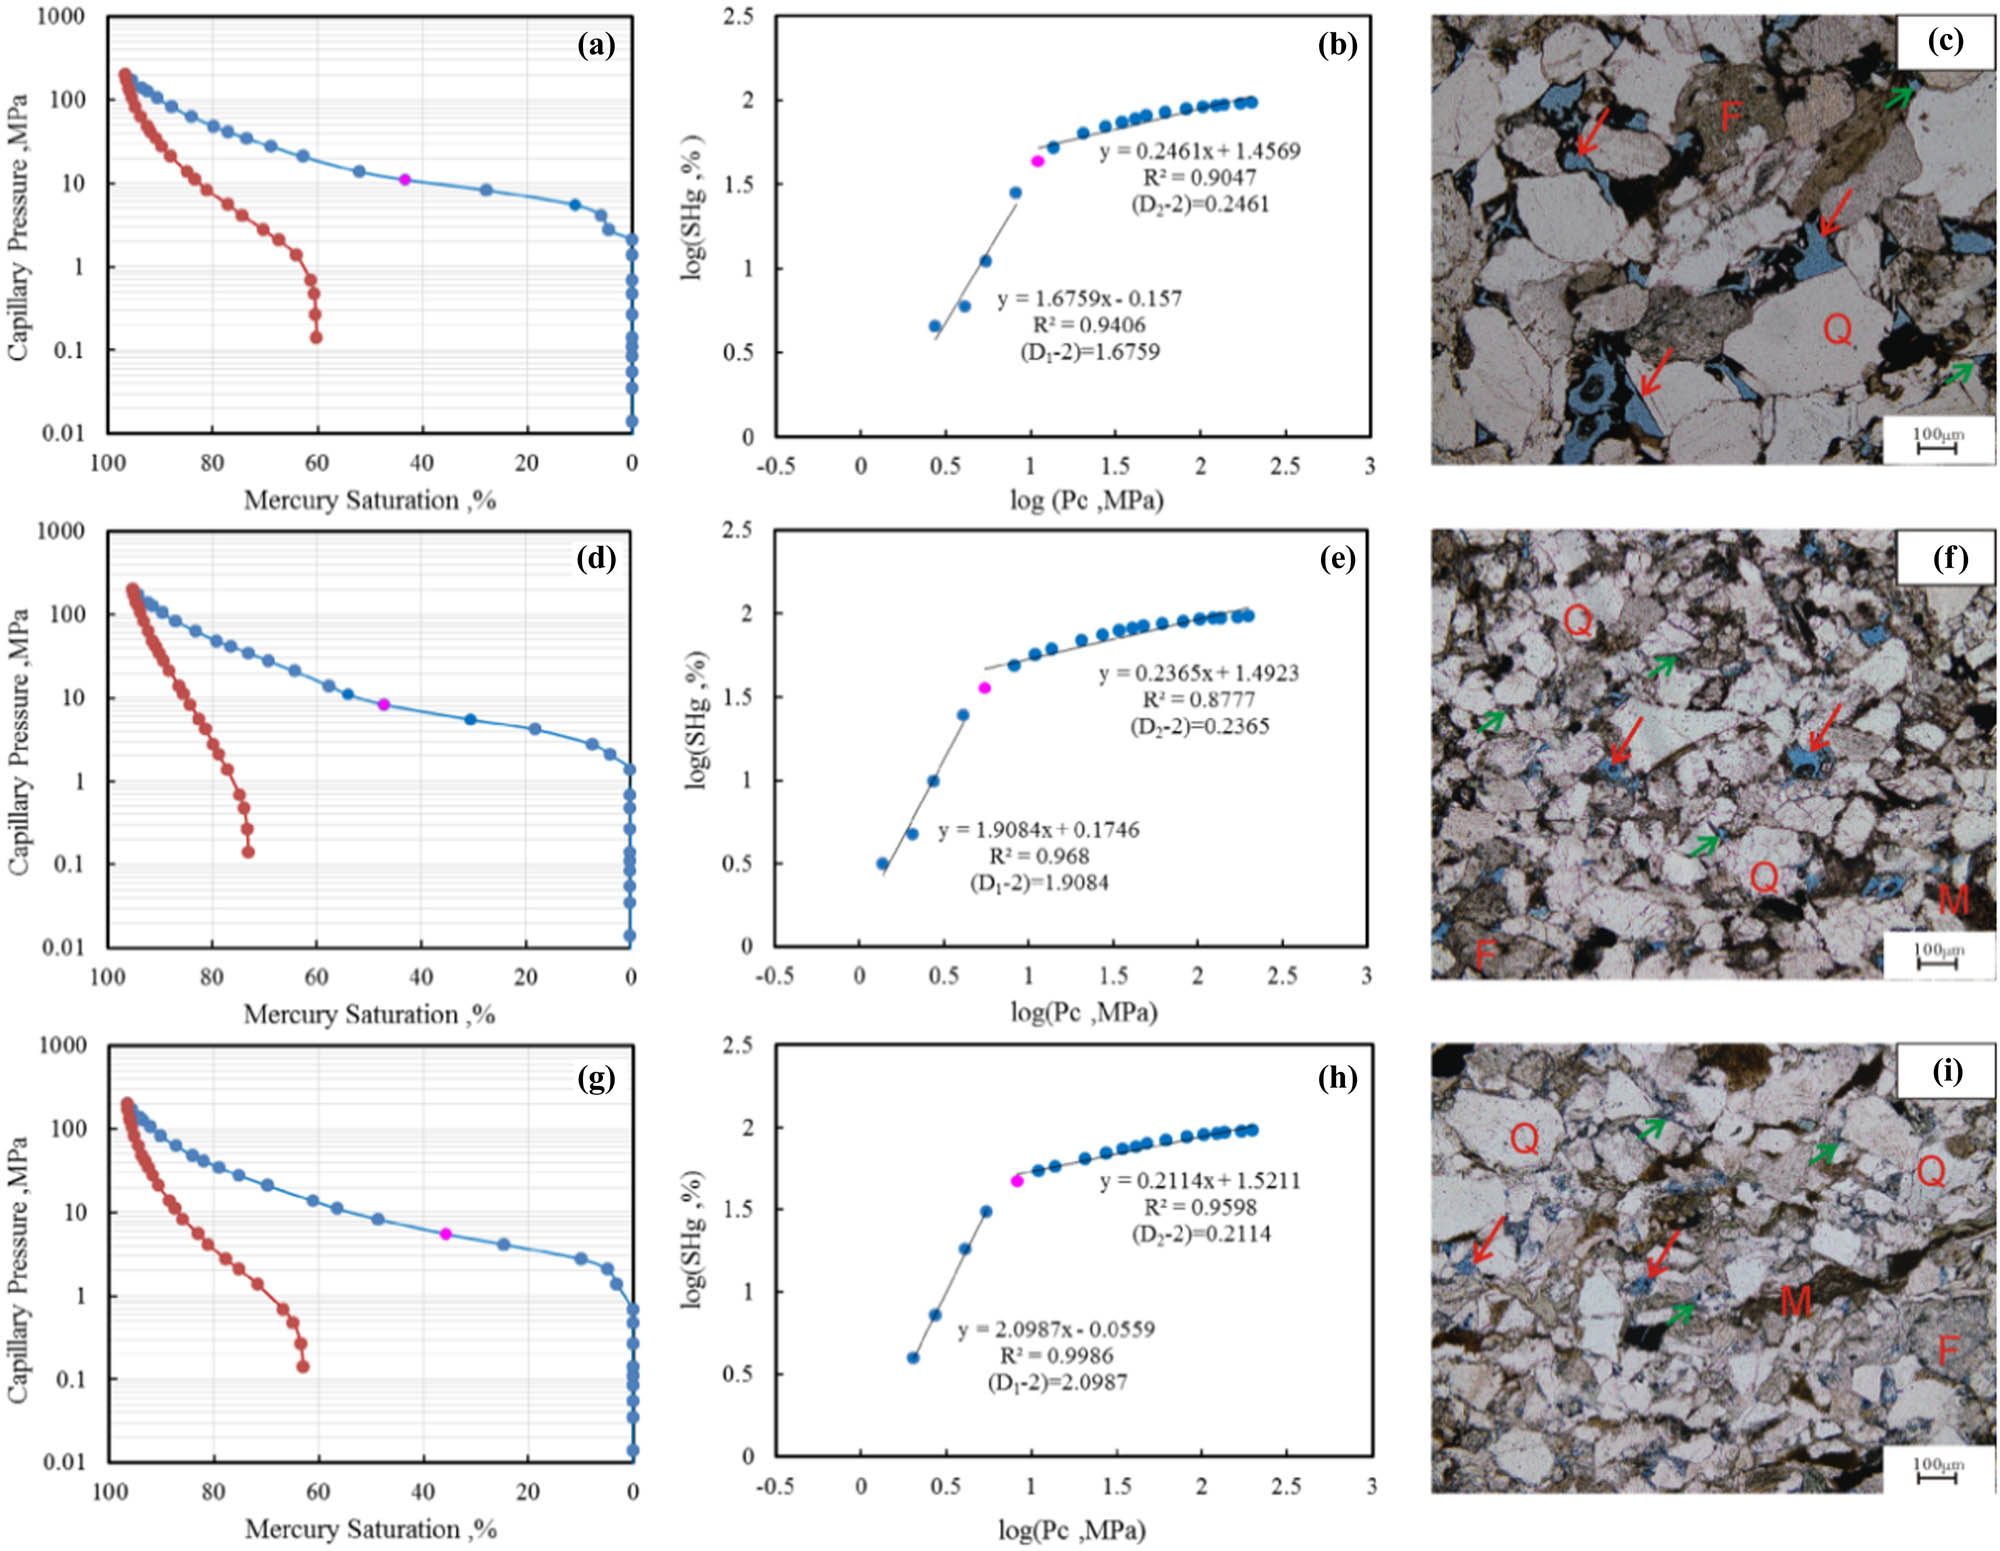
Comparison of fractal characteristics of mercury injection curves and microscopic pore structures for three typical pore types.
The fractal dimensions for the small pore fractions (r < r apex) across all pore structure types are concentrated within a narrow range of 2.18–2.25 (Table 1), reflecting a relatively high degree of homogeneity. This indicates that the small pore fractions are less influenced by diagenetic variability. In contrast, the fractal dimensions for the large pore fractions exhibit notable variation, which fundamentally contributes to the differences in pore system heterogeneity among the three pore structure types.
Recent studies [21,37] have emphasized that the variability in fractal dimensions for large pore fractions is primarily driven by differences in depositional environments and subsequent diagenetic alterations. For example, sandstones deposited in high-energy environments tend to preserve better pore connectivity (Type A), while those subjected to extensive cementation or dissolution processes (Type C) exhibit significant reductions in pore size and connectivity. Moreover, the correlation between r apex and permeability has been validated as a robust indicator of reservoir quality, with higher r apex values corresponding to improved fluid flow properties [38].
This analysis highlights the critical role of fractal geometry in quantifying pore heterogeneity and provides a basis for understanding the interplay between depositional and diagenetic processes in shaping reservoir quality.
4.3 Pore structure characteristics and fractal dimensions from NMR
Nuclear Magnetic Resonance (NMR) experiments exploit the magnetic properties of hydrogen nuclei and their interaction with an external magnetic field. By measuring the amplitude and relaxation rates of the NMR signals from fluids within rock pores, T 2 spectra can be generated [39,40,41]. These T 2 spectra provide insight into the distribution of pore sizes within the reservoir. When coupled with mercury intrusion porosimetry (MIP), NMR allows for a comprehensive characterization of pore size distribution and other pore structure features.
In reservoir rocks, the fluid within the pores can be categorized into two main types: free-moving fluids, which can flow through the pore network, and bound fluids, which are immobilized by capillary forces within the smaller pore throats. By analyzing the relaxation time threshold (T 2 cutoff value) of the fluid within the rock, it is possible to quantify the amounts of movable and bound fluids in the reservoir, providing critical information for evaluating the producibility of hydrocarbons.
To calibrate the T 2 cutoff values for movable fluids in tight sandstone reservoirs, a centrifugal force of 0.689 MPa (100 psi) was applied, in accordance with industry standards. This method enables the differentiation between free and bound fluids by analyzing their distinct relaxation times. Compared to mercury intrusion analysis, which is destructive and primarily used for larger pore sizes, NMR provides a non-destructive alternative that offers a more comprehensive approach. NMR can measure a wider range of pore throat radii, including those in the micropore and mesopore ranges, and thus serves as a powerful tool for characterizing the entire pore structure of a rock sample. Additionally, the relationship between the T 2 relaxation times and the corresponding pore sizes can be used to derive the fractal dimensions of the pore structure. Fractal dimensions offer a quantitative measure of pore heterogeneity and complexity, providing insight into the distribution and connectivity of pore networks. By calculating the fractal dimension from NMR-derived T 2 spectra, it is possible to gain a deeper understanding of the reservoir’s pore architecture and assess its potential for hydrocarbon production. This technique is particularly valuable for tight sandstone reservoirs, where traditional methods may fail to capture the full extent of pore heterogeneity.
This integrated approach using NMR and fractal analysis allows for a more accurate and holistic assessment of pore structure and its implications for reservoir quality and hydrocarbon recovery [39,40].
In rock pores, the T 2 relaxation time of fluids can be expressed by the following equation:
In the equation, (1/T 2) S represents the relaxation contribution from the rock grain surfaces, (1/T 2) B represents the relaxation contribution from the fluid itself, and (1/T 2) D represents the relaxation contribution from molecular diffusion. In the oil and gas industry, bulk relaxation and diffusion relaxation terms are often considered negligible for Nuclear Magnetic Resonance (NMR) studies and applications. The T 2 relaxation time of the fluid is predominantly determined by surface relaxation effects, which are driven by the interactions between the fluid molecules and the rock surface [42]. Surface relaxation is influenced by factors such as the surface area of the rock, the fluid’s viscosity, and the interaction forces at the rock-fluid interface. Consequently, NMR provides a powerful tool for characterizing pore structures, as the surface relaxation time is sensitive to pore geometry, fluid type, and pore surface conditions. Recent studies [39,40] have further emphasized that the contribution of surface relaxation to the overall T 2 relaxation time is particularly significant in low-permeability and tight reservoir rocks, where pore-throat sizes are small, and the surface area-to-volume ratio is high. These characteristics make NMR a valuable technique for evaluating pore structure and fluid distribution in such challenging environments.
A key characteristic of surface relaxation is its relationship with the specific surface area of the rock. The specific surface area, defined as the ratio of the pore surface area to the pore volume in the rock, is inversely correlated with the T 2 relaxation time. Specifically, a larger specific surface area corresponds to a stronger relaxation, resulting in a shorter T 2 relaxation time, and vice versa. Therefore, surface relaxation in rocks can be expressed as:
In the equation, ρ 2 represents the relaxation rate, measured in μm/ms: S/V denotes the specific surface area of the pores, which is related to the pore radius by the expression S/V = F S /r, Here, F S is the pore shape factor (dimensionless), the value of which varies depending on the pore model, the term r stands for the pore radius (μm). Consequently, equation (9) can be expressed as:
In the equation, ρ 2 represents the relaxation rate (μm/ms), S/V denotes the specific surface area of the pores, which is related to the pore radius by the expression S/V = F S /r, where F S is the pore shape factor (dimensionless) that varies with the pore model, and r is the pore radius (μm). Consequently, equation (9) can be rewritten as:
Let 1/ρ 2 F S = C, then the equation simplifies to:
Taking the logarithm of both sides yields:
By adjusting the value of C and comparing the log T 2-log C∼A (NMR T 2 spectrum cumulative distribution) curve with the log r∼S Hg (mercury intrusion pore throat radius cumulative distribution) curve, the error can be calculated and the optimum C value for conversion can be determined.
Several studies have employed NMR T 2 spectra to derive pore size distributions. Notably, mercury intrusion tests often fail to achieve 100% mercury saturation, which may lead to underestimation of pore volume, particularly in fine pores. In contrast, NMR testing, using the vacuum-pressurization saturation method, provides a more comprehensive reflection of nearly all interconnected pore spaces. The macroporous regions measured by both methods generally exhibit similar characteristics, while the mercury intrusion test does not fully saturate smaller pores. Therefore, to reconcile the differences, the cumulative distribution curve from mercury intrusion can be vertically shifted upwards by the percentage of non-intruded pores before performing the conversion.
After performing the conversion calculations, the results from the NMR tests conducted on the reservoir sandstone samples from the study area demonstrated a high degree of consistency with the corresponding pore size distribution data obtained from mercury intrusion porosimetry. This indicates that NMR is capable of effectively capturing the pore size distribution characteristics of the reservoir. Given its non-destructive nature and ability to assess a broader range of pore throat sizes, NMR provides a comprehensive and reliable alternative for characterizing the pore structure, especially in cases where mercury intrusion may have limitations due to incomplete pore saturation.
The T 2 spectrum obtained from NMR measurements can be converted to represent the pore size distribution. The T 2 peak reflects the T 2 value at the highest frequency (peak) on the T 2 spectrum (Figure 5a), thus indicating the primary pore size (Figure 5b) [43]. When conducting fractal studies using mercury intrusion curves, T 2 peak is equivalent to the rapex value in mercury intrusion curves. Comparative analysis shows a high degree of similarity between the fractal characteristics of NMR curves and mercury intrusion curves (Figure 5c and d). In recent years, many researchers have combined NMR with fractal geometry methods to analyze the pore structure of rocks [44,45,46].
Conversion of the NMR T 2 spectrum.
The pore space in the rock is assumed to consist of a series of capillary bundles. The cumulative volume fraction of pores with radii less than r can be described by the following equation:
In contrast to high-pressure mercury intrusion experiments, NMR measurements derive T 2 spectrum information by detecting the spin signals of hydrogen nuclei within the rock’s pores. In larger pores, the transverse relaxation time of the free fluid is relatively longer, while in smaller pores, it is shorter. As a result, NMR experiments are capable of evaluating both the size and distribution of pore spaces within the rock. Assuming the pore system follows a capillary model, consisting of long cylinders with varying pore radii, the transverse relaxation time (T 2) can be expressed as:
Here, ρ is the surface relaxation rate, S/V represents the specific surface area to pore volume ratio, and r is the pore radius. Assuming a constant surface relaxation rate, T 2 is proportional to r, as follows:
Substituting equation (14) into equation (12), we obtain the following expression for the cumulative volume fraction of pores with respect to T 2:
Taking the logarithm of both sides yields:
where T 2 is the transverse relaxation time, ms; V c is the proportion of pore volume corresponding to a T 2 value to the total pore volume; D is the fractal dimension; T 2,max is the maximum transverse relaxation time, ms.
Where T 2 is the transverse relaxation time (ms), V c represents the pore volume fraction corresponding to a specific T 2 value relative to the total pore volume, D is the fractal dimension, and T 2,max is the maximum transverse relaxation time (ms).
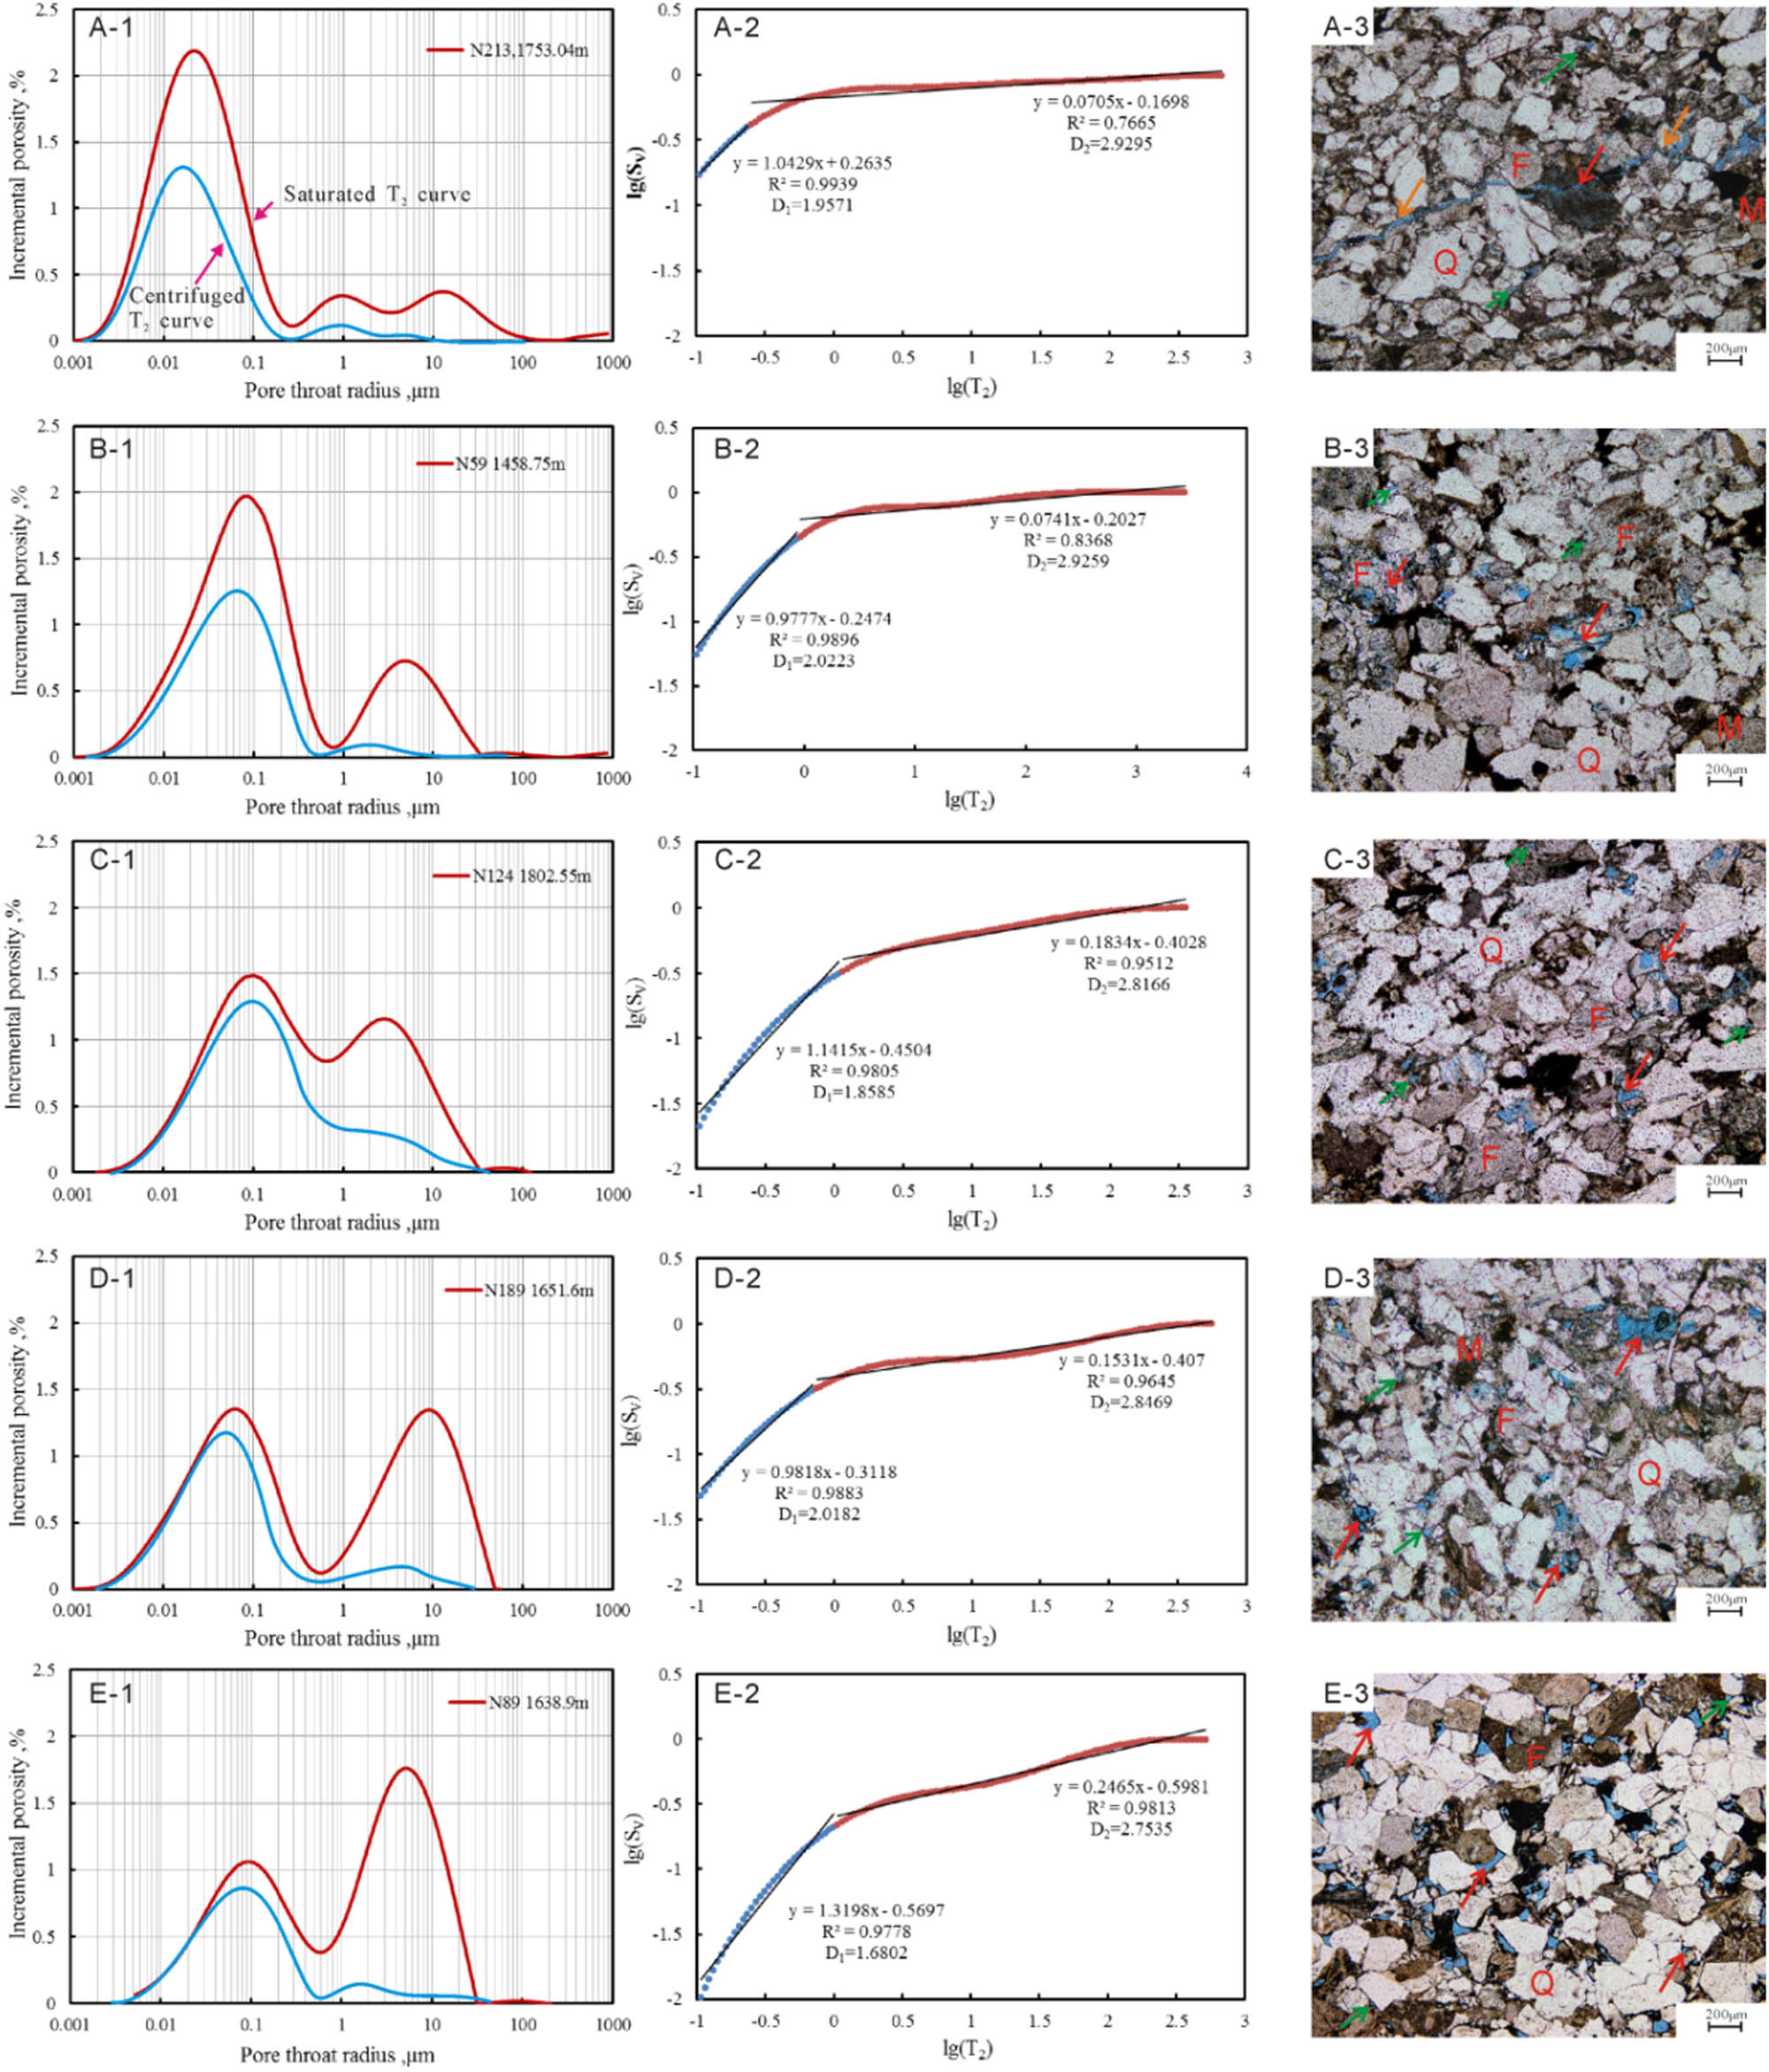
The NMR (T 2) spectrum distribution characteristics can be classified into five major categories based on the peak shapes of the pore sizes, labeled as A, B, and C, which correspond to strong, moderate, and weak pore distribution characteristics, respectively. These distinct categories reflect different pore structure types, as detailed below:
Type A: Exhibits a three-peak A–B–C pattern, with one dominant peak and two smaller peaks, representing three distinct pore size distribution intervals. The dominant pore throat radius primarily ranges from 0.01 to 0.1 μm, accounting for approximately 53.4–66.8% of the total pore volume, with an average of 60.6%. Two additional continuous, gently fluctuating peak intervals are observed in the 0.1–100 μm range, with the 0.1–1 μm interval contributing approximately 19.6% (Figure 6A-1). Microscopic thin sections of this sample type predominantly display microporous structures. The fractal dimension for small pores ranges from 1.62 to 2.2, while for large pores, it ranges from 2.89 to 2.97 (Figure 6A-2), indicating a lower degree of development and relatively high complexity in larger pores (Figure 6A-3). The bound water saturation in these samples is generally high, ranging from 73.86 to 92.77%, with an average of 81.5%. This type typically corresponds to tight reservoirs with good micropore connectivity but limited large-pore development.
NMR Fractal analysis.
Type B: Displays a two-peak A-B pattern, with peaks corresponding to high and moderate pore distributions. The medium to high peak pore throat radius primarily ranges from 0.01 to 0.1 μm, accounting for 31.7–61.7% of the total pore volume, with an average of 48.5%. The low peak pore throat radius falls between 1 and 10 μm, contributing 4.29–22% of the total pore volume, with an average of 13.35%. Pore development in other size intervals is relatively low (Figure 6B-1). The fractal dimension for small pores ranges from 1.64 to 2.7, while for large pores, it ranges from 2.93 to 2.98 (Figure 6B-2), reflecting a low degree of development and relatively high complexity in the large pores (Figure 6B-3). The bound water saturation for this type is high, ranging from 62.97 to 93.15%, with an average of 85.16%. These characteristics suggest a moderately heterogeneous pore structure, with a significant proportion of micropores and mesopores.
Type C: Exhibits a dual-peak A–A continuous pattern, with peaks located at pore throat radii of 0.01–0.1 μm and 1–10 μm. The proportion of pore volume in these intervals ranges from 28 to 35% (Figure 6C-1). The fractal dimensions for small pores range from 1.9 to 2.2, and for large pores, it ranges from 2.85 to 2.91 (Figure 6C-2). The bound water saturation in this type is notably lower, ranging from 56.54 to 81.07%, with an average of 68.04%. This indicates a relatively less connected pore system, with a more homogeneous micropore distribution compared to Type B (Figure 6C-3). Type C reservoirs tend to exhibit poorer permeability and limited fluid mobility, often resulting from high cementation or compaction.
Type D: Displays a dual-peak A-A discontinuous pattern, with similar peak intervals at 0.01–0.1 μm and 1–10 μm. The proportion of pore volume in these intervals is nearly identical, around 23% (Figure 6D-1). The fractal dimensions for small pores range from 1.9 to 2.2, and for large pores, they range from 2.85 to 2.91 (Figure 6D-2). The bound water saturation in this type is lower, ranging from 63.18 to 70.57%, with an average of 66.25%. Type D reservoirs are characterized by a more discontinuous pore structure, suggesting a higher development of large pores in certain intervals (Figure 6D-3). This can lead to higher internal complexity and heterogeneity, making fluid flow more challenging to predict.
Samples of Types C and D exhibit notable differences in pore proportions across different size intervals. While both types share similar proportions in the 0.01–0.1 μm and 1–10 μm intervals, Type C, with its continuous peak pattern, tends to have a higher proportion of pores in the 1–10 μm range, whereas Type D, with its discontinuous peak pattern, shows a higher proportion in the 10–100 μm range. This suggests that, compared to continuous-type samples, discontinuous-type samples have more developed large pores, resulting in greater internal complexity and more large pore structures.
Type E: Shows a dual-peak B–A pattern, characterized by a low-high dual-peak distribution in the T 2 spectrum. The left low peak corresponds to a pore throat radius interval of 0.01–0.1 μm, with the pore volume percentage generally ranging from 20.9 to 30%, averaging around 24.3%. The right high peak spans a wider pore throat radius range, covering the 1–100 μm interval. Within this range, the pore volume percentage for the 1–10 μm interval ranges from 22.7 to 43%, averaging 30.9%, while the 10–100 μm interval ranges from 13 to 40.7%, averaging around 27% (Figure 6E-1). Type E sandstones exhibit a higher proportion of large pore throats, indicating better reservoir potential in terms of permeability and fluid mobility. The fractal dimension of small pores ranges from 1.7 to 2.2, with an average of approximately 1.99, while that of large pores ranges from 2.78 to 2.83, with an average of around 2.8 (Figure 6E-2). Notably, Type E samples exhibit the lowest bound water saturation, typically ranging from 35.98 to 47.02%, with an average of approximately 43.22%. This suggests a relatively low degree of cementation and a more open pore structure, favoring fluid production (Figure 6E-3).
A comparative analysis of the physical properties of four distinct pore structure types in sandstone reveals that Type D sandstones exhibit the highest porosity, with an average value of 10.32%. This is followed by Type E sandstones (9.06%) and Type C sandstones (8.54%). In terms of permeability, Type E sandstones outperform the other types, exhibiting an average permeability of 0.52 mD. Close behind are Type D sandstones, with an average permeability of 0.31 mD. Notably, Type A sandstones, influenced by fracture networks, also show a relatively high permeability, averaging 0.46 mD. These findings suggest that Type E and Type D sandstones possess superior reservoir potential and fluid flow characteristics compared to the other types, particularly in terms of both porosity and permeability, which are critical parameters for evaluating reservoir quality and hydrocarbon recovery efficiency (Table 2).
NMR conversion
| Well | Depth (m) | Core analysis data | NMR method | |||||||
|---|---|---|---|---|---|---|---|---|---|---|
| Porosity (%) | Permeability (mD) | Micropores | Mesopores | Entire pores | Pore structure type | T 2cutoff (ms) | FFI (%) | BVI (%) | ||
| D 1 | D 2 | D | ||||||||
| N19 | 1474.00 | 6.50 | 0.060 | 2.12 | 2.96 | 2.54 | A | 5.21 | 7.23 | 92.77 |
| N59 | 1458.75 | 9.64 | 0.400 | 2.06 | 2.93 | 2.50 | A | 11.5 | 22.57 | 77.43 |
| N78 | 1619.40 | 7.83 | 0.100 | 2.20 | 2.97 | 2.58 | A | 4.2 | 13.55 | 86.46 |
| N124 | 1803.03 | 8.66 | 0.200 | 1.79 | 2.90 | 2.35 | A | 9.6 | 24.91 | 75.09 |
| N124 | 1843.88 | 3.58 | 0.056 | 2.11 | 2.95 | 2.53 | A | 4.26 | 17.21 | 82.79 |
| N141 | 1674.67 | 6.97 | 0.188 | 2.12 | 2.95 | 2.53 | A | 6.53 | 18.37 | 81.64 |
| N142 | 1695.40 | 8.04 | 0.500 | 1.85 | 2.95 | 2.40 | A | 6.04 | 14.38 | 85.62 |
| N142 | 1686.85 | 8.91 | 0.100 | 1.90 | 2.91 | 2.41 | A | 9.97 | 23.09 | 76.91 |
| N142 | 1697.00 | 9.50 | 0.590 | 1.62 | 2.89 | 2.25 | A | 9.05 | 26.14 | 73.86 |
| N213 | 1661.80 | 7.36 | 0.090 | 1.93 | 2.90 | 2.42 | A | 11.45 | 21.29 | 78.71 |
| N213 | 1663.30 | 9.45 | 0.250 | 2.12 | 2.96 | 2.54 | A | 3.15 | 17.57 | 82.43 |
| L20 | 1560.00 | 7.32 | 0.070 | 1.85 | 2.93 | 2.39 | A | 8.75 | 17.04 | 82.96 |
| L35 | 1608.20 | 7.58 | 0.340 | 1.92 | 2.94 | 2.43 | A | 7.04 | 16.80 | 83.20 |
| N51 | 1569.78 | 3.95 | 0.040 | 2.27 | 2.98 | 2.63 | B | 6.95 | 9.94 | 90.06 |
| N89 | 1627.84 | 5.41 | 0.100 | 2.13 | 2.98 | 2.55 | B | 5.88 | 6.86 | 93.15 |
| N89 | 1636.10 | 8.54 | 0.110 | 1.84 | 2.96 | 2.40 | B | 3.47 | 10.29 | 89.71 |
| N89 | 1637.00 | 8.02 | 0.270 | 1.85 | 2.93 | 2.39 | B | 7.5 | 37.03 | 62.97 |
| N124 | 1843.21 | 7.85 | 0.070 | 1.98 | 2.95 | 2.47 | B | 10.2 | 19.84 | 80.16 |
| N185 | 1333.48 | 9.06 | 0.200 | 1.78 | 2.96 | 2.37 | B | 4.15 | 9.76 | 90.24 |
| N213 | 1753.04 | 5.77 | 0.100 | 2.13 | 2.95 | 2.54 | B | 5.95 | 16.06 | 83.94 |
| Z238 | 1775.90 | 8.56 | 0.290 | 1.69 | 2.93 | 2.31 | B | 5.6 | 13.39 | 86.61 |
| L20 | 1562.87 | 8.01 | 0.240 | 1.64 | 2.94 | 2.29 | B | 4.68 | 10.39 | 89.61 |
| N124 | 1800.54 | 8.96 | 0.230 | 1.82 | 2.86 | 2.34 | C | 9.94 | 33.28 | 66.72 |
| N124 | 1801.55 | 8.50 | 0.440 | 1.86 | 2.85 | 2.36 | C | 9.94 | 35.47 | 64.53 |
| N124 | 1803.61 | 7.14 | 0.120 | 1.76 | 2.87 | 2.32 | C | 6.51 | 29.43 | 70.57 |
| N142 | 1696.70 | 9.56 | 0.460 | 1.73 | 2.85 | 2.29 | C | 8.56 | 36.82 | 63.18 |
| B4 | 1710.00 | 9.30 | 0.300 | 1.90 | 2.87 | 2.38 | D | 6.71 | 18.93 | 81.07 |
| N19 | 1465.75 | 11.14 | 0.523 | 2.20 | 2.90 | 2.55 | D | 8.34 | 36.60 | 63.40 |
| N59 | 1463.60 | 10.04 | 0.500 | 2.06 | 2.91 | 2.49 | D | 11.3 | 28.85 | 71.15 |
| N189 | 1651.60 | 10.78 | 0.340 | 2.10 | 2.85 | 2.48 | D | 10.49 | 43.47 | 56.54 |
| N42 | 1572.30 | 8.49 | 0.149 | 2.22 | 2.83 | 2.53 | E | 13.29 | 52.98 | 47.02 |
| N42 | 1581.00 | 8.26 | 0.433 | 2.05 | 2.78 | 2.42 | E | 3.97 | 64.02 | 35.98 |
| N89 | 1638.90 | 10.44 | 0.820 | 1.70 | 2.80 | 2.25 | E | 8.63 | 53.34 | 46.66 |
Recent studies have highlighted the significant role of pore structure in determining reservoir performance, with fracture development and pore connectivity emerging as key factors influencing permeability [21,47]. The higher permeability observed in Type A sandstones is likely due to the influence of fractures, which enhance fluid flow, while the high permeability in Type E sandstones suggests a well-developed macropore network conducive to effective fluid migration.
The NMR testing has revealed distinct segmental characteristics in the pore structure of the sandstone samples. Consistent with previous test results, the small pore region exhibits lower fractal dimensions, while the large pore region displays higher fractal dimensions. This implies that, across all samples, the structure of small pores is relatively homogeneous, whereas the large pores exhibit pronounced heterogeneity due to the complexity of diagenetic history.
The NMR testing has revealed distinct segmental characteristics in the pore structure of the sandstone samples. Consistent with previous test results, the small pore region exhibits lower fractal dimensions, indicating a relatively homogeneous structure. In contrast, the large pore region displays higher fractal dimensions, reflecting a higher degree of heterogeneity. This suggests that, across all samples, the small pores maintain a more uniform distribution, while the large pores exhibit significant variability, likely due to the complex diagenetic history that influences their development and connectivity. These findings align with recent studies [48], which have highlighted the impact of diagenesis on pore heterogeneity, particularly in larger pore spaces where cementation or dissolution processes are more pronounced.
5 Discussion
5.1 Comparison of pore fractal characteristics under different testing methods
With the deepening exploration and development of unconventional oil and gas resources, the characterization of pore structures has gradually transitioned from qualitative to quantitative analysis, evolving from a single-method approach to a combined multi-method strategy, various experimental techniques have inherent limitations in characterizing shale pore structures [49]. Therefore, a comprehensive understanding of reservoir pore characteristics often requires the integration of multiple methods.
High-pressure mercury intrusion (HPMI) operates by applying external pressure to force mercury, a non-wetting fluid, into the core sample to obtain parameters such as pore throat radius. Although the method can reach a maximum intrusion pressure of 400 MPa (corresponding to a 3-nm pore throat), high pressures may potentially damage the pore structure of sandstone [50]. In contrast, low-field NMR technology is non-destructive, enabling rapid, non-invasive measurements of hydrogen nucleus relaxation times in the pore space, which helps reveal the distribution of pores, however, it requires proper calibration [51,52].
Due to its higher accuracy and wider pore throat range, HPMI is widely used in pore structure characterization. Compared to HPMI, NMR has the advantage of quantitatively evaluating free fluid and bound fluid, particularly in fluid flow characterization.
Since the late twentieth century, Mandelbrot’s fractal theory has been extensively applied to characterize the heterogeneity of reservoir pore structures [9]. Research has shown that, within certain pore size ranges, the pore space in tight sandstone exhibits self-similarity, a phenomenon known as “scale invariance.” Fractal dimensions can effectively characterize pore structures across a broader range of pore sizes. Additionally, the roughness of the pore-rock interface plays a crucial role in pore structure. When rough pore surfaces protrude into the pore space, the pore surface exhibits three-dimensional characteristics, leading to the similarity of surface fractal dimension and volume fractal dimension. This geometric structure significantly influences fluid storage and migration.
However, limited research has focused on the fractal characteristics of HPMI and NMR, and there is a lack of comparative studies on their fractal dimensions. Based on the experimental principles of HPMI and NMR, this study applies fractal theory to analyze the pore throat fractal characteristics of ultra-low permeability reservoirs and explores the relationship between the fractal dimensions of reservoir pore structures and reservoir properties, pore parameters, and mineral composition.
Recent theoretical advances in pore fractal structures have further underscored the critical role of surface roughness at the pore-rock interface in determining pore characteristics. When rough pore surfaces extend into the pore space, the surfaces exhibit three-dimensional spatial characteristics, leading to the equivalence of surface and volume fractal dimensions in the pores. This highlights the intricate relationship between surface properties and the overall geometric structure of the pore space. These characteristics directly influence fluid storage and migration, which are reflected in rock porosity and permeability.
In both high-pressure mercury intrusion (HPMI) testing and NMR testing, fractal parameters of small and large pores are often demarcated by critical thresholds such as r apex [45] and T 2peak [43], which are used to distinguish well-connected large pores from poorly connected small pores. By utilizing these thresholds, fractal dimensions for different pore types can be effectively calculated, offering insights into the complexity and heterogeneity of pore structures.
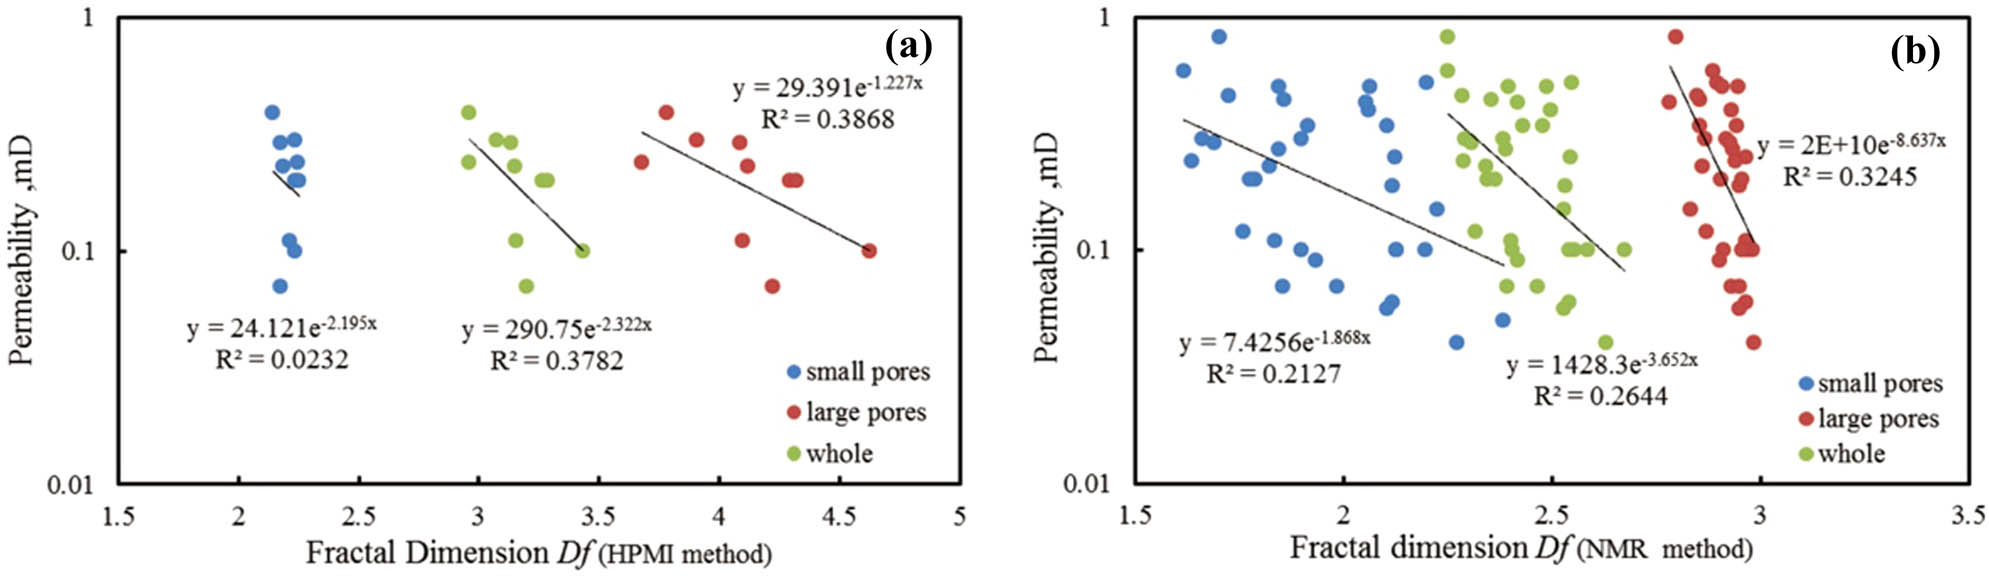
A significant negative correlation between the fractal dimension of high-pressure mercury intrusion pore structures and porosity/permeability has been observed (Figure 6). Specifically, higher fractal dimensions correspond to lower porosity and permeability, indicating that more complex and heterogeneous pore structures often result in reduced fluid flow capacity. These findings are in line with recent studies, such as those by Yu et al. [53], who demonstrated that a higher fractal dimension is associated with a more tortuous and less interconnected pore network, which restricts fluid movement.
Regarding the specific results from HPMI, the fractal dimension for small pores ranges from 2.14 to 2.25, with an average value of 2.21, while large pores exhibit a much higher fractal dimension ranging from 3.68 to 4.63, with an average of 4.10. These values suggest that small pores are relatively simpler in structure, while large pores exhibit greater heterogeneity and complexity, consistent with findings by Anovitz and Cole [18], who observed similar trends across various rock types.
For NMR, the fractal dimension of small pores ranges from 1.62 to 2.27, with an average of 1.95, and for large pores, it ranges from 2.78 to 2.98, with an average of 2.91. These results are notably lower than those obtained from HPMI testing, which may be attributed to the inherent limitations of NMR in fully capturing the finer details of larger pores [54]. Despite these differences, the general trend – lower fractal dimensions for small pores and higher fractal dimensions for large pores – holds, further supporting the reliability of NMR as an effective tool for characterizing pore structures, as also noted by Zhang et al. [55] in their comparison of NMR and mercury intrusion methods.
These results highlight the complementary nature of HPMI and NMR testing. While HPMI provides high-resolution data for large pores, NMR offers a broader, non-destructive overview of pore structure, particularly excelling in detecting small pores and their connectivity. The combined use of both techniques allows for a more comprehensive evaluation of pore morphology and fluid storage capacity, especially in unconventional reservoirs where small and micro-pores play a critical role in overall reservoir performance [54].
In addition to these comparisons, the fractal characteristics derived from NMR and HPMI testing offer deeper insights into the diagenetic history of the rock. For instance, the higher fractal dimension of large pores suggests that these pores may have undergone significant diagenetic alteration, such as dissolution or fracturing, leading to increased heterogeneity. Conversely, the relatively lower fractal dimension of small pores implies a simpler, more uniform structure, often indicative of early diagenetic stages or less complex pore evolution [46].
Moreover, the positive correlation between high fractal dimensions and increased complexity in pore structures aligns with recent findings by Liu et al. [56], who observed that high fractal dimensions in carbonate reservoirs were linked to enhanced heterogeneity and fluid flow resistance. This indicates that, while higher fractal dimensions often correspond to more complex structures, they may not necessarily correlate with better reservoir quality in terms of permeability and flow capacity, as fluid migration can be impeded by tortuosity and disconnected pores.
5.2 The control of permeability characteristics by pore feature variability
Fractal dimension, as a key parameter for measuring pore structure complexity, exerts a significant influence on reservoir permeability. The magnitude of the fractal dimension reflects the connectivity and complexity of the pore network, thereby affecting fluid flow characteristics within it. Studies have demonstrated a significant negative exponential correlation between the fractal dimension of pore structures and permeability. That is, higher fractal dimensions indicate more complex pore structures, leading to reduced reservoir properties and a more pronounced negative impact on permeability [57,58]. In this context, higher fractal dimensions are associated with more intricate pore systems that, although potentially increasing storage capacity, may impede the efficient flow of fluids, thereby affecting overall reservoir productivity.
Through mercury intrusion testing and NMR analysis, it is possible to obtain the fractal dimensions for small pores, large pores, and the total pore system. These two techniques offer complementary insights into pore structure, with mercury intrusion providing a direct measurement of pore size distribution and NMR offering detailed information on fluid distribution and pore connectivity. Correlation analysis of the fractal dimensions obtained from these two methods reveals varying degrees of relationship with permeability. For example, the correlation coefficients between the fractal dimension derived from mercury intrusion testing and permeability are 0.0232 for small pores, 0.03868 for large pores, and 0.3782 for all pores (Figure 7a). Meanwhile, the corresponding coefficients for NMR are 0.2127 for small pores, 0.3245 for large pores, and 0.2644 for the total pore system (Figure 7b). These results highlight that, while both methods provide valuable insights, NMR data tend to show a stronger correlation with permeability, particularly for small and large pores.
Fractal dimension derived from HPMI and NMR analyses.
Notably, the correlation between the fractal dimension of large pores and permeability is stronger than that of small pores. This can be attributed to the fact that small pores generally have more uniform shapes, such as sheet-like or tubular structures, which tend to offer less resistance to fluid flow. In contrast, large pores are often more heterogeneous, containing cementitious material or more complex throat structures that significantly hinder fluid movement [59]. These observations are consistent with previous findings that larger pores tend to exhibit more tortuous flow paths, which further increases flow resistance.
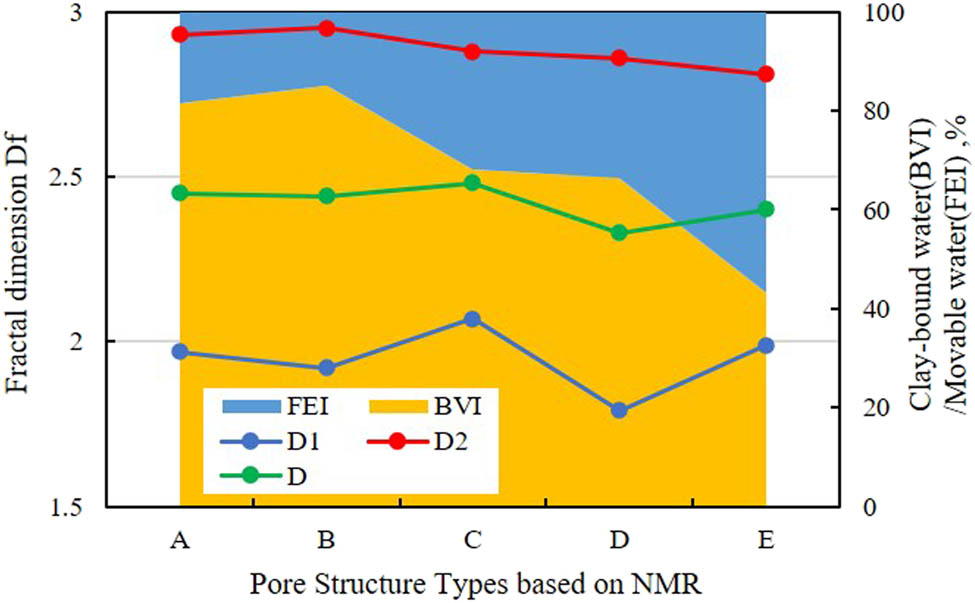
In terms of pore structure types, variations among different sandstone types lead to significant differences in fluid mobility during reservoir development. By combining the classification of sandstone pore structures based on NMR data, we can better understand how the fractal dimensions of different pore types affect fluid flow characteristics. Overall, the average fractal dimension (D1) of small pores across the five sandstone types tends to exceed 1.9, with the lowest value being 1.79. The total pore fractal dimensions follow a similar pattern, with the lowest value being 2.33 (Figure 7). These findings suggest that, regardless of sandstone type, small pores exhibit a relatively low level of complexity, whereas the overall pore system shows moderate to high levels of structural complexity.
The correlation between movable fluid saturation and bound water saturation is most pronounced for large pores. As previously discussed, differences in the fractal characteristics of large pores are the primary factors responsible for variations in pore structure among different sandstone types (Figure 8). Notably, as the fractal dimension of large pores decreases, there is a corresponding significant increase in movable fluid saturation, which can improve the overall productivity of the reservoir.
Pore structure types based on NMR analysis.
The pore-throat structure of the tight sandstone reservoirs in the study area is generally poorly developed. Variations in pore-throat size and type lead to significant heterogeneity in the pore-throat structure. The correlation between the fractal dimensions of small pores (Figure 9a and b), large pores (Figure 9c and d), and total pores (Figure 9e and f) with permeability and movable fluid saturation indicates that, generally, larger fractal dimensions correspond to stronger pore-throat heterogeneity and lower permeability and movable fluid saturation [60]. Among these, the fractal characteristics of large pores have the most significant impact on fluid flow. The correlation coefficients between the fractal dimension of large pores and permeability and movable fluid saturation are 0.3245 (Figure 9c) and 0.7949 (Figure 9d), respectively, with a particularly pronounced effect on movable fluid saturation. Additionally, the correlation between the fractal characteristics of small pores and overall pore structure with permeability is significantly higher than that with movable fluid saturation.
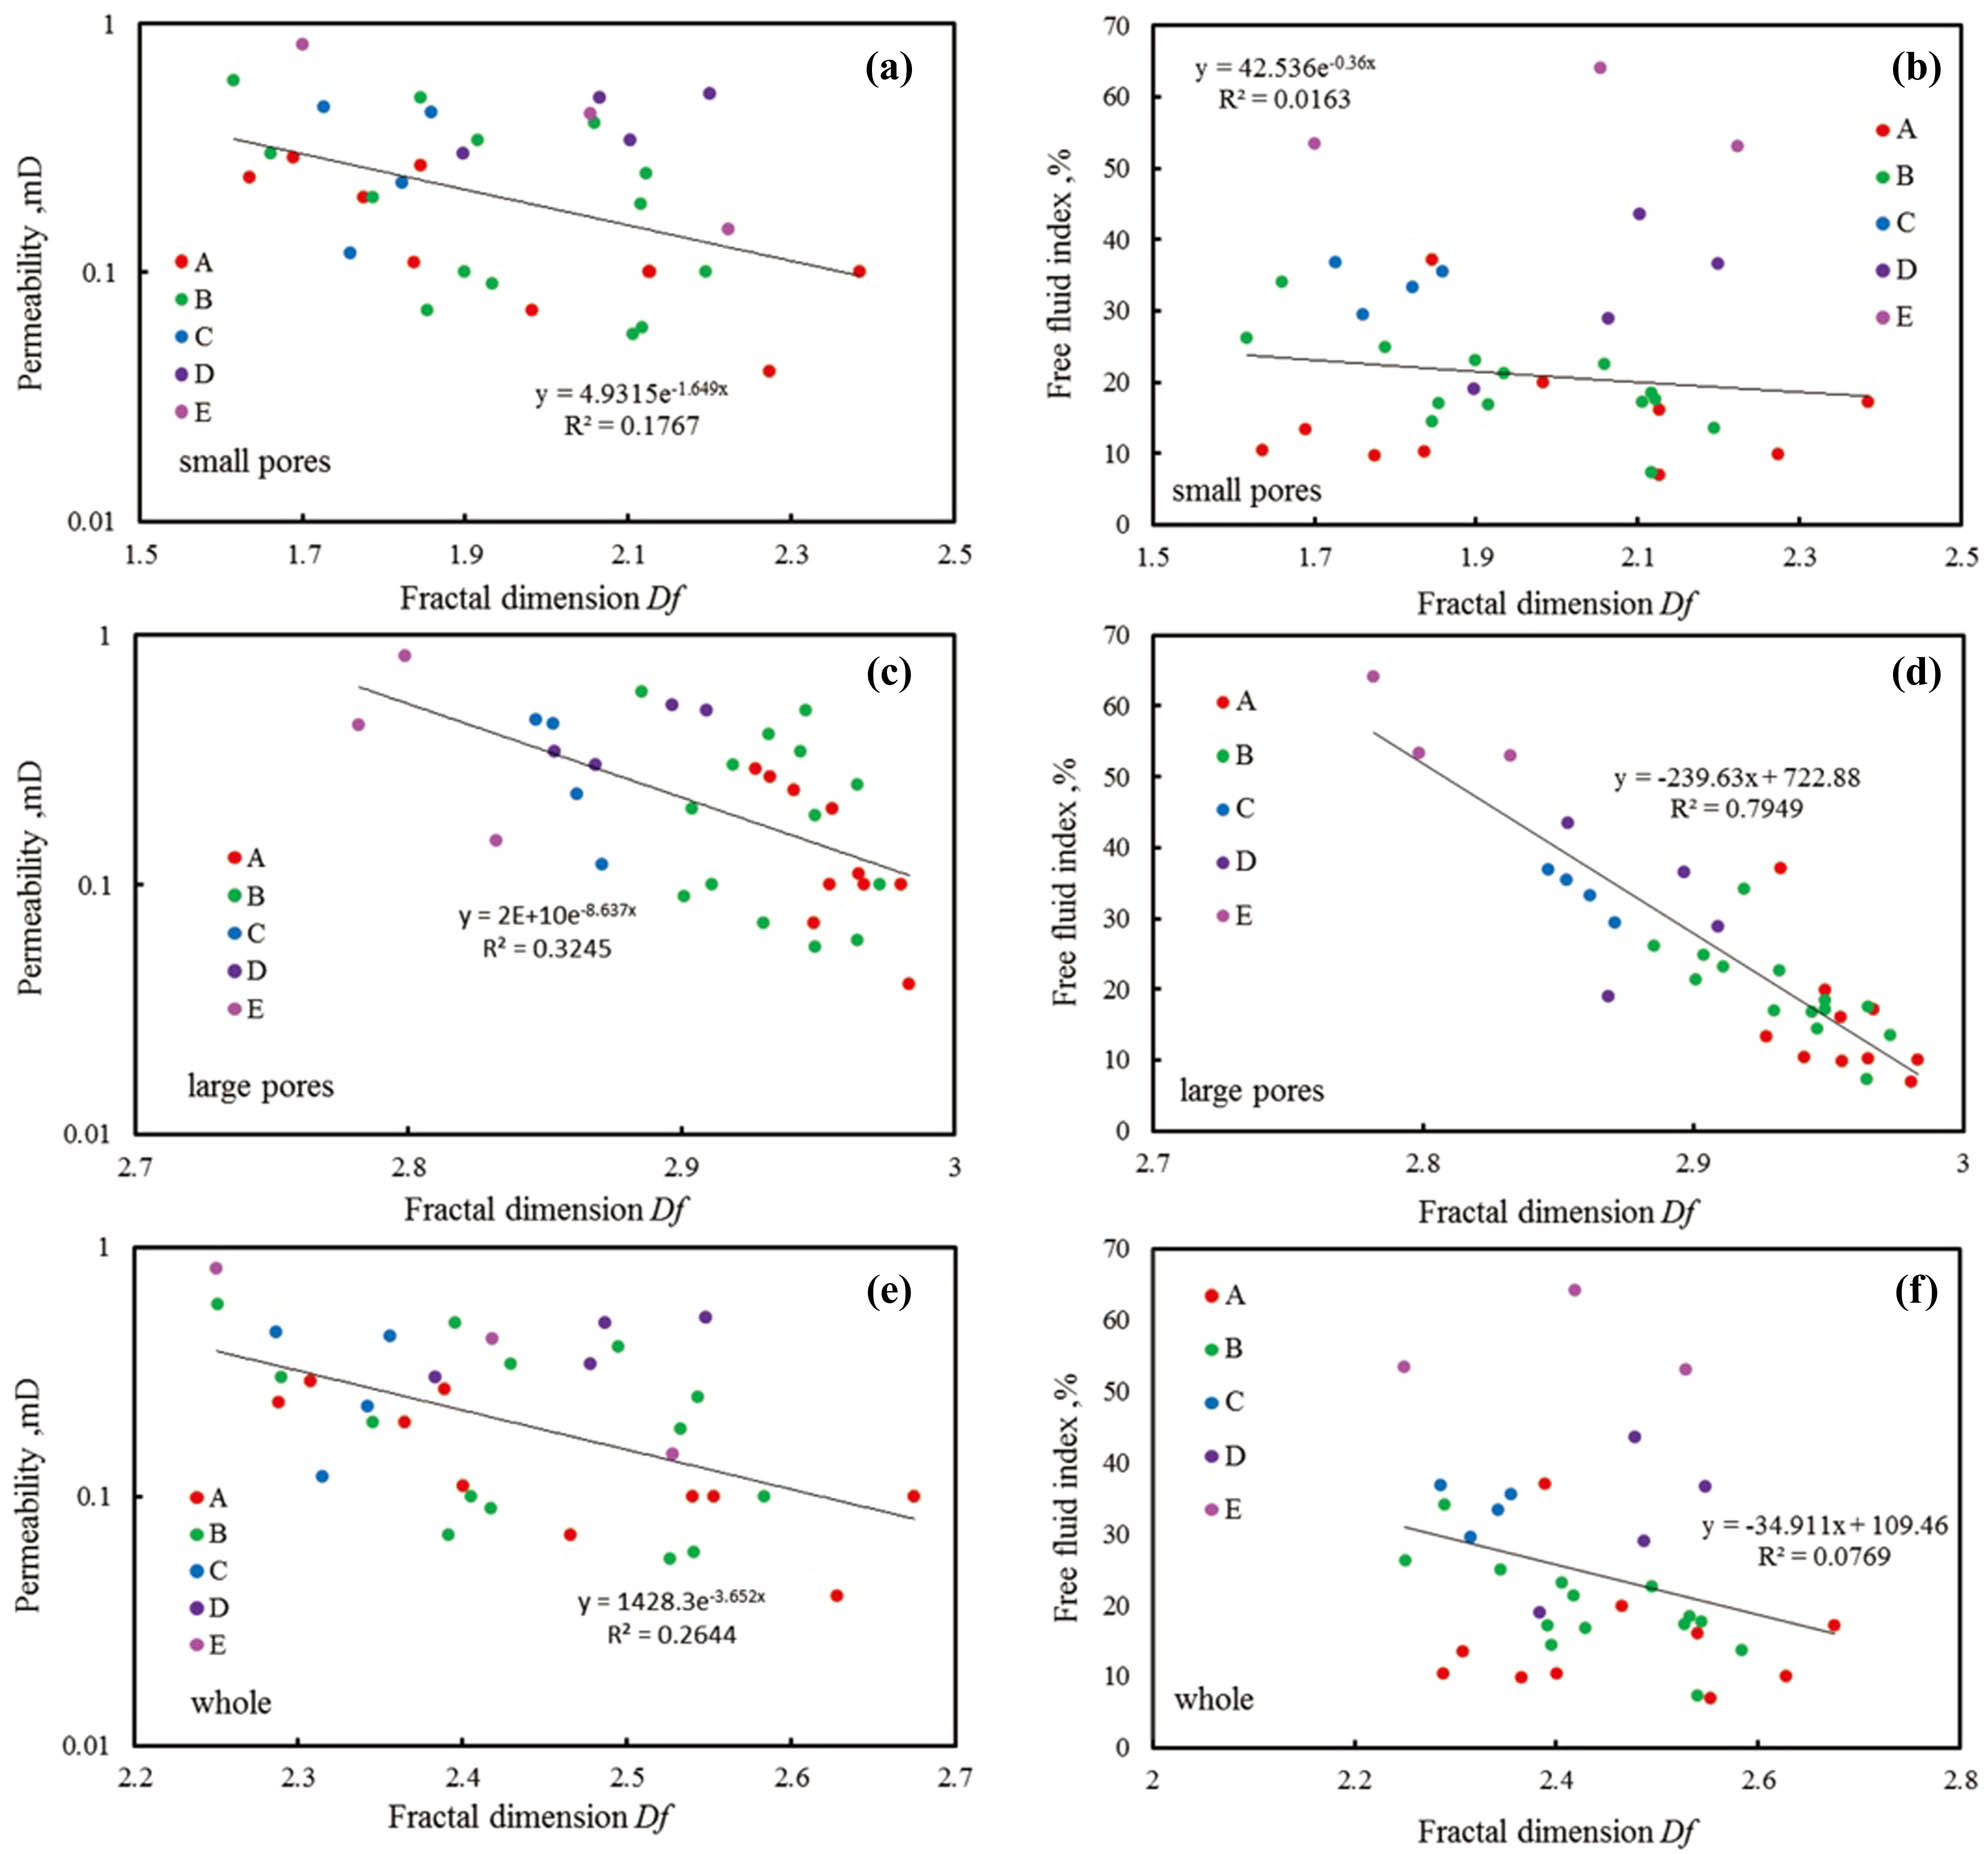
Influence of pore structure on bound water.
Two important insights emerge from these correlations:
First, large and medium pore-throats contribute significantly to the reservoir’s porosity and permeability. As such, the stronger the heterogeneity of these pore-throats, the more complex the pore-throat structure, leading to poorer reservoir storage capacity and reduced fluid flow ability. In tight sandstone reservoirs, small and micropores are widely developed and have a substantial impact on porosity. However, these pores are relatively evenly distributed, with smaller pore-throat radii and weaker heterogeneity in pore-throat structure. While large pores do influence permeability to some extent, the complexity of individual small or large pores has a limited effect. Permeability is primarily controlled by the overall characteristics of the pore-throat structure. The greater the complexity and heterogeneity of the pore-throat structure, the more significant its impact on permeability [61,62,63].
Secondly, movable fluid saturation is strongly positively correlated with permeability. Reservoir permeability directly affects the effective porosity of movable fluid, which in turn determines the ease with which fluids can flow through the reservoir. Fluid flow is less hindered in larger pores, especially those exceeding the cutoff diameter, as they are less affected by fine throats or hydrophilic minerals. This leads to higher movable fluid saturation and, consequently, lower bound water saturation [30,31]. These findings align with the conceptual model that larger pores, with greater storage space and fewer flow restrictions, enhance fluid mobility and increase the overall efficiency of fluid extraction.
Specifically, the positive correlation between movable fluid saturation and permeability highlights the importance of effective pore throat connectivity. Larger throat radii and increased fluid storage space reduce resistance to fluid flow, such as capillary forces, which are often a limiting factor in smaller pores. The strong correlation between the fractal characteristics of large pores and movable fluid saturation indicates that the presence of large, well-connected pores plays a dominant role in controlling the efficiency of fluid movement. The more unevenly distributed and microscopically heterogeneous the large pore portion, the lower the corresponding movable fluid saturation. This suggests that the distribution of pore sizes and their spatial arrangement within the reservoir are crucial factors in determining fluid dynamics [5,64].
5.3 Analysis of the causes of differences in pore structure
5.3.1 Control of diagenesis
The pore evolution of the Chang 6–Chang 8 section reservoirs in the study area has undergone compaction in the shallow stage, compaction and cementation in the middle stage, and cementation and dissolution in the deep stage, currently reaching the mesodiagenetic A stage [37]. From the synsedimentary stage to the early diagenetic A stage, pore loss in the reservoir was mainly dominated by compaction. In the early diagenetic B stage, cementation gradually became the dominant diagenetic process for pore loss. During this stage, filtrated smectite transformed into kaolinite and illite–smectite mixed layers, and siliceous cement began to form, though the degree of cementation remained low. In the mesodiagenetic A stage, as burial depth increased, illite-smectite mixed layers transformed into illite, carbonates were converted to iron carbonates, and chlorite formation occurred. Multiple cements acted together, leading to the highest cementation strength, and resulting in a significant decrease in pore throat homogeneity and connectivity. Meanwhile, dissolution began to manifest, with organic acid dissolution further increasing the secondary porosity of the reservoir [65].
Compaction during the early diagenetic stage is a dominant factor contributing to pore loss. According to statistical data, compaction can lead to a porosity loss of approximately 15–35%. Feldspar dissolution, one of the major mechanisms of secondary pore formation, typically results in a porosity increase of around 1–10%. Under microscopic examination, it is common to observe the coexistence of precipitated authigenic quartz and illite or kaolinite in or near feldspathic pores. Cementation, especially in its various forms, plays a significant role in diagenesis. These include clay mineral cementation, quartz cementation, and carbonate rock cementation, with cementation content generally ranging from 3 to 25% (Figure 9).
Clay mineral cementation is primarily characterized by chlorite, immonite mixtures, and illite. Siliceous colluvium is widely developed in the Chang 6-Chang 8 reservoirs, primarily in the form of both hypogene quartz and authigenic quartz. Carbonate colluvium, prominent at all diagenetic stages, is often high in content. Late-stage iron calcite, the dominant form of carbonate colluvium, fills rock pores, leading to increased compaction within the reservoir. Authigenic chlorite observed under SEM exhibits acicular or rosaceous morphology, with the chlorite cements forming a film lining around the pore edges. It is widely accepted that the formation of this chlorite film inhibits secondary quartz growth and helps preserve primary pores (Figure 10a).
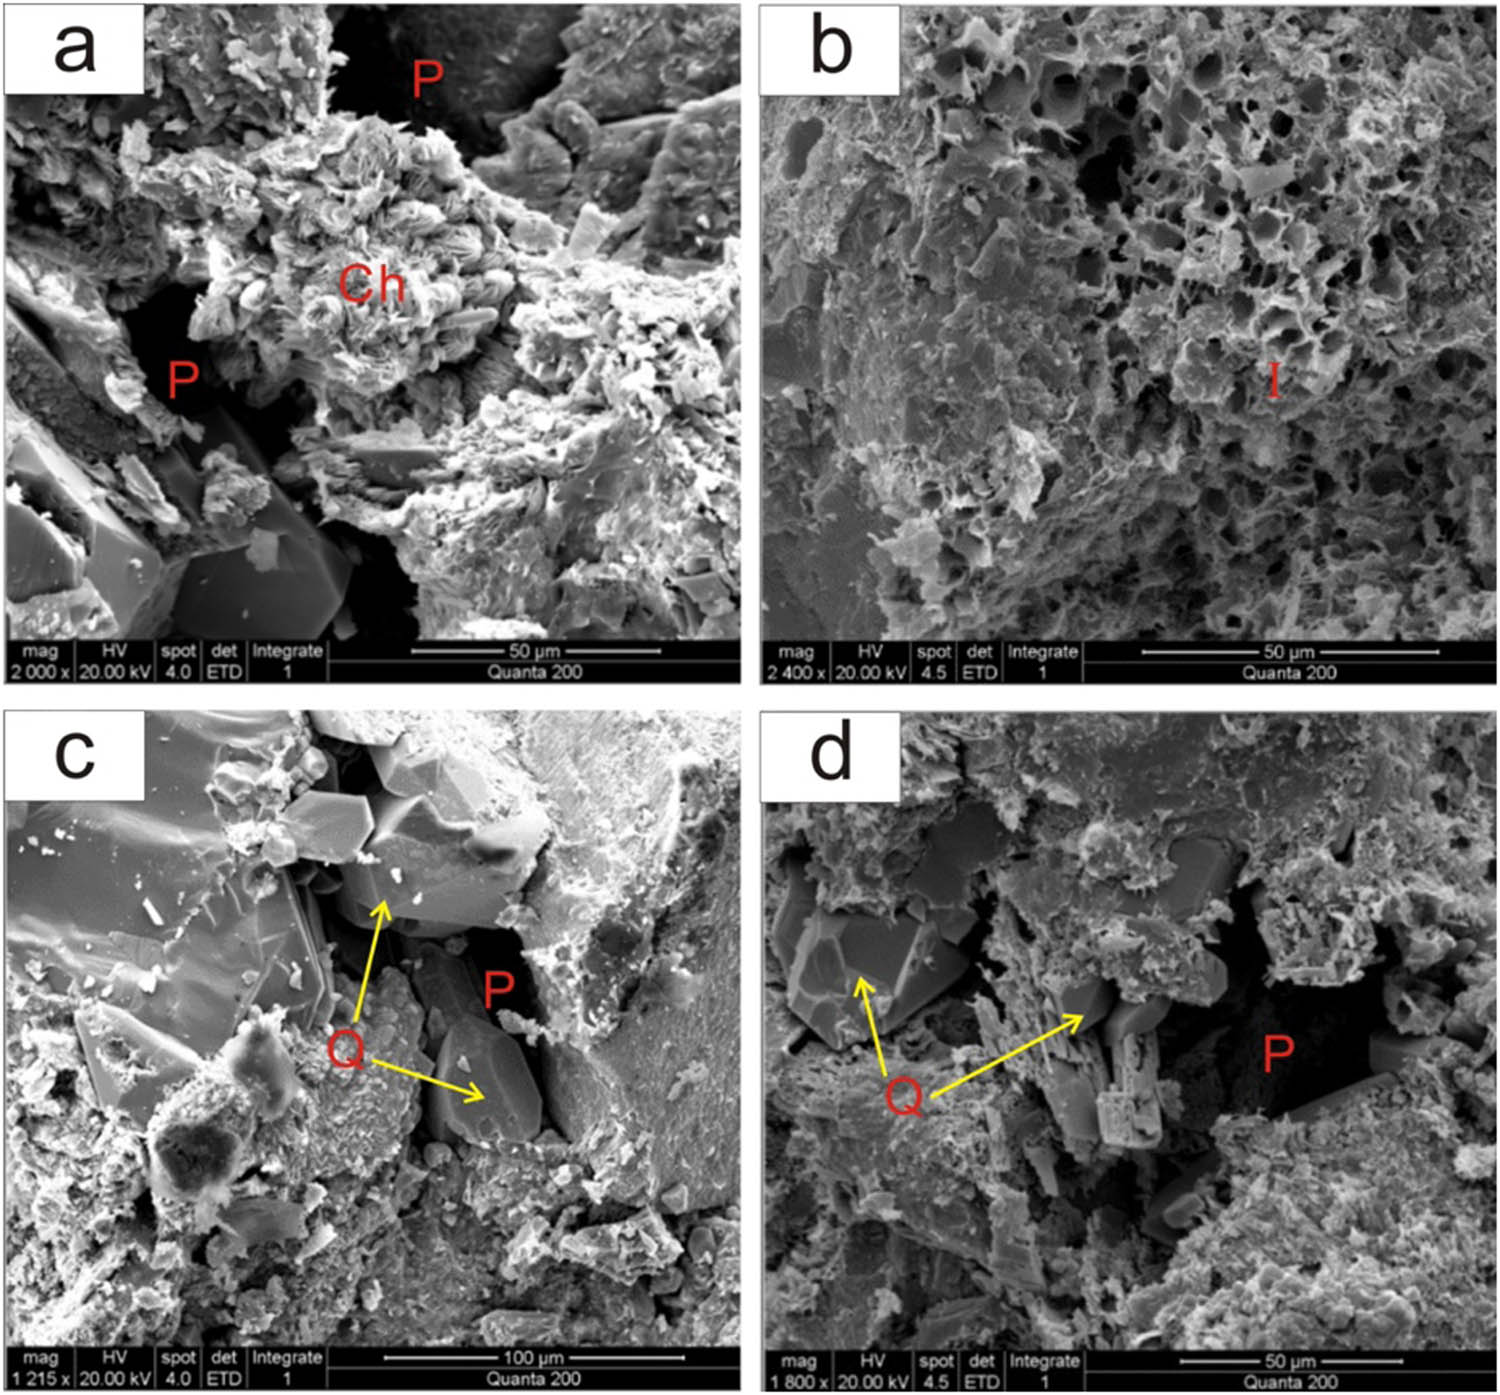
Main cement types in sandstone.
Authigenic illite, one of the most abundant clay minerals, appears as filamentous or lapilli structures under SEM (Figure 10b). This type of cementation can effectively block pores, reducing the reservoir’s physical properties. Illite formation occurs primarily through two mechanisms: one involves the transformation of osmotic montmorillonite, originating from sediments, into illite during early to middle diagenesis. The other involves the water–rock interaction and illite formation in pore spaces due to the dissolution of feldspars by acidic fluids.
Siliceous cementation is common in the Chang 6-Chang 8 reservoirs, with contents ranging from 0.5 to 4.5%, averaging around 1.5% (Figure 10c and d). Two primary forms of cementation are observed: secondary quartz with large margins and authigenic quartz, which fill the pores, altering the morphology of the pore throats. Quartz crystals, particularly those formed during secondary processes, occupy pore spaces and significantly reduce pore volume, contributing to the decreased reservoir physical properties. Siliceous cements effectively block pore spaces, limiting fluid flow and diminishing reservoir quality.
Carbonate colluvium is observed in all diagenetic stages, generally with a high content. In the early diagenetic stage, it occurs as mud crystals, pale crystals, and microcrystalline calcite, influenced by clay mineral alteration and feldspar dissolution. In contrast, carbonate colluvium in the middle and late stages of diagenesis is characterized by crystal and coherent crystal formations, often containing iron carbonate as a primary component. Minerals rich in iron and magnesium ions, such as mica, tuff, and dolomite, provide the material basis for carbonate colluvium formation. Iron calcite, particularly abundant in the late stages, fills rock pores, increasing compaction and affecting reservoir permeability.
Based on the symbiotic relationships between rock-forming minerals and diagenetic processes, the typical diagenesis progression in the study area follows the sequence:
Burial compaction → Early chlorite envelope → Early carbonate cementation → Secondary quartz increase → Organic fluid filling → Feldspar dissolution → Authigenic kaolinite cementation → Turbidite zeolite cementation → Turbidite zeolite dissolution → Feldspar dissolution → Oil and gas loading → Secondary quartz increase → Late carbonate cementation.
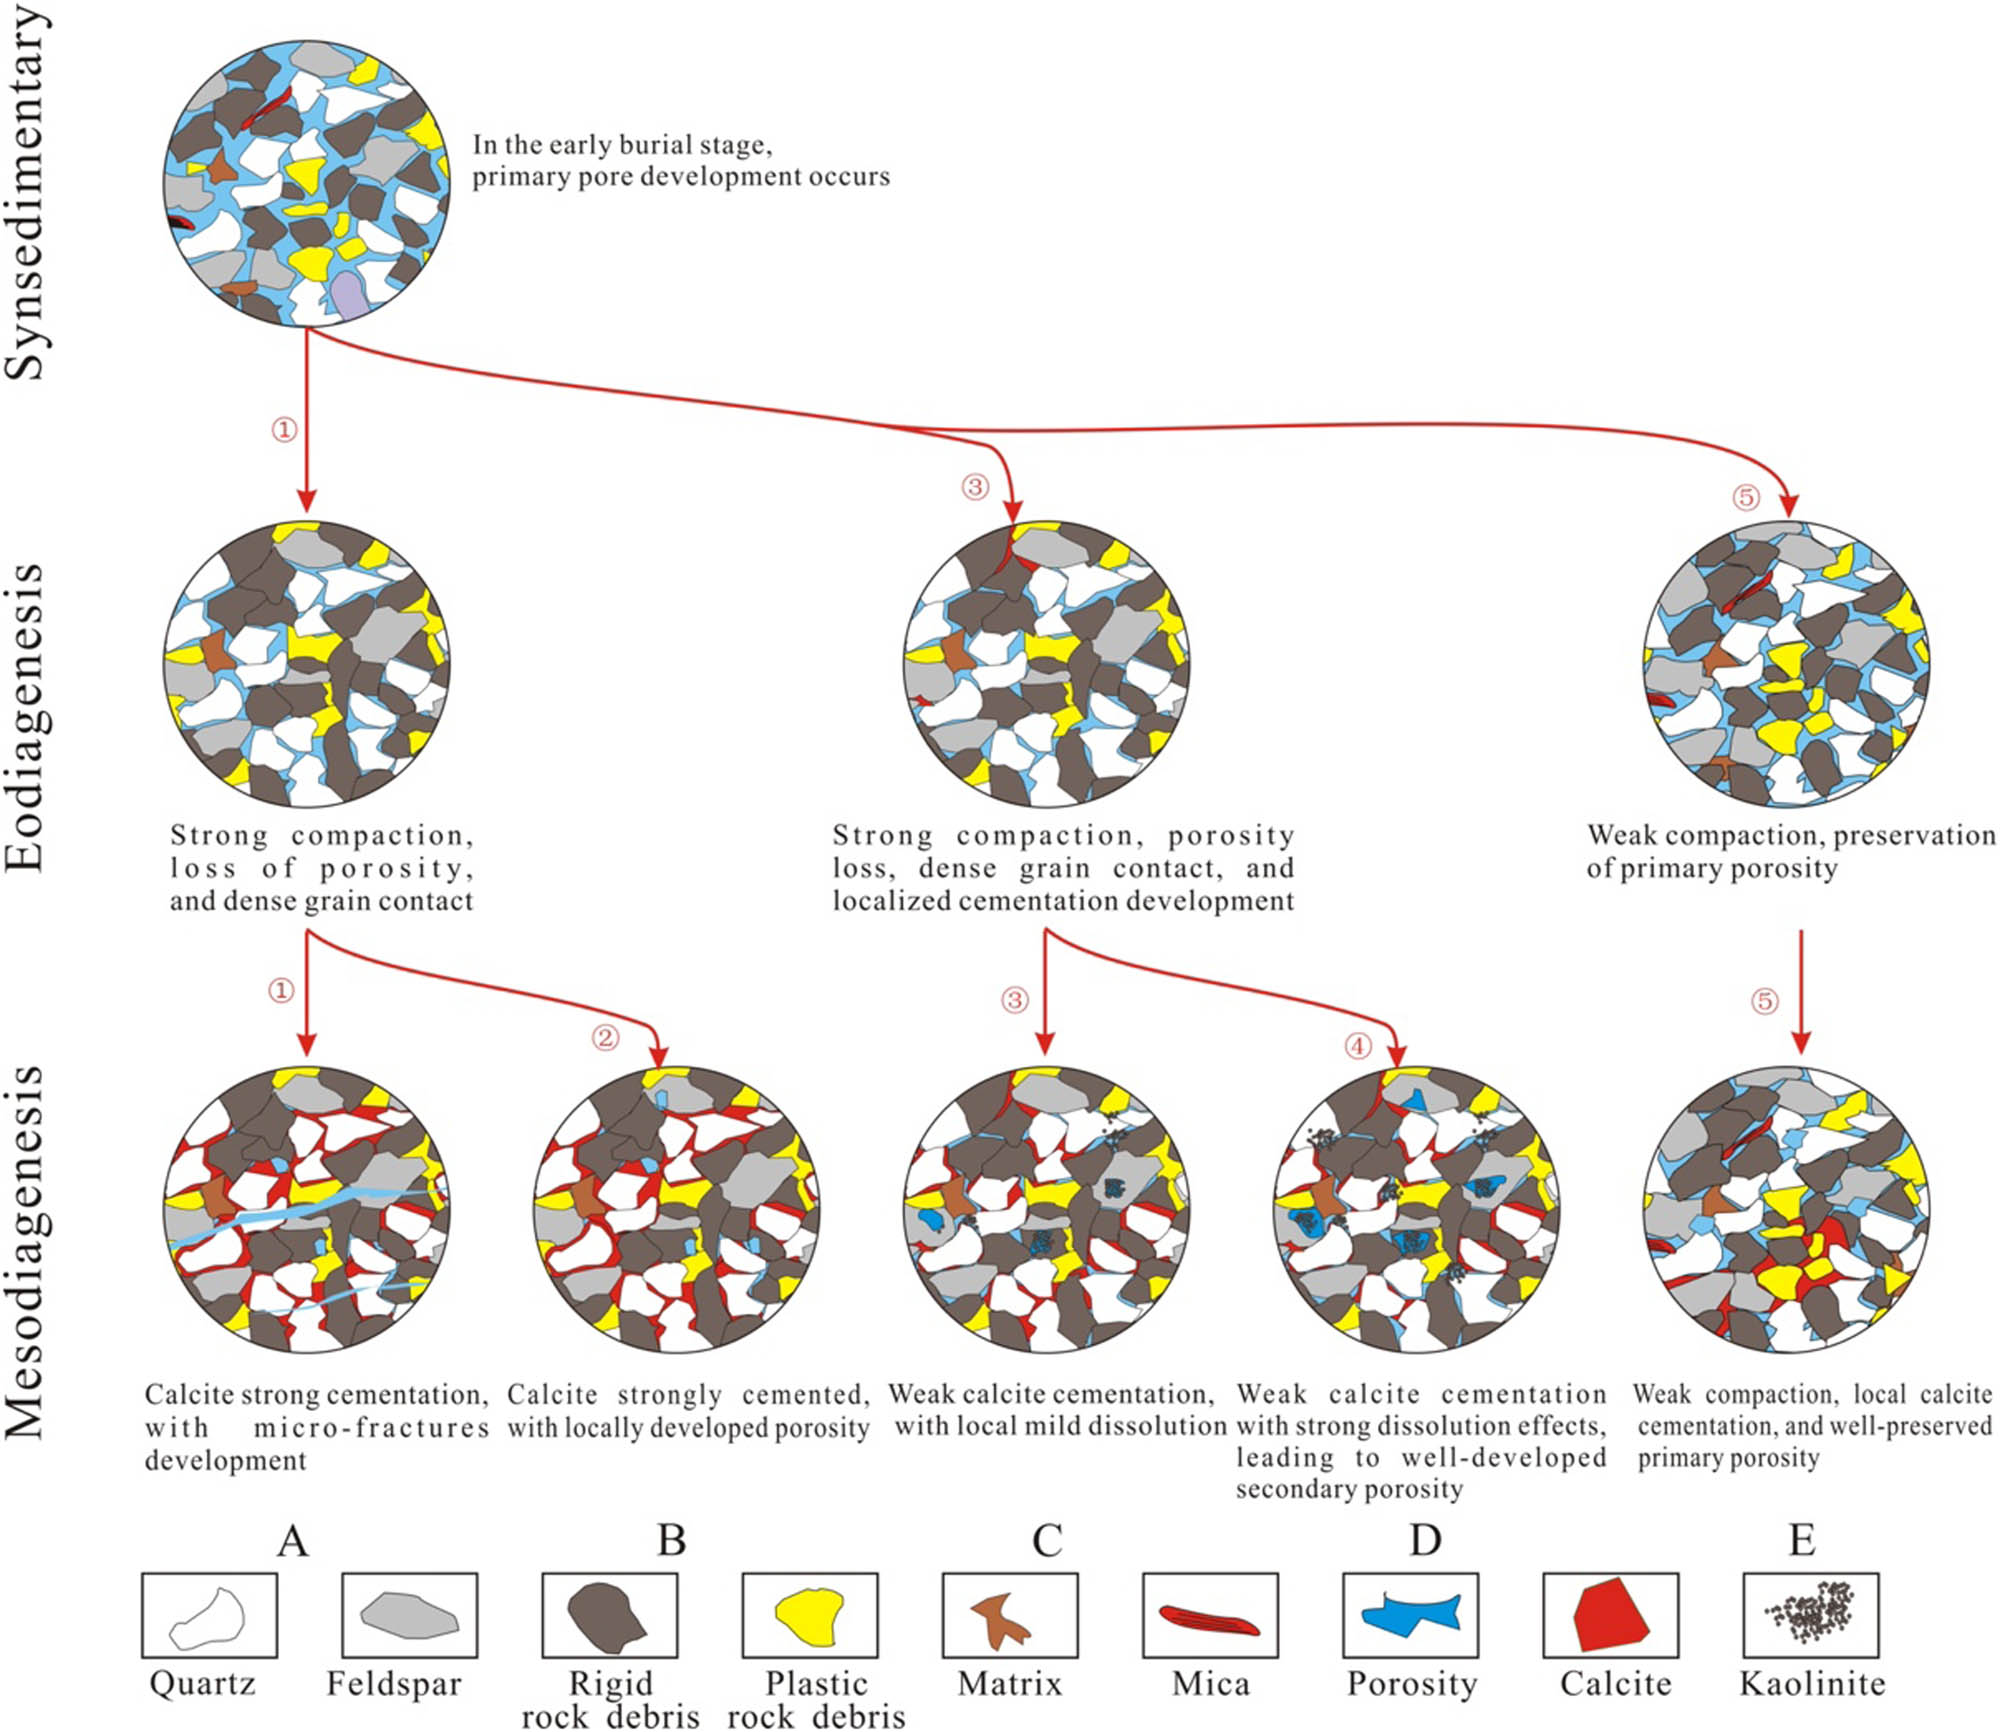
Sandstone classification based on pore structure characteristics indicates five main types of sandstones in the Chang 6-Chang 8 section, with variations in pore structure. These differences are primarily attributed to the intensity and sequence of compaction and cementation during the diagenetic evolution process (Figure 11).
Differential diagenetic sequence model of sandstone.
Type A and B: These sandstones are characterized by significant compaction during the early diagenetic stage, which results in the reduction of pore spaces and a more compact rock matrix. Type A sandstones, subjected to strong calcite cementation during the middle diagenetic stage, develop microfractures that can act as secondary fluid pathways, partially offsetting the loss of permeability caused by compaction (Figure 11A). In contrast, Type B sandstones exhibit less intense dissolution processes and retain primarily residual intergranular pores, with only localized development of dissolution pores (Figure 11B). This limited porosity enhancement, combined with the absence of extensive fracture networks, results in a denser and less permeable rock structure compared to Type A.
Type C and D: Type C sandstones also experience strong compaction during the early diagenetic stage, accompanied by localized calcite cementation. However, the middle diagenetic stage introduces moderate dissolution processes, leading to the formation of secondary dissolution pores. These pore spaces often host kaolinite, illite, and authigenic quartz cementation, which further modify the pore structure and contribute to moderate reservoir quality (Figure 11C). Type D sandstones, by comparison, undergo stronger dissolution and erosion processes during the diagenetic period, which significantly enhances pore development (Figure 11D). The resulting pore network in Type D sandstones is more extensive, creating a higher level of porosity and permeability compared to Type C.
Type E: Among the sandstone types, Type E stands out for its weak compaction during the syn-diagenetic to early diagenetic stages. This allows for the preservation of well-developed primary pores, which form the foundation for excellent reservoir properties. During the middle diagenetic stage, carbonate cementation occurs locally, dominated by iron calcite and calcite. Unlike the other types, the dissolution of feldspar and rock debris in Type E sandstones is particularly pronounced, resulting in significant dissolution porosity (Figure 11E). This combination of preserved primary pores and enhanced secondary porosity through dissolution processes makes Type E the most favorable reservoir type in terms of fluid storage and flow capacity.
The sandstone classification based on diagenetic process differences actually reflects the reservoir characteristics of differential diagenetic modification, which includes pore structure, petrophysical properties, and more. Although the fractal characteristics of different sandstones show significant differences, the impact of diagenetic processes and diagenetic minerals on pore structure characteristics shares certain commonalities: The quartz content has a significant effect on the complexity of large pore-throats and the overall pore-throat structure, mainly because the quartz content in the reservoir is related to the formation of intergranular pores. The higher the quartz content, the more developed the intergranular pores, which are more easily affected by clay mineral filling, leading to more complex pore-throat distribution. The complexity of small pore-throats is related to the development of feldspar dissolution pores. The higher the feldspar content in the reservoir, the more favorable it is for the development of dissolution pores and the formation of clay minerals. The occurrence form of clay minerals and the extent of pore-throat filling have an important impact on the complexity of larger pore-throats and the overall pore-throat structure. Clay minerals mainly fill dissolution pores and remaining intergranular pores. The higher their content, the more irregular the pore-throat distribution, and the stronger the surface roughness and heterogeneity, resulting in a more complex overall pore-throat structure.
5.3.2 Control of sedimentation
The depositional environment of the Chang 6 to Chang 8 oil formation group in the study area is characterized by a braided river delta and lake depositional system. During the braided river stage, where the river meets the lake, the braided river delta was formed. Due to the proximity of the source area, the river in this stage is wide and deep, with a coarse grain size, low structural maturity, and low mineral maturity. The depositional system can be divided into several sub-environments, including the braided river delta plain, foreland, and former braided river delta. The foreland zone, where sand bodies are well developed, and the braided river channels above and below the water-submerged transitional phases are particularly significant. This study, by combining sand body configuration, pore structure types, and assemblage characteristics, has established a model for the differential genesis of pore structures in various depositional environments.
5.3.2.1 Braided channel
The sediments in the braided channels are predominantly grey conglomerates, gravelly sandstones, and medium-to-coarse sandstones, characterized by single or multiple positive cyclic layering. The scour surface at the bottom of the channel is prominent, indicating the dynamic nature of the depositional environment. Due to frequent river channel migration, the sand bodies in the braided river delta plain are stacked into thick layers of sand and conglomerates, with substantial lateral variability [66]. The gamma-ray (GR) curves in these deposits show complex medium-amplitude box, bell-shaped, and box-like patterns, with jagged curve features, indicating variable sedimentary environments. The sand bodies display interbedded laminations with groove-like, parallel, and wedge-shaped features, reflecting the high-energy depositional conditions and frequent river channel migration. The sediments are poorly sorted with low compositional maturity, primarily consisting of quartz, feldspar, and rock fragments.
Mechanical compaction is particularly significant in the braided channel sand bodies, due to the high mud content. This compaction leads to a notable reduction in porosity, especially at the edges of thick sand bodies and in the interior of thinner sand bodies where cementation is stronger, particularly carbonate cementation. While feldspar dissolution slightly increases porosity in the interior of the sand bodies, the overall increase is limited [67]. Chlorite particle envelopes are typically observed in the centers of thick sand bodies, where they partially preserve original porosity, but generally fill the pores, reducing permeability (Figure 12).
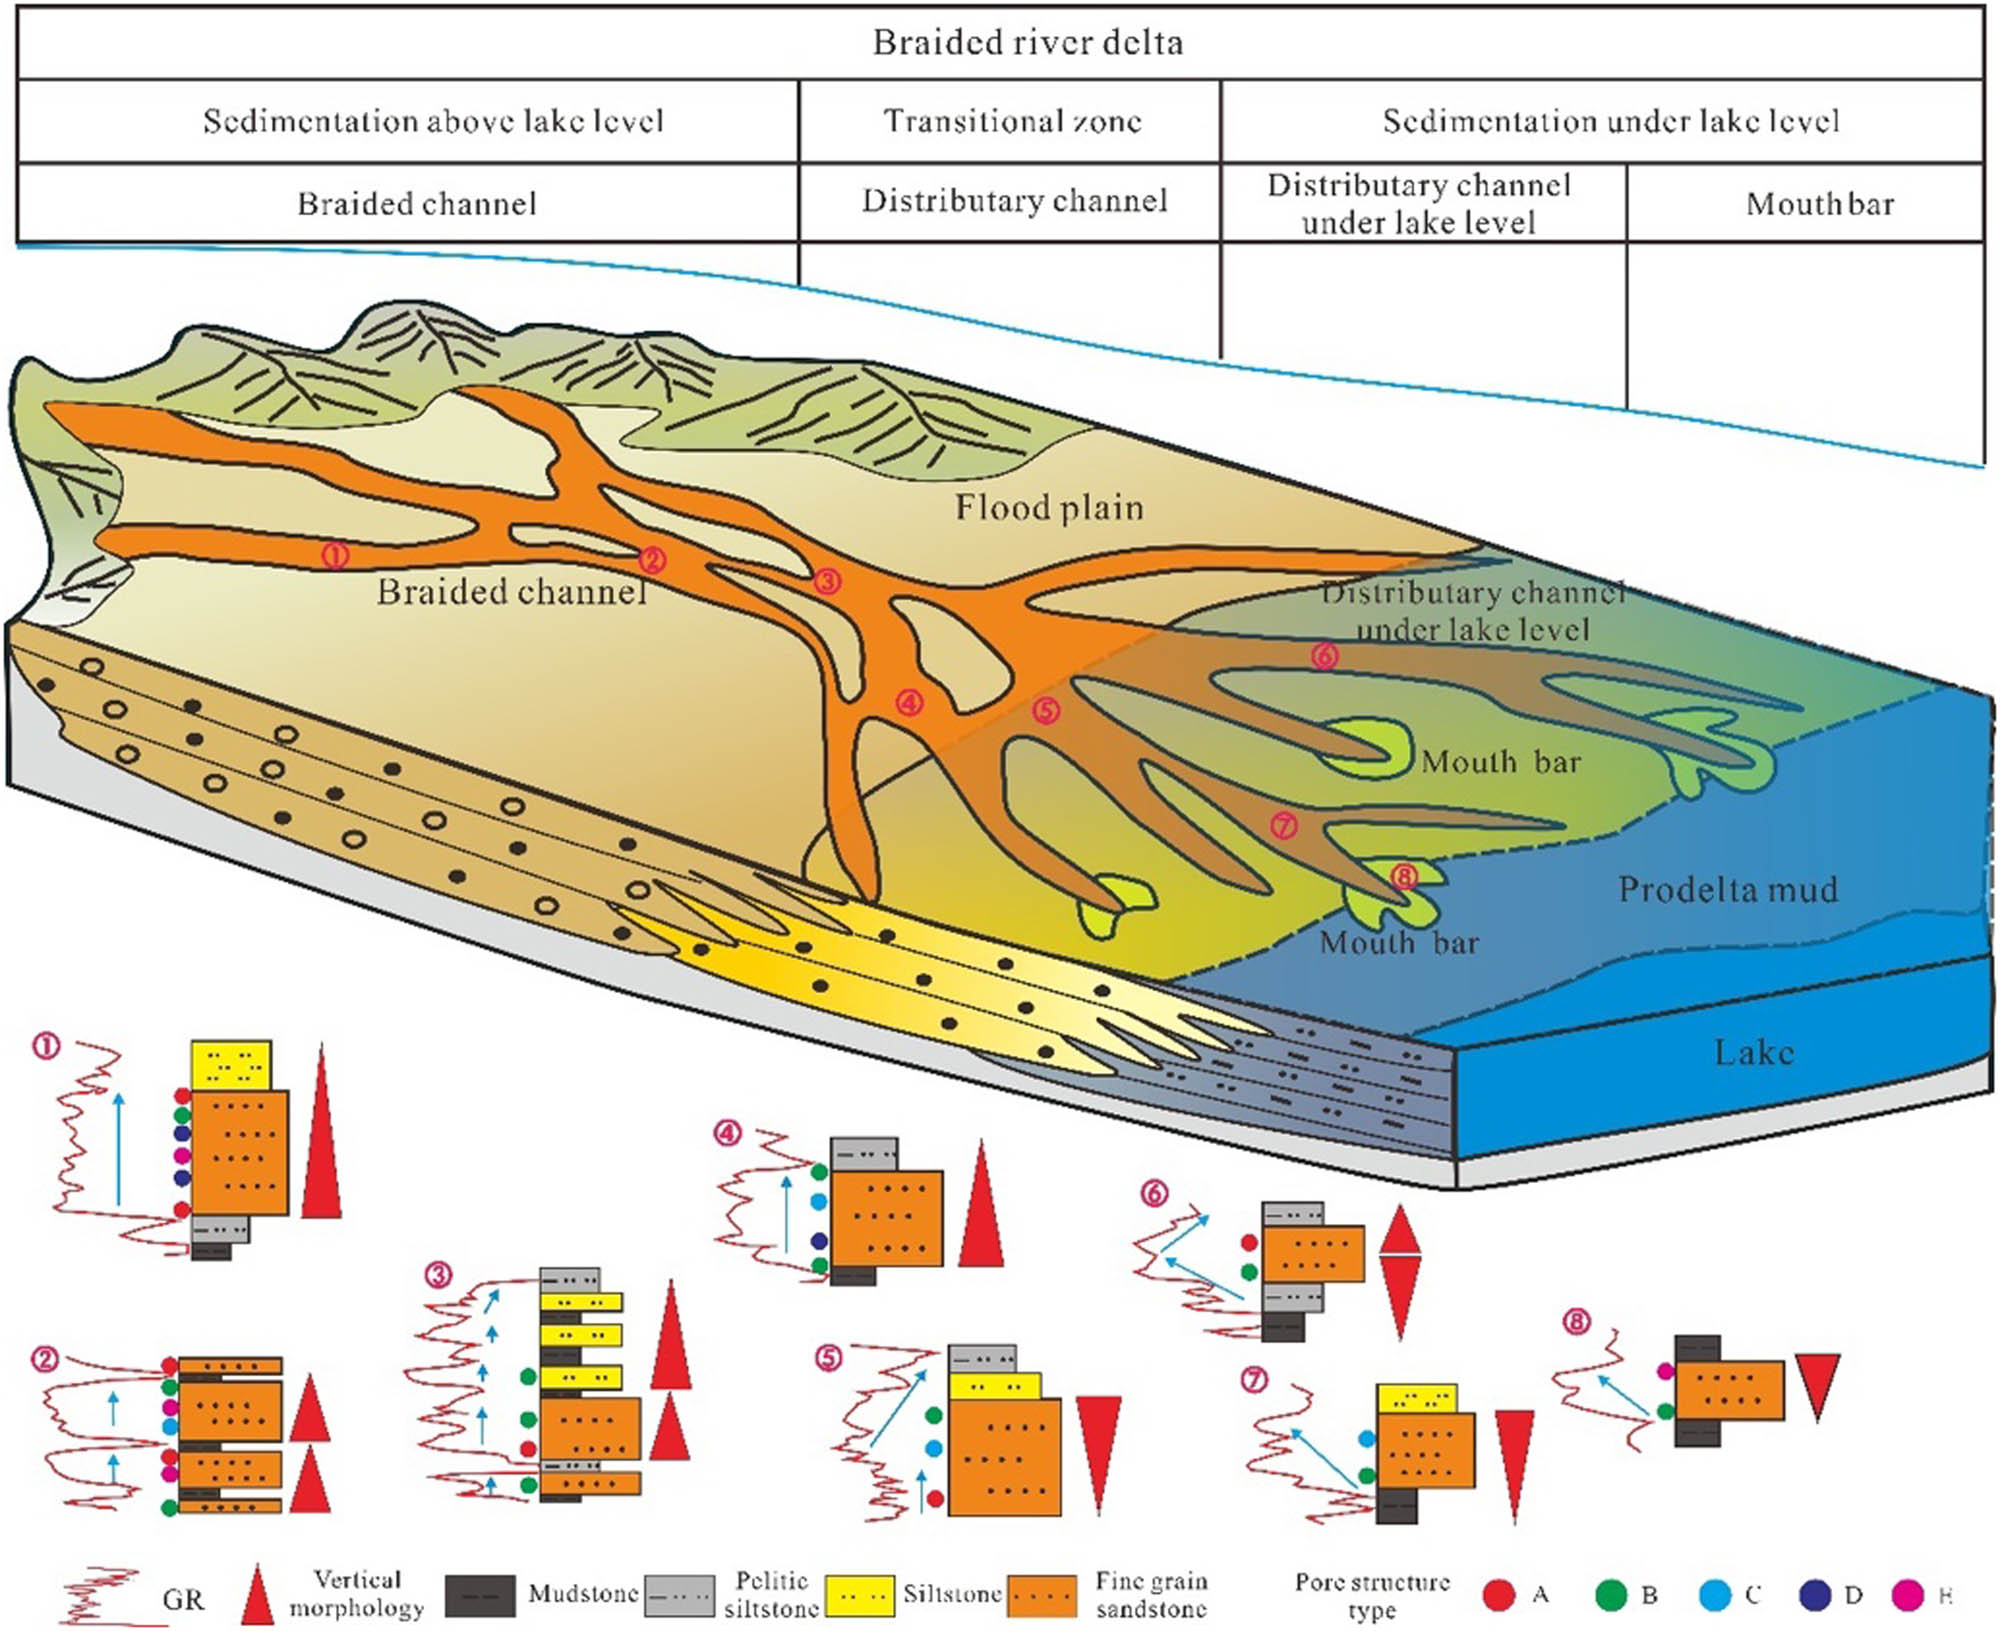
Sketch showing vertical structure, stacking pattern, and distribution model of Chang 7 sandbodies in different depositional facies zones, ultra-short-term base-level cycle. ① Box shape, well B29; ② Box shape + box shape, well B4; ③ jugged box shape, well N124; ④ Isolated box shape, well N128; ⑤ Campaniform + jugged box shape, well N72; ⑥ Campaniform + infundibuliform, well Z126; ⑦ jugged infundibuliform, well B3; ⑧ Infundibuliform, well N185.
5.3.2.2 Distributary channel above lake level
The sediments in the distributary channels above the lake level are primarily composed of gravelly medium-to-coarse sandstone and conglomeratic sandstone. Typical plain distributary channel deposits feature multiple superimposed scour surfaces, forming well-connected sand bodies with significant lateral variability and considerable variation in sand body thickness. These deposits exhibit fining-upward sequences, with the grain size becoming progressively finer upwards. Well-log characteristics show moderately serrated GR curves, with predominant sedimentary structures including trough cross-bedding, wedge-shaped cross-bedding, and parallel bedding, reflecting various phases of water flow. The sediment grain size is relatively coarse, well sorted, and primarily composed of quartz and feldspar, with low lithic fragment content [68].
While compaction is relatively weak in these deposits, it still impacts porosity. Siliceous secondary cementation is common, with feldspar dissolution leading to the creation of secondary porosity, which increases the overall porosity of the sand bodies [69]. Kaolinite and illite cements are well developed within the reservoir, with dissolution processes particularly evident in medium-thick sand bodies [70] (Figure 12).
5.3.2.3 Distributary channel under lake level
The sub-lake distributary channels, located on the delta front, extend well into the basin and typically have sediment thicknesses ranging from 1 to 4 meters. The sand bodies exhibit banded extensions with minimal lateral variation and excellent vertical connectivity [60]. The sediments primarily consist of medium- to fine-grained sandstone, often interbedded with argillaceous siltstone and mudstone beds. Well-log characteristics show bell and box-shaped GR curves, indicating normal depositional sequences with upward grain refinement and lateral migration of channels. The sedimentary structures are dominated by parallel bedding, tabular cross-bedding, trough cross-bedding, and deformation bedding, indicating a decrease in water flow energy and sequential sediment deposition. The sand grains are well sorted, with moderate clay content, primarily composed of quartz and feldspar.
Porosity development in these deposits is heavily influenced by diagenetic processes. Mechanical compaction, although strong, results in reduced porosity with increasing burial depth. However, feldspar dissolution is well-developed, creating significant secondary porosity and increasing overall porosity [61,71,72].
5.3.2.4 Mouth bar
Estuarine mouth bars predominantly consist of fine-grained sandstone and siltstone. These deposits are typically characterized by fine lamination and moderate to high mineral maturity, with sedimentary structures such as parallel bedding and ripple cross-lamination. The grain size is finer compared to the other channel deposits, and the pore structure is mainly affected by the compaction and cementation processes. Secondary porosity is often created through the dissolution of feldspar and other labile minerals, contributing to an increase in porosity. However, cementation, particularly by carbonate minerals, tends to reduce the overall reservoir quality in these deposits (Figure 12).
Provenance and sedimentary processes control the transport distance of sediments and hydrodynamic conditions, which in turn affect the grain size, sorting, roundness, and clay content of the rocks, thus determining the initial porosity. The initial porosity is closely related to the present porosity, which in turn dictates the permeability and petrophysical properties of the reservoir.
Among the different sedimentary bodies in the study area, the core of the underwater distributary channel has the highest initial porosity, followed by the middle part of the underwater distributary channel and the delta front, while the braided river and water-channel distributary sands have relatively lower porosity.
In the front of a shallow-water delta, the hydrodynamic conditions are dominated by traction currents. Sands in the core of the distributary channels typically have coarser grains, better sorting, higher roundness, lower clay content, and greater sediment thickness, which contribute to the formation of sands with high porosity and good connectivity. During diagenesis, the lower clay content reduces the filling of cementing materials, preserving more pore space and maintaining favorable petrophysical properties. As the sediment extends outward from the core of the underwater distributary channel, hydrodynamic energy weakens, sediment thickness decreases, and clay content increases, resulting in a decline in the petrophysical properties of the sands. Sands in the delta front, formed in an environment where hydrodynamic energy sharply decreases, have poorer petrophysical properties compared to those in the core of the distributary channel. Overall, high-quality reservoirs are primarily found in the core of the underwater distributary channels and the delta front.
6 Conclusions
This study provides key insights into the relationship between pore structure and permeability in tight sandstone reservoirs, with a focus on the Heshui area of the Ordos Basin. By applying fractal theory to pore-throat analysis, we demonstrate that fractal dimensions are critical in controlling permeability and fluid mobility, revealing the complexity of pores that governs fluid flow behavior in these reservoirs.
The integration of HPMI and NMR techniques allows for precise characterization of pore structures, overcoming the limitations of traditional methods. Our findings highlight the significant impact of sedimentary facies and diagenetic processes on pore evolution, which directly affect reservoir permeability. The correlation between fractal dimensions and permeability, along with mobile fluid saturation, provides a robust framework for evaluating reservoir potential.
Although based on tight sandstone reservoirs in the Heshui area of the Ordos Basin, the conclusions are broadly applicable to regions with similar geological settings. Future studies should broaden the scope to include a wider range of reservoirs and refine fractal models to improve permeability predictions.
Acknowledgment
We would like to thank the PetroChina Changqing Oilfield Company for providing samples and data. We thank all editors and anonymous reviewers for their helpful comments and suggestions.
-
Funding information: This study was financially supported by the General Project of the Chongqing Natural Science Foundation (Grant No. CSTB2022NSCQ-MXS1642) and the Joint Fund for Innovation and Development of the Chongqing Natural Science Foundation (Grant No. CSTB2023NSCQ-LZX0078), and was also supported by the Science and Technology Research Program of the Chongqing Municipal Education Commission (Grant No. KJQN202401535).
-
Author contributions: Shu Liu: Writing original draft, Writing review & editing; Meng Wang: Writing original draft, experiment; Yulin Cheng: data curation methodology; Xinan Yu: Conceptualization; Xingming Duan and Zhe Kang: experimental operation and analysis; Yixue Xiong: supervision.
-
Conflict of interest: Authors state no conflict of interest.
-
Data availability statement: All data generated or analyzed during this study are included in this published article.
References
[1] Zou C, Zhu R, Wu S, Yang Z, Li D. Tight gas sands: The status and challenges in China. J Nat Gas Sci Eng. 2012;8:65–77.Search in Google Scholar
[2] Hu T, Zhang S, Wang Y, Liu Z, Wang Q. Pore structure characteristics and their effect on permeability of tight sandstone reservoir: A case study from the Triassic Yanchang Formation, Ordos Basin, China. Mar Pet Geol. 2013;48:1–10.Search in Google Scholar
[3] Wang M, Tang HM, Zhao F, Liu S, Yang Y, Zhang L, et al. Controlling factor analysis and prediction of tight sandstone reservoir quality: A case study of He8 Member in eastern Sulige Gas field, Ordos Basin, China. J Nat Gas Sci Eng. 2017;46:680–98. 10.1016/j.jngse.2017.08.033.Search in Google Scholar
[4] Yang R, Jiang Z, Wu Q. Pore structure characteristics and their effect on the permeability of tight sandstone reservoirs: A case study of the Yanchang Formation in the Ordos Basin. Energy Explor Exploit. 2014;32(4):639–54.Search in Google Scholar
[5] Clarkson CR, Solano N. Fractal analysis of pore structure of tight gas sandstones and its relationship to gas transport mechanisms. J Pet Sci Eng. 2016;145:95–106.Search in Google Scholar
[6] Gao X, Zhang M, Li B. Integration of SEM and NMR for the analysis of pore characteristics in tight sandstone reservoirs. Energy Fuels. 2018;32(7):7735–43.Search in Google Scholar
[7] Wang J, Fu X, Zhang L. Application of scanning electron microscopy (SEM) in reservoir evaluation: A review. J Pet Sci Eng. 2016;147:1–10.Search in Google Scholar
[8] Liu J, Zhang L, Li T. Pore structure complexity of tight sandstones: A comparative study of different analytical methods. J Nat Gas Sci Eng. 2020;73:103027.Search in Google Scholar
[9] Mandelbrot BB. The fractal geometry of nature. Am J Phys. 1998;51(3):468.10.1119/1.13295Search in Google Scholar
[10] Jiang Z, Yang R, Wu Q. Fractal characterization of pore structure and its impact on the permeability of tight sandstone reservoirs: Insights from the Yanchang Formation, Ordos Basin. J Pet Sci Eng. 2021;196:107632.Search in Google Scholar
[11] Li H, He S, Radwand AE, Xie JT, Qin QR. Quantitative analysis of pore complexity in lacustrine organic-rich shale and comparison to marine shale: Insights from experimental tests and fractal theory. Energy Fuel. 2024;38(17):16171–88. 10.1021/acs.energyfuels.4c03095.Search in Google Scholar
[12] Zhang Z, Li J, Wang X. Fractal dimension and its significance in describing the pore structure of tight sandstone reservoirs. Pet Explor Dev. 2022;49(6):1205–14.Search in Google Scholar
[13] Li H, Tang HM, Qin QR, Zhou JL, Qin ZJ, Fan CH, et al. Characteristics, formation periods and genetic mechanisms of tectonic fractures in the tight gas sandstones reservoir: A case study of Xujiahe Formation in YB area, Sichuan Basin, China. J Pet Sci Eng. 2019;178:723–35. 10.1016/j.petrol.2019.04.007.Search in Google Scholar
[14] Li J, Li H, Jiang W, Cai ML, He J, Wang Q, et al. Shale pore characteristics and their impact on the gas-bearing properties of the Longmaxi Formation. Sci Rep. 2024;14:16896. 10.1038/s41598-024-66759-7.Search in Google Scholar PubMed PubMed Central
[15] Song L, Wang Z, Liu Q, Wu Y. Pore structure and fractal analysis of tight sandstone reservoirs: A case study of the Yanchang Formation, Ordos Basin. Energy Explor Exploit. 2022;40(6):1489–505.Search in Google Scholar
[16] Loucks RG, Ruppel SC, Berg SS. Fractal dimensions of pore structures in tight sandstones and implications for reservoir quality. AAPG Bull. 2012;96(6):1135–53.10.1306/08171111061Search in Google Scholar
[17] Zhang M, Zhao H, Yin T, Qian W, Mei A, Liu F. Diagenetic evolution of clastic reservoirs and its records in fine subsection: significance and application. Acta Geochim. 2022;41(5):887–92. 10.1007/s11631-022-00550-1.Search in Google Scholar
[18] Anovitz LM, Cole DR. Fractal theory and pore structure characterization of tight reservoirs. Geofluids. 2015;15(1):35–46.Search in Google Scholar
[19] Wang Y, Zhang H, Wang Q. Fractal analysis of the relationship between diagenetic processes and reservoir quality in tight sandstones. J Geophys Res: Solid Earth. 2023;128(5):e2022JB025797.Search in Google Scholar
[20] Zhao H, Liu P, Zhang Y. Effect of diagenesis on the fractal characteristics of pore structures in tight sandstones. Sediment Geol. 2022;425:105356.Search in Google Scholar
[21] Zhang X, Li S, Wang Y, Zhang J. Fractal characteristics of tight sandstone reservoirs in the Ordos Basin and their influence on permeability. Pet Sci. 2020;17(3):529–41.Search in Google Scholar
[22] Zhang T, Zhou H. Formation mechanism of tight sandstone reservoirs and its impact on hydrocarbon migration in the Ordos Basin. Pet Explor Dev. 2022;49(6):1013–27.Search in Google Scholar
[23] Clarkson CR, Wood J, Burgis S. Nanopore structure and gas storage capacity of organic-rich siltstone strata, Ordos Basin, China. Int J Coal Geol. 2012;103:26–35.Search in Google Scholar
[24] Sun Y, Zhang J, Jiang Z. Investigation of pore structure characteristics and their effect on permeability in tight sandstone reservoirs using fractal theory. J Pet Sci Eng. 2021;196:107632.Search in Google Scholar
[25] Yuan Z, Bai Y, Guo L. A fractal approach to characterizing pore structure of tight sandstone reservoirs: A case study from the Yanchang Formation, Ordos Basin, China. J Nat Gas Sci Eng. 2018;58:100–9.Search in Google Scholar
[26] Zhang W, Li J. Structural evolution and hydrocarbon accumulation of the Ordos Basin. J Geol. 2019;127(2):215–33.Search in Google Scholar
[27] Guo Y, Liu J, Yang H, Liu C, Fu JH, Yao JL, et al. Hydrocarbon accumulation mechanism of low permeable tight lithologic oil reservoirs in the Yanchang Formation, Ordos Basin, China. Pet Explor Dev. 2012;39(4):417–25.10.1016/S1876-3804(12)60061-5Search in Google Scholar
[28] Li J, Wang H, Zhang Q. Characterization of pore structures in tight sandstone reservoirs using SEM and MICP: A case study of the Chang 6 reservoir in the Ordos Basin, China. Mar Pet Geol. 2018;97:272–86.Search in Google Scholar
[29] Li Y, Zhang Y, Yin S, Cong L, Yan M, Tian X, et al. Characterization of the pore space in tight sandstone reservoirs from macroscopic and microscopic perspectives: A case study of Gaotaizi reservoir in Qijia area, the Songliao Basin. Oil Gas Geology. 2016;39(6):915–22.Search in Google Scholar
[30] Sun Z, Li X, Jiang J, Zhang Q. Quantitative characterization of pore structure in tight sandstone reservoirs: A case study of the Chang 6-Chang 8 section of the Yanchang Formation. J Pet Sci Eng. 2021;196:107783.Search in Google Scholar
[31] Wang Z, Jiang Z, Yang R. Pore structure characteristics and their control on permeability in tight sandstone reservoirs: Insights from the Yanchang Formation in the Ordos Basin, China. Energy Explor Exploit. 2020;38(4):881–95.Search in Google Scholar
[32] Zhu J, Liu X, Zhang Y. Pore characteristics and their influence on reservoir properties of tight sandstones: A case study from the Upper Triassic Yanchang Formation, Ordos Basin, China. Mar Pet Geol. 2017;85:61–74.Search in Google Scholar
[33] Pittman ED. Relationships between petrophysical properties of sandstone reservoirs. AAPG Bull. 1973;57(2):349–69.Search in Google Scholar
[34] Bloch S. Empirical prediction of porosity and permeability in sandstones. AAPG Bull. 1991;75(7):1145–60.10.1306/20B23C73-170D-11D7-8645000102C1865DSearch in Google Scholar
[35] Aljawad MS, Ali AA, Abdulkhadim MD. Comparison of petrophysical properties measurement methods in Sandston rocks. Iraqi J Chem Pet Eng. 2018;19(2);15–20.10.31699/IJCPE.2018.2.3Search in Google Scholar
[36] Lai J, Zhang L, Wang Z. Quantitative characterization of pore structure and its impact on reservoir properties in tight sandstone reservoirs using high-pressure mercury injection and nuclear magnetic resonance techniques. Mar Pet Geol. 2016;73:1–15.Search in Google Scholar
[37] Li X, Chen H, Zhao M. Pore structure and fractal analysis of tight sandstones in the Yanchang Formation, Ordos Basin: Implications for reservoir quality and oil production. Mar Pet Geol. 2021;123:104745. 10.1016/j.marpetgeo.2020.104745.Search in Google Scholar
[38] Sun L, Liu Z, Zhang J. Fractal analysis of the pore structure and its effect on permeability in tight sandstones: A case study from the Lower Paleozoic of the Tarim Basin. J Geophys Res: Solid Earth. 2022;127(7):e2022JB024054. 10.1029/2022JB024054.Search in Google Scholar
[39] Meng X, Li Y, Zhang Q. Quantitative evaluation of reservoir pore structure based on nuclear magnetic resonance logging. Geophysics. 2019;84(6):D547–56.Search in Google Scholar
[40] Lai J, Wang G., Wang Z, Chen J, Pang X. A review on pore structure characterization in tight sandstones. Earth-Sci Rev. 2018;177:436–57.10.1016/j.earscirev.2017.12.003Search in Google Scholar
[41] Sing KSW, Hadi MZ, Sharma K. Applications of nuclear magnetic resonance in petroleum geology and engineering: A review. J Appl Geophys. 2021;187:104410. 10.1016/j.jappgeo.2021.104410.Search in Google Scholar
[42] Hirasaki GJ, Zhang T. Surface relaxation in nuclear magnetic resonance studies of porous media. J Pet Sci Eng. 2003;38(3–4):239–48. 10.1016/S0920-4105(03)00070-0.Search in Google Scholar
[43] Rezaee MR, Qiao Q, Clennell B, Keith C, Moss A. NMR T2 cut-off determination for shale gas and tight gas reservoirs: A case study from the Western Australian Basin. Mar Pet Geol. 2012a;32(1):126–37.Search in Google Scholar
[44] Jiang Z, Liu Y, Liu K, Wang Y. Fractal characteristics of pore-throat structures and their effect on permeability in tight oil reservoirs. J Pet Sci Eng. 2017;159:76–84.Search in Google Scholar
[45] Pittman ED. Relationship of porosity and permeability to various parameters derived from mercury injection-capillary pressure curves for sandstone. AAPG Bull. 1992;76(2):191–8.10.1306/BDFF87A4-1718-11D7-8645000102C1865DSearch in Google Scholar
[46] Xu Y, Torres-Verdin C. Use of nuclear magnetic resonance to quantify pore structure characteristics of tight reservoirs. SPE Reserv Eval Eng. 2013;16(1):56–67.Search in Google Scholar
[47] Xu Y, Zhang C, Zhou Z. Fractal analysis of pore structure in shale reservoirs using NMR and mercury intrusion. Fuel. 2021;283:118951. 10.1016/j.fuel.2020.118951.Search in Google Scholar
[48] Wang X, Liu J, Zhang L. Fractal analysis of pore structure in sandstone reservoirs: A comparison of NMR and mercury intrusion porosimetry methods. J Nat Gas Sci Eng. 2021;88:103732. 10.1016/j.jngse.2021.103732.Search in Google Scholar
[49] Zhu R, Wu S, Su L, Cui J, Mao Z, Zhang X. Problems and future works ofporous texture characterization of tight reservoirs in China. Acta Petrolei Sin. 2016;37(11):1323–36.Search in Google Scholar
[50] Xiao D, Jiang S, Thul D, Huang W, Lu Z, Lu S. Combining rate-controlled porosimetry and NMR to probe full-range pore throat structures and their evolution features in tight sands: A case study in the Songliao Basin, China. Mar Pet Geol. 2017;83:111–23.10.1016/j.marpetgeo.2017.03.003Search in Google Scholar
[51] Shao X, Pang X, Li H, Zhang X. Fractal analysis of pore network in tight gas sandstones using NMR method: a case study from the Ordos Basin, China. Energy Fuels. 2017;31(10):10358–68.10.1021/acs.energyfuels.7b01007Search in Google Scholar
[52] Wang F, Yang K, Cai J. Fractal characterization of tight oil reservoir pore structure using nuclear magnetic resonance and mercury intrusion porosimetry. Fractals. 2018;26(2):1840017.10.1142/S0218348X18400170Search in Google Scholar
[53] Yu D, Wang S, Zhang Z. Fractal characteristics of shale pores and their correlation with permeability. Fuel. 2023;339:127289.Search in Google Scholar
[54] Chen Z, Wang T, Wu X. A comparative study of NMR and mercury intrusion methods for determining pore structure in shale reservoirs. J Pet Sci Eng. 2020;191:107132.Search in Google Scholar
[55] Zhang L, Li L, Zhou Z. Comparison of NMR and mercury intrusion for evaluating pore structure in sandstone reservoirs. Geophys Prospecting. 2021;69(3):1082–95.Search in Google Scholar
[56] Liu Q, Zhang Y, Li X. Impact of fractal dimension on fluid flow and pore structure in carbonate reservoirs. Energy Explor Exploit. 2022;40(6):2635–52.Search in Google Scholar
[57] Lv C, Guo Z, Zhang L, Wu X. Impact of fractal dimension on the permeability of tight sandstones. J Nat Gas Sci Eng. 2020;76:103209.Search in Google Scholar
[58] Xie S, Li X, Li J, Chen J. Fractal characterization of pore-throat structure and its effect on permeability in tight gas sandstones. Mar Pet Geol. 2018;97:54–65.Search in Google Scholar
[59] Rezaee MR, Saeedi A, Clennell MB. Tight gas sands permeability estimation from mercury injection capillary pressure and nuclear magnetic resonance data. J Pet Sci Eng. 2012b;88–89:92–9.10.1016/j.petrol.2011.12.014Search in Google Scholar
[60] Bi X, Wang Y, Tang X, Luo W, Hao C, Hou M. Diagenesis variation in different distributary channels of shallow water lacustrine delta deposits and implication for high-quality reservoir prediction: A case study in the Chang 8 Member in Caijiamiao Area, Sw Ordos Basin, China. Minerals. 2024;14(10):987.10.3390/min14100987Search in Google Scholar
[61] Johnson B, Williams C. Controls on porosity evolution in subaqueous distributary channel systems. Mar Geol. 2022;87(4):567–82.Search in Google Scholar
[62] Liu S, Li J, Jin F, Liu H, Wang M, Cheng Y, et al. Genesis of efficient reservoirs in mixed sedimentary setting: a case study of Benxi Formation in the Gaoqiao area, Ordos Basin. Turkish J Earth Sci. 2024;33(2):118–45.10.55730/1300-0985.1903Search in Google Scholar
[63] Chi G, Giles PS, Williamson MA, Lavoie D, Bertrand R. Diagenetic history and porosity evolution of Upper Carboniferous sandstones from the Spring Valley #1 well, Maritimes Basin, Canada–implications for reservoir development. J Geochem Explor. 2003;80(2):171–91.10.1016/S0375-6742(03)00190-0Search in Google Scholar
[64] Xu C, Li X, He S. Fractal characterization of pore structure of tight sandstones based on high-pressure mercury intrusion porosimetry. J Pet Sci Eng. 2019;176:213–23.Search in Google Scholar
[65] Cao J, Chen C, Cheng H. Effect of diagenesis on microheterogeneity of deepwater tight sandstone reservoirs: A case study from the Triassic Chang 7 oil-bearing formation in the Heshui area, Ordos Basin, NW China. Acta Sedimentologica Sin. 2021;39(4):1031–46. 10.14027/j.issn.1000⁃0550.2020.040.Search in Google Scholar
[66] Zheng Y, Zheng H, Kissel C, Lai C. Sedimentation rate control on diagenesis, East China Sea sediments. Phys Earth Planet Inter. 2011;187(3–4):301–9. 10.1016/j.pepi.2011.05.005.Search in Google Scholar
[67] Quasim MA, Khan S, Srivastava VK, Ghaznavi AA, Ahmad AH. Role of cementation and compaction in controlling the reservoir quality of the Middle to Late Jurassic Sandstones, Jara dome, Kachchh Basin, western India. Geol J. 2021;56(2). 10.1002/gj.3989.Search in Google Scholar
[68] Carling PA, Gölz E. Hydrodynamic controls on sediment sorting and distribution in braided and distributary channel systems. Sedimentology. 2023;70(2):341–59.Search in Google Scholar
[69] Zhang L, Bao Z, Dou L, Xu Q. Diagenetic alterations related to sedimentary architecture of deltaic distributary channels in red beds of the Cretaceous Yaojia Formation, Songliao Basin. J Pet Sci Eng. 2021;203:108564. 10.1016/j.petrol.2021.108564.Search in Google Scholar
[70] Wang R, Chen M, Liu F. Advances in fractal analysis of reservoir pore structures using combined NMR and HPMI techniques. Pet Sci. 2022;19:300–13.Search in Google Scholar
[71] Li Z, Bao Z, Dou L, Zang D, Mao S, Song J. Sedimentary characteristics and pattern of distributary channels in shallow water deltaic red bed succession: A case from the Late Cretaceous Yaojia formation, southern Songliao Basin, NE China. J Pet Sci Eng. 2018:171;1171–90.10.1016/j.petrol.2018.08.006Search in Google Scholar
[72] Wang M, Tang HM, Zeng M, Lin G, Cheng YL, Fang L, et al. Diagenesis and diagenetic facies distribution prediction of the Chang 8 tight oil reservoir in Maling area, Ordos Basin, NW China. Turkish J Earth Sci. 2019;28(3):457–69. 10.3906/yer-1809-13.Search in Google Scholar
© 2025 the author(s), published by De Gruyter
This work is licensed under the Creative Commons Attribution 4.0 International License.
Articles in the same Issue
- Research Articles
- Seismic response and damage model analysis of rocky slopes with weak interlayers
- Multi-scenario simulation and eco-environmental effect analysis of “Production–Living–Ecological space” based on PLUS model: A case study of Anyang City
- Remote sensing estimation of chlorophyll content in rape leaves in Weibei dryland region of China
- GIS-based frequency ratio and Shannon entropy modeling for landslide susceptibility mapping: A case study in Kundah Taluk, Nilgiris District, India
- Natural gas origin and accumulation of the Changxing–Feixianguan Formation in the Puguang area, China
- Spatial variations of shear-wave velocity anomaly derived from Love wave ambient noise seismic tomography along Lembang Fault (West Java, Indonesia)
- Evaluation of cumulative rainfall and rainfall event–duration threshold based on triggering and non-triggering rainfalls: Northern Thailand case
- Pixel and region-oriented classification of Sentinel-2 imagery to assess LULC dynamics and their climate impact in Nowshera, Pakistan
- The use of radar-optical remote sensing data and geographic information system–analytical hierarchy process–multicriteria decision analysis techniques for revealing groundwater recharge prospective zones in arid-semi arid lands
- Effect of pore throats on the reservoir quality of tight sandstone: A case study of the Yanchang Formation in the Zhidan area, Ordos Basin
- Hydroelectric simulation of the phreatic water response of mining cracked soil based on microbial solidification
- Spatial-temporal evolution of habitat quality in tropical monsoon climate region based on “pattern–process–quality” – a case study of Cambodia
- Early Permian to Middle Triassic Formation petroleum potentials of Sydney Basin, Australia: A geochemical analysis
- Micro-mechanism analysis of Zhongchuan loess liquefaction disaster induced by Jishishan M6.2 earthquake in 2023
- Prediction method of S-wave velocities in tight sandstone reservoirs – a case study of CO2 geological storage area in Ordos Basin
- Ecological restoration in valley area of semiarid region damaged by shallow buried coal seam mining
- Hydrocarbon-generating characteristics of Xujiahe coal-bearing source rocks in the continuous sedimentary environment of the Southwest Sichuan
- Hazard analysis of future surface displacements on active faults based on the recurrence interval of strong earthquakes
- Structural characterization of the Zalm district, West Saudi Arabia, using aeromagnetic data: An approach for gold mineral exploration
- Research on the variation in the Shields curve of silt initiation
- Reuse of agricultural drainage water and wastewater for crop irrigation in southeastern Algeria
- Assessing the effectiveness of utilizing low-cost inertial measurement unit sensors for producing as-built plans
- Analysis of the formation process of a natural fertilizer in the loess area
- Machine learning methods for landslide mapping studies: A comparative study of SVM and RF algorithms in the Oued Aoulai watershed (Morocco)
- Chemical dissolution and the source of salt efflorescence in weathering of sandstone cultural relics
- Molecular simulation of methane adsorption capacity in transitional shale – a case study of Longtan Formation shale in Southern Sichuan Basin, SW China
- Evolution characteristics of extreme maximum temperature events in Central China and adaptation strategies under different future warming scenarios
- Estimating Bowen ratio in local environment based on satellite imagery
- 3D fusion modeling of multi-scale geological structures based on subdivision-NURBS surfaces and stratigraphic sequence formalization
- Comparative analysis of machine learning algorithms in Google Earth Engine for urban land use dynamics in rapidly urbanizing South Asian cities
- Study on the mechanism of plant root influence on soil properties in expansive soil areas
- Simulation of seismic hazard parameters and earthquakes source mechanisms along the Red Sea rift, western Saudi Arabia
- Tectonics vs sedimentation in foredeep basins: A tale from the Oligo-Miocene Monte Falterona Formation (Northern Apennines, Italy)
- Investigation of landslide areas in Tokat-Almus road between Bakımlı-Almus by the PS-InSAR method (Türkiye)
- Predicting coastal variations in non-storm conditions with machine learning
- Cross-dimensional adaptivity research on a 3D earth observation data cube model
- Geochronology and geochemistry of late Paleozoic volcanic rocks in eastern Inner Mongolia and their geological significance
- Spatial and temporal evolution of land use and habitat quality in arid regions – a case of Northwest China
- Ground-penetrating radar imaging of subsurface karst features controlling water leakage across Wadi Namar dam, south Riyadh, Saudi Arabia
- Rayleigh wave dispersion inversion via modified sine cosine algorithm: Application to Hangzhou, China passive surface wave data
- Fractal insights into permeability control by pore structure in tight sandstone reservoirs, Heshui area, Ordos Basin
- Debris flow hazard characteristic and mitigation in Yusitong Gully, Hengduan Mountainous Region
- Research on community characteristics of vegetation restoration in hilly power engineering based on multi temporal remote sensing technology
- Identification of radial drainage networks based on topographic and geometric features
- Trace elements and melt inclusion in zircon within the Qunji porphyry Cu deposit: Application to the metallogenic potential of the reduced magma-hydrothermal system
- Pore, fracture characteristics and diagenetic evolution of medium-maturity marine shales from the Silurian Longmaxi Formation, NE Sichuan Basin, China
- Study of the earthquakes source parameters, site response, and path attenuation using P and S-waves spectral inversion, Aswan region, south Egypt
- Source of contamination and assessment of potential health risks of potentially toxic metal(loid)s in agricultural soil from Al Lith, Saudi Arabia
- Regional spatiotemporal evolution and influencing factors of rural construction areas in the Nanxi River Basin via GIS
- An efficient network for object detection in scale-imbalanced remote sensing images
- Effect of microscopic pore–throat structure heterogeneity on waterflooding seepage characteristics of tight sandstone reservoirs
- Environmental health risk assessment of Zn, Cd, Pb, Fe, and Co in coastal sediments of the southeastern Gulf of Aqaba
- A modified Hoek–Brown model considering softening effects and its applications
- Evaluation of engineering properties of soil for sustainable urban development
- The spatio-temporal characteristics and influencing factors of sustainable development in China’s provincial areas
- Application of a mixed additive and multiplicative random error model to generate DTM products from LiDAR data
- Gold vein mineralogy and oxygen isotopes of Wadi Abu Khusheiba, Jordan
- Prediction of surface deformation time series in closed mines based on LSTM and optimization algorithms
- 2D–3D Geological features collaborative identification of surrounding rock structural planes in hydraulic adit based on OC-AINet
- Spatiotemporal patterns and drivers of Chl-a in Chinese lakes between 1986 and 2023
- Land use classification through fusion of remote sensing images and multi-source data
- Nexus between renewable energy, technological innovation, and carbon dioxide emissions in Saudi Arabia
- Analysis of the spillover effects of green organic transformation on sustainable development in ethnic regions’ agriculture and animal husbandry
- Factors impacting spatial distribution of black and odorous water bodies in Hebei
- Large-scale shaking table tests on the liquefaction and deformation responses of an ultra-deep overburden
- Impacts of climate change and sea-level rise on the coastal geological environment of Quang Nam province, Vietnam
- Reservoir characterization and exploration potential of shale reservoir near denudation area: A case study of Ordovician–Silurian marine shale, China
- Seismic prediction of Permian volcanic rock reservoirs in Southwest Sichuan Basin
- Application of CBERS-04 IRS data to land surface temperature inversion: A case study based on Minqin arid area
- Geological characteristics and prospecting direction of Sanjiaoding gold mine in Saishiteng area
- Research on the deformation prediction model of surrounding rock based on SSA-VMD-GRU
- Geochronology, geochemical characteristics, and tectonic significance of the granites, Menghewula, Southern Great Xing’an range
- Hazard classification of active faults in Yunnan base on probabilistic seismic hazard assessment
- Characteristics analysis of hydrate reservoirs with different geological structures developed by vertical well depressurization
- Estimating the travel distance of channelized rock avalanches using genetic programming method
- Landscape preferences of hikers in Three Parallel Rivers Region and its adjacent regions by content analysis of user-generated photography
- New age constraints of the LGM onset in the Bohemian Forest – Central Europe
- Characteristics of geological evolution based on the multifractal singularity theory: A case study of Heyu granite and Mesozoic tectonics
- Soil water content and longitudinal microbiota distribution in disturbed areas of tower foundations of power transmission and transformation projects
- Oil accumulation process of the Kongdian reservoir in the deep subsag zone of the Cangdong Sag, Bohai Bay Basin, China
- Investigation of velocity profile in rock–ice avalanche by particle image velocimetry measurement
- Optimizing 3D seismic survey geometries using ray tracing and illumination modeling: A case study from Penobscot field
- Sedimentology of the Phra That and Pha Daeng Formations: A preliminary evaluation of geological CO2 storage potential in the Lampang Basin, Thailand
- Improved classification algorithm for hyperspectral remote sensing images based on the hybrid spectral network model
- Map analysis of soil erodibility rates and gully erosion sites in Anambra State, South Eastern Nigeria
- Identification and driving mechanism of land use conflict in China’s South-North transition zone: A case study of Huaihe River Basin
- Evaluation of the impact of land-use change on earthquake risk distribution in different periods: An empirical analysis from Sichuan Province
- A test site case study on the long-term behavior of geotextile tubes
- An experimental investigation into carbon dioxide flooding and rock dissolution in low-permeability reservoirs of the South China Sea
- Detection and semi-quantitative analysis of naphthenic acids in coal and gangue from mining areas in China
- Comparative effects of olivine and sand on KOH-treated clayey soil
- YOLO-MC: An algorithm for early forest fire recognition based on drone image
- Earthquake building damage classification based on full suite of Sentinel-1 features
- Potential landslide detection and influencing factors analysis in the upper Yellow River based on SBAS-InSAR technology
- Assessing green area changes in Najran City, Saudi Arabia (2013–2022) using hybrid deep learning techniques
- An advanced approach integrating methods to estimate hydraulic conductivity of different soil types supported by a machine learning model
- Hybrid methods for land use and land cover classification using remote sensing and combined spectral feature extraction: A case study of Najran City, KSA
- Streamlining digital elevation model construction from historical aerial photographs: The impact of reference elevation data on spatial accuracy
- Analysis of urban expansion patterns in the Yangtze River Delta based on the fusion impervious surfaces dataset
- A metaverse-based visual analysis approach for 3D reservoir models
- Late Quaternary record of 100 ka depositional cycles on the Larache shelf (NW Morocco)
- Integrated well-seismic analysis of sedimentary facies distribution: A case study from the Mesoproterozoic, Ordos Basin, China
- Study on the spatial equilibrium of cultural and tourism resources in Macao, China
- Urban road surface condition detecting and integrating based on the mobile sensing framework with multi-modal sensors
- Application of improved sine cosine algorithm with chaotic mapping and novel updating methods for joint inversion of resistivity and surface wave data
- The synergistic use of AHP and GIS to assess factors driving forest fire potential in a peat swamp forest in Thailand
- Dynamic response analysis and comprehensive evaluation of cement-improved aeolian sand roadbed
- Rock control on evolution of Khorat Cuesta, Khorat UNESCO Geopark, Northeastern Thailand
- Gradient response mechanism of carbon storage: Spatiotemporal analysis of economic-ecological dimensions based on hybrid machine learning
- Comparison of several seismic active earth pressure calculation methods for retaining structures
- Mantle dynamics and petrogenesis of Gomer basalts in the Northwestern Ethiopia: A geochemical perspective
- Study on ground deformation monitoring in Xiong’an New Area from 2021 to 2023 based on DS-InSAR
- Paleoenvironmental characteristics of continental shale and its significance to organic matter enrichment: Taking the fifth member of Xujiahe Formation in Tianfu area of Sichuan Basin as an example
- Equipping the integral approach with generalized least squares to reconstruct relict channel profile and its usage in the Shanxi Rift, northern China
- InSAR-driven landslide hazard assessment along highways in hilly regions: A case-based validation approach
- Attribution analysis of multi-temporal scale surface streamflow changes in the Ganjiang River based on a multi-temporal Budyko framework
- Maps analysis of Najran City, Saudi Arabia to enhance agricultural development using hybrid system of ANN and multi-CNN models
- Hybrid deep learning with a random forest system for sustainable agricultural land cover classification using DEM in Najran, Saudi Arabia
- Long-term evolution patterns of groundwater depth and lagged response to precipitation in a complex aquifer system: Insights from Huaibei Region, China
- Remote sensing and machine learning for lithology and mineral detection in NW, Pakistan
- Spatial–temporal variations of NO2 pollution in Shandong Province based on Sentinel-5P satellite data and influencing factors
- Numerical modeling of geothermal energy piles with sensitivity and parameter variation analysis of a case study
- Stability analysis of valley-type upstream tailings dams using a 3D model
- Variation characteristics and attribution analysis of actual evaporation at monthly time scale from 1982 to 2019 in Jialing River Basin, China
- Investigating machine learning and statistical approaches for landslide susceptibility mapping in Minfeng County, Xinjiang
- Investigating spatiotemporal patterns for comprehensive accessibility of service facilities by location-based service data in Nanjing (2016–2022)
- A pre-treatment method for particle size analysis of fine-grained sedimentary rocks, Bohai Bay Basin, China
- Study on the formation mechanism of the hard-shell layer of liquefied silty soil
- Comprehensive analysis of agricultural CEE: Efficiency assessment, mechanism identification, and policy response – A case study of Anhui Province
- Simulation study on the damage and failure mechanism of the surrounding rock in sanded dolomite tunnels
- Towards carbon neutrality: Spatiotemporal evolution and key influences on agricultural ecological efficiency in Northwest China
- High-frequency cycles drive the cyclical enrichment of oil in porous carbonate reservoirs: A case study of the Khasib Formation in E Oilfield, Mesopotamian Basin, Iraq
- Reconstruction of digital core models of granular rocks using mathematical morphology
- Spatial–temporal differentiation law of habitat quality and its driving mechanism in the typical plateau areas of the Loess Plateau in the recent 30 years
- A machine-learning-based approach to predict potential oil sites: Conceptual framework and experimental evaluation
- Effects of landscape pattern change on waterbird diversity in Xianghai Nature Reserve
- Research on intelligent classification method of highway tunnel surrounding rock classification based on parameters while drilling
- River morphology and tectono-sedimentary analysis of a shallow river delta: A case study of Putaohua oil layer in Saertu oilfield (L. Cretaceous), China
- Dynamic change in quarterly FVC of urban parks based on multi-spectral UAV images: A case study of people’s park and harmony park in Xinxiang, China
- Review Articles
- Humic substances influence on the distribution of dissolved iron in seawater: A review of electrochemical methods and other techniques
- Applications of physics-informed neural networks in geosciences: From basic seismology to comprehensive environmental studies
- Ore-controlling structures of granite-related uranium deposits in South China: A review
- Shallow geological structure features in Balikpapan Bay East Kalimantan Province – Indonesia
- A review on the tectonic affinity of microcontinents and evolution of the Proto-Tethys Ocean in Northeastern Tibet
- Advancements in machine learning applications for mineral prospecting and geophysical inversion: A review
- Special Issue: Natural Resources and Environmental Risks: Towards a Sustainable Future - Part II
- Depopulation in the Visok micro-region: Toward demographic and economic revitalization
- Special Issue: Geospatial and Environmental Dynamics - Part II
- Advancing urban sustainability: Applying GIS technologies to assess SDG indicators – a case study of Podgorica (Montenegro)
- Spatiotemporal and trend analysis of common cancers in men in Central Serbia (1999–2021)
- Minerals for the green agenda, implications, stalemates, and alternatives
- Spatiotemporal water quality analysis of Vrana Lake, Croatia
- Functional transformation of settlements in coal exploitation zones: A case study of the municipality of Stanari in Republic of Srpska (Bosnia and Herzegovina)
- Hypertension in AP Vojvodina (Northern Serbia): A spatio-temporal analysis of patients at the Institute for Cardiovascular Diseases of Vojvodina
- Regional patterns in cause-specific mortality in Montenegro, 1991–2019
- Spatio-temporal analysis of flood events using GIS and remote sensing-based approach in the Ukrina River Basin, Bosnia and Herzegovina
- Flash flood susceptibility mapping using LiDAR-Derived DEM and machine learning algorithms: Ljuboviđa case study, Serbia
- Geocultural heritage as a basis for geotourism development: Banjska Monastery, Zvečan (Serbia)
- Assessment of groundwater potential zones using GIS and AHP techniques – A case study of the zone of influence of Kolubara Mining Basin
- Impact of the agri-geographical transformation of rural settlements on the geospatial dynamics of soil erosion intensity in municipalities of Central Serbia
- Where faith meets geomorphology: The cultural and religious significance of geodiversity explored through geospatial technologies
- Applications of local climate zone classification in European cities: A review of in situ and mobile monitoring methods in urban climate studies
- Complex multivariate water quality impact assessment on Krivaja River
- Ionization hotspots near waterfalls in Eastern Serbia’s Stara Planina Mountain
- Shift in landscape use strategies during the transition from the Bronze age to Iron age in Northwest Serbia
- Assessing the geotourism potential of glacial lakes in Plav, Montenegro: A multi-criteria assessment by using the M-GAM model
- Flash flood potential index at national scale: Susceptibility assessment within catchments
- SWAT modelling and MCDM for spatial valuation in small hydropower planning
- Disaster risk perception and local resilience near the “Duboko” landfill: Challenges of governance, management, trust, and environmental communication in Serbia