Environmental health risk assessment of Zn, Cd, Pb, Fe, and Co in coastal sediments of the southeastern Gulf of Aqaba
-
Abdelbaset El-Sorogy

 ,
Khaled Al-Kahtany
,
Khaled Al-Kahtany

Abstract
This study provides a comprehensive assessment of environmental and human health risks associated with potentially toxic elements in the coastal sediments of the Gulf of Aqaba. A total of 33 sediment samples were analyzed using inductively coupled plasma mass spectrometry, revealing Fe (1,526–5,123 mg/kg), Zn (16.8–32.0 mg/kg), Pb (3.5–9.1 mg/kg), Co (2.2–6.4 mg/kg), and Cd (0.05–0.18 mg/kg). The concentrations detected were within acceptable limits and below the Interim Sediment Quality Guidelines, indicating minimal environmental risk. Environmental indices, including the pollution index, modified contamination degree, pollution load index, hazard index, and lifetime cancer risk indicate no contamination or health risks for adults or children through ingestion and dermal contact pathways. Principal component and correlation analysis suggest that Fe, Zn, and Co primarily originate from natural geological processes due to their strong association with elements typically derived from bedrock weathering, while minor anthropogenic contributions may arise from tourism and coastal activities. The findings confirm that the sediments pose no environmental or health risks, providing a baseline for future monitoring and pollution management in the Gulf of Aqaba.
1 Introduction
The Gulf of Aqaba is located east of the Sinai Peninsula and west of the Arabian Peninsula, between latitudes 28–30°N and longitudes 34–36°E (Figure 1). It spans approximately 160 km in length and up to 24 km in width, resulting in the convergence of the Arabian and African tectonic plates. The Gulf is connected to the Red Sea via the Strait of Tiran, with its deepest point reaching 1,850 m below sea level [1,2]. The Gulf of Aqaba is a semi-enclosed water basin linked to the Red Sea through a relatively narrow and shallow strait. It plays a vital role in shaping its hydrodynamics through tidal and current activity. The Gulf is rich in marine biodiversity, hosting hundreds of coral species, over 100 types of coral reefs, more than 800 varieties of colorful fish, and numerous crustaceans and mollusks species, many of which are endemic to this region [2,3]. Industrial activities, such as oil transportation and desalination, and tourism-related construction projects may contribute to elevated levels of Zn and Pb in the coastal sediments through runoff and direct discharge [4,5]. In recent years, Saudi Arabia has undertaken extensive tourism development projects along its southern Gulf of Aqaba coastline. Simultaneously, the Kingdom is heavily investing in environmental monitoring initiatives to safeguard the ecological integrity of its coastal areas. The potential contamination of marine environments with potentially toxic elements (PTEs) remains a major challenge for environmental scientists, necessitating proactive strategies to mitigate both health and ecological consequences. Coastal sediments are derived from Precambrian basement rocks, including granites and metamorphic formations, contributing to the trace element composition. In addition, marine sediments contain silicate minerals, carbonates, and biogenic components from coral reefs and marine organisms. PTEs, such as Cu, Pb, Zn, and Cd, may originate from both the natural weathering of rocks and human activities, including maritime traffic and coastal development.
![Figure 1
Location map and sampling sites modified after [4] (source: Esri, Maxar, Earthstar Geographics).](/document/doi/10.1515/geo-2025-0807/asset/graphic/j_geo-2025-0807_fig_001.jpg)
Location map and sampling sites modified after [4] (source: Esri, Maxar, Earthstar Geographics).
Excessive environmental PTEs act as persistent pollutants, accumulating in marine sediments or entering the water column, where marine organisms absorb them. This bioaccumulation facilitates the transfer of PTEs through the food chain, ultimately reaching humans via inhalation, ingesting contaminated silt or dust, and dermal contact, posing significant health risks [6,7,8]. Several studies have investigated PTE distribution in sediments and seawater along the Red Sea coast [9,10,11,12]. However, most of these studies have primarily focused on environmental risk assessments while neglecting health risk evaluations. Although sediment contamination assessments have been conducted in various regions worldwide, research specific to the study area remains limited. Health risk assessments of PTEs in coastal sediments are particularly scarce, highlighting the need for further investigation.
This study aims to:
Quantify the concentrations of Zn, Cd, Pb, Fe, and Co in the coastal sediments of the southeastern Gulf of Aqaba.
Compare these concentrations with international sediment quality guidelines.
Evaluate the potential environmental and human health risks of metal contamination. By addressing these objectives, this research is a foundational reference for future studies and contributes to a better understanding of PTE contamination and its implications in the Gulf of Aqaba.
2 Materials and methods
Thirty-three surface sediment samples were collected manually using a stainless-steel box from beaches along the Saudi coast of the southern Gulf of Aqaba at depths ranging from 1 to 15 cm and mapped in Figure 1. Sampling sites were selected to represent diverse locations across the southern Gulf, including areas influenced by tourism activities in the south (samples 15–27), as well as relatively naturally untapped regions in the north (samples 5–14). However, access to certain restricted areas was not permitted, preventing sample collection from those sites [4]. Samples were collected during a single season. The potential effects of seasonal and tidal variability on metal concentrations were not evaluated in this study. To minimize contamination, all samples were collected using acid-washed tools, stored in sealed polyethylene bags, and transported under controlled conditions.
To assess environmental contamination in the study area, the concentrations of Zn, Cd, Pb, Fe, and Co were measured using inductively coupled plasma mass spectrometry (ICP-MS, NexION 300D, PerkinElmer, USA) at the King Saud University laboratory [4]. ICP-MS calibration was performed using certified reference materials (NIST 1646a) to ensure analytical accuracy and precision. These metals were selected based on their environmental relevance, toxicity, and potential for accumulation. While Zn, Fe, and Co are essential trace elements for marine life, they can become toxic at elevated concentrations. In contrast, Cd and Pb are highly toxic even at low levels and pose significant risks to aquatic ecosystems and human health. These metals are commonly present in environmental samples due to their association with industrial activities, agricultural runoff, and natural geological sources.
Sample preparation and analysis followed internationally recognized standards to ensure data accuracy and reliability. Quality assurance and quality control (QA/QC) measures included the use of blanks, replicates, and determination of detection (LOD) and quantitation limits (LOQ). The LOD values ranged from 0.1 to 0.5 µg/L for Fe, 0.01 to 0.1 µg/L for Zn, 0.01 to 0.1 µg/L for Pb, 0.001 to 0.01 µg/L for Cd, and 0.01 to 0.1 µg/L for Co. The LOQ values were typically 0.5 to 1.0 µg/L for Fe, 0.1 to 0.5 µg/L for Zn and Pb, 0.01 to 0.05 µg/L for Cd, and 0.1 to 0.5 µg/L for Co. The resulting dataset, supported by rigorous statistical analysis of censored observations, provides a reliable foundation for evaluating PTE distribution in the Gulf of Aqaba. The analysis relied on analysis of variance and principal component analysis (PCA), data quality control, reproducibility and transparency, and robustness testing.
To evaluate contamination levels and the ecological risks associated with PTEs, several single and integrated contamination indices were employed. These included the single pollution index (PI), modified contamination degree (mCdeg), and pollution load index (PLI). The calculation procedures, classification of these indices, and the parameters used are detailed in equations (1)–(3) and Table S1, following the most up-to-date and consolidated literature [13,14,15,16,17,18].
In sediment studies, PI is a key metric used to assess the degree of contamination by comparing the concentration of a specific PTE to its background or permissible limit. A PI value greater than 1 indicates contamination, while values below 1 suggest minimal or no pollution. This index helps evaluate soil quality and potential ecological risks.
It is an index used to evaluate the overall level of PTE contamination by summing the contamination factors of multiple elements. It provides a comprehensive assessment of soil pollution severity, with higher values indicating greater contamination. This index is useful for identifying areas at risk and guiding environmental management strategies. Where C n is the PTE content in the soil, B n is the concentration of elements in the Earth’s crust, and CF i is the contamination factor for each element.
It is a comprehensive tool used to assess the overall level of PTE contamination by integrating multiple element concentrations. PLI value >1 indicates pollution, while PLI <1 suggests no significant contamination. This index helps evaluate soil quality, monitor pollution trends, and support environmental management decisions.
To assess health risks for both adults and children through ingestion and dermal contact, various indices were applied, including chronic daily intake (CDI), hazard quotients (HQ), hazard index (HI), cancer risk (CR), and total lifetime cancer risk (LCR). Given the area’s significance as a tourist destination, with activities such as swimming, diving, and beach recreation being common, attention was given to evaluating the health risks associated with dermal contact or ingestion. The calculation methods for these indices are detailed in formulas (4)–(9), while Table S2 outlines the exposure factors used to estimate CDI for non-carcinogenic risks (CRs) [19,20,21]. The reference dose is an estimate of the daily exposure level to PTEs that is unlikely to cause harmful effects on human health over a lifetime [22,23,24,25].
3 Results and discussion
3.1 PTEs concentration and environmental assessment
The coastal sediments in the study area range from fine sand to gravels belonging to different fragments of marine shells. Rock and coral fragments, which result from weathering, are commonly found at the entrances of valleys. Figure 2 illustrates the distribution of PTE concentrations in coastal sediments. The PTE levels varied as follows: Fe ranged from 1,526 to 5,123 µg/g, with an average of 3,376.5 ± 831 µg/g; Zn ranged from 16.8 to 32 µg/g, averaging 24.31 ± 3.7 µg/g; Pb ranged from 3.5 to 9.1 µg/g, with an average of 6.66 ± 1.3 µg/g; Co ranged from 2.2 to 6.4 µg/g, averaging 4.55 ± 1.2 µg/g; and Cd ranged from 0.05 to 0.18 µg/g, with an average of 0.089 ± 0.02 µg/g. Spatial distribution patterns revealed that the highest concentrations were predominantly observed in the southern part of the study area: Fe in sample 14, Pb in sample 15, Zn in sample 29, and Cd in sample 32. Co was an exception, as its highest concentration was recorded in sample 1 in the northern part of the area. This increase may be due to the weathering of basement rocks near the northern coast, particularly granite and alkaline granite formations. In contrast, the lowest concentrations for all PTEs were detected in samples 13, 15, 16, 21, and 26 are mainly located in the southern region.
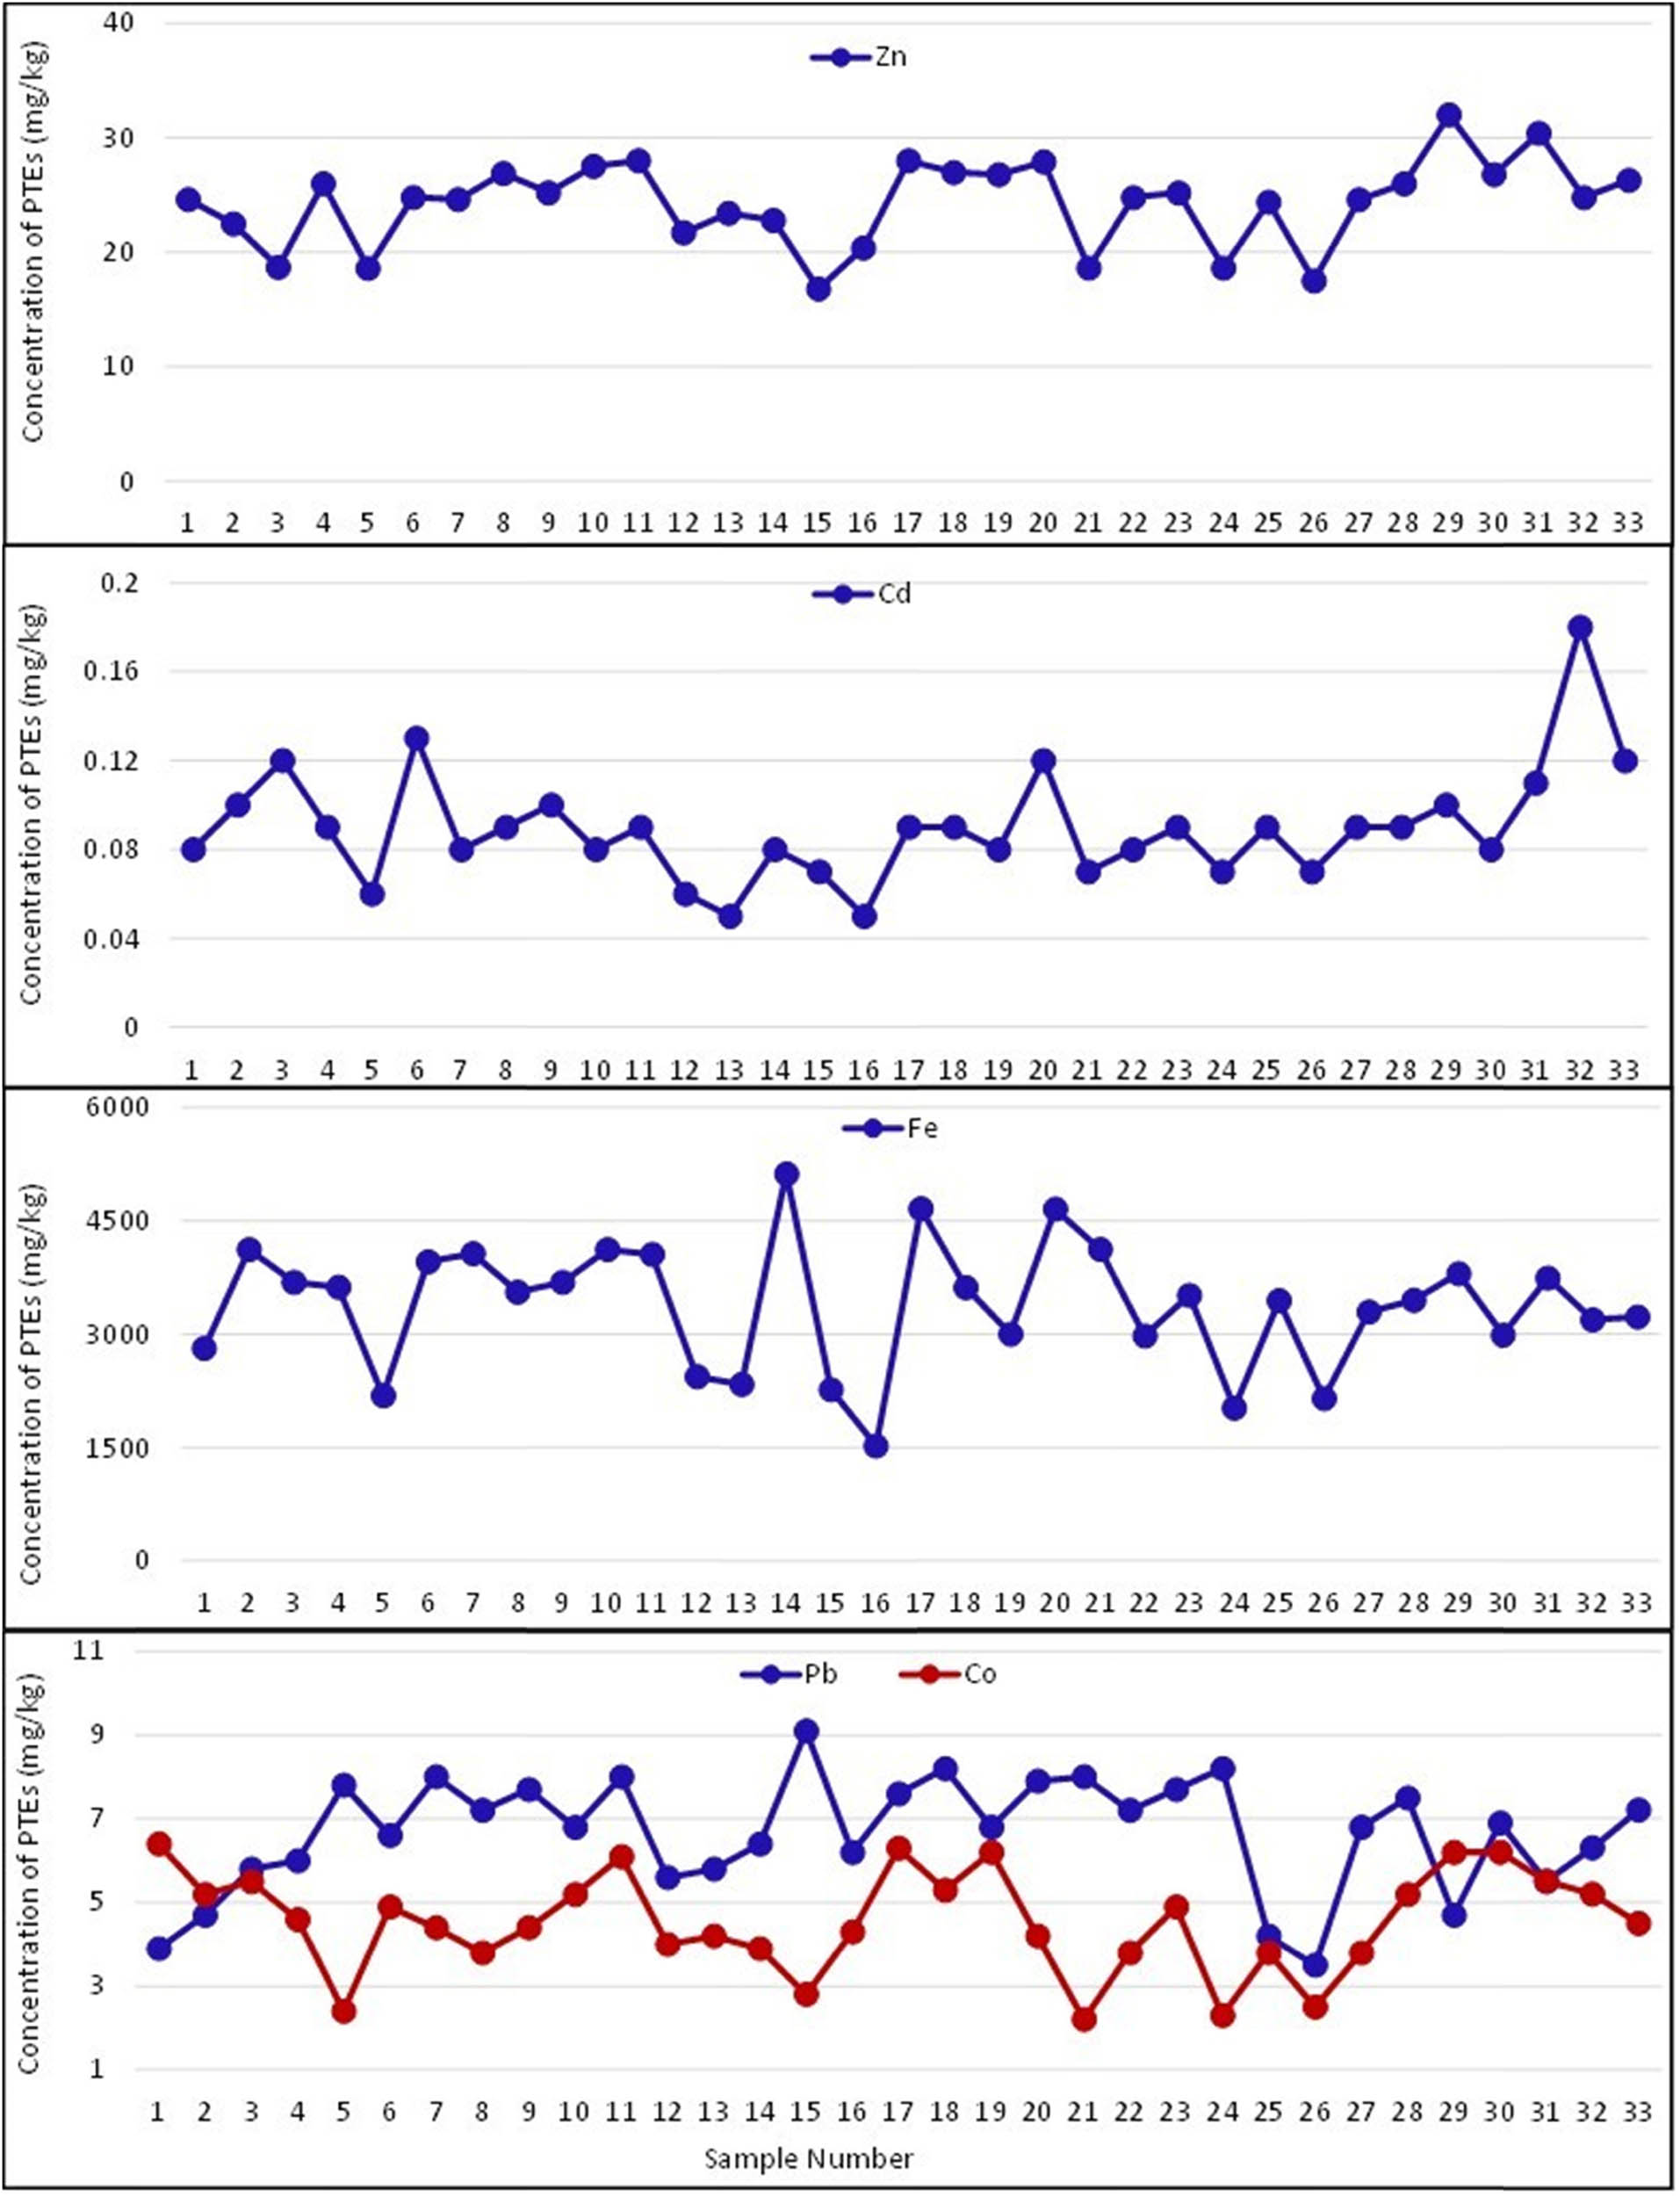
Spatial distribution of PTE concentration per sample location in the study area.
To determine whether the southern coast of the Gulf of Aqaba experiences pollution levels comparable to other regions worldwide, and with reference values for marine sediment quality, it is crucial to assess whether PTE concentrations exceed safe limits, identify pollution sources, and evaluate the effectiveness of local environmental management practices. This comparison is important for guiding environmental defense and conservation efforts. When comparing the present PTE concentrations with the reference values of the interim marine quality guidelines (ISQGs) and the probable effects level (PEL) [26], all study elements fall within safe ranges, as their concentrations are significantly lower than the reference values. This indicates no potential risk of biological effects associated with the metal levels in the sediments. Additionally, the average concentrations of Pb and Zn were lower than those reported for northern China [16], Bohai Bay, China [27], and Earth’s crustal background levels [28,29]. Similarly, the average Co concentration was below the levels documented for Gialova Lagoon, Greece [30], the Al-Khobar region of the Arabian Gulf [31], and Earth’s crustal background. The average Cd concentration was also below the values recorded along the Yemeni coast [32], northern China, Gialova Lagoon, Greece, and Bohai Bay, China. In conclusion, the average Fe concentration was lower than all comparison values listed in Table 1.
Comparison between PTE concentration in the study area (µg/g) and other coastal sediments, background references, and sediment quality guidelines
| Site | Fe | Cd | Zn | Pb | Co | Reference |
|---|---|---|---|---|---|---|
| Present study | 3,377 | 0.09 | 24.31 | 6.66 | 4.55 | |
| Yemen coast, Red Sea | — | 1.10 | 33.10 | 3.60 | — | [33] |
| Al-Khobar area, Arabian Gulf | 7,552 | 0.23 | 52.70 | 5.36 | 4.75 | [32] |
| North Coast, China | — | 0.77 | 60.92 | 21.45 | — | [16] |
| Bohai Bay, China | 46,000 | 0.19 | 112.3 | 32.00 | — | [27] |
| Gialova Lagoon, Greece | 32,000 | 0.13 | — | 35.46 | 14.81 | [31] |
| Earth’s crust shall background | 47,200 | 0.30 | 95.00 | 20.00 | 19.00 | [28] |
| Continental crust background | 56,300 | 0.20 | 70.00 | 12.50 | 25.00 | [29] |
| ISQGs | — | 0.70 | 124.0 | 30.20 | — | [26] |
| PEL | — | 4.21 | 271.0 | 112.0 | — |
The PI is calculated using the concentrations of individual metals in sediments and various reference values, such as preindustrial levels, average crustal levels, background values, baseline concentrations, national criteria, or threshold pollution values. PI is widely applied to classify sediments into three pollution categories (Table S1). In the studied sediments, PI values ranged as follows: Fe (0.032–0.109, average 0.071), Co (0.116–0.337, average 0.239), Zn (0.177–0.337, average 0.256), Cd (0.167–0.6, average 0.303), and Pb (0.175–0.455, average 0.332). These results indicate that the concentrations of the PTEs studied are below threshold pollution levels (Table 2). However, it is important to note that a PI value of below 1 does not necessarily confirm the absence of pollution, as anthropogenic influences or natural background enrichments may still be present [33,34,35].
The distribution values of the PI, mCdeg, and PLI data in coastal sediments
| SN | PI | mCdeg | PLI | ||||
|---|---|---|---|---|---|---|---|
| Fe | Zn | Pb | Co | Cd | |||
| 1 | 0.060 | 0.259 | 0.195 | 0.337 | 0.267 | 0.624 | 0.291 |
| 2 | 0.087 | 0.237 | 0.235 | 0.274 | 0.333 | 0.737 | 0.322 |
| 3 | 0.078 | 0.197 | 0.290 | 0.289 | 0.400 | 0.854 | 0.334 |
| 4 | 0.077 | 0.274 | 0.300 | 0.242 | 0.300 | 0.690 | 0.323 |
| 5 | 0.046 | 0.196 | 0.390 | 0.126 | 0.200 | 0.494 | 0.239 |
| 6 | 0.084 | 0.261 | 0.330 | 0.258 | 0.433 | 0.913 | 0.347 |
| 7 | 0.086 | 0.259 | 0.400 | 0.232 | 0.267 | 0.640 | 0.320 |
| 8 | 0.075 | 0.283 | 0.360 | 0.200 | 0.300 | 0.691 | 0.318 |
| 9 | 0.078 | 0.265 | 0.385 | 0.232 | 0.333 | 0.754 | 0.335 |
| 10 | 0.087 | 0.289 | 0.340 | 0.274 | 0.267 | 0.645 | 0.331 |
| 11 | 0.086 | 0.295 | 0.400 | 0.321 | 0.300 | 0.713 | 0.346 |
| 12 | 0.052 | 0.228 | 0.280 | 0.211 | 0.200 | 0.749 | 0.366 |
| 13 | 0.049 | 0.246 | 0.290 | 0.221 | 0.167 | 0.683 | 0.358 |
| 14 | 0.109 | 0.240 | 0.320 | 0.205 | 0.267 | 0.869 | 0.444 |
| 15 | 0.048 | 0.177 | 0.455 | 0.147 | 0.233 | 0.564 | 0.258 |
| 16 | 0.032 | 0.215 | 0.310 | 0.226 | 0.167 | 0.684 | 0.332 |
| 17 | 0.099 | 0.295 | 0.380 | 0.332 | 0.300 | 0.724 | 0.371 |
| 18 | 0.077 | 0.284 | 0.410 | 0.279 | 0.300 | 0.712 | 0.344 |
| 19 | 0.064 | 0.282 | 0.340 | 0.326 | 0.267 | 0.644 | 0.316 |
| 20 | 0.099 | 0.294 | 0.395 | 0.221 | 0.400 | 0.872 | 0.363 |
| 21 | 0.087 | 0.196 | 0.400 | 0.116 | 0.233 | 0.557 | 0.270 |
| 22 | 0.063 | 0.261 | 0.360 | 0.200 | 0.267 | 0.621 | 0.287 |
| 23 | 0.074 | 0.265 | 0.385 | 0.258 | 0.300 | 0.696 | 0.323 |
| 24 | 0.043 | 0.196 | 0.410 | 0.121 | 0.233 | 0.556 | 0.247 |
| 25 | 0.073 | 0.257 | 0.210 | 0.200 | 0.300 | 0.658 | 0.281 |
| 26 | 0.046 | 0.184 | 0.175 | 0.132 | 0.233 | 0.515 | 0.215 |
| 27 | 0.070 | 0.259 | 0.340 | 0.200 | 0.300 | 0.682 | 0.306 |
| 28 | 0.073 | 0.274 | 0.375 | 0.274 | 0.300 | 0.703 | 0.333 |
| 29 | 0.081 | 0.337 | 0.235 | 0.326 | 0.333 | 0.779 | 0.369 |
| 30 | 0.063 | 0.282 | 0.345 | 0.326 | 0.267 | 0.655 | 0.331 |
| 31 | 0.079 | 0.320 | 0.275 | 0.289 | 0.367 | 0.828 | 0.368 |
| 32 | 0.068 | 0.261 | 0.315 | 0.274 | 0.600 | 1.187 | 0.351 |
| 33 | 0.068 | 0.277 | 0.360 | 0.237 | 0.400 | 0.855 | 0.326 |
The mCdeg, which assesses overall PTE contamination in sediments and is categorized into seven classes [36], ranged from 0.494 to 1.187, with an average of 0.721. This indicates that the coastal sediments exhibit very low contamination from the studied PTEs (Table 2). Similarly, the PLI, introduced by [37,38], evaluates the overall pollution level of each sample and the severity of contamination at each sampling site [19,39]. The PLI values ranged from 0.2148 to 0.4438 with an average of 0.3236. These results suggest that the coastal sediments studied are not contaminated by the PTEs investigated. These results are entirely consistent with field observations, as the study area remained untouched by human intervention for long periods. However, in the last few years, developmental efforts have been directed toward it, transforming it into a global tourist resort. Therefore, continuous monitoring of PTE levels and identifying their sources are extremely important.
The correlation matrix (Figure 3) revealed a strong positive correlation between Co and Zn (r = 0.719) and a moderate correlation between Fe and Zn (r = 0.517), suggesting that these metals may share common sources, such as industrial activities, natural mineral deposits, or similar geochemical processes [40,41]. In contrast, weak correlations were observed among metal pairs such as Fe–Cd, Zn–Cd, Co–Cd, and Fe–Co. Additionally, negative correlations were identified between Pb–Zn, Co–Pb, and Cd–Pb, indicating independent sources and distinct geochemical behaviors [42,43].
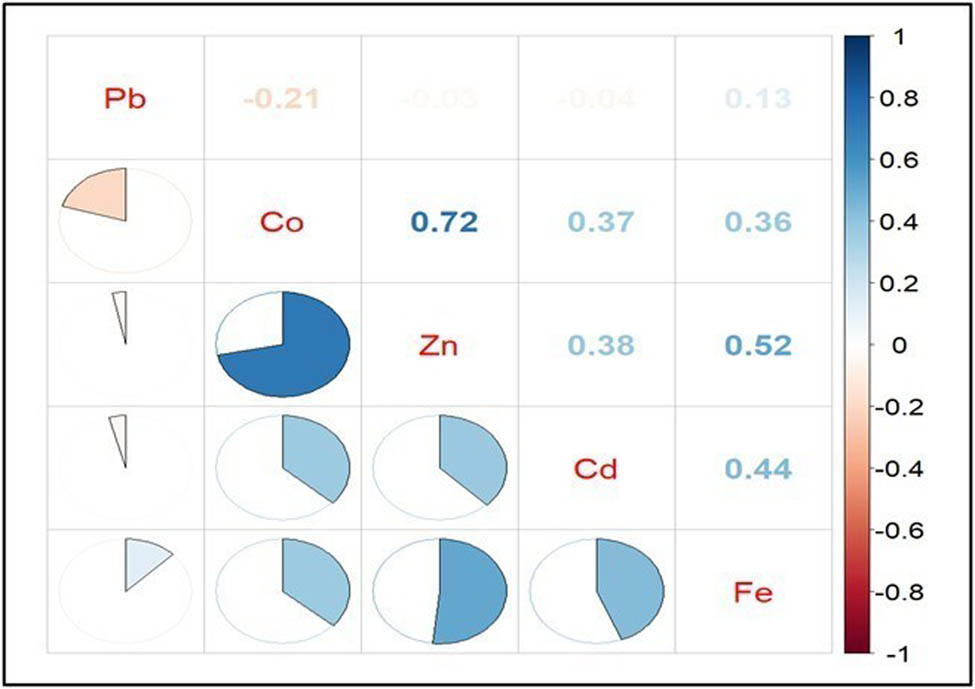
The correlation matrix of the analyzed PTEs.
PCA identified two significant components (PC1 and PC2), explaining a substantial portion of the data variance. PC1 (42.5% variance) represents geogenic contributions (Fe, Zn, Co) linked to bedrock weathering, while PC2 (21.6% variance) reflects minor anthropogenic inputs, likely from tourism and industrial activities (Table 3). PC1 showed high positive loadings for Fe (0.728), Zn (0.834), Co (0.766), and Cd (0.719), indicating a strong positive correlation among these metals, likely reflecting a shared origin such as mineral deposits [44,45,46]. The coastal sediments of northwest Saudi Arabia derive their metal content primarily from the weathering and erosion of Tertiary sedimentary rocks and older Precambrian basement rocks. Minerals like magnetite, hematite, sphalerite, and sulfides are significant sources of Fe, Zn, Co, and Cd. These metals were deposited in coastal sediments through fluvial transport and erosion processes during the Tertiary period. Additionally, hydrothermal activities related to Red Sea rift tectonics have further enriched localized zones with these metals [2,4,11]. Conversely, PC2 revealed inverse relationships between Fe, Pb, and Cd with Co and, to a lesser extent, Zn, suggesting differing environmental behaviors or anthropogenic sources [47]. The weaker positive loadings of Zn and Co on PC2 may indicate distinct geochemical processes or secondary sources contributing to their presence. This differentiation highlights the complex interplay of natural and anthropogenic factors shaping PTE distribution in the study area. Although the primary source of PTEs in the study area can be attributed to the natural weathering of rocks, consistent with the fact that the area remained untouched for many years, anthropogenic sources cannot be ignored, particularly due to urban expansion and coastal development projects in recent years.
Principal components for the investigated PTEs
| HMS | Component | |
|---|---|---|
| 1 | 2 | |
| Fe | 0.728 | −0.150 |
| Zn | 0.834 | 0.221 |
| Pb | −0.014 | −0.796 |
| Co | 0.766 | 0.430 |
| Cd | 0.719 | −0.179 |
| % of variance | 42.51 | 21.64 |
| Cumulative % | 42.51 | 64.15 |
3.2 Health risk assessment
Zn, Cd, Pb, Fe, and Co accumulate in marine sediments, posing significant risks to both aquatic ecosystems and human health. Elevated concentrations of these metals can disrupt marine life through bioaccumulation and biomagnification within the food chain, ultimately affecting human health via seafood consumption. For instance, high levels of Zn and Cd can impair the growth and reproduction of marine organisms and inhibit phytoplankton development, a crucial component of the aquatic food web [48,49].
The average CDI values for non-CRs in adults ranged from 1.22 × 10⁻⁷ (Cd) to 0.00463 (Fe) through ingestion and from 4.89 × 10⁻¹⁰ (Cd) to 1.85 × 10⁻⁵ (Fe) via dermal exposure (Table 4). In children, the CDI values ranged from 1.14 × 10⁻⁶ (Cd) to 0.0431 (Fe) through ingestion and from 2.28 × 10⁻⁹ (Cd) to 8.61 × 10⁻⁵ (Fe) via dermal exposure. The average HI values for PTEs followed a descending order of Fe, Cd, Co, Zn, and Pb for adults and children. For adults, HI values ranged from 0.00068 to 0.0025 (Cd), 0.0029 to 0.099 (Fe), 0.0001 to 0.0004 (Co), 7.7 × 10⁻⁵ to 0.0001 (Zn), and 3.4 × 10⁻⁵ to 8.9 × 10⁻⁵ (Pb). For children, HI values varied from 0.0064 to 0.023 (Cd), 0.028 to 0.093 (Fe), 0.0014 to 0.0041 (Co), 0.0007 to 0.0013 (Zn), and 0.0003 to 0.0008 (Pb).
The average CDI, HQ, HI, CR, and LCR values of health risk assessment in adults and children
| PTEs | CDIIng | CDIDerm | HQIng | HQDerm | HI | CRIng | CRDerm | LCR |
|---|---|---|---|---|---|---|---|---|
| Adults | ||||||||
| Co | 6.23 × 10⁻⁶ | 2.49 × 10⁻⁸ | 3.12 × 10⁻⁴ | 1.24 × 10⁻⁶ | 3.13 × 10⁻⁴ | |||
| Cd | 1.22 × 10⁻⁷ | 4.89 × 10⁻¹⁰ | 1.22 × 10⁻³ | 4.89 × 10⁻⁶ | 1.23 × 10⁻³ | 7.71 × 10⁻⁷ | 3.08 × 10⁻⁹ | 7.75 × 10⁻⁷ |
| Zn | 3.33 × 10⁻⁵ | 1.33 × 10⁻⁷ | 1.11 × 10⁻⁴ | 4.43 × 10⁻⁷ | 1.11 × 10⁻⁴ | |||
| Pb | 9.12 × 10⁻⁶ | 3.64 × 10⁻⁸ | 6.52 × 10⁻⁵ | 2.60 × 10⁻⁷ | 6.54 × 10⁻⁵ | 9.12 × 10⁻⁸ | 3.64 × 10⁻¹⁰ | 9.16 × 10⁻⁸ |
| Fe | 4.63 × 10⁻⁵ | 1.85 × 10⁻⁵ | 6.61 × 10⁻⁵ | 2.64 × 10⁻⁵ | 6.63 × 10⁻³ | |||
| Children | ||||||||
| Co | 5.82 × 10⁻⁵ | 1.16 × 10⁻⁷ | 2.91 × 10⁻³ | 5.80 × 10⁻⁶ | 2.92 × 10⁻³ | |||
| Cd | 1.14 × 10⁻⁶ | 2.28 × 10⁻⁹ | 1.14 × 10⁻² | 2.28 × 10⁻⁵ | 1.15 × 10⁻² | 7.20 × 10⁻⁶ | 1.44 × 10⁻⁸ | 7.21 × 10⁻⁶ |
| Zn | 3.11 × 10⁻⁴ | 6.20 × 10⁻⁷ | 1.04 × 10⁻³ | 2.07 × 10⁻⁶ | 1.04 × 10⁻³ | |||
| Pb | 8.52 × 10⁻⁵ | 1.70 × 10⁻⁷ | 6.08 × 10⁻⁴ | 1.21 × 10⁻⁶ | 6.09 × 10⁻⁴ | 8.52 × 10⁻⁷ | 1.70 × 10⁻⁹ | 8.53 × 10⁻⁷ |
| Fe | 4.32 × 10⁻⁵ | 8.61 × 10⁻⁵ | 6.17 × 10⁻⁵ | 1.23 × 10⁻⁴ | 6.18 × 10⁻² | |||
The spatial distribution of HI values (Figure 4) revealed higher non-CRs for children compared to adults, with localized peaks for Zn (samples 29 and 31), Cd (sample 32), Fe (sample 14), and Pb (samples 15, 18, and 26) in the southern region. Co exhibited elevated HI values in samples 1, 17, 19, 29, and 30. Despite these variations, all HI values remained below 1.0, indicating no significant non-CR for residents along the studied coastline [19,50].
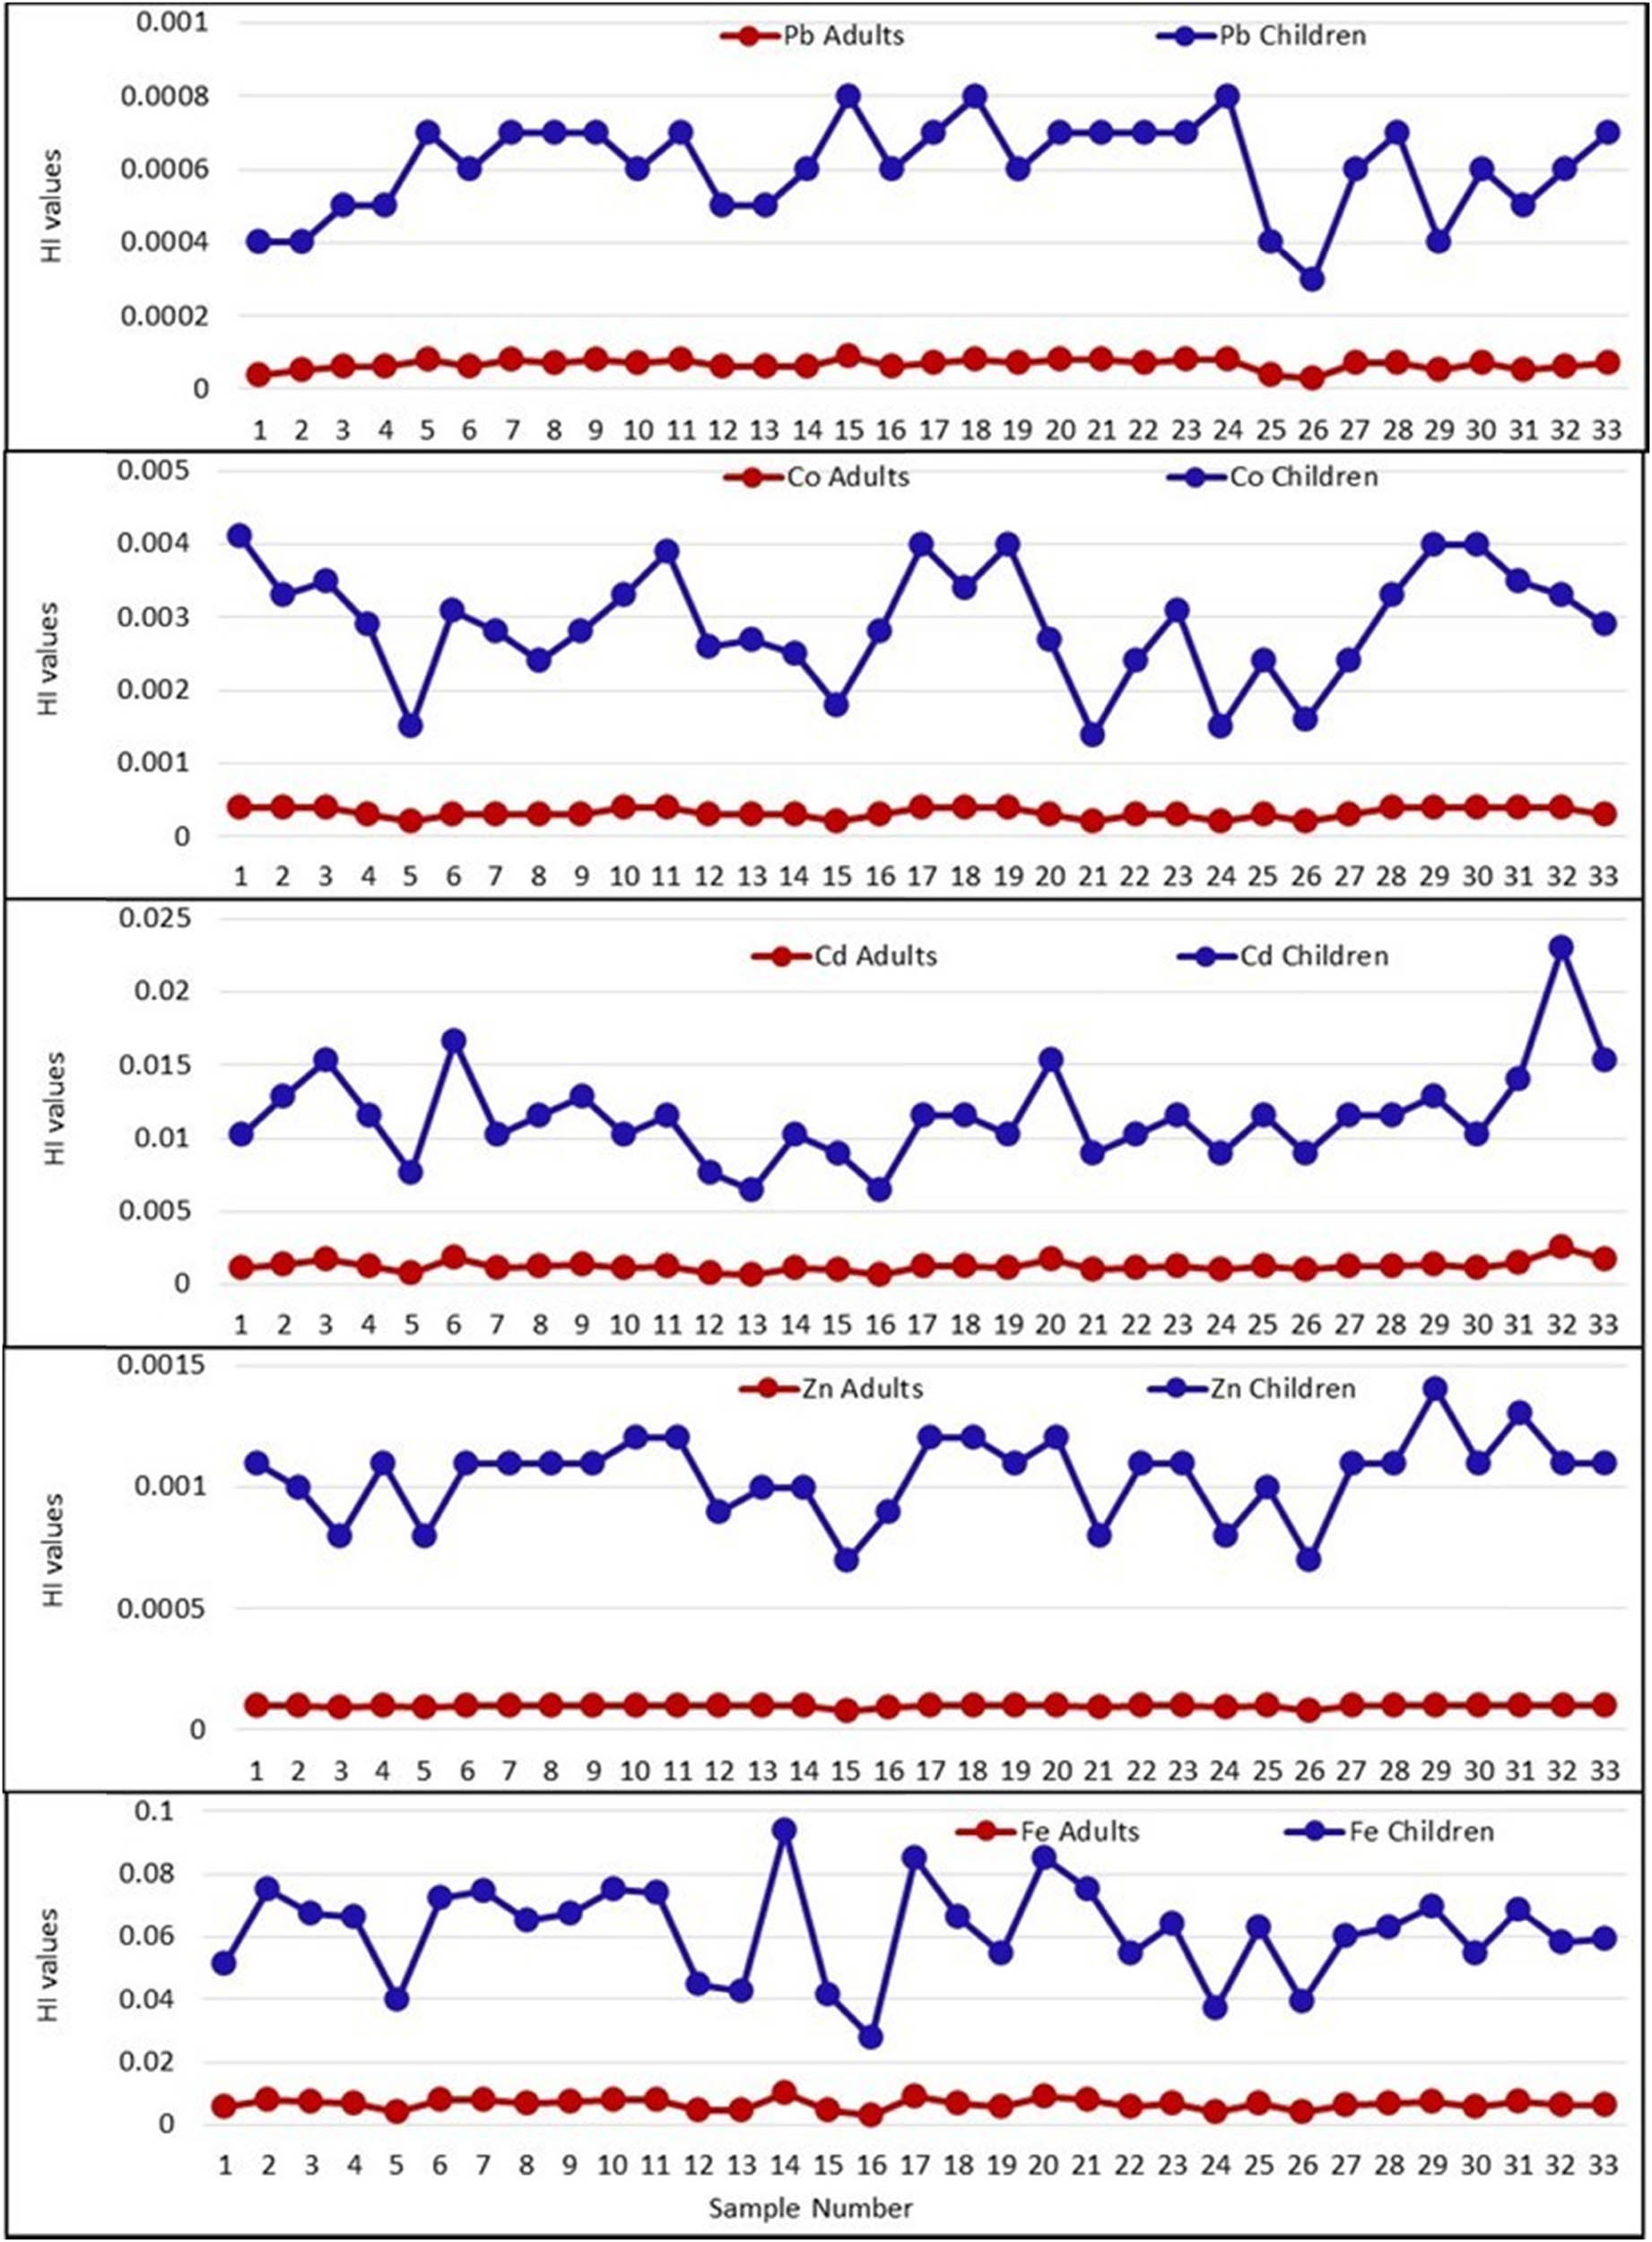
Spatial distribution of Hi for Co, Fe, Cd, Zn, and Pb per sample location in the study area.
CRs associated with Pb and Cd were assessed in the sampled sediments (Table 4). For adults, the average CR values through ingestion ranged from 9.12 × 10⁻⁸ (Pb) to 7.71 × 10⁻⁷ (Cd), while for children, CRs ranged from 8.52 × 10⁻⁷ (Pb) to 7.25 × 10⁻⁶ (Cd). The average LCR values for adults varied from 9.16 × 10⁻⁸ (Pb) to 7.84 × 10⁻⁷ (Cd), and for children, the range was from 8.53 × 10⁻⁷ (Pb) to 7.21 × 10⁻⁶ (Cd). The distribution of LCR values for Pb and Cd across the study area showed that the highest LCR values for Pb were observed in samples 15 and 18 for both adults and children, while the lowest values were recorded in samples 25 and 26 (Figure 5 and Table 4). For Cd, the highest LCR values were found in samples 6 and 32, with the lowest values in samples 13 and 16.
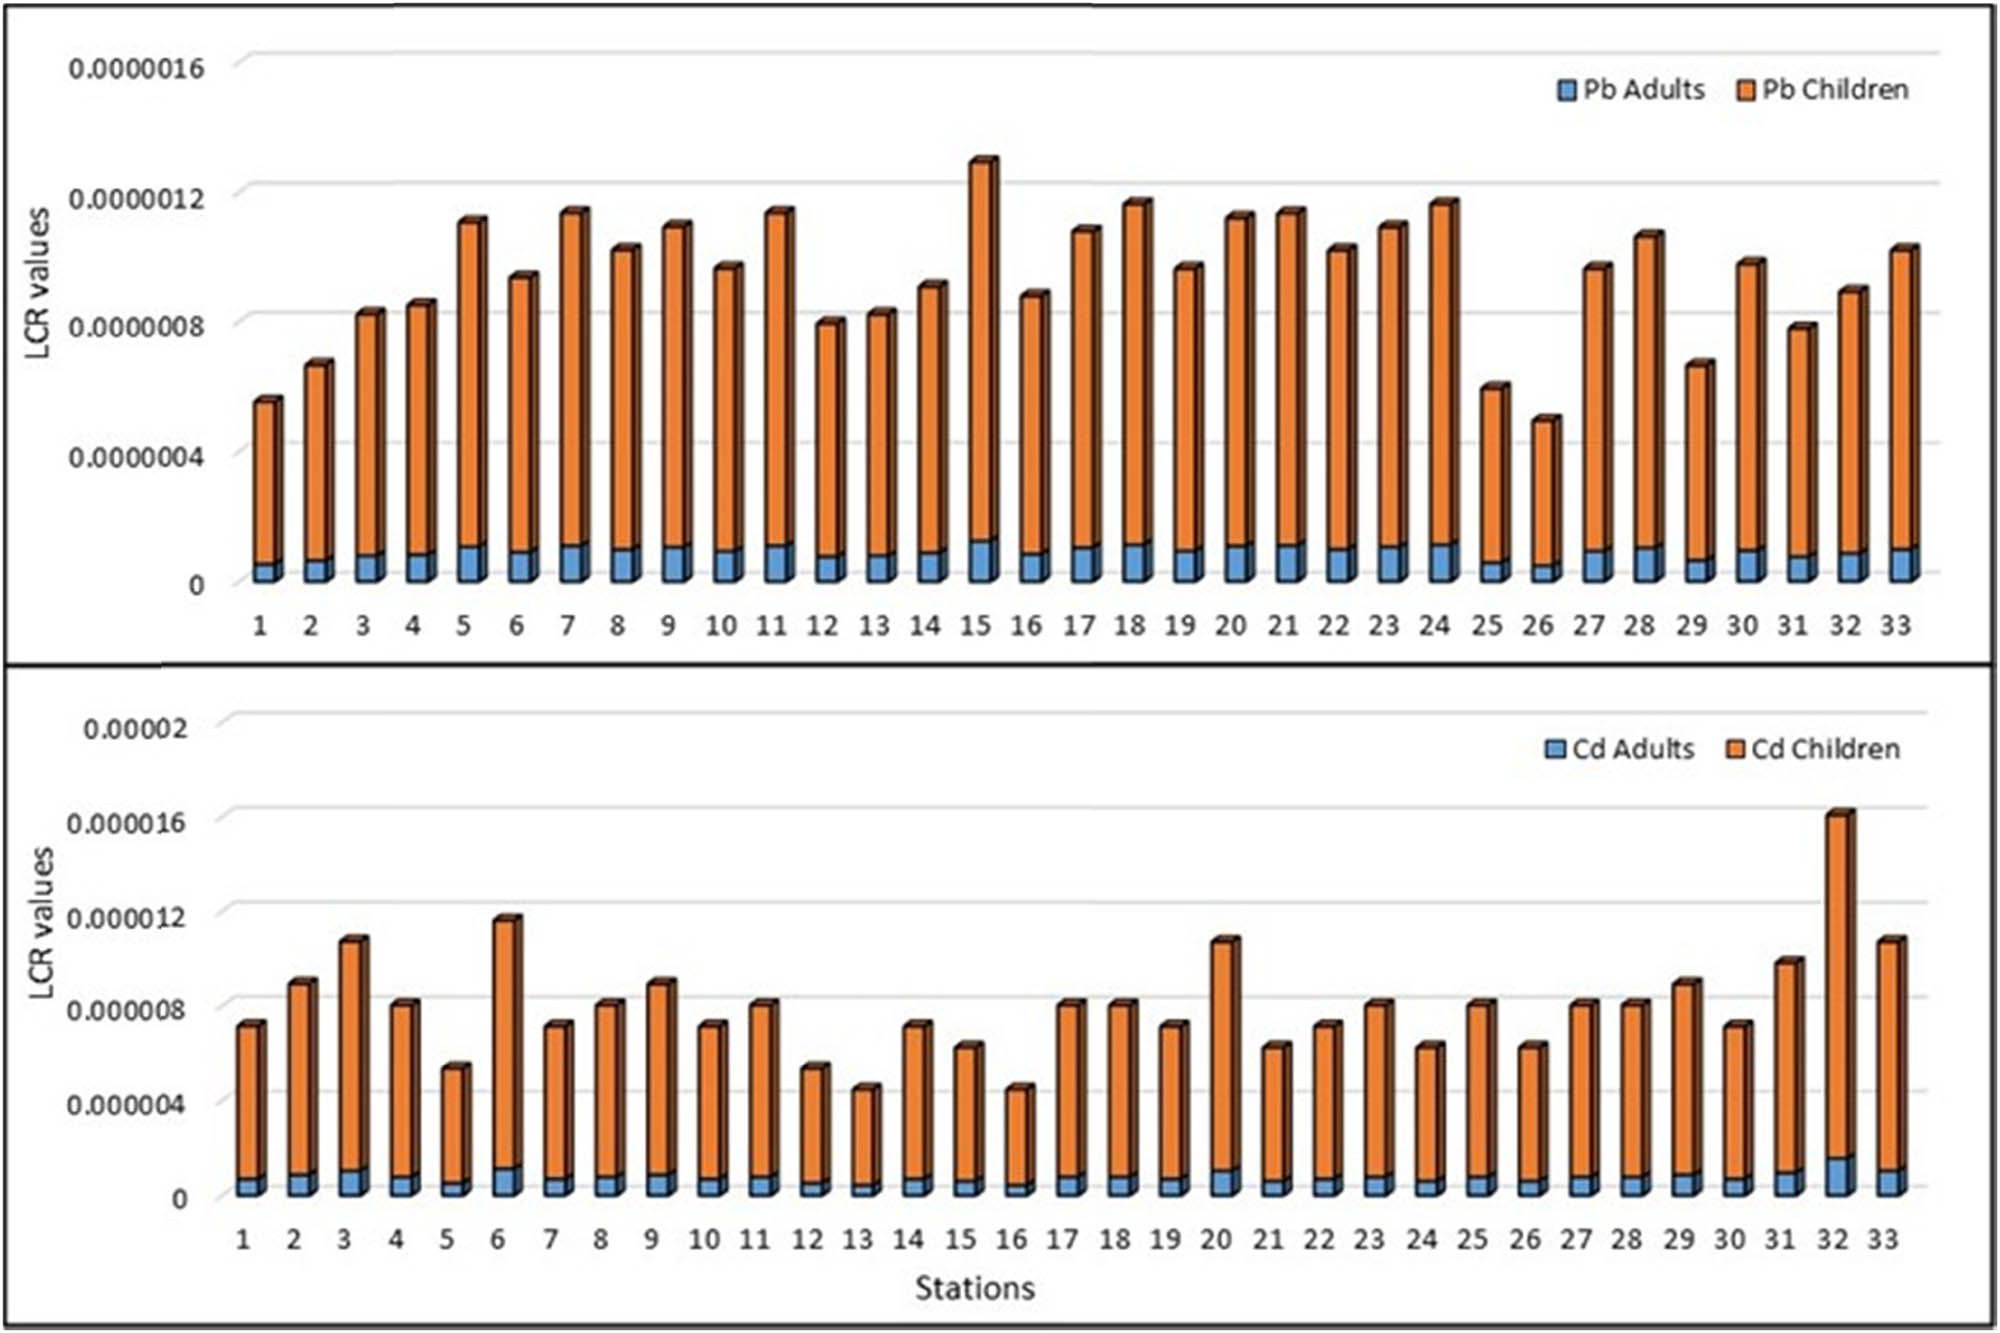
Spatial distribution of LCR for Cd and Pb per sample location in the study area.
When compared to the average LCR values reported for coastal sediments from various regions including both sides of the Red Sea coast, the Gulf of Aqaba, and the Arabian Gulf [19,21,23,25,41], our average values exhibited fluctuations, either exceeding or falling below these benchmarks. Nevertheless, all LCR values for Pb and Cd in both adults and children remained within acceptable or tolerable CR levels (ranging from 1 × 10⁻⁵ to less than 1 × 10⁻⁶), indicating no significant health risks [51,52,53,54]. Although HI and LCR levels are very low and do not pose any immediate health threat, continuous monitoring of PTE levels, identifying their sources, and reducing their input into the environment are essential to maintaining long-term environmental quality.
The current methods used in this study have certain limitations that should be acknowledged. These include the inability to estimate contamination from atmospheric deposition and the interactions between PTEs and soil organic matter. Additionally, spatial and temporal variations in metal concentrations may not be fully captured due to sampling constraints. Future research should focus on enhancing analytical techniques to improve the accuracy of contamination assessments. This includes incorporating advanced geochemical modeling, isotope analysis for more precise source tracing, and remote sensing techniques for large-scale monitoring. Further studies should also investigate the bioavailability and mobility of PTEs under different environmental conditions, as well as their long-term environmental and health impacts. Expanding the study to include water and plant samples would provide a more comprehensive understanding of metal transport within the ecosystem.
4 Conclusions
The present study examines the concentrations of Zn, Cd, Pb, Fe, and Co in 33 coastal sediment samples from the southern Gulf of Aqaba, Saudi Arabia, and assesses their potential ecological and health risks. The average concentrations of PTEs were found to follow this order: Fe (3376.5 µg/g) > Zn (24.31 µg/g) > Pb (6.66 µg/g) > Co (4.55 µg/g) > Cd (0.089 µg/g). All studied PTE concentrations are within safe limits according to the ISQGs and the PEL, indicating no biological risk associated with metal levels in the sediments. The results of the PI mCdeg, and PLI suggest that the sediments are generally unpolluted to lightly polluted. Multivariate analyses revealed that the primary sources of these metals are geogenic, with some influence from anthropogenic activities, especially for Zn and Co. The HI values for the investigated metals were all below 1.0, indicating no non-CRs along the studied coastline. Additionally, the LCR values for both adults and children ranged from 1 × 10⁻⁵ to less than 1 × 10⁻⁶, indicating no carcinogenic health risks.
Environmental monitoring in the Gulf of Aqaba is crucial for sustainable management, providing insights into pollution sources and ecosystem health. It supports conservation and industrial regulation. However, limitations include restricted sampling, temporal variations, and the need for stronger causal validation. Future research should expand monitoring, use advanced geochemical techniques, and incorporate biological indicators for a more comprehensive assessment.
Acknowledgments
The authors extend their appreciation to Researchers Supporting Project number (RSP 2025R139), King Saud University, Riyadh, Saudi Arabia.
-
Funding information: This study was supported by the Researchers Supporting Project (number RSP2025R139) at King Saud University Riyadh, Saudi Arabia.
-
Author contributions: Khaled Al-Kahtany, Talal Alharbi, Abdelbaset El-Sorogy, and Mohamed Youssef: conceptualization, project administration, methodology, software, validation, formal analysis, investigation, and data curation. Hamdy Nour, Abdelbaset El-Sorogy, and Salvatore Giacobbe: writing – original draft preparation, writing – review and editing. All authors read and approved of the final manuscript.
-
Conflict of interest: Authors state no conflict of interest.
-
Ethical approval: The conducted research is not related to either human or animal use.
-
Data availability statement: All data generated or analyzed during this study are included in this published article.
References
[1] Bantan RA. Geology and Sedimentary Environments of Farasan Bank (Saudi Arabia) Southern Red Sea: A Combined Remote Sensing and field study. London: London University; 1999. p. 296.Search in Google Scholar
[2] Rasul N, Stewart I. Geological Setting, Palaeoenvironment and Archaeology of the Red Sea. Cham: Saudi Geological Survey, Springer; 2019. p. 803. 10.1007/978-3-319-99408-6.Search in Google Scholar
[3] Dabbagh A, Hölzl H, Schnier H, Islands F, Tado A and Zötl JG, eds. Quaternary Periods in Saudi Arabia. Vol. 2. Wienn & New York: Springer-Verlag; 1984. p. 212–20.Search in Google Scholar
[4] El-Sorogy A, Youssef M, Al-Kahtany K, Salehe M. Distribution, source, contamination, and ecological risk status of heavy metals in the Red Sea-Gulf of Aqaba coastal sediments, Saudi Arabia. Mar Pollut Bull. 2020;158:111411.10.1016/j.marpolbul.2020.111411Search in Google Scholar PubMed
[5] El-Sorogy A, Youssef M, Al-Hashim M. Water quality assessment and environmental impact of heavy metals in the Red Sea coastal seawater of Yanbu, Saudi Arabia. Water. 2023;15:201. 10.3390/w15010201.Search in Google Scholar
[6] Wang WX. Interactions of trace metals and different marine food chains. Mar Ecol Prog Ser. 2002;243:295–309.10.3354/meps243295Search in Google Scholar
[7] Hader D, Helbling E, Villafane V. Anthropogenic pollution of aquatic ecosystems. Cham, Switzerland: Springer Nature; 2021. p. 426.10.1007/978-3-030-75602-4Search in Google Scholar
[8] Nour HE, Nouh E. Comprehensive pollution monitoring of the Egyptian Red Sea coast by using the environmental indicators. Environ Sci Pollut Res. 2020;27:28813–28. 10.1007/s11356-020-09079-3.Search in Google Scholar PubMed
[9] Youssefa M, Al Otaibi S, El-Sorogy A. Distribution, source, and contamination of heavy metals in coastal sediments of Jeddah, Red Sea, Saudi Arabia. Bull Environ Contam Toxicol. 2024;113:12.10.1007/s00128-024-03923-9Search in Google Scholar PubMed
[10] Saleh Y. Evaluation of sediment contamination in the red sea coastal area combining multiple pollution indices and multivariate statistical techniques. Int J Sediment Res. 2021;36:243–54.10.1016/j.ijsrc.2020.07.011Search in Google Scholar
[11] Nour HE, Helal S, Abdel Wahab M. Contamination and health risk assessment of heavy metals in beach sediments of Red Sea and Gulf of Aqaba, Egypt. Mar Pollut Bull. 2022;177(1–3):113517. 10.1016/j.marpolbul.2022.113517.Search in Google Scholar PubMed
[12] El-Sorogy A, Mohamed M, Nour H. Heavy metals contamination of the Quaternary coral reefs, Red Sea coast, Egypt. Environ Earth Sci. 2012;67:777–85. 10.1007/s12665-012-1535-0.Search in Google Scholar
[13] Hakanson L. An ecological risk index for aquatic pollution control. A sedimentological approach. Water Res. 1980;14:975–1001. 10.1016/0043-1354(80)90143-8.Search in Google Scholar
[14] Ustaoğlu F, Yüksel B, Tepe Y, Aydın H, Topaldemir H. Metal pollution assessment in the surface sediments of a river system in Türkiye: Integrating toxicological risk assessment and source identification. Mar Pollut Bull. 2024;203:116514.10.1016/j.marpolbul.2024.116514Search in Google Scholar PubMed
[15] Yüksel B, Ustaoğlu F, Tokatli C, Islam M. Ecotoxicological risk assessment for sediments of Çavuşlu stream in Giresun, Turkey: association between garbage disposal facility and metallic accumulation. Environ Sci Pollut Res. 2022;29:17223–40.10.1007/s11356-021-17023-2Search in Google Scholar PubMed
[16] Han X, Wang J, Cai W, Xu X, Sun M. The pollution status of heavy metals in the surface seawater and sediments of the Tianjin Coastal Area, North China. Int J Environ Res Public Health. 2021;18:11243. 10.3390/ijerph182111243.Search in Google Scholar PubMed PubMed Central
[17] Nour HE, Ramadan F, Abdel Wahed N, Rakha A. Spatial distribution and contamination of specific heavy metals in the sediment of Bahr Mouse, Egypt. Egypt J Chem. 2024;11:99–109. 10.21608/ejchem.2024.279094.9506.Search in Google Scholar
[18] Yüksel B, Ustaoğlu F. Pollution analysis of metals in the sediments of lagoon lakes in Türkiye: Toxicological risk assessment and source insights. Process Saf Environ Prot. 2025;193:665–82.10.1016/j.psep.2024.11.085Search in Google Scholar
[19] Alharbi T, Nour HE, Al-Kahtany K, Zumlot T, El-Sorogy A. Health risk assessment and contamination of lead and cadmium levels in sediments of the northwestern Arabian Gulf coast. Heliyon. 2024;10:e36447. 10.1016/j.heliyon.2024.e36447.Search in Google Scholar PubMed PubMed Central
[20] Miletic A, Lucic M, Onjia A. Exposure factors in health risk assessment of heavy metal(loid)s in soil and sediment. Metals. 2023;13:1266. 10.3390/met13071266.Search in Google Scholar
[21] Al-Kahtany K, Nour HE, El-Sorogy A, Alharbi T. Ecological and health risk assessment of heavy metals contamination in mangrove sediments, Red Sea coast. Mar Pollut Bull. 2023a;192:115000. 10.1016/j.marpolbul.2023.115000.Search in Google Scholar PubMed
[22] USEPA. Supplemental Guidance for Developing Soil Screening Levels for Superfund Sites; U.S. Environmental Protection Agency, Office of Emergency and Remedial Response: Washington, DC, USA, (2002).Search in Google Scholar
[23] USEPA. Regional Screening Levels (RSLs)—User’s Guide. Available online: https://www.epa.gov/risk/regional-screening-levels-rsls-users-guide. 2023.Search in Google Scholar
[24] IRIS. Program Database Available online: https://cfpub.epa.gov/ncea/iris/search/index.cfm. 2023.Search in Google Scholar
[25] Nour HE, Aljahdali M. Ecological and health risk assessment of Sharm El-sheikh beach sediments, Red Sea coast. Mar Pollut Bull. 2025;212:117577. 10.1016/j.marpolbul.2025.117577.Search in Google Scholar PubMed
[26] Long E, MacDonald D, Smith S, Calder F. Incidence of adverse biological effects within ranges of chemical concentrations in marine and estuarine sediments. Environ Manag. 1995;19:81–97.10.1007/BF02472006Search in Google Scholar
[27] Liu B, Zhang W, Chi G. Distribution and risk assessment of heavy metals in sediment from Bohai Bay, China. Minerals. 2019;9:111. 10.3390/min9020111.Search in Google Scholar
[28] Turekian K, Wedepohl K. Distribution of the elements in some major units of the Earth’s crust. Geol Soc Am Bull. 1961;72:175–92.10.1130/0016-7606(1961)72[175:DOTEIS]2.0.CO;2Search in Google Scholar
[29] Taylor SR. Abundance of chemical elements in the continental crust: a new table. Geochim Cosmochim Acta. 1964;28:1273–85.10.1016/0016-7037(64)90129-2Search in Google Scholar
[30] Papakonstantinou M, Sergiou S, Geraga M, Prandekou A, Dimas X, Fakiris E, et al. Sedimentological, geochemical, and environmental assessment in an eastern mediterranean, stressed coastal setting: The Gialova Lagoon, SW Peloponnese, Greece. Water. 2024;16:2312. 10.3390/w16162312.Search in Google Scholar
[31] Alharbi T, El-Sorogy A. Assessment of metal contamination in coastal sediments of Al-Khobar area, Arabian Gulf, Saudi Arabia. J Afr Earth Sci. 2017;129:458–68.10.1016/j.jafrearsci.2017.02.007Search in Google Scholar
[32] Seif R, Ene A, Zakaly H, Sallam A, Taalab S, Fnais M, et al. Distribution of heavy metals along the mediterranean shoreline from baltim to el-burullus (egypt): consequences for possible contamination. Minerals. 2024;14(9):931.10.3390/min14090931Search in Google Scholar
[33] Muller G. Index of Geoaccumulation in Sediments of the Rhine River. Geo J. 1969;2:108–18.Search in Google Scholar
[34] Nour HE. Distribution of hydrocarbons and heavy metals pollutants in groundwater and sediments from northwestern Libya. Indian J Geo-Mar Sci. 2015;7(44):993–9.Search in Google Scholar
[35] El Ouaty Q, El M’rini A, Nachite D, Marrocchino E, Rodella I. Sediment quality indices for the assessment of heavy metal risk in nador lagoon sediments (morocco) using multistatistical approaches. Sustainability. 2024;16:1921.10.3390/su16051921Search in Google Scholar
[36] Abrahim G, Parker R. Assessment of heavy metal enrichment factors and the degree of contamination in marine sediments from Tamaki Estuary, Auckland New Zealand. Environ Monit Assess. 2008;136(1–3):227–38.10.1007/s10661-007-9678-2Search in Google Scholar
[37] Tomlinson D, Wilson J, Harris C, Jeffrey D. Problems in the assessment of heavy-metal levels in estuaries and the formation of a pollution index. Helgol Meeresunters. 1980;33:566–75.10.1007/BF02414780Search in Google Scholar
[38] Di Bella G, El‑Sorogy S, Giacobbe S, Nava V, Al‑Kahtany K, Nour H. Risk assessment of potentially toxic elements in intermittent rivers “fiumara” flowing in the Gulf of Milazzo (Sicily, Italy). Environ Earth Sci. 2024;83:321. 10.1007/s12665-024-11631-0.Search in Google Scholar
[39] Ene A, Sloată F, Frontasyeva M, Duliu O, Sion A, Gosav S, et al. Multi-elemental characterization of soils in the vicinity of siderurgical industry: levels, depth migration and toxic risk. Minerals. 2024;14:559.10.3390/min14060559Search in Google Scholar
[40] Ramadan F, Nour H, Aita S, Zahran H. Evaluation of heavy metals accumulation risks in water of the Qalubiya drain in East Delta. Egypt Arab J Geosci. 2021;14:1750. 10. 1007/s12517-021-08198-6. Search in Google Scholar
[41] El-Sorogy A, Al-Hashim M, Almadani S, Giacobbe S, Nour H. Potential contamination and health risk assessment of heavy metals in Hurghada coastal sediments, Northwestern Red Sea. Mar Pollut Bull. 2024;198:115924. 10.1016/j.marpolbul.2023.115924.Search in Google Scholar PubMed
[42] Ramadan F, Nour HE, Abdel Wahed N, Rakha A, Amuda A, Faisal M. Heavy metal contamination and environmental risk assessment: a case study of surface water in the Bahr Mouse stream, East Nile Delta, Egypt. Environ Monit Assess. 2024;196(5):429. 10.1007/s10661-024-12541-1.Search in Google Scholar PubMed PubMed Central
[43] Jarup L. Hazards of heavy metal contamination. Br Med Bull. 2003;68(1):167–82.10.1093/bmb/ldg032Search in Google Scholar PubMed
[44] Yüksel B, Ustaoğlu F, Aydın H, Tokatlı C, Topaldemir H, Islam M, et al. Appraisal of metallic accumulation in the surface sediment of a fish breeding dam in Türkiye: A stochastical approach to ecotoxicological risk assessment. Mar Pollut Bull. 2024;203:116488.10.1016/j.marpolbul.2024.116488Search in Google Scholar PubMed
[45] Jolliffe I, Cadima J. Principal component analysis: A review and recent developments. Philos Trans R Soc, A. 2016;374:20150202.10.1098/rsta.2015.0202Search in Google Scholar PubMed PubMed Central
[46] Nour HE, Ramadan F, Aita S, Zahran H. Assessment of sediment quality of the Qalubiya drain and adjoining soils, Eastern Nile Delta, Egypt. Arab J Geosci. 2021;14:535. 10.1007/s12517-021-06891-0.Search in Google Scholar
[47] Facchinelli A, Sacchi E, Mallen L. Multivariate statistical and GIS-based approach to identify heavy metal sources in soils. Environ Pollut. 2001;114(3):313–24.10.1016/S0269-7491(00)00243-8Search in Google Scholar
[48] Bello S, Nasiru R, Garbab N, Adeyemo D. Carcinogenic and non-carcinogenic health risk assessment of heavy metals exposure from Shanono and Bagwai artisanal gold mines, Kano state, Nigeria. Sci Afr. 2019;6:e00197.10.1016/j.sciaf.2019.e00197Search in Google Scholar
[49] Al-Kahtany K, Nour HE, Giacobbe S, Alharbi T, El-Sorogy A. Heavy metal pollution in surface sediments and human health assessment in southern Al-Khobar coast, Saudi Arabia. Mar Pollut Bull. 2023;187:114508. 10.1016/j.marpolbul.2022.114508.Search in Google Scholar PubMed
[50] Chen H, Wang L, Hu B, Xu J, Liu X. Potential driving forces and probabilistic health risks of heavy metal accumulation in the soils from an e-waste area, southeast China. Chemosphere. 2022;289:133182. 10.1016/j.chemosphere.2021.133182.Search in Google Scholar PubMed
[51] Zhang Y, Wu J, Xu B. Human health risk assessment of groundwater nitrogen pollution in Jinghui canal irrigation area of the loess region, northwest China. Environ Earth Sci. 2018;77(7):273.10.1007/s12665-018-7456-9Search in Google Scholar
[52] Mondal P, Lofrano G, Carotenuto M, Guida M, Trifuoggi M, Libralato G, et al. Health risk and geochemical assessment of trace elements in surface sediment along the Hooghly (Ganges) River Estuary (India). Water. 2021;13:110.10.3390/w13020110Search in Google Scholar
[53] Alharbi T, Nour H, El‑Sorogy A, Al‑Kahtany K, Giacobbe S, Alarifi S. Evaluation of health risks and heavy metals toxicity in agricultural soils in Central Saudi Arabia. Environ Monit Assess. 2025;197:419. 10.1007/s10661-025-13897-8.Search in Google Scholar PubMed
[54] Naveedullah, Hashmi M, Yu C, Shen H, Duan D, Shen C, et al. Concentrations and human health risk assessment of selected heavy metals in surface water of the siling reservoir watershed in Zhejiang Province. China Pollut J Environ Stud. 2014;23:801–11.Search in Google Scholar
© 2025 the author(s), published by De Gruyter
This work is licensed under the Creative Commons Attribution 4.0 International License.
Articles in the same Issue
- Research Articles
- Seismic response and damage model analysis of rocky slopes with weak interlayers
- Multi-scenario simulation and eco-environmental effect analysis of “Production–Living–Ecological space” based on PLUS model: A case study of Anyang City
- Remote sensing estimation of chlorophyll content in rape leaves in Weibei dryland region of China
- GIS-based frequency ratio and Shannon entropy modeling for landslide susceptibility mapping: A case study in Kundah Taluk, Nilgiris District, India
- Natural gas origin and accumulation of the Changxing–Feixianguan Formation in the Puguang area, China
- Spatial variations of shear-wave velocity anomaly derived from Love wave ambient noise seismic tomography along Lembang Fault (West Java, Indonesia)
- Evaluation of cumulative rainfall and rainfall event–duration threshold based on triggering and non-triggering rainfalls: Northern Thailand case
- Pixel and region-oriented classification of Sentinel-2 imagery to assess LULC dynamics and their climate impact in Nowshera, Pakistan
- The use of radar-optical remote sensing data and geographic information system–analytical hierarchy process–multicriteria decision analysis techniques for revealing groundwater recharge prospective zones in arid-semi arid lands
- Effect of pore throats on the reservoir quality of tight sandstone: A case study of the Yanchang Formation in the Zhidan area, Ordos Basin
- Hydroelectric simulation of the phreatic water response of mining cracked soil based on microbial solidification
- Spatial-temporal evolution of habitat quality in tropical monsoon climate region based on “pattern–process–quality” – a case study of Cambodia
- Early Permian to Middle Triassic Formation petroleum potentials of Sydney Basin, Australia: A geochemical analysis
- Micro-mechanism analysis of Zhongchuan loess liquefaction disaster induced by Jishishan M6.2 earthquake in 2023
- Prediction method of S-wave velocities in tight sandstone reservoirs – a case study of CO2 geological storage area in Ordos Basin
- Ecological restoration in valley area of semiarid region damaged by shallow buried coal seam mining
- Hydrocarbon-generating characteristics of Xujiahe coal-bearing source rocks in the continuous sedimentary environment of the Southwest Sichuan
- Hazard analysis of future surface displacements on active faults based on the recurrence interval of strong earthquakes
- Structural characterization of the Zalm district, West Saudi Arabia, using aeromagnetic data: An approach for gold mineral exploration
- Research on the variation in the Shields curve of silt initiation
- Reuse of agricultural drainage water and wastewater for crop irrigation in southeastern Algeria
- Assessing the effectiveness of utilizing low-cost inertial measurement unit sensors for producing as-built plans
- Analysis of the formation process of a natural fertilizer in the loess area
- Machine learning methods for landslide mapping studies: A comparative study of SVM and RF algorithms in the Oued Aoulai watershed (Morocco)
- Chemical dissolution and the source of salt efflorescence in weathering of sandstone cultural relics
- Molecular simulation of methane adsorption capacity in transitional shale – a case study of Longtan Formation shale in Southern Sichuan Basin, SW China
- Evolution characteristics of extreme maximum temperature events in Central China and adaptation strategies under different future warming scenarios
- Estimating Bowen ratio in local environment based on satellite imagery
- 3D fusion modeling of multi-scale geological structures based on subdivision-NURBS surfaces and stratigraphic sequence formalization
- Comparative analysis of machine learning algorithms in Google Earth Engine for urban land use dynamics in rapidly urbanizing South Asian cities
- Study on the mechanism of plant root influence on soil properties in expansive soil areas
- Simulation of seismic hazard parameters and earthquakes source mechanisms along the Red Sea rift, western Saudi Arabia
- Tectonics vs sedimentation in foredeep basins: A tale from the Oligo-Miocene Monte Falterona Formation (Northern Apennines, Italy)
- Investigation of landslide areas in Tokat-Almus road between Bakımlı-Almus by the PS-InSAR method (Türkiye)
- Predicting coastal variations in non-storm conditions with machine learning
- Cross-dimensional adaptivity research on a 3D earth observation data cube model
- Geochronology and geochemistry of late Paleozoic volcanic rocks in eastern Inner Mongolia and their geological significance
- Spatial and temporal evolution of land use and habitat quality in arid regions – a case of Northwest China
- Ground-penetrating radar imaging of subsurface karst features controlling water leakage across Wadi Namar dam, south Riyadh, Saudi Arabia
- Rayleigh wave dispersion inversion via modified sine cosine algorithm: Application to Hangzhou, China passive surface wave data
- Fractal insights into permeability control by pore structure in tight sandstone reservoirs, Heshui area, Ordos Basin
- Debris flow hazard characteristic and mitigation in Yusitong Gully, Hengduan Mountainous Region
- Research on community characteristics of vegetation restoration in hilly power engineering based on multi temporal remote sensing technology
- Identification of radial drainage networks based on topographic and geometric features
- Trace elements and melt inclusion in zircon within the Qunji porphyry Cu deposit: Application to the metallogenic potential of the reduced magma-hydrothermal system
- Pore, fracture characteristics and diagenetic evolution of medium-maturity marine shales from the Silurian Longmaxi Formation, NE Sichuan Basin, China
- Study of the earthquakes source parameters, site response, and path attenuation using P and S-waves spectral inversion, Aswan region, south Egypt
- Source of contamination and assessment of potential health risks of potentially toxic metal(loid)s in agricultural soil from Al Lith, Saudi Arabia
- Regional spatiotemporal evolution and influencing factors of rural construction areas in the Nanxi River Basin via GIS
- An efficient network for object detection in scale-imbalanced remote sensing images
- Effect of microscopic pore–throat structure heterogeneity on waterflooding seepage characteristics of tight sandstone reservoirs
- Environmental health risk assessment of Zn, Cd, Pb, Fe, and Co in coastal sediments of the southeastern Gulf of Aqaba
- A modified Hoek–Brown model considering softening effects and its applications
- Evaluation of engineering properties of soil for sustainable urban development
- The spatio-temporal characteristics and influencing factors of sustainable development in China’s provincial areas
- Application of a mixed additive and multiplicative random error model to generate DTM products from LiDAR data
- Gold vein mineralogy and oxygen isotopes of Wadi Abu Khusheiba, Jordan
- Prediction of surface deformation time series in closed mines based on LSTM and optimization algorithms
- 2D–3D Geological features collaborative identification of surrounding rock structural planes in hydraulic adit based on OC-AINet
- Spatiotemporal patterns and drivers of Chl-a in Chinese lakes between 1986 and 2023
- Land use classification through fusion of remote sensing images and multi-source data
- Nexus between renewable energy, technological innovation, and carbon dioxide emissions in Saudi Arabia
- Analysis of the spillover effects of green organic transformation on sustainable development in ethnic regions’ agriculture and animal husbandry
- Factors impacting spatial distribution of black and odorous water bodies in Hebei
- Large-scale shaking table tests on the liquefaction and deformation responses of an ultra-deep overburden
- Impacts of climate change and sea-level rise on the coastal geological environment of Quang Nam province, Vietnam
- Reservoir characterization and exploration potential of shale reservoir near denudation area: A case study of Ordovician–Silurian marine shale, China
- Seismic prediction of Permian volcanic rock reservoirs in Southwest Sichuan Basin
- Application of CBERS-04 IRS data to land surface temperature inversion: A case study based on Minqin arid area
- Geological characteristics and prospecting direction of Sanjiaoding gold mine in Saishiteng area
- Research on the deformation prediction model of surrounding rock based on SSA-VMD-GRU
- Geochronology, geochemical characteristics, and tectonic significance of the granites, Menghewula, Southern Great Xing’an range
- Hazard classification of active faults in Yunnan base on probabilistic seismic hazard assessment
- Characteristics analysis of hydrate reservoirs with different geological structures developed by vertical well depressurization
- Estimating the travel distance of channelized rock avalanches using genetic programming method
- Landscape preferences of hikers in Three Parallel Rivers Region and its adjacent regions by content analysis of user-generated photography
- New age constraints of the LGM onset in the Bohemian Forest – Central Europe
- Characteristics of geological evolution based on the multifractal singularity theory: A case study of Heyu granite and Mesozoic tectonics
- Soil water content and longitudinal microbiota distribution in disturbed areas of tower foundations of power transmission and transformation projects
- Oil accumulation process of the Kongdian reservoir in the deep subsag zone of the Cangdong Sag, Bohai Bay Basin, China
- Investigation of velocity profile in rock–ice avalanche by particle image velocimetry measurement
- Optimizing 3D seismic survey geometries using ray tracing and illumination modeling: A case study from Penobscot field
- Sedimentology of the Phra That and Pha Daeng Formations: A preliminary evaluation of geological CO2 storage potential in the Lampang Basin, Thailand
- Improved classification algorithm for hyperspectral remote sensing images based on the hybrid spectral network model
- Map analysis of soil erodibility rates and gully erosion sites in Anambra State, South Eastern Nigeria
- Identification and driving mechanism of land use conflict in China’s South-North transition zone: A case study of Huaihe River Basin
- Evaluation of the impact of land-use change on earthquake risk distribution in different periods: An empirical analysis from Sichuan Province
- A test site case study on the long-term behavior of geotextile tubes
- An experimental investigation into carbon dioxide flooding and rock dissolution in low-permeability reservoirs of the South China Sea
- Detection and semi-quantitative analysis of naphthenic acids in coal and gangue from mining areas in China
- Comparative effects of olivine and sand on KOH-treated clayey soil
- YOLO-MC: An algorithm for early forest fire recognition based on drone image
- Earthquake building damage classification based on full suite of Sentinel-1 features
- Potential landslide detection and influencing factors analysis in the upper Yellow River based on SBAS-InSAR technology
- Assessing green area changes in Najran City, Saudi Arabia (2013–2022) using hybrid deep learning techniques
- An advanced approach integrating methods to estimate hydraulic conductivity of different soil types supported by a machine learning model
- Hybrid methods for land use and land cover classification using remote sensing and combined spectral feature extraction: A case study of Najran City, KSA
- Streamlining digital elevation model construction from historical aerial photographs: The impact of reference elevation data on spatial accuracy
- Analysis of urban expansion patterns in the Yangtze River Delta based on the fusion impervious surfaces dataset
- A metaverse-based visual analysis approach for 3D reservoir models
- Late Quaternary record of 100 ka depositional cycles on the Larache shelf (NW Morocco)
- Integrated well-seismic analysis of sedimentary facies distribution: A case study from the Mesoproterozoic, Ordos Basin, China
- Study on the spatial equilibrium of cultural and tourism resources in Macao, China
- Urban road surface condition detecting and integrating based on the mobile sensing framework with multi-modal sensors
- Application of improved sine cosine algorithm with chaotic mapping and novel updating methods for joint inversion of resistivity and surface wave data
- The synergistic use of AHP and GIS to assess factors driving forest fire potential in a peat swamp forest in Thailand
- Dynamic response analysis and comprehensive evaluation of cement-improved aeolian sand roadbed
- Rock control on evolution of Khorat Cuesta, Khorat UNESCO Geopark, Northeastern Thailand
- Gradient response mechanism of carbon storage: Spatiotemporal analysis of economic-ecological dimensions based on hybrid machine learning
- Comparison of several seismic active earth pressure calculation methods for retaining structures
- Mantle dynamics and petrogenesis of Gomer basalts in the Northwestern Ethiopia: A geochemical perspective
- Study on ground deformation monitoring in Xiong’an New Area from 2021 to 2023 based on DS-InSAR
- Paleoenvironmental characteristics of continental shale and its significance to organic matter enrichment: Taking the fifth member of Xujiahe Formation in Tianfu area of Sichuan Basin as an example
- Equipping the integral approach with generalized least squares to reconstruct relict channel profile and its usage in the Shanxi Rift, northern China
- InSAR-driven landslide hazard assessment along highways in hilly regions: A case-based validation approach
- Attribution analysis of multi-temporal scale surface streamflow changes in the Ganjiang River based on a multi-temporal Budyko framework
- Maps analysis of Najran City, Saudi Arabia to enhance agricultural development using hybrid system of ANN and multi-CNN models
- Hybrid deep learning with a random forest system for sustainable agricultural land cover classification using DEM in Najran, Saudi Arabia
- Long-term evolution patterns of groundwater depth and lagged response to precipitation in a complex aquifer system: Insights from Huaibei Region, China
- Remote sensing and machine learning for lithology and mineral detection in NW, Pakistan
- Spatial–temporal variations of NO2 pollution in Shandong Province based on Sentinel-5P satellite data and influencing factors
- Numerical modeling of geothermal energy piles with sensitivity and parameter variation analysis of a case study
- Stability analysis of valley-type upstream tailings dams using a 3D model
- Variation characteristics and attribution analysis of actual evaporation at monthly time scale from 1982 to 2019 in Jialing River Basin, China
- Investigating machine learning and statistical approaches for landslide susceptibility mapping in Minfeng County, Xinjiang
- Investigating spatiotemporal patterns for comprehensive accessibility of service facilities by location-based service data in Nanjing (2016–2022)
- A pre-treatment method for particle size analysis of fine-grained sedimentary rocks, Bohai Bay Basin, China
- Study on the formation mechanism of the hard-shell layer of liquefied silty soil
- Comprehensive analysis of agricultural CEE: Efficiency assessment, mechanism identification, and policy response – A case study of Anhui Province
- Simulation study on the damage and failure mechanism of the surrounding rock in sanded dolomite tunnels
- Towards carbon neutrality: Spatiotemporal evolution and key influences on agricultural ecological efficiency in Northwest China
- High-frequency cycles drive the cyclical enrichment of oil in porous carbonate reservoirs: A case study of the Khasib Formation in E Oilfield, Mesopotamian Basin, Iraq
- Reconstruction of digital core models of granular rocks using mathematical morphology
- Spatial–temporal differentiation law of habitat quality and its driving mechanism in the typical plateau areas of the Loess Plateau in the recent 30 years
- A machine-learning-based approach to predict potential oil sites: Conceptual framework and experimental evaluation
- Effects of landscape pattern change on waterbird diversity in Xianghai Nature Reserve
- Research on intelligent classification method of highway tunnel surrounding rock classification based on parameters while drilling
- River morphology and tectono-sedimentary analysis of a shallow river delta: A case study of Putaohua oil layer in Saertu oilfield (L. Cretaceous), China
- Review Articles
- Humic substances influence on the distribution of dissolved iron in seawater: A review of electrochemical methods and other techniques
- Applications of physics-informed neural networks in geosciences: From basic seismology to comprehensive environmental studies
- Ore-controlling structures of granite-related uranium deposits in South China: A review
- Shallow geological structure features in Balikpapan Bay East Kalimantan Province – Indonesia
- A review on the tectonic affinity of microcontinents and evolution of the Proto-Tethys Ocean in Northeastern Tibet
- Advancements in machine learning applications for mineral prospecting and geophysical inversion: A review
- Special Issue: Natural Resources and Environmental Risks: Towards a Sustainable Future - Part II
- Depopulation in the Visok micro-region: Toward demographic and economic revitalization
- Special Issue: Geospatial and Environmental Dynamics - Part II
- Advancing urban sustainability: Applying GIS technologies to assess SDG indicators – a case study of Podgorica (Montenegro)
- Spatiotemporal and trend analysis of common cancers in men in Central Serbia (1999–2021)
- Minerals for the green agenda, implications, stalemates, and alternatives
- Spatiotemporal water quality analysis of Vrana Lake, Croatia
- Functional transformation of settlements in coal exploitation zones: A case study of the municipality of Stanari in Republic of Srpska (Bosnia and Herzegovina)
- Hypertension in AP Vojvodina (Northern Serbia): A spatio-temporal analysis of patients at the Institute for Cardiovascular Diseases of Vojvodina
- Regional patterns in cause-specific mortality in Montenegro, 1991–2019
- Spatio-temporal analysis of flood events using GIS and remote sensing-based approach in the Ukrina River Basin, Bosnia and Herzegovina
- Flash flood susceptibility mapping using LiDAR-Derived DEM and machine learning algorithms: Ljuboviđa case study, Serbia
- Geocultural heritage as a basis for geotourism development: Banjska Monastery, Zvečan (Serbia)
- Assessment of groundwater potential zones using GIS and AHP techniques – A case study of the zone of influence of Kolubara Mining Basin
- Impact of the agri-geographical transformation of rural settlements on the geospatial dynamics of soil erosion intensity in municipalities of Central Serbia
- Where faith meets geomorphology: The cultural and religious significance of geodiversity explored through geospatial technologies
- Applications of local climate zone classification in European cities: A review of in situ and mobile monitoring methods in urban climate studies
- Complex multivariate water quality impact assessment on Krivaja River
- Ionization hotspots near waterfalls in Eastern Serbia’s Stara Planina Mountain
- Shift in landscape use strategies during the transition from the Bronze age to Iron age in Northwest Serbia
- Assessing the geotourism potential of glacial lakes in Plav, Montenegro: A multi-criteria assessment by using the M-GAM model
- Flash flood potential index at national scale: Susceptibility assessment within catchments
- SWAT modelling and MCDM for spatial valuation in small hydropower planning
- Disaster risk perception and local resilience near the “Duboko” landfill: Challenges of governance, management, trust, and environmental communication in Serbia