Map analysis of soil erodibility rates and gully erosion sites in Anambra State, South Eastern Nigeria
-
Romanus Udegbunam Ayadiuno
 and
Christopher Uche Ezeh
and
Christopher Uche Ezeh

Abstract
Nigeria faces severe food security challenges caused by insecurity, flooding, and soil erosion. In the north, insecurity has prevented many farmers from accessing their farms, while in the south, especially in Anambra State, gully erosion is causing a severe menace not only to farmers and their farmlands but also to properties, and even social infrastructures in the state are not spared. Many research studies have been carried out on soil erosion and gullies in Anambra State, and solutions have been suggested, yet the menace continues. There are also conflicting reports from researchers about the actual number of gully erosion sites in Anambra State including disparities in the estimated soil erodibility in the state. This study analysed and mapped the susceptibility of soils to rainfall erosivity (high, medium, and low) and gully erosion sites in Anambra State. It reveals that the differences in erodibility result from sources of soil data and their spatial resolution. Climatically, the state falls within Koppen’s Af region, with the mean annual temperature and rainfall of around 27°C and 1,870 mm, respectively. The data requirements for this study were from primary and secondary sources. The primary data include field visits, observations, measurements, photographs, soil specimens, experimentation, and brain sensing. The secondary data sources include the Internet, related literature, soil data from the Food and Agriculture Organization (FAO), and satellite images. Geographic information system-based analyses were done using ArcGIS 10.4.1. The results are presented in two-dimensional topographic raster and vector overlaid maps of Anambra State, showing the geological formations, areas in the state with high-, medium-, and low-susceptibility to soil erodibility, and the existing gully erosion sites in the state.
1 Introduction
Soil erosion has been majorly attributed to human factors [1]. Activities of man and choice of settlements have made soil erosion endemic to man. Soil erosion is a part of the processes of landforms and soil formations. Rainfall erosivity and erodibility of soils ensure the detachment, removal, and deposition among others, which form the processes of terrain modification [2,3,4]. Soil erosion should have been a good catastrophic event and an agent of terrain correction. However, due to neglect and abuse of the environment, soil erosion has become a serious environmental disaster [5]. Many studies have linked soil erosion to anthropogenic activities like unwholesome farming practices, deforestation, mining, and overgrazing among others [6], and natural phenomena like slope, soil types, and climatic actions (rainfall and winds). Ishaya et al. [2], Xiong et al. [7], and Adepoju and Adekoya [8] attributed the problems of soil erosion to population growth, which has led to the transformation of green areas (natural vegetation) to brown areas (bare land).
There have been challenges of food security in Nigeria caused by insecurity, flooding, and soil erosion among others [9,10,11]. In the north, insecurity has prevented many farmers from accessing their farms [10,11,12], while in the south, especially in Anambra State, gully erosion is causing a severe menace not only to farmers and their farmlands but also to properties, and even social infrastructures in the state are not spared [13].
The menace of soil erosion has attracted many researchers who have investigated soil erosion and gullies in Anambra State and suggested mediation measures [14], yet the menace continues. There are conflicting reports from researchers about the actual number of gully erosion sites in Anambra State and also disparities in the rate of soil erodibility in the state [15,14].
Anambra State is the state with the most gully erosion sites, particularly in southeast and Nigeria in general – about 700 gully erosion sites [15,16,17]. Fagbohun et al. [18] reported the soil erodibility to range from 0.08 to 0.19 ton ha hr MJ−1 mm−1, Ajibade et al. [19] calculated the range to be from 0.05 to 0.80 ton ha hr MJ−1 mm−1, Egbueri et al. [13] recorded a range of 0.100–0.310 ton ha hr MJ−1 mm−1, Ayadiuno et al. [9] analysis result showed a range from 0.091 to 0.176 ton ha hr MJ−1 mm−1, and Ezeh et al. [17] found the soil erodibility range to be 0.034–0.042 ton ha hr MJ−1 mm−1.
Soil erodibility is the proneness of the soil to be eroded. It can be determined using the erodibility factor (K factor), which is an arm of the RUSLE (revised universal soil loss equation) [20,21]. It calculates the rate at which soils/sediments are removed from a particular space. The major variables used for calculating soil erodibility are the particle size distribution (sand, silt, and clay) and organic content of the soils [18,19].
This study aimed to identify, analyse, and map the areas that are most susceptible to soil erosion based on their varying soil erodibility (high, medium, and low), and gully erosion sites in Anambra State. Based on the conflicting soil erodibility reports, there is the need for a revisit of the area and for the re-analysis, identification, documentation, and mapping of the soil erodibility, locations, and directions of gully erosion site for ease of identification and remediation through proper and suitable drainage construction.
There is also the need to consider built-up settlements and their contribution to the soil erosion menace in the state. It is evident that cemented surfaces which characterized the urban settlements do not allow for infiltration. Most of the rains that fall end up generating so much runoff. With the aid of concrete constructed drainage channels in the urban settlements, these runoffs are evacuated from their points of contact and are made to join the others as the drainage channels directed and form large volumes of runoff with high velocity capable of tearing down land surfaces and triggering gully erosion.
2 Materials and methods
2.1 Description of the study area – Anambra State
The study area is Anambra State (Figure 1). The geographical area of Anambra State is 4,844 km2, with geological substrates and geomorphological features that cut across the state boundaries. The state is located at latitude 5°40′N to 6°46′N and longitude 6°35′E to 7°21′E, which climatically lies within Koppen’s Af region [22,23], with a mean annual temperature of around 27°C and a mean annual rainfall of 1,870 mm. The state has warmer temperature at the southwest and western parts, with high humidity due to the presence of water bodies – River Niger, etc., and low terrain coupled with the anthropogenic effects of built-up in the areas. The central part of the state through the north and northeast has a relatively colder temperature with low humidity (drier) as a result of elevation and limited water bodies [24]. The climatic conditions of the tropics – torrential rainfall has influence on the natural denudational processes in the region, which the state is part of. The rainy season in the region starts from March/April to October/November every year, with a break in August – little dry season which is prominent in the coast of West Africa. The region experiences dry season in October/November through March/April, with the appearance of harmattan (a dry tropical disturbance) from November/December to February/March [23,25].
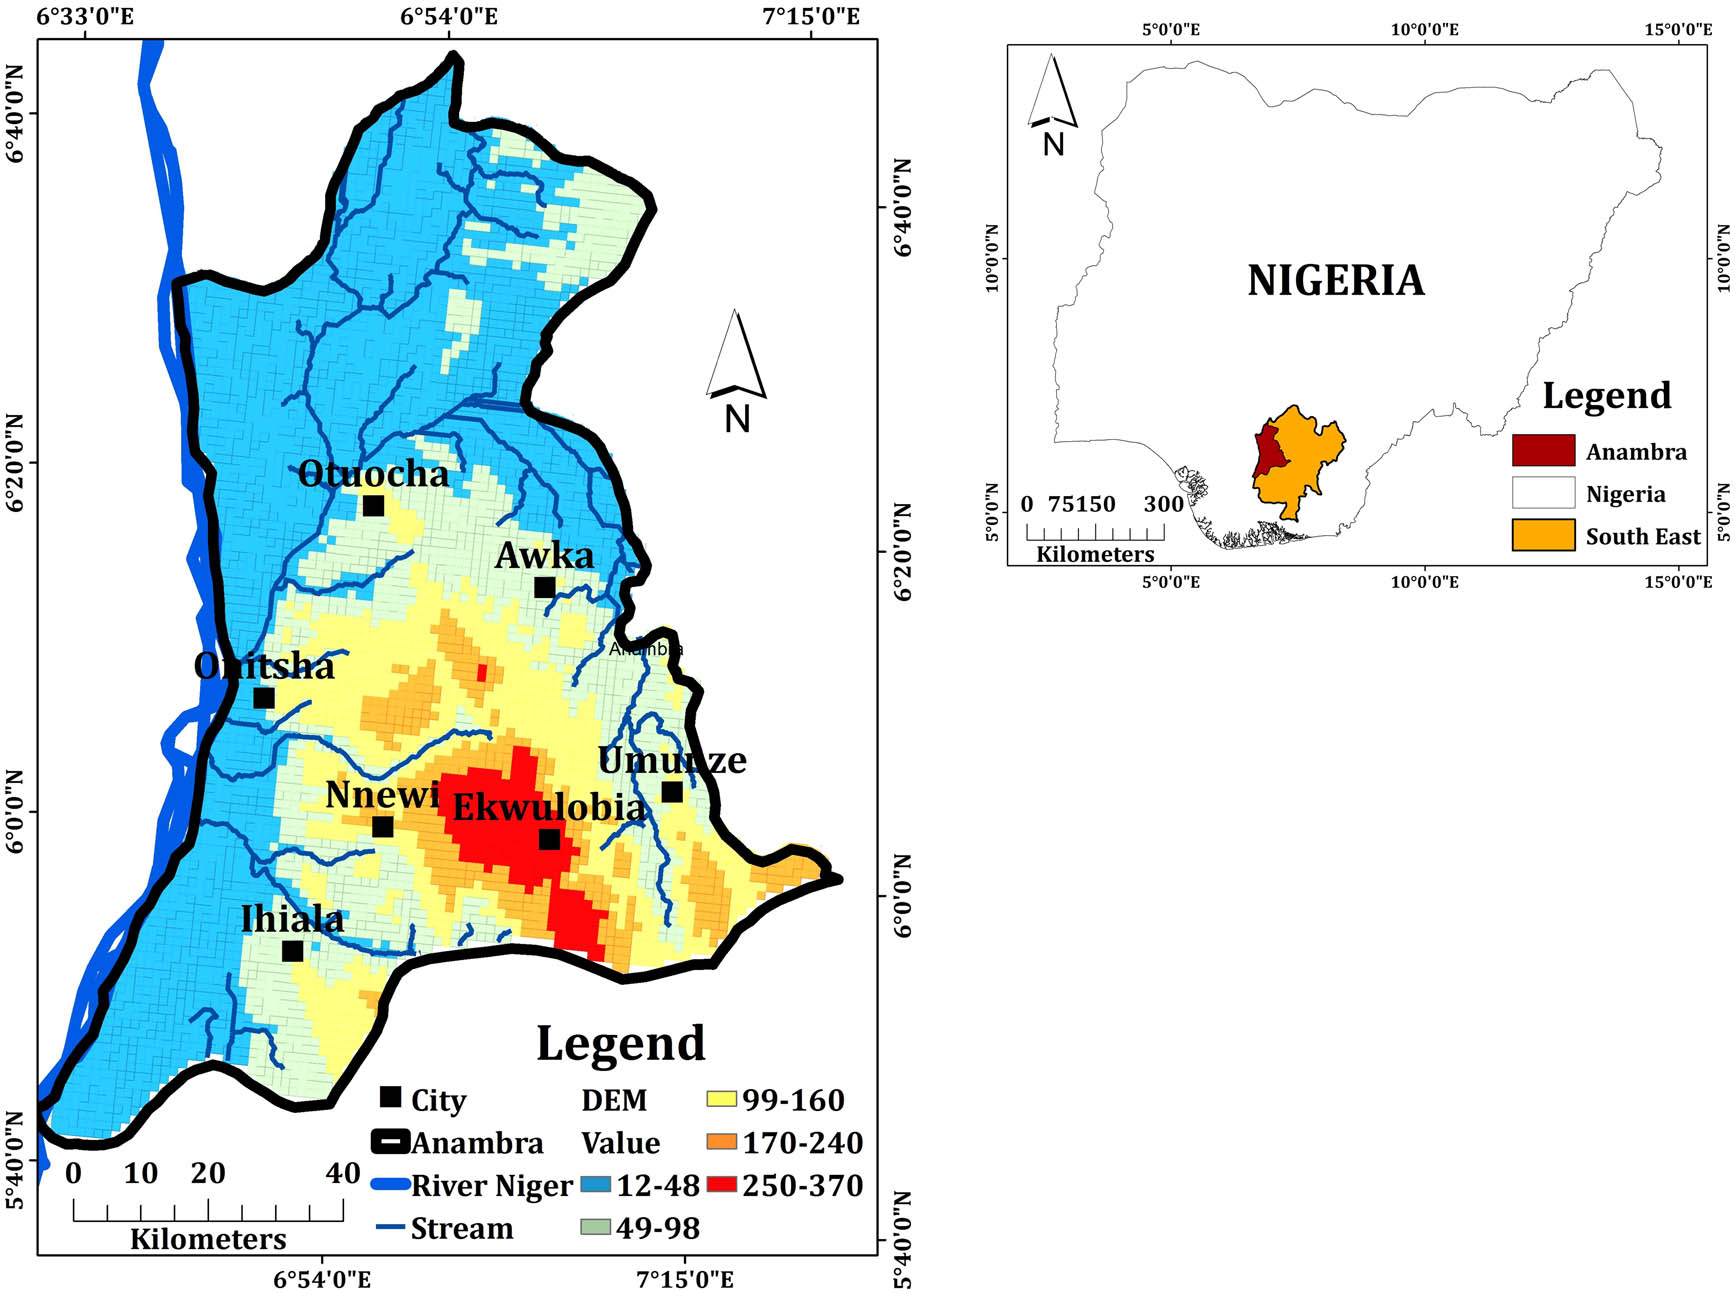
Study area. Source: Diva-GIS, modified by the authors.
2.2 Geologic and soil substrates of the study area – Anambra State
Anambra State is found within the region of cretaceous sedimentary rocks in the north, and the shale (Imo clay) formation that underlies the northern part of the state is exposed in the Mamu/Omambala basin, through the Idemili–Niger flood plains [27,28,29]. Covering the shale (Imo clay) are the deposits of the Eocene–Miocene era, the Bende-Ameke formation, Nanka sand formation, and Ebenebe sandstones, among others. “The sands and sandstones of Nanka formation are the products of the older substrates that were later broken by the faults of the Maastrichtian and have continued to be worn down through weathering, and widened by the actions of the streams issued from these aquiferous sands and sandstones of the Eastern Upland, from where the streams in the state emanates” [30,31,32]. The actions of the surface and subsurface runoffs in the state reveal the picture of a broken-like topography, carved out by the streams (on and off streams) on the relatively impermeable Shale (Imo clay) covered by sands and sandstones (Bende–Ameke and Nanka formations) with various degrees of resistance to weathering and lost by the “water-based denudation processes” leading to the formation of scarps in some areas in the state [26,34]. The geology of Anambra State is presented in Figure 2.
![Figure 2
Geology of Anambra State. Source: Okoro et al. [26] and Diva-GIS, modified by the authors.](/document/doi/10.1515/geo-2025-0830/asset/graphic/j_geo-2025-0830_fig_002.jpg)
Geology of Anambra State. Source: Okoro et al. [26] and Diva-GIS, modified by the authors.
The soils in Anambra State are arranged in relation to the various geological formations of the state [32]. The shale (Imo clay) formation also known as Ogwashi/Asaba formation covers some parts of the western side of the state and is predominantly made up of gleysols (alluvium, clay soils, and silt). This formation is the youngest of the three formations and consists of in situ decayed rock materials of Bende–Ameke in the northern transition zone and deposits of silt and fine sand in the Southwestern parts of the formation. The Bende–Ameke formation is largely made of dystric fluvisols/durisols (gravels, coarse sands, and sandstones), which covers mostly the eastern part of the state with subsections of minor formations like Nsugbe, Ebenebe, Ajali, and Mamu. The soils of Bende–Ameke formation in the transition zone of Nanka Sands formation (South of Bende–Ameke formation) in Azigbo and other parts of Nnewi South LGA and in Ozubulu and other parts of Ekwusigo LGA, majorly consist of fine sand and silt (evidence of in situ rock decay). The Nanka Sands formation cover the southern part of the state and is made up of dystric nitosols/acrisols (dark brown and red soil), which is loose and friable in nature, and very easily detachable and erodible (Figures 3 and 4) (www.fao.org, https://www.isric.org/sites/default/files/WRB). The sands in this formation are younger than that of Bende–Ameke formation and are deposits of eroded materials from the older formation – the Bende–Ameke formation.
![Figure 3
DSMW soil map of Anambra State showing five classes. Source: Diva-GIS and DSMW/WRB [33], modified by the authors.](/document/doi/10.1515/geo-2025-0830/asset/graphic/j_geo-2025-0830_fig_003.jpg)
DSMW soil map of Anambra State showing five classes. Source: Diva-GIS and DSMW/WRB [33], modified by the authors.
![Figure 4
Soil map of Anambra State reclassified into three (3) based on DSMW reclassification. Source: Diva-GIS, DSMW/WRB [33], modified by the authors.](/document/doi/10.1515/geo-2025-0830/asset/graphic/j_geo-2025-0830_fig_004.jpg)
Soil map of Anambra State reclassified into three (3) based on DSMW reclassification. Source: Diva-GIS, DSMW/WRB [33], modified by the authors.
2.3 Data collection and analysis
The data for this study consist of primary and secondary sources. The primary data include field visits, experimentation (soil erodibility monitoring plot), and observation (Figure 5), measurements, photographs, and oral detailed reports; while the secondary data include the satellite images from Google Earth Pro (www.googleearth.org), SRTM-DEM (digital elevation model data of the shuttle radar topography mission) image data and study area shapefile (www.divagis.org), soil data from the Food and Agriculture Organization (FAO) digital soil map of the World (DSMW) (www.fao.org, https://www.isric.org/sites/default/files/WRB), and other related literature.
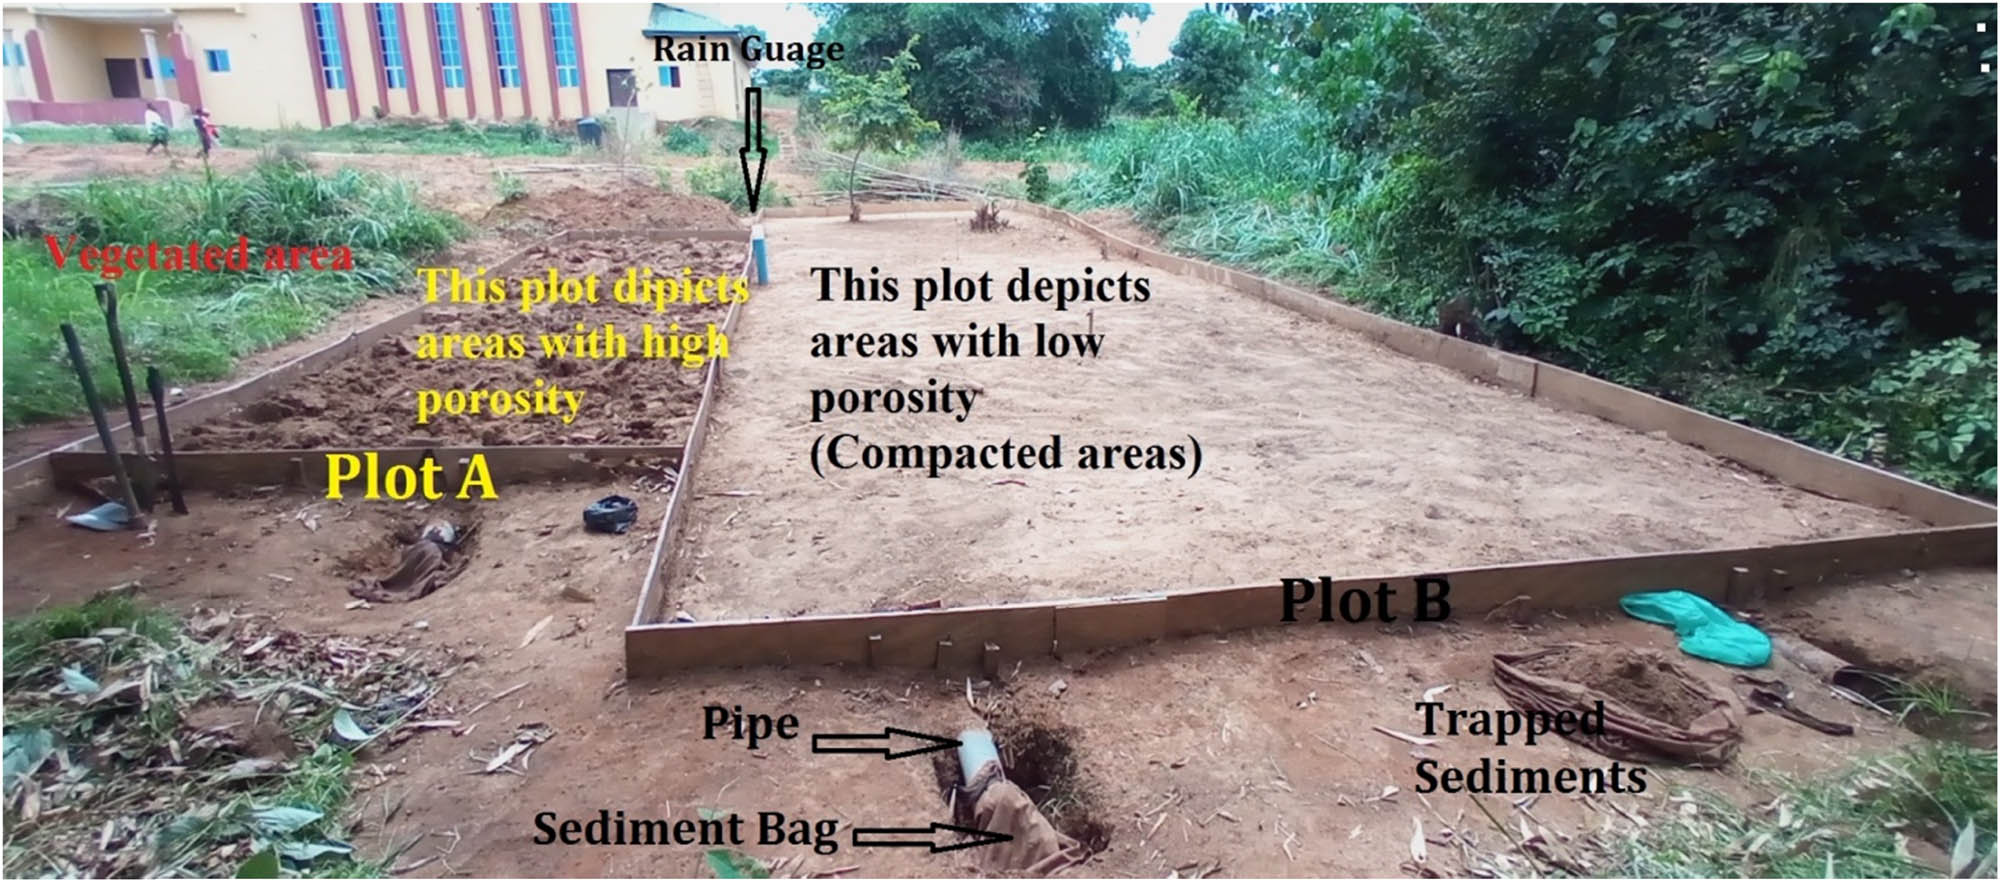
Experimental plot for the observation of rainfall erosivity impacts and soil erodibility.
The field visits include inspections and inventories of the gully erosion sites in Anambra State. These were conducted to identify the gully erosion sites’ locations. The coordinates of the gully heads were captured with a hand-held global positioning system (GPS) and were used in mapping the gully erosion sites in the state (Appendix A). An inference is drawn from the comparison of the geo-locations of the gully erosion and that of the erodibility map of the state. A map overlay of both will reveal where more gully sites are found in relation to the soil erodibility map.
The experimental plot was established to check and observe the differences in the erodibility rate of vegetated areas, porous and compacted soils. The plot was designed in a rectangular shape with planks at the edges to prevent runoff flows from outside, and it was divided into two (“A” and “B”). The plot was placed in the premises of the Federal Polytechnic Oko, Anambra State, on a land with a slope angle degrees of about 7° (Figures 5 and 6). Plot “A” (2.5 m × 10 m), an area of 25 m2 was for porous soils, which was manually tilled to create a surface with high porosity level. Plot’B’ (5 m × 20 m), an area of 100 m2 was continually cleared of vegetations during the experimentation process to depict bare soil. The sides of the plot were left with vegetations and observed for any change occasioned by rainfall erosivity. Runoff pipes were attached at the slope ends of both sections of the plot, fastened with bags to trap eroded sediments. These plots were set up in July 2022 and were used by Ezeh et al. [17] in their research. Further experimental observations were carried out for a period of 1 year – from January 2023 to December 2023 – for the purpose of this study. The experimental plot was being visited every 2 weeks for rainfall data collection and then aggregated into monthly data, while the sediment collection was also done on a monthly basis. The rainfall data were collected and recorded manually with the use of rain gauge placed in the plot. At the end of every month, the trapped sediments were extracted, allowed to dry at room temperature, then measured, and the data were also manually recorded. The data generated are shown in Table 1 and was used to determine the effect of rainfall on soil particle removal at the experimental plot location.
![Figure 6
Reclassified soil map of Anambra State with the location of the experimental plot at Oko. Source: Diva-GIS and DSMW/WRB [33], modified by the authors.](/document/doi/10.1515/geo-2025-0830/asset/graphic/j_geo-2025-0830_fig_006.jpg)
Reclassified soil map of Anambra State with the location of the experimental plot at Oko. Source: Diva-GIS and DSMW/WRB [33], modified by the authors.
Data collected from the experimental plot
| Month (2023) | Rainfall data (mm) | Sediments collected from Oko Plot A (kg per 25 m2) | Sediments collected from Oko Plot B (kg per 100 m2) | Sediment loss observed from vegetated areas |
|---|---|---|---|---|
| Jan | 36.08 | — | 4.47 | No sediment loss observed |
| Feb | 42.56 | — | 3.36 | No sediment loss observed |
| Mar | 57.36 | — | 25.86 | No sediment loss observed |
| Apr | 63.25 | — | 70.16 | No sediment loss observed |
| May | 150.43 | — | 110.81 | No sediment loss observed |
| Jun | 177.80 | — | 128.25 | No sediment loss observed |
| Jul | 138.05 | — | 84.68 | No sediment loss observed |
| Aug | 95.62 | — | 35.35 | No sediment loss observed |
| Sept | 106.70 | — | 43.18 | No sediment loss observed |
| Oct | 275.85 | — | 225.95 | No sediment loss observed |
| Nov | — | — | — | No sediment loss observed |
| Dec | — | — | — | No sediment loss observed |
| Average | 102.81 | — | 61.01 | — |
| Std Dev | 79.86 | — | 65.21 | — |
The soil data of Anambra State were extracted from the DSMW and named after the World reference base (WRB) soil nomenclature (www.fao.org, https://www.isric.org/sites/default/files/WRB). The relevant soil data types required for soil erodibility (percentage top soils of sand, clay, silt, and organic carbon contents) were selected modified (re-evaluated to round up the value of 100%; Table 2).
FAO soil data and the modified version
| DOMSOI | FAOSOI | Sand | Silt | Clay | Orgc | Total (%) |
|---|---|---|---|---|---|---|
| Nd15-1a | Dystric nitosols | 38.9 | 17.6 | 43.6 | 1.57 | 101.67 |
| G2-2/3a | Gleysols | 32.9 | 23.7 | 43.4 | 2.02 | 102.02 |
| Jd3-2a | Dystric fluvisols | 35.9 | 39.4 | 24.8 | 2.16 | 102.26 |
| Nd21-1a | Dystric nitosols | 38.9 | 17.6 | 43.6 | 1.57 | 101.67 |
| Nd5-1a | Dystric nitosols | 38.9 | 17.6 | 43.6 | 1.57 | 101.67 |
| DOMSOI | FAOSOI/WRB, 2014 | Sand (modified) | Silt (modified) | Clay (modified) | Orgc (modified) | Total (%) |
|---|---|---|---|---|---|---|
| Nd15-1a | Dystric nitosols/acrisols | 38.3 | 17.3 | 42.9 | 1.5 | 100.0 |
| G2-2/3a | Gleysols | 32.2 | 23.2 | 42.5 | 2.0 | 100.0 |
| Jd3-2a | Dystric fluvisols/durisols | 35.1 | 38.5 | 24.3 | 2.1 | 100.0 |
| Nd21-1a | Dystric nitosols/acrisols | 38.3 | 17.3 | 42.9 | 1.5 | 100.0 |
| Nd5-1a | Dystric nitosols/acrisols | 38.3 | 17.3 | 42.9 | 1.5 | 100.0 |
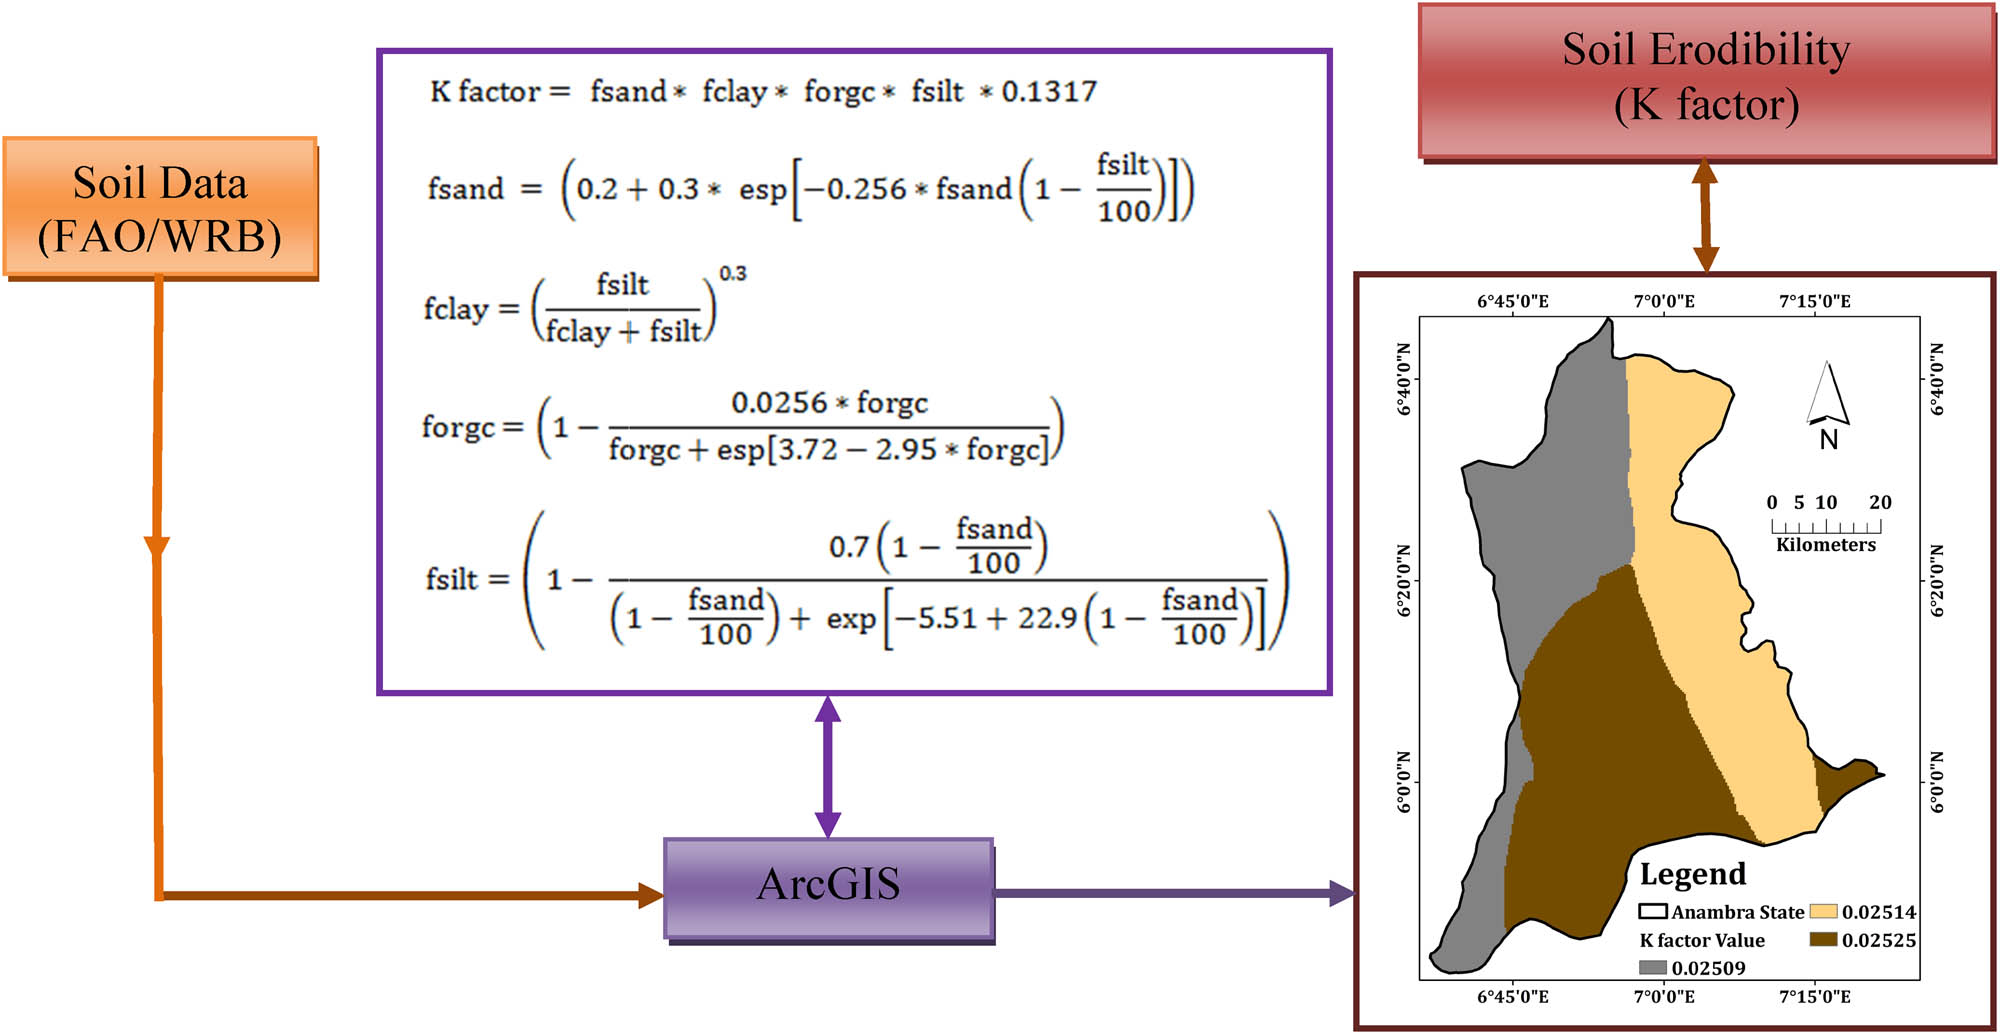
There are several methods for erodibility estimation such as the original formula by Wischmeier and Smith [35], but the Williams [36,37] formula was applied and processed in ArcGIS 10.4.1 (Figures 7 and 8). The variables required are easily assessed, and the output is much comparable to the original nomograph [38,39]. Additionally, the decision and justification of applying the EPIC model in the analysis are based on the argument of Anache et al. [40] that “the equations for indirect K factor estimation fit better when the soils subjected to indirect erodibility estimation experience similar conditions to those used for model validation,” and also on the reports of many authors such as Zhang et al. [41], Wawer et al. [42], Hussein et al. [43], Zhang et al. [44], Wang et al. [45], and Ezeh et al. [17] among others who adopted the model in their various studies.
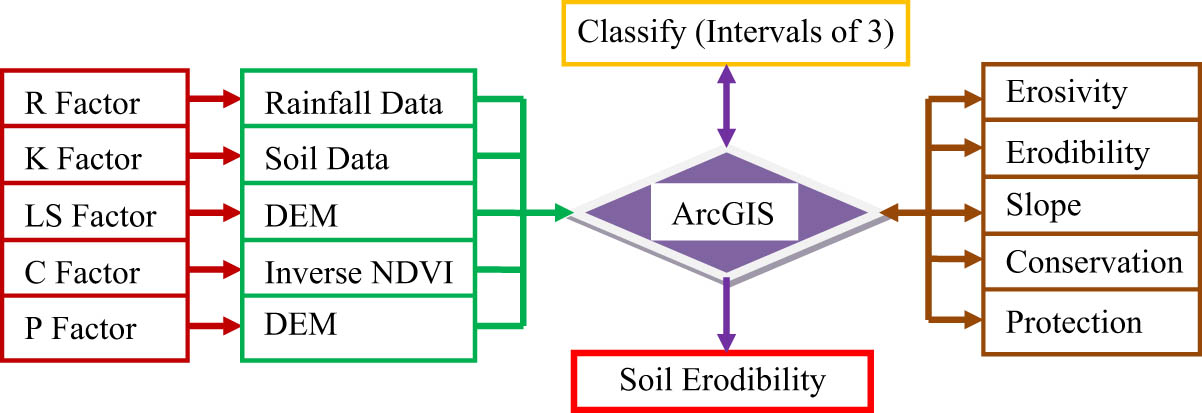
Diagrammatical representation of RUSLE analysis with emphasis on soil erodibility.
Diagrammatical representation of the soil erodibility (K factor) analysis of the RUSLE model.
The formulae for soil erodibility analyses are thus stated as follows:
0.1317 is used to multiply f sand, f clay, f orgc, and f silt to convert the erodibility value (k factor) to SI units of metric ton hectare hour hectare−1 megajoule−1 millimetre−1 (ton ha hr MJ−1 mm−1) [46,47].
Here, the K factor is the erodibility factor measured in ton ha hr MJ−1 mm−1, f sand is the % sand (0.05–2.0 mm), f silt is the % silt (0.002–0.05), f clay is the % clay (<0.002), and f orgc is the % organic matter.
Also, the locations and directions of some of the gully sites in the area were captured and overlaid on the soil erodibility (K factor) map for ease of comparison and identification.
2.4 Gully erosion site assessment
The gully erosion sites were assessed via fieldwork, which involved taking inventories of their presence and recording their locations using a handheld Garmin GPS, as shown in Table 3. By visual inspection, the gullies were assessed to determine if they are inactive, they are stabilized by intervention efforts of the state and the people, or if they are active, which imply that the intervention action was ineffective, or no attempt has ever been made to stabilize them. Additionally, inference was drawn from the soil erodibility (k factor) map when juxtaposed with the gully site maps, and by that it can be inferred if gully erosion sites are higher in locations with high erodibility rate or not.
Gully erosion sites and locations in Anambra State
| S/N | Location | Latitude | Longitude | Active | Remediation work |
|---|---|---|---|---|---|
| 1 | Oba Rojenny villa | 6.071 | 6.817 | Yes | Yes |
| 2 | Oba | 6.067 | 6.833 | Yes | No |
| 3 | Oba Urueze | 6.088 | 6.858 | Yes | No |
| 4 | Ojoto Mgbowo | 6.077 | 6.87 | Yes | No |
| 5 | Ojoto | 6.067 | 6.871 | Yes | Yes |
| 6 | Ojoto near CGC company | 6.067 | 6.871 | Yes | No |
| 7 | Ojoto near LG HQ | 6.1 | 6.9 | Yes | Yes |
| 8 | Amatutu Agulu | 6.114 | 7.041 | No | Yes |
| 9 | Agulu | 6.109 | 7.039 | No | Yes |
| 10 | Amako Nanka | 6.044 | 7.08 | Yes | Yes |
| 11 | Umuabiala Agulu | 6.121 | 7.027 | No | Yes |
| 12 | Ekwulobia | 6.029 | 7.086 | No | Yes |
| 13 | Eziabor (I) Oko | 6.032 | 7.093 | Yes | Yes |
| 14 | Umudim Nnewi | 6.018 | 6.912 | Partially | Yes |
| 15 | Nyaba Umudim Nnewi | 6.000 | 6.917 | Yes | Yes |
| 16 | Nnewichi | 6.046 | 6.92 | Yes | Yes |
| 17 | Ndam Nnobi | 6.071 | 6.943 | Yes | Yes |
| 18 | Umuolum Rd Alor | 6.086 | 6.953 | Yes | Yes |
| 19 | Ezioko Oko | 6.04 | 7.074 | Yes | Yes |
| 20 | Umudiana Adazi-Nnukwu | 6.115 | 7.015 | No | Yes |
| 21 | Eke Oraukwu | 6.099 | 6.979 | Yes | No |
| 22 | Abatete-Oraukwu Rd Abatete | 6.107 | 6.957 | No | Yes |
| 23 | Umunakwa Abatete | 6.125 | 6.962 | Yes | No |
| 24 | Ideani Junction | 6.088 | 6.931 | Yes | No |
| 25 | Uru_Amada Oraukwu | 6.106 | 6.982 | Yes | No |
| 26 | Abagana | 6.176 | 6.973 | Yes | No |
| 27 | Ogbunike | 6.18 | 6.901 | Yes | No |
| 28 | Isiji Oraifite | 6.026 | 6.812 | Yes | Yes |
| 29 | Ekulo Oraifite | 6.011 | 6.828 | Yes | Yes |
| 30 | Ndikpa (I) Umunze | 5.95 | 7.235 | Yes | Yes |
| 31 | Ndiabor Umunze | 5.962 | 7.236 | Yes | Yes |
| 32 | Ndikpa (II) Umunze | 5.957 | 7.231 | Yes | Yes |
| 33 | Ndikpa (III) Umunze | 5.961 | 7.234 | Yes | No |
| 34 | Ndikpa (IV) Umunze | 5.963 | 7.229 | Yes | Yes |
| 35 | Akpu Orumba north | 6.042 | 7.217 | Yes | Yes |
| 36 | Obuagu Ufuma | 6.071 | 7.18 | Yes | No |
| 37 | Ufuma Gully Head | 6.072 | 7.185 | Yes | No |
| 38 | Umugamu Abba | 6.199 | 6.961 | Yes | Yes |
| 39 | Nkwo Abba | 6.217 | 6.974 | Yes | No |
| 40 | Nkpo flyover | 6.152 | 6.828 | Yes | Yes |
| 41 | Awka high court | 6.239 | 7.08 | Yes | Yes |
| 42 | 100 ft road Awka | 6.238 | 7.07 | Yes | Yes |
| 43 | Amaenyi Awka | 6.225 | 7.855 | Yes | Yes |
| 44 | Nkpor | 6.153 | 6.828 | Yes | No |
| 45 | Abagana | 6.166 | 6.964 | Yes | No |
| 46 | Amaugo Awgbu | 6.083 | 7.087 | Yes | No |
| 47 | Amawbia | 6.199 | 7.061 | Yes | Yes |
| 48 | Uruokpala Abagana | 6.171 | 6.969 | Yes | Yes |
| 49 | Akpu Abagana | 6.174 | 6.968 | Yes | No |
| 50 | Ugwunano Umunze | 5.959 | 7.223 | Yes | No |
| 51 | Amabor Abba | 6.227 | 6.967 | Yes | No |
| 52 | Amawbia | 6.199 | 7.0614 | Yes | Yes |
| 53 | Awgbu | 6.083 | 7.087 | Yes | NO |
| 54 | Amadunu Nnobi | 6.043 | 6.943 | Yes | Yes |
| 55 | Oye Udide Nnobi | 6.043 | 6.941 | Yes | No |
| 56 | Ire Ojoto | 6.099 | 6.895 | Yes | Yes |
| 57 | Ideoma Umuoji | 6.092 | 6.877 | Yes | No |
| 58 | Ideoma Umuoji Diversion | 6.092 | 6.877 | Yes | No |
| 59 | Umuoma Umuoji | 6.098 | 6.878 | Yes | No |
| 60 | Isiama-Igbo Agulu | 6.083 | 7.065 | No | Yes |
| 61 | Umuakwali Akwaukwu | 6.036 | 6.808 | Yes | No |
| 62 | Eziabor (II) Oko | 6.038 | 7.093 | Yes | Yes |
| 63 | Otta Oraukwu | 6.099 | 6.992 | Yes | No |
| 64 | Oko Polytechnic | 6.060 | 7.102 | Yes | Yes |
| 65 | Nanka (I) | 6.080 | 7.059 | Yes | No |
| 66 | Nanka (II) | 6.043 | 7.076 | Yes | No |
| 67 | Ekwulobia (II) | 6.031 | 7.093 | Yes | No |
3 Results and discussion
The map representation of the soil and soil erodibility rates (K factor) are presented in Figures 9 and 10. The analyses show the soil erodibility rate of 0.02509 ton ha hr MJ−1 mm−1 for Gleysols, 0.02515 ton ha hr MJ−1 mm−1 for Dystric fluvisols/Durisols, and 0.02525 ton ha hr MJ−1 mm−1 for Dystric nitosols/Acrisols (Figures 9 and 10). The values differ from those of previous studies [9,10,11,12,13,14,15,16,17,18,19]. However, the values are closer to those of Ezeh et al. [17] and Fagbohun et al. [18] in terms of spatial distribution. This is partly because this study and that of Fagbohun et al. [18] used soil data from the same source.
![Figure 9
Point locations of main cities and soil erodibility rates (K factor values in ton ha hr MJ−1 mm−1) of Anambra State. Source: Diva-GIS and DSMW/WRB [33], modified by the authors.](/document/doi/10.1515/geo-2025-0830/asset/graphic/j_geo-2025-0830_fig_009.jpg)
Point locations of main cities and soil erodibility rates (K factor values in ton ha hr MJ−1 mm−1) of Anambra State. Source: Diva-GIS and DSMW/WRB [33], modified by the authors.
![Figure 10
Map overlay of varied soil erodibility (K factor in ton ha hr MJ−1 mm−1) rate, soil types, and gully erosion sites in Anambra State. Source: Diva-GIS, DSMW/WRB [33], and field work data, modified by the authors.](/document/doi/10.1515/geo-2025-0830/asset/graphic/j_geo-2025-0830_fig_010.jpg)
Map overlay of varied soil erodibility (K factor in ton ha hr MJ−1 mm−1) rate, soil types, and gully erosion sites in Anambra State. Source: Diva-GIS, DSMW/WRB [33], and field work data, modified by the authors.
The soil erodibility (K factor) analyses show that Gleysols has the lowest rate of erodibility (0.02509 ton ha hr MJ−1 mm−1). These soils are alluvial in nature and are found in the northern and southwestern parts of the state. They are very malleable and impermeable. The other variants of the soils are the Imo clay, fine sand, and silt of the Idemili-Niger plains. They comprise the Ogwashi/Asaba formation. The Dystric fluvisols/Durisols have a moderate erodibility rate (0.02515 ton ha hr MJ−1 mm−1). These types of soils are found in the northeastern through the southeastern parts of the state. The soils are mainly gravel and sandstone. According to Ezeh et al. [17], the soils of this part are denser than other parts of the state. They are generated as a result of disintegration of parent rock formation (Bende–Ameke) with other subformations such as Nsugbe, Ajali, and Ebenebe. The Dystric nitosols/Acrisols have the highest erodibility rate (0.02525 ton ha hr MJ−1 mm−1). These types of soils are found in the central through the southern parts of the state. The soils consist of deep weathered materials of the parent rock and the newly deposited weathered rock materials of the Bende–Ameke formation. The soils are dark brown and red in colour, loose, friable, easily detachable, and mainly consist of coarse and fine sands (Figures 9 and 10).
These findings are relatively different from those of other researchers who had carried out studies on soil loss rate, rainfall erosivity, and soil erodibility among others. There are variations in the findings of Fagbohun et al. [18], with an erodibility rate of 0.08–0.19 ton ha hr MJ−1 mm−1; Ajibade et al. [19], 0.05–0.80 ton ha hr MJ−1 mm−1; Egbueri et al. [13], 0.100–0.310 ton ha hr MJ−1 mm−1; Ayadiuno et al. [9], 0.091–0.176 ton ha hr MJ−1 mm−1; and Ezeh et al. [17], 034–0.042 ton ha hr MJ−1 mm−1. These variations may be caused by different soil data sources, estimation algorithms, and models adopted by the researchers. Fagbohun et al. [18] used soil data obtained from a soil map produced in 1990 by the Soil Division of Federal Department of Agricultural Land Resources and applied Williams [37,38] equations, while Ajibade et al. [19] adopted the Wischmeier and Smith [34] equation. Egbueri et al. [13] accessed the soil data from the Nigerian soil map table, while Ayadiuno et al. [9] and Ezeh et al. [17] used empirical and primary methods of soil data collection analysed in a soil laboratory and also applied Williams [37,38] equations.
The observation from the experimental erodibility plot suggests high erodibility (Table 1) that has rendered the area susceptible to erosion menace, especially gullies. Another reason for the escalating large number of gully erosion sites in Anambra State is attributed to artificial spaces (built-up areas). These gully erosion sites coincidentally are located in upland areas of the state overlain by Nanka Sands and with partial geological substrate of the Bende–Ameke formations. These locations are also densely populated which add to the pressure on the soil structure and the cohesive binding forces (Figures 11–13 and Appendix B). It was observed from the erodibility plot (Figure 5) that areas with vegetation cover having flat and porous surfaces impedes abrupt runoff generation as highly porous soils and vegetative areas are highly permeable. However, areas with little vegetation, low organic content, and very close to artificial spaces, especially built-up cities and high slope, mostly have a high erodibility rate and are very susceptible to gully erosion (Figures 11–13 and Table 3).
![Figure 11
Map overlay of land use land cover change, soil types, and gully erosion sites in Anambra State. Source: Diva-GIS, DSMW/WRB [33], and field work data, modified by the authors.](/document/doi/10.1515/geo-2025-0830/asset/graphic/j_geo-2025-0830_fig_011.jpg)
Map overlay of land use land cover change, soil types, and gully erosion sites in Anambra State. Source: Diva-GIS, DSMW/WRB [33], and field work data, modified by the authors.
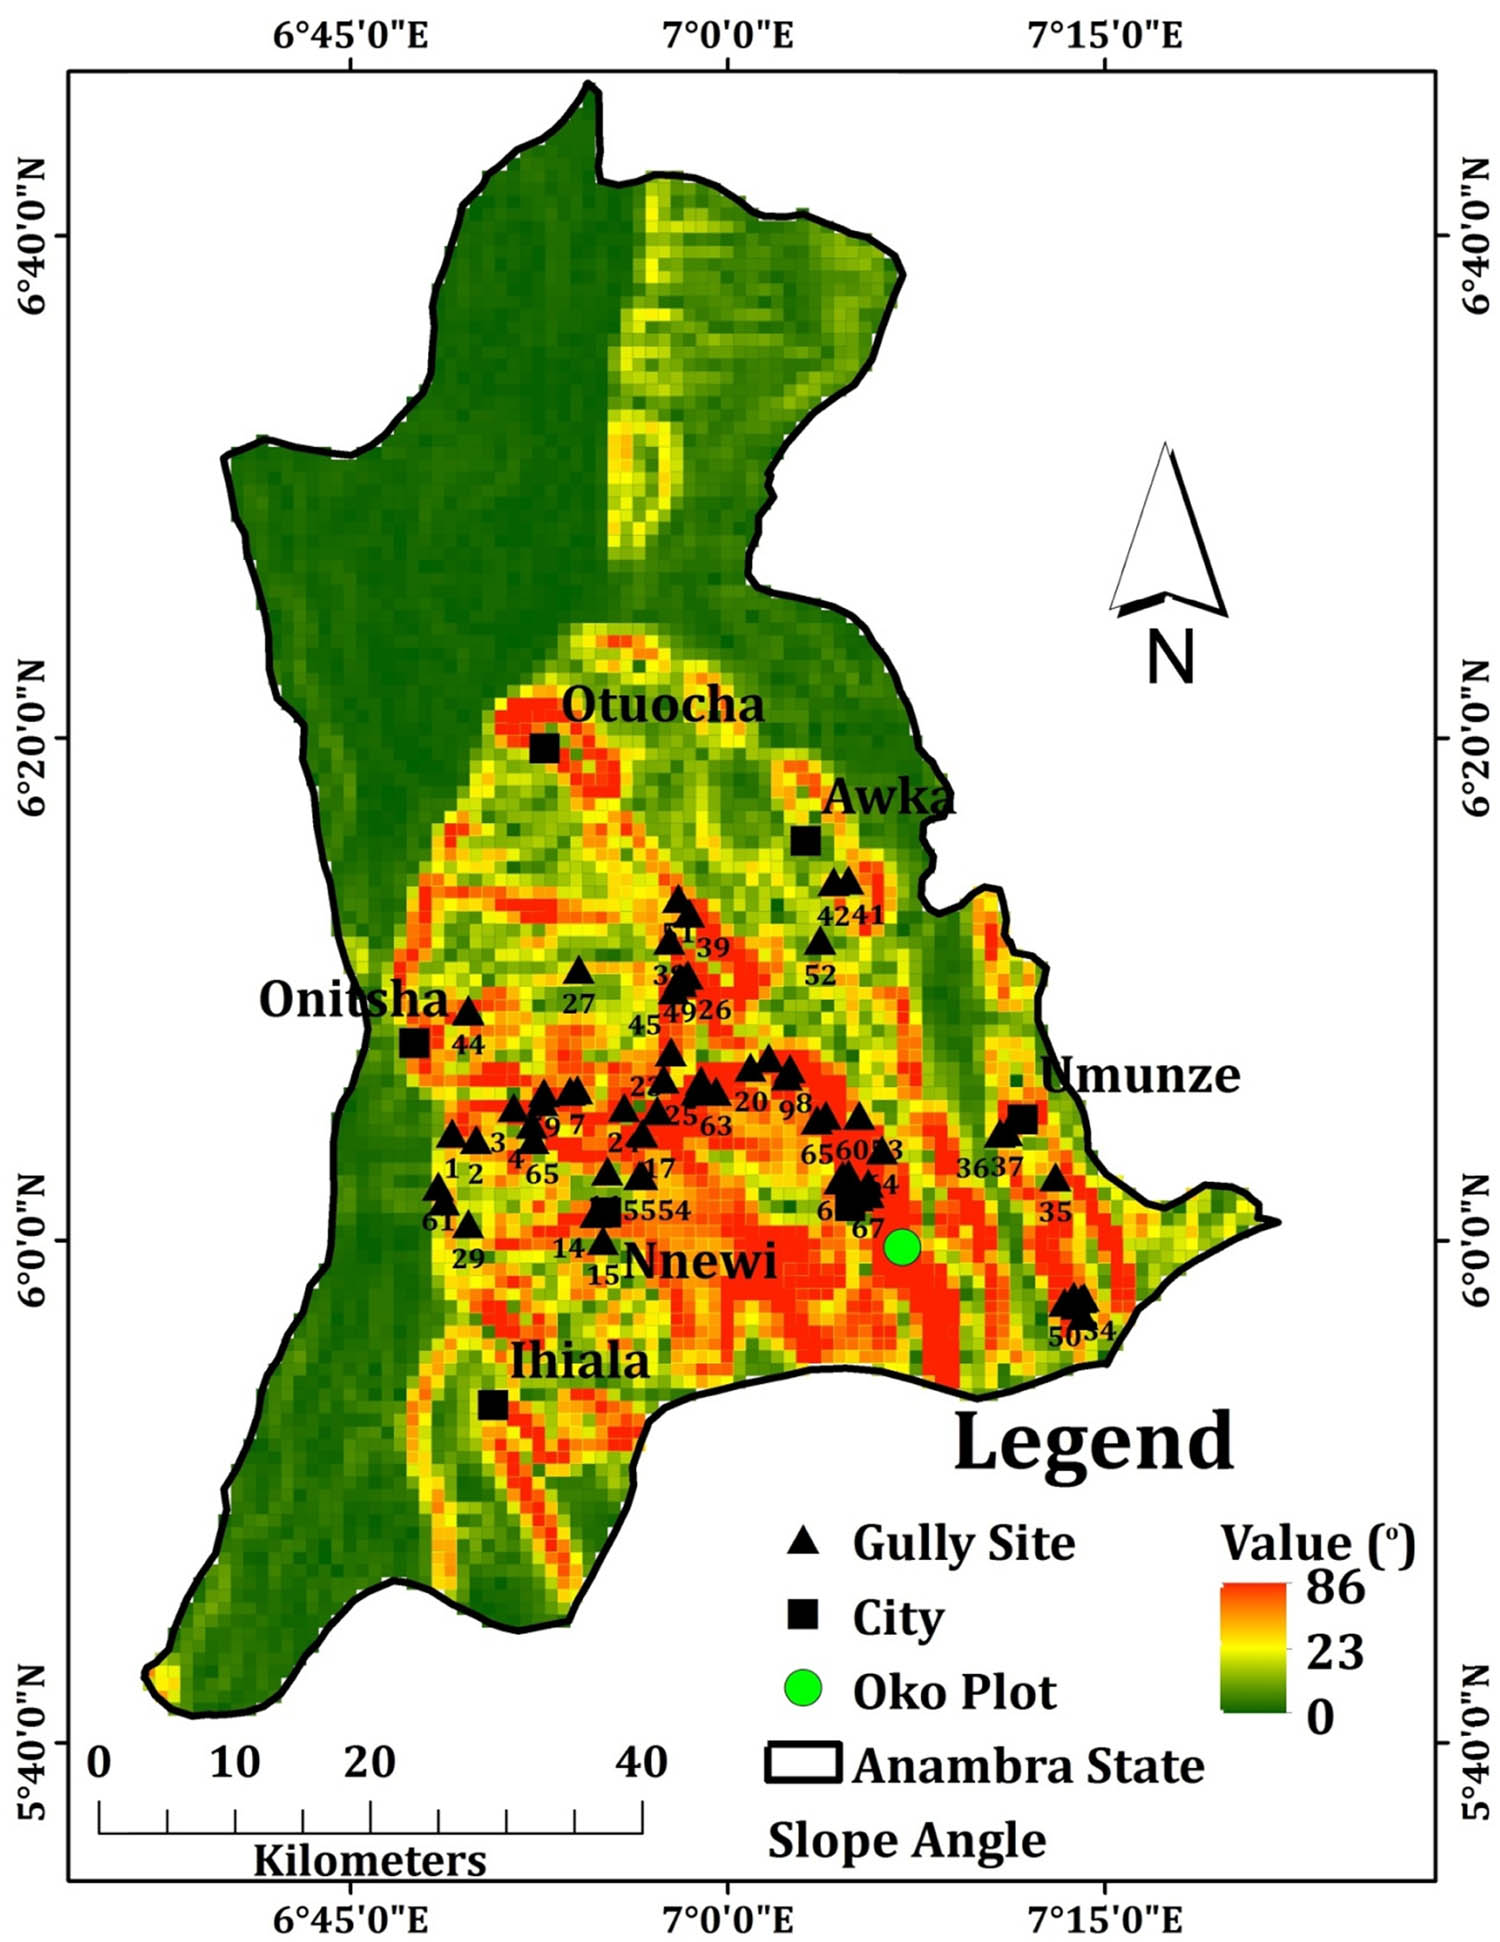
Map overlay of the slope angle and gully erosion sites in Anambra State. Source: Diva-GIS and field work data, modified by the authors.
![Figure 13
Map overlay of elevation, soil types, and gully erosion sites in Anambra State. Source: Diva-GIS, DSMW/WRB [33], and field work data, modified by the authors.](/document/doi/10.1515/geo-2025-0830/asset/graphic/j_geo-2025-0830_fig_013.jpg)
Map overlay of elevation, soil types, and gully erosion sites in Anambra State. Source: Diva-GIS, DSMW/WRB [33], and field work data, modified by the authors.
In Table 1, the data collected from the experimental plot show that in the month of January, about 36.08 mm of rain fell, which led to the dislodgement of about 4.47 kg of sediments from the 100 m2 plot (Plot B). In February also, about 42.56 mm of rain fell, which led to the dislodgement of about 3.36 kg of sediments from the 100 m2 plot (Plot B). The low level of sediment removal is attributed to the season. January and February fall within the dry season in Southern Nigeria. During this season, rainfall is usually low, while infiltration and potential evaporation are very high due to the absence of moisture occasioned by high solar radiation and temperature. At this time, the soils are unsaturated, and as such runoff generation is very low. In the months of March, April, May, June, July, August, September, and November, about 57.36, 63.25, 150.43, 177.80, 138.05, 95.62, 106.70, and 275.85 mm of rain fell, respectively, which led to the dislodgement of about 25.86, 70.16, 110.81, 128.25, 84.68, 35.35, 43.18, and 225.95 kg of sediments from the 100 m2 plot (Plot B), respectively. Excessive sedimentation loss in March and April as recorded in the table is because of the potential and kinetic energies of the rains at the onset of rainy season, which are able to disintegrate soils that are not compacted and so lacks cohesive binding forces.
The dislodgement that occur in May, June, July, August, September, and October is attributed to heavy rainfall, and the influence of antecedent soil moisture as soil becomes increasingly wet and nears saturation cum super-saturation. Subsequently, runoffs are readily generated in those months, especially towards the end of the rainy season. It was observed that an average of 102.81 mm and a standard deviation of 79.86 mm of rain fell in the area of the experimental plot (Federal Polytechnic Oko) and removed an average of 61.01 kg per 100 m2 and a standard deviation of 65.21 kg per 100 m2 of sediments, respectively.
A closer examination of Table 1 shows that sediment loss is considered in terms of rate per m2. No soil loss was recorded in the 25 m2 plot (Plot A) due to the high porous nature of the soil which encourages high infiltration and no runoff generation. The 100 m2 plot (Plot B) recorded infinitesimal values in January and February (about 4.47 and 3.36 kg, respectively). Values above 25 kg per 100 m2 were recorded from March through October, which coincide with the months of heavy rainfall in Anambra State, and erosion becomes severer (noticed from the amount of sediments trapped) in the 100 m2 plot (Plot B). This indicates that land areas with high porosity discourage erosion due to limited runoff generation, especially at the onset of rainy seasons. But, over time, as the land gets compacted due to the impact of rain drops, runoff generation increases and with it soil removal. Hence, bare soils that have been compacted get saturated and super-saturated quickly and become highly vulnerable to high runoff generation because of the absence of pore spaces and vegetation cover. Vegetation cover and re-growth reduce runoff generation, soil erosion, and at the same time stabilize the soil. This observation is in line with other studies’ findings that vegetation cover limits erosion occurrence [17,18].
It is worth noting that the data collected from a single erodibility experimental plot such as the one carried out in Oko by the authors cannot be used to make generalization of sediments or soil loss or rate of erodibility dynamics in Anambra State. It is merely intended to show variations in the rate of soil erodibility of an area under the same climatic conditions with the same rainfall amount but with different levels of vegetative cover, state of soil porosity, and compaction of the bare lands.
The areas on the periphery of the built-up cities with high population density receive devastating runoffs generated already in the cities’ impermeable artificial surfaces and are propelled with force by high gravity occasioned by high slope (Figures 11–13). Irrespective of the soil properties, the surface attributes of high slopes, built-ups and the associated bare grounds, runoffs with high volume and velocity will eventually overpower the soil strength, and as a result areas with low soil erodibility features but very close to covered spaces like cities also often experience severe erosion (Figures 10–13). These are the phenomena mostly responsible for and explain the concentration of large number of gully erosion sites in the central and southeastern parts of the state. It also explains the presence of gully erosion sites at the peripheries of cities like Onitsha, Nkpor, Awka, Ekwulobia, and Nnewi. Vegetated surfaces and porous soils tend to experience less erosion than compacted or bare surfaces (Figures 5 and 6). The central and eastern parts of the state with higher elevation, larger concentration of settlements (built-ups and high population density), bare surfaces, and little vegetation cover experience higher erosion than the western and northern parts with low and gentle slopes, lesser concentration of settlements (low population density), and much vegetation cover (Figures 11–13 and Appendix B). Additionally, the western part of the state with denser vegetative cover, lesser population, and artificial spaces has the lowest soil erodibility rate and therefore is less susceptible to rainfall erosivity and soil erosion in the state and the absence of gully erosion sites in the area. Gullies are a critical part of sediment yield in a catchment [48]. The first step in studying their contribution to sediment yield is identifying their locations.
4 Conclusions
Anambra State unarguably has the largest number of gully sites in Nigeria. This is as a result of the type of terrain, most of which are highly erodible. Many researchers who conducted research on erodibility in Anambra State arrived at different erodibility values. This study found out that the variations in the soil erodibility rate in Anambra State are as a result of different data sources, algorithms, and models applied. The state’s soils have low erodibility, but there is a spatial variation in its distribution across the state. The lowest is found on the western and northwestern parts. Hence, this area is the least susceptible to soil erosion, and it also has very sparse gully erosion sites. This is because most of the area is covered with dense riparian vegetation, has very low slopes, and malleable alluvial soils with high cohesive forces. The study shows that areas with high soil erodibility also correspond to high gully erosion sites. About 70% of soils in Anambra State comprises Dystric fluvisols/Durisols and Dystric nitosols/Acrisols, which have erodibility rates of 0.02515 ton ha hr MJ−1 mm−1 and 0.02525 ton ha hr MJ−1 mm−1, respectively. These areas are coincidentally on high terrains with heights ranging from about 50 to 380 m above the mean sea level and a slope angle between 25° and above 45°. The terrain characteristics of these zones and soil types (coarse soils) unfortunately attract the concentration of settlements and urbanization, leading to covered spaces such as roof tops, tarred roads, cemented compounds, and compacted open spaces among others. The artificial and anthropogenic covered spaces in these urban centers, such as Onitsha, Awka, Ekwulobia, and Nnewi, among others generate runoffs that initiate gully erosion at the periphery of the towns. These urban centres and their periphery are also the areas with the highest concentration of gully erosion in the state. This study also discovered that soil data required to conduct soil erodibility rate analysis in Anambra State are not sufficient, hence the grouping of all different types of soil variabilities in Anambra State into three groups – Gleysols, Dystric Fluvisols, and Dystric Nitosols. This reclassification may distort or alter some of the information required during analysis and thereby present results that may not be very accurate. These disparities in the soil data call for a further detailed analysis of the soils in Anambra State, Nigeria, and Africa with the aim of achieving distinct soil maps of high resolution.
The limitations observed during the study which may form the basis of further research in the direction of soil erodibility and soil gully erosion site locations in Anambra State are thus:
The experiment carried out is not sufficient to observe and establish soil erodibility rate based on land characteristics and rainfall erosivity. A single experimental plot in a location cannot be used to make a general consensus of soil erodibility rate in Anambra State. The data collected from the experimental plot for this study are not balanced and cannot also be used to adequately compare, collaborate, and contradict other findings of soil erodibility analysis in Anambra State.
The gully erosion site locations captured do not represent all the gully erosion sites in Anambra State, although the captured gully site locations were integrated into the geographic information system (GIS) to map, show, and depict the concentration of the gully erosion site locations in the state.
The soil information used for the study was obtained from DSMW, which classified the soil group in Anambra State into five. The soil group was later aggregated into three based on the merging of the “Nd” soil categories during the GIS analysis. Field observations during the study show that the DSMW soil classification does not reflect the soil reality on the ground in Anambra State.
Therefore, more studies are required with more experimental plots that will cover the whole of the state based on at least different geological formations and various soil types in the state. More data on gully erosion site locations are required to at least cover other areas being threatened by gully erosion. Finally, soil information obtained based on locally and/or manually collected soil data and analysed in a standard laboratory will provide a clearer composition of the soil types in Anambra State and consequently provide a more suitable and acceptable soil information for soil erodibility analysis.
Acknowledgments
First and foremost, we wish to express our gratitude to the Almighty God who made it possible for us to have access to those who generously supported, gave their time, energy, finance, and share ideas during the course of this study. Our appreciation goes also to members of our families for their love, members of staff of U D RUA Projects Limited who shared their field work experiences that made this study easy. We will not fail to appreciate A. T. Mozie (late) who laid the foundation for geomorphological studies that formed the basis upon which this research was carried out. We are also grateful to the editors and reviewers whose efforts and contributions have improved immensely the quality of the manuscript.
-
Funding information: The authors state no funding involved.
-
Author contributions: Conceptualization: R.U.A., D.C.N., and C.U.E.; methodology: R.U.A., D.C.N., and C.U.E.; software: D.C.N.; validation: R.U.A., D.C.N., and C.U.E.; formal analysis: R.U.A., D.C.N., and C.U.E.; resources: R.U.A.; data curation: D.C.N. and C.U.E.; writing – original draft preparation: D.C.N. and C.U.E.; writing – review and editing: R.U.A., D.C.N., and C.U.E.; visualization: R.U.A., D.C.N., and C.U.E.; supervision: R.U.A.; project administration: R.U.A. All authors have read and agreed to the published version of the manuscript.
-
Conflict of interest: The authors state no conflict of interest.
-
Informed consent statement: Informed consent was obtained from all subjects involved in the study.
-
Data availability statement: Data for this research will be made available upon request.
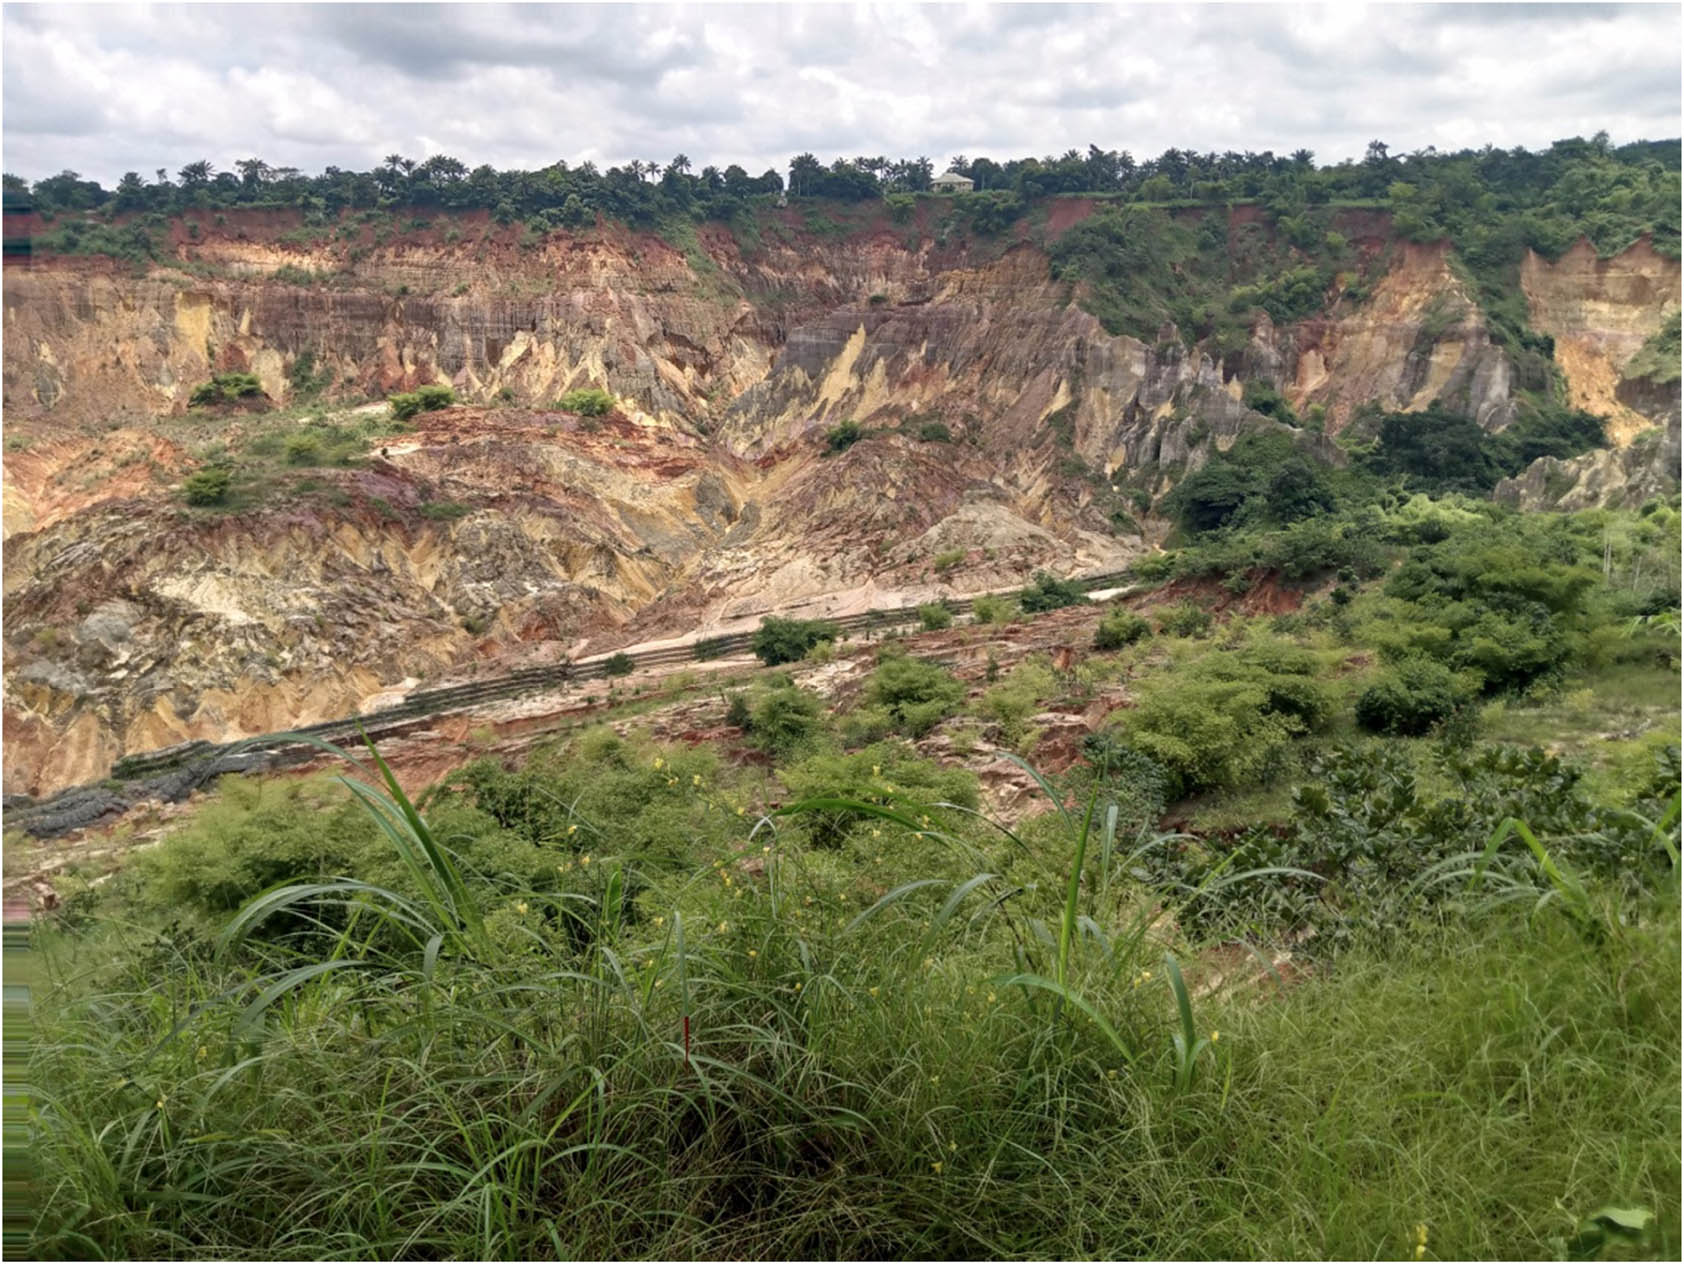
Gully erosion site at Ogbo, Nanka in Orumba North LGA of Anambra State. Source: Authors’ fieldwork data collection.
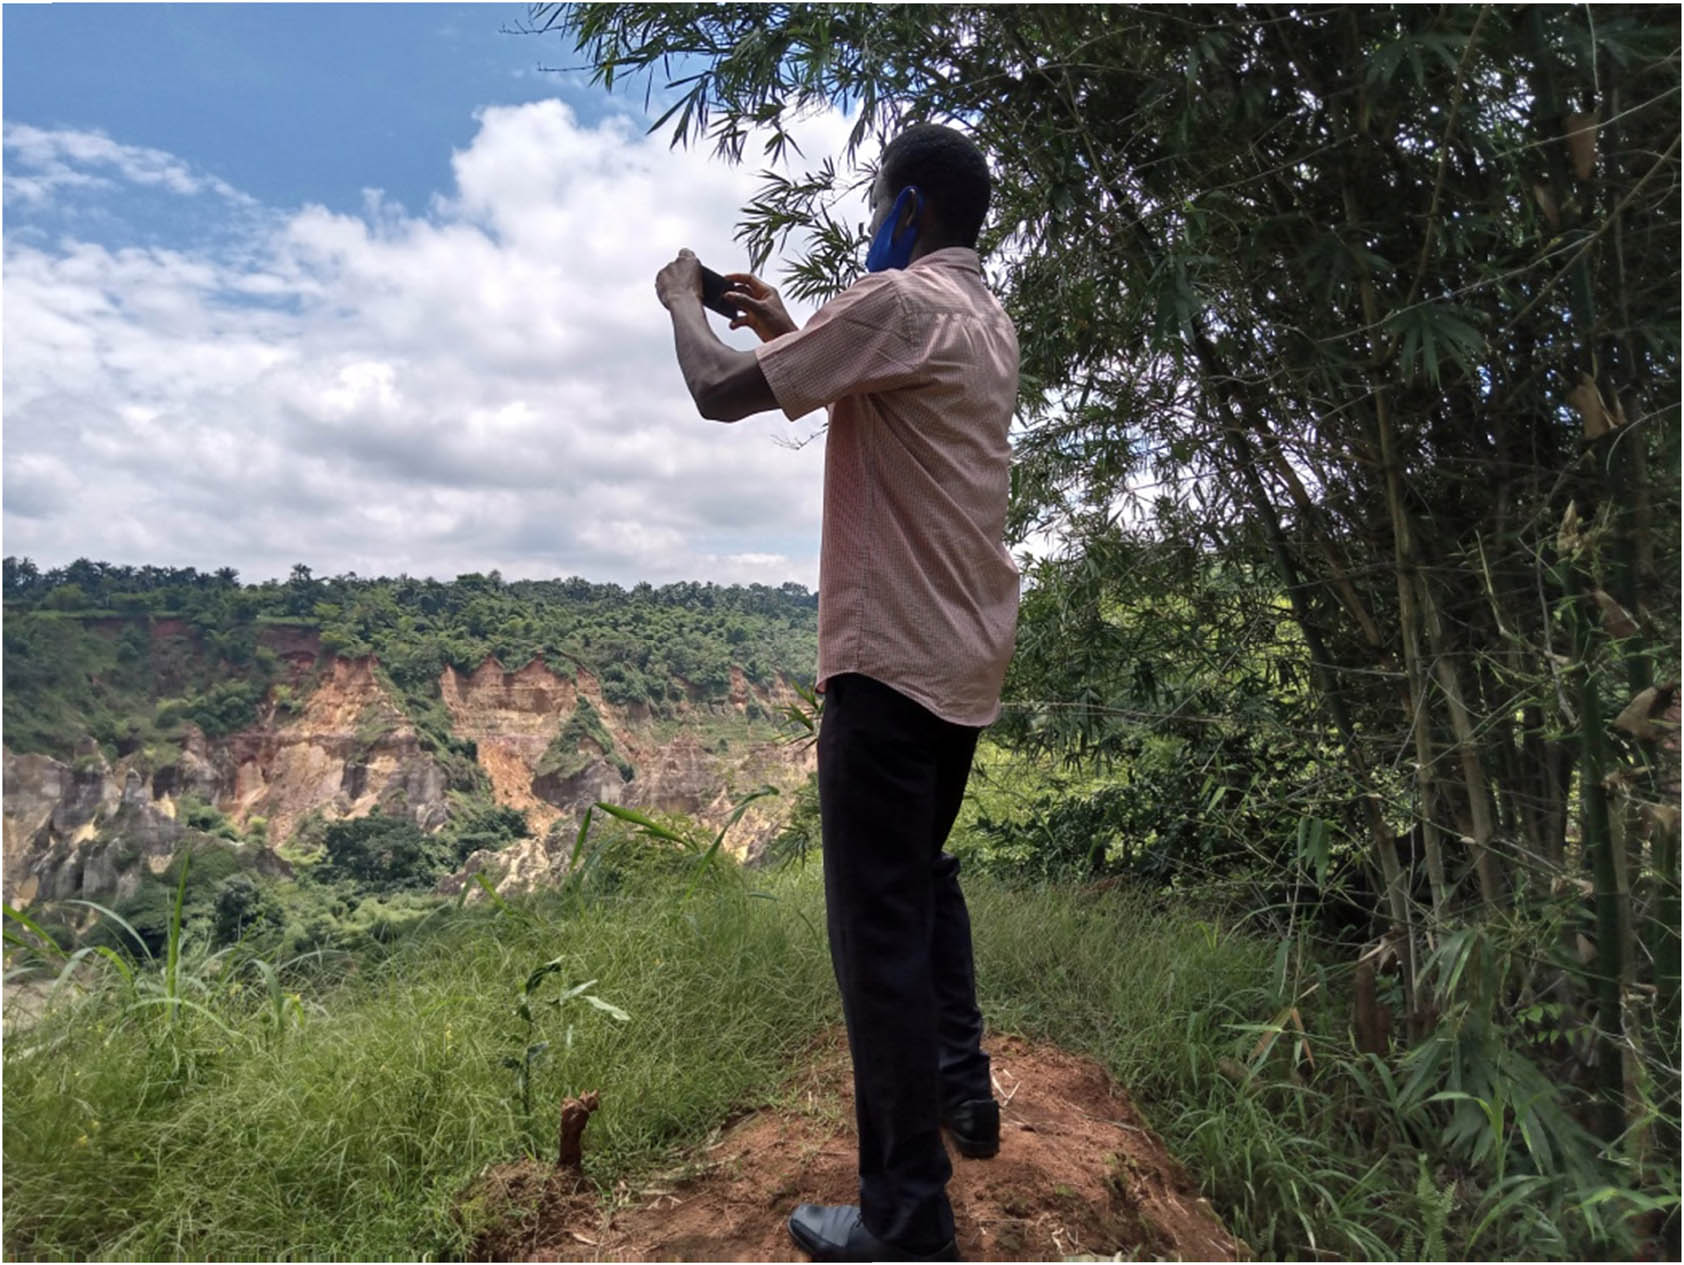
Gully erosion site data collection at Ogbo, Nanka gully head in Nanka, Orumba North LGA of Anambra State. Source: Authors’ fieldwork data collection.
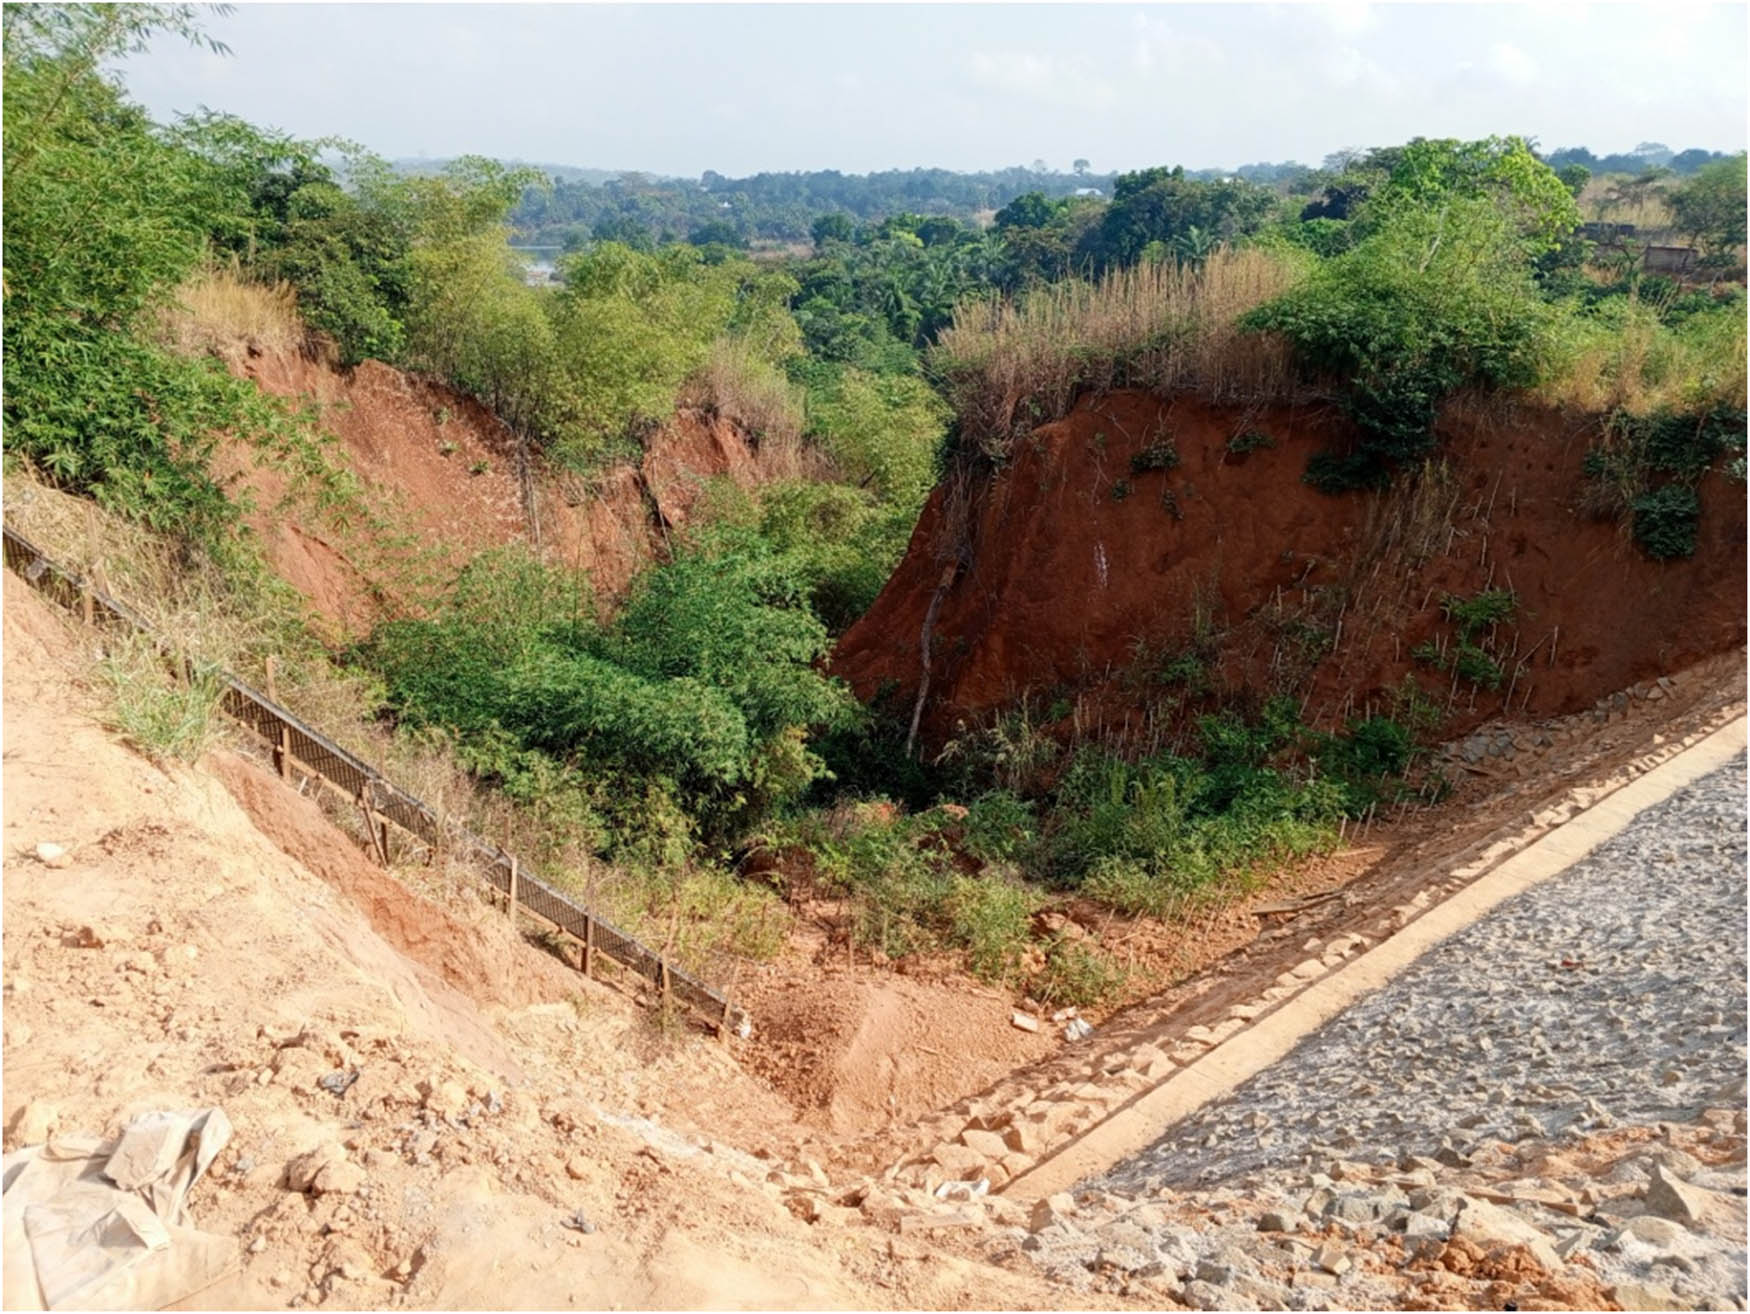
Remediation work at the Federal Polytechnic Oko gully erosion site. Source: Authors’ fieldwork data collection.
![Population density map of Anambra State based on LGAs and the locations of gully erosion heads. Source: Diva-GIS, Ndulue, Ayadiuno [23], and field work data modified by the authors.](/document/doi/10.1515/geo-2025-0830/asset/graphic/j_geo-2025-0830_fig_017.jpg)
Population density map of Anambra State based on LGAs and the locations of gully erosion heads. Source: Diva-GIS, Ndulue, Ayadiuno [23], and field work data modified by the authors.
References
[1] Gao X, Zhou Z, Yang P, Zhang H, Yang C, Li S. Quantitative analysis of impact of human activities on soil erosion using the RUSLE model in a typical karst area in Guizhou, China. Environ Monit Assess. 2024 Dec;196(12):1168.10.1007/s10661-024-13293-8Search in Google Scholar PubMed
[2] Ishaya S, Onyia FN, Ikediashi T. Mapping of soil erosion risk in Ezeagu Local Government Area of Enugu State, Nigeria. Dutse J Pure Appl Sci. 2024 Oct;10(3a):213–28.10.4314/dujopas.v10i3a.20Search in Google Scholar
[3] Isife TC. Environmental challenges and protection practices among women of Anaocha local government area of Anambra State Nigeria. AJSD. 2019;7(3):137–49.Search in Google Scholar
[4] Mushi CA, Ndomba PM, Trigg MA, Tshimanga RM, Mtalo F. Assessment of basin-scale soil erosion within the Congo River Basin: A review. Catena. 2019 Jul;178:64–76.10.1016/j.catena.2019.02.030Search in Google Scholar
[5] Khobragade M, Dhobale G. Estimation of Soil erosion by RUSLE model using geoinformatics techniques: a case study of mulshi reservoir catchment, Pune District, Western Maharashtra. J Geomat. 2024 Oct;18(2):89–96.10.58825/jog.2024.18.2.150Search in Google Scholar
[6] Ahmad NS, Mustafa FB, Didams G. A systematic review of soil erosion control practices on the agricultural land in Asia. Int Soil Water Conserv Res. 2020 Jun;8(2):103–15.10.1016/j.iswcr.2020.04.001Search in Google Scholar
[7] Xiong M, Sun R, Chen L. A global comparison of soil erosion associated with land use and climate type. Geoderma. 2019 Jun;343:31–9.10.1016/j.geoderma.2019.02.013Search in Google Scholar
[8] Adepoju MO, Adekoya EA. GIS-based assessment of soil erosion susceptibility in Ogun Watershed, Nigeria. J Geogr Inf Syst. 2018;10:598–613.Search in Google Scholar
[9] Ayadiuno RU, Phil-Eze PO, Ajake OA, Nzeadibe TC, Ndulue DC. Multi-model analysis of soil erosion susceptibility areas (SESA) and the causative factors in Anambra State, South East Nigeria. Moldova: Generis Publishing; 2022. p. 1–43.Search in Google Scholar
[10] Lekan OK, Temitayo JM, Gambarawa JA. Scourge of rural banditry and food security in Nigeria’s North-West: the economic implications. UMYU J Account Financ Res. 2022 Dec;4(1):35–48.Search in Google Scholar
[11] UNICEF. https://www.unicef.org/press-releases/25-million-nigerians-high-risk-food-insecurity-2023: 2023. Accessed October 6 2024.Search in Google Scholar
[12] FEWS. https://fews.net/west-africa/nigeria/food-security-outlook/june-2024: 2024. Accessed August 15 2024.Search in Google Scholar
[13] Egbueri JC, Igwe O, Ifediegwu SI. Erosion risk mapping of Anambra State in southeastern Nigeria: soil loss estimation by RUSLE model and geoinformatics. Bull Eng Geol Environ. 2022 Mar;81(3):91.10.1007/s10064-022-02589-zSearch in Google Scholar
[14] Ezeh CU, Igwe O, Asare MY, Ndulue DC, Ayadiuno RU, Preko K. A review of soil erosion modeling in Nigeria using the Revised Universal Soil Loss Equation model. Agrosyst Geosci Environ. 2024 Mar;7(1):e20471.10.1002/agg2.20471Search in Google Scholar
[15] Ifejofor M. Revealed: over 1000 gully erosionsite captured in Anambra. https://www.vanguardngr.com/2019/03/revealed-over-1000-gully-erosion-sites-captured-in-anambra/March 29, 2019: Accessed June 10 2024.Search in Google Scholar
[16] Ndulue DC, Ayadiuno RU, Mozie AT, Ndichie CC. A comparative analysis of soil erosion models for tropical humid of Southeastern Nigeria and comparable environments. Psychol Educ. 2021;58(1):5821–35.Search in Google Scholar
[17] Ezeh CU, Adjei KA, Schönbrodt-Stitt S, Igwe O, Asare MY, Preko K. Scale-related variations in soil loss and validation of the Rusle model in Anambra State, Nigeria. Eurasian Soil Sci. 2024 Dec;57(12):2193–207.10.1134/S1064229324600015Search in Google Scholar
[18] Fagbohun BJ, Anifowose AY, Odeyemi C, Aladejana OO, Aladeboyeje AI. GIS-based estimation of soil erosion rates and identification of critical areas in Anambra sub-basin, Nigeria. Modeling Earth Syst Environ. 2016 Sep;2:1.10.1007/s40808-016-0218-3Search in Google Scholar
[19] Ajibade FO, Nwogwu NA, Adelodun B, Abdulkadir TS, Ajibade TF, Lasisi KH, et al. Application of RUSLE integrated with GIS and remote sensing techniques to assess soil erosion in Anambra State, South-Eastern Nigeria. J Water Clim Change. 2020 Dec;11(S1):407–22.10.2166/wcc.2020.222Search in Google Scholar
[20] Egboka BC, Orji AE, Nwankwoala HO. Gully erosion and landslides in southeastern Nigeria: causes, consequences and control measures. Glob J Eng Sci. 2019;2(4):1–1.10.33552/GJES.2019.02.000541Search in Google Scholar
[21] Ayadiuno RU, Ndulue DC. Analysis of soil erosion causative factors and susceptibility in Anambra State, Southeastern, Nigeria. Biosci Biotechnol Res Commun. 2021;14(9):212–8. 10.21786/bbrc/14.9.40.Search in Google Scholar
[22] Koppen W. Das geographische system der climate. In: Koppen W, Geiger R, editors. Handchurch de Climatologie. Vol. 1. Berlin: Gebrüder Borntraeger; 1936.Search in Google Scholar
[23] Ndulue DC, Ayadiuno RU. Principal component analysis of factors influencing mode of movement in Anambra State, South East Nigeria. Turkish J Physiother Rehabil. 2021;32(3):3837–48.Search in Google Scholar
[24] Obeta MC, Anyadike RNC, Mbajiorgu CC, Phil-Eze PO, Onyekwelu CA, Ochege FU, et al. Diagnosis, prioritization and costing of gully erosion Management Strategies, NEWMAP Technical Report. Abuja (NG) Nigeria Erosion Watershed Management Project (NEWMAP), Federal Ministry of Environment; 2011.Search in Google Scholar
[25] Anyadike RCN. Climate and vegetation. In: Ofomata GEK, editor. A survey of Igbo Nation. Onitsha: African First Publishers Ltd; 2002. p. 56–72.Search in Google Scholar
[26] Okoro AU, Okogbue CO, Nwajide CS, Onuigbo EN. Provenance and paleogeography of the Nkporo formation (late Campanian–early Maastrichtian) in the Afikpo Sub-Basin, Southeastern Nigeria. J Sci Res. 2012 Oct;88(3):346–64.Search in Google Scholar
[27] Umeji OP. Mid-Tertiary (late Eocene-early Miocene) lignites from Mpu Formation, Abakaliki Basin southwestern Nigeria. J Min Geol. 2002;38(2):111–8. 10.4314/jmg.v38i2.18781.Search in Google Scholar
[28] Igwe O, Egbueri JC. The characteristics and the erodibility potentials of soils from different geologic formations in Anambra State, Southeastern Nigeria. J Geol Soc India. 2018 Oct;92:471–8. 10.1007/s12594-018-1044-1.Search in Google Scholar
[29] Ndulue DC. Geostatistical and geotechnical analysis of the terrain of Onitsha Metropolis and its environs in Anambra State, Nigeria. M.Sc. thesis. Oyo State Nigeria: Department of Geography, University of Ibadan; 2023.10.9734/bpi/raeges/v2/58Search in Google Scholar
[30] Offodile ME. Groundwater study and development in Nigeria. Mecon Geology and Engineering Service Limited. 2nd edn. Jos, Nigeria; 2002.Search in Google Scholar
[31] Okoyeh EI, Akpan AE, Egboka BC, Okeke HI. An assessment of the influences of surface and subsurface water level dynamics in the development of gullies in Anambra State, southeastern Nigeria. Earth Interact. 2014 Jan;18(4):1–24.10.1175/2012EI000488.1Search in Google Scholar
[32] Ayadiuno RU, Ndulue DC, Mozie AT. A geomorphological survey and landscape analysis of Anambra State Southeast Nigeria. Journal of Geography. Environ Earth Sci Int. 2022;26(2):39–58.10.9734/jgeesi/2022/v26i230337Search in Google Scholar
[33] WRB. World Reference Base for Soil Resources, International Soil Classification System for Naming Soils and Creating Legends for Soil Maps; 2014. https://www.isric.org/sites/default/files/WRB. Accessed December 2, 2024Search in Google Scholar
[34] Ofomata GEK. Land resource of South-Eastern Nigeria: A need for conservation. In: Igbozurike UM, editor. A land use and conservation in Nigeria. Nsukka: University of Nigeria Press; 1981.Search in Google Scholar
[35] Wischmeier WH, Smith DD. Predicting rainfall erosion losses: a guide to conservation planning. Washington, DC: U.S. Department of Agriculture, Science and Education Administration; 1978.Search in Google Scholar
[36] Williams JR. The erosion-productivity impact calculator (EPIC) model: a case history. Philos Trans R Soc Lond Ser B: Biol Sci. 1990 Sep;329(1255):421–8.10.1098/rstb.1990.0184Search in Google Scholar
[37] Williams JR. Chapter 25: The EPIC model. In: Singh VP, editor. Computer models of watershed hydrology. Highlands Ranch (CO): Water Resources publications; 1995;1:909–1000.Search in Google Scholar
[38] Tsige MG, Malcherek A, Seleshi Y. Improving the modified universal soil loss equation by physical interpretation of its factors. Water. 2022 May;14(9):1450.10.3390/w14091450Search in Google Scholar
[39] Guo H, Zhuang X, Rabczuk T. A deep collocation method for the bending analysis of Kirchhoff plate. arXiv preprint arXiv:2102.02617. 2021 Feb 4.Search in Google Scholar
[40] Anache JA, Bacchi CG, Panachuki E, Sobrinho TA. Assessment of methods for predicting soil erodibility in soil loss modeling. Geosci = Geociênc. 2015 Mar;34(1):32–40.Search in Google Scholar
[41] Zhang K, Li S, Peng W, Yu B. Erodibility of agricultural soils on the Loess Plateau of China. Soil Tillage Res. 2004 Apr;76(2):157–65.10.1016/j.still.2003.09.007Search in Google Scholar
[42] Wawer R, Nowocien E, Podolski B. Eal and calculated kusle erobility factor for selected Polish soils. Pol J Environ Stud. 2005 Jan;14(5):655–8.Search in Google Scholar
[43] Hussein MH, Kariem TH, Othman AK. Predicting soil erodibility in northern Iraq using natural runoff plot data. Soil Tillage Res. 2007 May;94(1):220–8.10.1016/j.still.2006.07.012Search in Google Scholar
[44] Zhang KL, Shu AP, Xu XL, Yang QK, Yu B. Soil erodibility and its estimation for agricultural soils in China. J Arid Environ. 2008 Jun;72(6):1002–11.10.1016/j.jaridenv.2007.11.018Search in Google Scholar
[45] Wang B, Zheng F, Römkens MJ. Comparison of soil erodibility factors in USLE, RUSLE2, EPIC and Dg models based on a Chinese soil erodibility database. Acta Agric Scand, Sect B. 2013 Jan;63(1):69–79.10.1080/09064710.2012.718358Search in Google Scholar
[46] Benavidez R, Jackson B, Maxwell D, Norton K. A review of the (Revised) Universal Soil Loss Equation ((R) USLE): With a view to increasing its global applicability and improving soil loss estimates. Hydrol Earth Syst Sci. 2018 Nov;22(11):6059–86.10.5194/hess-22-6059-2018Search in Google Scholar
[47] Renard K, Foster G, Weesies G, McCool D, Yoder D. Predicting soil erosion by water: a guide to conservation30 planning with the revised universal soil loss equation (RUSLE). Agric Handb. 1997;703:65–100. DC0-16-048938-5.Search in Google Scholar
[48] Gourfi A, Vanmaercke M, Poesen J, de Vente J, Aqnouy M, Taibi AN, et al. Soil erosion and sediment yield in africa: processes and factors. J Afr Earth Sci. 2025 Jul;227:105622.10.1016/j.jafrearsci.2025.105622Search in Google Scholar
© 2025 the author(s), published by De Gruyter
This work is licensed under the Creative Commons Attribution 4.0 International License.
Articles in the same Issue
- Research Articles
- Seismic response and damage model analysis of rocky slopes with weak interlayers
- Multi-scenario simulation and eco-environmental effect analysis of “Production–Living–Ecological space” based on PLUS model: A case study of Anyang City
- Remote sensing estimation of chlorophyll content in rape leaves in Weibei dryland region of China
- GIS-based frequency ratio and Shannon entropy modeling for landslide susceptibility mapping: A case study in Kundah Taluk, Nilgiris District, India
- Natural gas origin and accumulation of the Changxing–Feixianguan Formation in the Puguang area, China
- Spatial variations of shear-wave velocity anomaly derived from Love wave ambient noise seismic tomography along Lembang Fault (West Java, Indonesia)
- Evaluation of cumulative rainfall and rainfall event–duration threshold based on triggering and non-triggering rainfalls: Northern Thailand case
- Pixel and region-oriented classification of Sentinel-2 imagery to assess LULC dynamics and their climate impact in Nowshera, Pakistan
- The use of radar-optical remote sensing data and geographic information system–analytical hierarchy process–multicriteria decision analysis techniques for revealing groundwater recharge prospective zones in arid-semi arid lands
- Effect of pore throats on the reservoir quality of tight sandstone: A case study of the Yanchang Formation in the Zhidan area, Ordos Basin
- Hydroelectric simulation of the phreatic water response of mining cracked soil based on microbial solidification
- Spatial-temporal evolution of habitat quality in tropical monsoon climate region based on “pattern–process–quality” – a case study of Cambodia
- Early Permian to Middle Triassic Formation petroleum potentials of Sydney Basin, Australia: A geochemical analysis
- Micro-mechanism analysis of Zhongchuan loess liquefaction disaster induced by Jishishan M6.2 earthquake in 2023
- Prediction method of S-wave velocities in tight sandstone reservoirs – a case study of CO2 geological storage area in Ordos Basin
- Ecological restoration in valley area of semiarid region damaged by shallow buried coal seam mining
- Hydrocarbon-generating characteristics of Xujiahe coal-bearing source rocks in the continuous sedimentary environment of the Southwest Sichuan
- Hazard analysis of future surface displacements on active faults based on the recurrence interval of strong earthquakes
- Structural characterization of the Zalm district, West Saudi Arabia, using aeromagnetic data: An approach for gold mineral exploration
- Research on the variation in the Shields curve of silt initiation
- Reuse of agricultural drainage water and wastewater for crop irrigation in southeastern Algeria
- Assessing the effectiveness of utilizing low-cost inertial measurement unit sensors for producing as-built plans
- Analysis of the formation process of a natural fertilizer in the loess area
- Machine learning methods for landslide mapping studies: A comparative study of SVM and RF algorithms in the Oued Aoulai watershed (Morocco)
- Chemical dissolution and the source of salt efflorescence in weathering of sandstone cultural relics
- Molecular simulation of methane adsorption capacity in transitional shale – a case study of Longtan Formation shale in Southern Sichuan Basin, SW China
- Evolution characteristics of extreme maximum temperature events in Central China and adaptation strategies under different future warming scenarios
- Estimating Bowen ratio in local environment based on satellite imagery
- 3D fusion modeling of multi-scale geological structures based on subdivision-NURBS surfaces and stratigraphic sequence formalization
- Comparative analysis of machine learning algorithms in Google Earth Engine for urban land use dynamics in rapidly urbanizing South Asian cities
- Study on the mechanism of plant root influence on soil properties in expansive soil areas
- Simulation of seismic hazard parameters and earthquakes source mechanisms along the Red Sea rift, western Saudi Arabia
- Tectonics vs sedimentation in foredeep basins: A tale from the Oligo-Miocene Monte Falterona Formation (Northern Apennines, Italy)
- Investigation of landslide areas in Tokat-Almus road between Bakımlı-Almus by the PS-InSAR method (Türkiye)
- Predicting coastal variations in non-storm conditions with machine learning
- Cross-dimensional adaptivity research on a 3D earth observation data cube model
- Geochronology and geochemistry of late Paleozoic volcanic rocks in eastern Inner Mongolia and their geological significance
- Spatial and temporal evolution of land use and habitat quality in arid regions – a case of Northwest China
- Ground-penetrating radar imaging of subsurface karst features controlling water leakage across Wadi Namar dam, south Riyadh, Saudi Arabia
- Rayleigh wave dispersion inversion via modified sine cosine algorithm: Application to Hangzhou, China passive surface wave data
- Fractal insights into permeability control by pore structure in tight sandstone reservoirs, Heshui area, Ordos Basin
- Debris flow hazard characteristic and mitigation in Yusitong Gully, Hengduan Mountainous Region
- Research on community characteristics of vegetation restoration in hilly power engineering based on multi temporal remote sensing technology
- Identification of radial drainage networks based on topographic and geometric features
- Trace elements and melt inclusion in zircon within the Qunji porphyry Cu deposit: Application to the metallogenic potential of the reduced magma-hydrothermal system
- Pore, fracture characteristics and diagenetic evolution of medium-maturity marine shales from the Silurian Longmaxi Formation, NE Sichuan Basin, China
- Study of the earthquakes source parameters, site response, and path attenuation using P and S-waves spectral inversion, Aswan region, south Egypt
- Source of contamination and assessment of potential health risks of potentially toxic metal(loid)s in agricultural soil from Al Lith, Saudi Arabia
- Regional spatiotemporal evolution and influencing factors of rural construction areas in the Nanxi River Basin via GIS
- An efficient network for object detection in scale-imbalanced remote sensing images
- Effect of microscopic pore–throat structure heterogeneity on waterflooding seepage characteristics of tight sandstone reservoirs
- Environmental health risk assessment of Zn, Cd, Pb, Fe, and Co in coastal sediments of the southeastern Gulf of Aqaba
- A modified Hoek–Brown model considering softening effects and its applications
- Evaluation of engineering properties of soil for sustainable urban development
- The spatio-temporal characteristics and influencing factors of sustainable development in China’s provincial areas
- Application of a mixed additive and multiplicative random error model to generate DTM products from LiDAR data
- Gold vein mineralogy and oxygen isotopes of Wadi Abu Khusheiba, Jordan
- Prediction of surface deformation time series in closed mines based on LSTM and optimization algorithms
- 2D–3D Geological features collaborative identification of surrounding rock structural planes in hydraulic adit based on OC-AINet
- Spatiotemporal patterns and drivers of Chl-a in Chinese lakes between 1986 and 2023
- Land use classification through fusion of remote sensing images and multi-source data
- Nexus between renewable energy, technological innovation, and carbon dioxide emissions in Saudi Arabia
- Analysis of the spillover effects of green organic transformation on sustainable development in ethnic regions’ agriculture and animal husbandry
- Factors impacting spatial distribution of black and odorous water bodies in Hebei
- Large-scale shaking table tests on the liquefaction and deformation responses of an ultra-deep overburden
- Impacts of climate change and sea-level rise on the coastal geological environment of Quang Nam province, Vietnam
- Reservoir characterization and exploration potential of shale reservoir near denudation area: A case study of Ordovician–Silurian marine shale, China
- Seismic prediction of Permian volcanic rock reservoirs in Southwest Sichuan Basin
- Application of CBERS-04 IRS data to land surface temperature inversion: A case study based on Minqin arid area
- Geological characteristics and prospecting direction of Sanjiaoding gold mine in Saishiteng area
- Research on the deformation prediction model of surrounding rock based on SSA-VMD-GRU
- Geochronology, geochemical characteristics, and tectonic significance of the granites, Menghewula, Southern Great Xing’an range
- Hazard classification of active faults in Yunnan base on probabilistic seismic hazard assessment
- Characteristics analysis of hydrate reservoirs with different geological structures developed by vertical well depressurization
- Estimating the travel distance of channelized rock avalanches using genetic programming method
- Landscape preferences of hikers in Three Parallel Rivers Region and its adjacent regions by content analysis of user-generated photography
- New age constraints of the LGM onset in the Bohemian Forest – Central Europe
- Characteristics of geological evolution based on the multifractal singularity theory: A case study of Heyu granite and Mesozoic tectonics
- Soil water content and longitudinal microbiota distribution in disturbed areas of tower foundations of power transmission and transformation projects
- Oil accumulation process of the Kongdian reservoir in the deep subsag zone of the Cangdong Sag, Bohai Bay Basin, China
- Investigation of velocity profile in rock–ice avalanche by particle image velocimetry measurement
- Optimizing 3D seismic survey geometries using ray tracing and illumination modeling: A case study from Penobscot field
- Sedimentology of the Phra That and Pha Daeng Formations: A preliminary evaluation of geological CO2 storage potential in the Lampang Basin, Thailand
- Improved classification algorithm for hyperspectral remote sensing images based on the hybrid spectral network model
- Map analysis of soil erodibility rates and gully erosion sites in Anambra State, South Eastern Nigeria
- Identification and driving mechanism of land use conflict in China’s South-North transition zone: A case study of Huaihe River Basin
- Evaluation of the impact of land-use change on earthquake risk distribution in different periods: An empirical analysis from Sichuan Province
- A test site case study on the long-term behavior of geotextile tubes
- An experimental investigation into carbon dioxide flooding and rock dissolution in low-permeability reservoirs of the South China Sea
- Detection and semi-quantitative analysis of naphthenic acids in coal and gangue from mining areas in China
- Comparative effects of olivine and sand on KOH-treated clayey soil
- YOLO-MC: An algorithm for early forest fire recognition based on drone image
- Earthquake building damage classification based on full suite of Sentinel-1 features
- Potential landslide detection and influencing factors analysis in the upper Yellow River based on SBAS-InSAR technology
- Assessing green area changes in Najran City, Saudi Arabia (2013–2022) using hybrid deep learning techniques
- An advanced approach integrating methods to estimate hydraulic conductivity of different soil types supported by a machine learning model
- Hybrid methods for land use and land cover classification using remote sensing and combined spectral feature extraction: A case study of Najran City, KSA
- Streamlining digital elevation model construction from historical aerial photographs: The impact of reference elevation data on spatial accuracy
- Analysis of urban expansion patterns in the Yangtze River Delta based on the fusion impervious surfaces dataset
- A metaverse-based visual analysis approach for 3D reservoir models
- Late Quaternary record of 100 ka depositional cycles on the Larache shelf (NW Morocco)
- Integrated well-seismic analysis of sedimentary facies distribution: A case study from the Mesoproterozoic, Ordos Basin, China
- Study on the spatial equilibrium of cultural and tourism resources in Macao, China
- Urban road surface condition detecting and integrating based on the mobile sensing framework with multi-modal sensors
- Application of improved sine cosine algorithm with chaotic mapping and novel updating methods for joint inversion of resistivity and surface wave data
- The synergistic use of AHP and GIS to assess factors driving forest fire potential in a peat swamp forest in Thailand
- Dynamic response analysis and comprehensive evaluation of cement-improved aeolian sand roadbed
- Rock control on evolution of Khorat Cuesta, Khorat UNESCO Geopark, Northeastern Thailand
- Gradient response mechanism of carbon storage: Spatiotemporal analysis of economic-ecological dimensions based on hybrid machine learning
- Comparison of several seismic active earth pressure calculation methods for retaining structures
- Mantle dynamics and petrogenesis of Gomer basalts in the Northwestern Ethiopia: A geochemical perspective
- Study on ground deformation monitoring in Xiong’an New Area from 2021 to 2023 based on DS-InSAR
- Paleoenvironmental characteristics of continental shale and its significance to organic matter enrichment: Taking the fifth member of Xujiahe Formation in Tianfu area of Sichuan Basin as an example
- Equipping the integral approach with generalized least squares to reconstruct relict channel profile and its usage in the Shanxi Rift, northern China
- InSAR-driven landslide hazard assessment along highways in hilly regions: A case-based validation approach
- Attribution analysis of multi-temporal scale surface streamflow changes in the Ganjiang River based on a multi-temporal Budyko framework
- Maps analysis of Najran City, Saudi Arabia to enhance agricultural development using hybrid system of ANN and multi-CNN models
- Hybrid deep learning with a random forest system for sustainable agricultural land cover classification using DEM in Najran, Saudi Arabia
- Long-term evolution patterns of groundwater depth and lagged response to precipitation in a complex aquifer system: Insights from Huaibei Region, China
- Remote sensing and machine learning for lithology and mineral detection in NW, Pakistan
- Spatial–temporal variations of NO2 pollution in Shandong Province based on Sentinel-5P satellite data and influencing factors
- Numerical modeling of geothermal energy piles with sensitivity and parameter variation analysis of a case study
- Stability analysis of valley-type upstream tailings dams using a 3D model
- Variation characteristics and attribution analysis of actual evaporation at monthly time scale from 1982 to 2019 in Jialing River Basin, China
- Investigating machine learning and statistical approaches for landslide susceptibility mapping in Minfeng County, Xinjiang
- Investigating spatiotemporal patterns for comprehensive accessibility of service facilities by location-based service data in Nanjing (2016–2022)
- A pre-treatment method for particle size analysis of fine-grained sedimentary rocks, Bohai Bay Basin, China
- Study on the formation mechanism of the hard-shell layer of liquefied silty soil
- Comprehensive analysis of agricultural CEE: Efficiency assessment, mechanism identification, and policy response – A case study of Anhui Province
- Simulation study on the damage and failure mechanism of the surrounding rock in sanded dolomite tunnels
- Towards carbon neutrality: Spatiotemporal evolution and key influences on agricultural ecological efficiency in Northwest China
- High-frequency cycles drive the cyclical enrichment of oil in porous carbonate reservoirs: A case study of the Khasib Formation in E Oilfield, Mesopotamian Basin, Iraq
- Reconstruction of digital core models of granular rocks using mathematical morphology
- Spatial–temporal differentiation law of habitat quality and its driving mechanism in the typical plateau areas of the Loess Plateau in the recent 30 years
- A machine-learning-based approach to predict potential oil sites: Conceptual framework and experimental evaluation
- Effects of landscape pattern change on waterbird diversity in Xianghai Nature Reserve
- Research on intelligent classification method of highway tunnel surrounding rock classification based on parameters while drilling
- River morphology and tectono-sedimentary analysis of a shallow river delta: A case study of Putaohua oil layer in Saertu oilfield (L. Cretaceous), China
- Review Articles
- Humic substances influence on the distribution of dissolved iron in seawater: A review of electrochemical methods and other techniques
- Applications of physics-informed neural networks in geosciences: From basic seismology to comprehensive environmental studies
- Ore-controlling structures of granite-related uranium deposits in South China: A review
- Shallow geological structure features in Balikpapan Bay East Kalimantan Province – Indonesia
- A review on the tectonic affinity of microcontinents and evolution of the Proto-Tethys Ocean in Northeastern Tibet
- Advancements in machine learning applications for mineral prospecting and geophysical inversion: A review
- Special Issue: Natural Resources and Environmental Risks: Towards a Sustainable Future - Part II
- Depopulation in the Visok micro-region: Toward demographic and economic revitalization
- Special Issue: Geospatial and Environmental Dynamics - Part II
- Advancing urban sustainability: Applying GIS technologies to assess SDG indicators – a case study of Podgorica (Montenegro)
- Spatiotemporal and trend analysis of common cancers in men in Central Serbia (1999–2021)
- Minerals for the green agenda, implications, stalemates, and alternatives
- Spatiotemporal water quality analysis of Vrana Lake, Croatia
- Functional transformation of settlements in coal exploitation zones: A case study of the municipality of Stanari in Republic of Srpska (Bosnia and Herzegovina)
- Hypertension in AP Vojvodina (Northern Serbia): A spatio-temporal analysis of patients at the Institute for Cardiovascular Diseases of Vojvodina
- Regional patterns in cause-specific mortality in Montenegro, 1991–2019
- Spatio-temporal analysis of flood events using GIS and remote sensing-based approach in the Ukrina River Basin, Bosnia and Herzegovina
- Flash flood susceptibility mapping using LiDAR-Derived DEM and machine learning algorithms: Ljuboviđa case study, Serbia
- Geocultural heritage as a basis for geotourism development: Banjska Monastery, Zvečan (Serbia)
- Assessment of groundwater potential zones using GIS and AHP techniques – A case study of the zone of influence of Kolubara Mining Basin
- Impact of the agri-geographical transformation of rural settlements on the geospatial dynamics of soil erosion intensity in municipalities of Central Serbia
- Where faith meets geomorphology: The cultural and religious significance of geodiversity explored through geospatial technologies
- Applications of local climate zone classification in European cities: A review of in situ and mobile monitoring methods in urban climate studies
- Complex multivariate water quality impact assessment on Krivaja River
- Ionization hotspots near waterfalls in Eastern Serbia’s Stara Planina Mountain
- Shift in landscape use strategies during the transition from the Bronze age to Iron age in Northwest Serbia
- Assessing the geotourism potential of glacial lakes in Plav, Montenegro: A multi-criteria assessment by using the M-GAM model
- Flash flood potential index at national scale: Susceptibility assessment within catchments
- SWAT modelling and MCDM for spatial valuation in small hydropower planning
- Disaster risk perception and local resilience near the “Duboko” landfill: Challenges of governance, management, trust, and environmental communication in Serbia