
Study on the formation mechanism of the hard-shell layer of liquefied silty soil
-
Yan-zhao Yuan
 ,
Guo-qiang Yu
,
Yan-jun Shen
,
Guo-qiang Yu
,
Yan-jun Shen

Abstract
Hard-shell layers often form during the migration and segregation of fine-grained sediments and play a critical role in influencing the mechanical behavior of seabed soils, with implications for marine geological hazards. Understanding the mechanisms that govern the formation and evolution of these layers is therefore essential for coastal and estuarine geotechnical engineering. In this study, laboratory experiments were conducted to investigate the formation mechanisms of hard-shell layers in saturated silty soils subjected to two types of controlled physical disturbances: vertical hammering and horizontal rotating wheel-induced shear. Using high-speed particle image velocimetry, pore pressure sensors, and earth pressure measurements, the study analyzed the coupled evolution of the force field, particle migration field, and liquefaction behavior under different disturbance modes. Results show that liquefaction is a prerequisite for hard-shell layer formation, allowing fine particles to migrate upward while coarse particles settle, leading to effective particle separation. Hammering produced high pore pressure and strong vertical particle mobility, resulting in a thin but dense hard-shell layer with high strength. In contrast, the rotating wheel disturbance generated moderate liquefaction and vortex-driven particle segregation, forming a thicker hard-shell layer with relatively lower mechanical strength. The findings highlight a trade-off between shell thickness and strength depending on the disturbance type and suggest that the mechanism of fine–coarse particle separation under liquefaction conditions is key to shell formation. This research provides a theoretical and experimental basis for understanding internal liquefaction processes in silty coastal slopes, particularly under the influence of waves or seismic activity following landslides.
1 Introduction
The shallow marine strata along silty shores are primarily composed of fine-grained silt and clay particles with small particle sizes and narrow grading distributions [1]. In coastal zones, extensive land reclamation projects have utilized locally dredged seabed silt as fill material [2–4]. However, due to the high clay content that remains suspended during the hydraulic fill process, the resulting sediment layer often exhibits a prolonged consolidation period, low shear strength, and poor stability [5]. Furthermore, the mechanical behavior of silty soils is highly sensitive to cyclic loading conditions, such as those induced by waves and tides). Studies have shown that fine-grained content, particularly clay, significantly influences the pore water pressure response and shear strength degradation under dynamic excitation [6,7].
According to classical soil mechanics and liquefaction theory, cyclic loading in saturated loose granular soils can lead to the build-up of excess pore water pressure and a corresponding loss of effective stress, ultimately resulting in a liquefied state. This phenomenon is particularly pronounced in silty soils due to their dual characteristics: low permeability impedes pore pressure dissipation, while low plasticity limits structural resistance. During liquefaction, suspended clay particles migrate under the influence of seepage forces and buoyancy, facilitating internal segregation and the formation of preferential flow channels within the soil skeleton [8]. Upon cessation of loading, pore pressure gradually dissipates, and the soil structure undergoes thixotropic recovery, sometimes leading to the formation of denser, more stable layers within the previously liquefied stratum [9–11]. These densified layers can potentially serve as natural or engineered rigid crusts if properly controlled.
However, existing studies lack a mechanistic understanding of how artificial liquefaction can be harnessed to reliably form high-strength shell layers within soft silt foundations, especially under coupled wave and vibration disturbances. While quantitative research has explored artificial liquefaction [12], its engineering application for in situ soil improvement remains unclear due to insufficient theoretical integration and limited laboratory validation.
This study aims to investigate whether artificial disturbance – induced through vertical vibration and horizontal rolling – can accelerate the formation of a dense, rigid silt layer and enhance the strength and permeability of liquefied sediments.
Two primary liquefaction mechanisms are considered: (1) vertical vibration-induced liquefaction simulating seismic activity and (2) horizontal cyclic shear induced by wave motion [13,14]. In the vertical vibration scenario, variables such as clay content, dry density, consolidation stress, and dynamic stress ratio influence the cyclic liquefaction resistance of the soil [2,6,7]. Meanwhile, in wave-induced liquefaction, flume experiments reveal that repeated shear from wave forces can redistribute particles, increasing density and reducing pore volumes [15]. Both types of disturbances are rooted in fundamental principles of cyclic mobility and stress path theory in saturated soils, emphasizing the role of drainage conditions, grain-size distribution, and fabric structure.
To explore the interaction between these mechanisms, this study employs high-speed particle image velocimetry (PIV) in conjunction with pore pressure and earth pressure sensors, enabling detailed observation of particle migration and pressure response. A 1.2 m water tank simulates controlled disturbance environments to test both isolated and combined liquefaction modes. This setup allows real-time tracking of the transformation from loose to dense soil structures, shedding light on the post-liquefaction densification process and the potential formation of rigid strata under cyclic wave loading.
By elucidating the interplay between artificial liquefaction, pore pressure dissipation, and soil structure adjustment, this research aims to provide a novel soil improvement method for estuarine and coastal engineering projects. The findings offer a theoretical and practical basis for reducing the consolidation time, increasing permeability, and lowering the vacuum preloading cost in soft silt foundations. Furthermore, the study may enhance our understanding of post-landslide liquefaction dynamics in silty slopes adjacent to coastlines subjected to seismic or wave disturbances.
2 Materials and methods
2.1 Soil materials
The soil materials in this experiment were silty soil samples from the Yellow River Delta region. The measurement showed a water content of about 30%, with a d 50 of 0.038 mm. The grading ratio is shown in Figure 1.
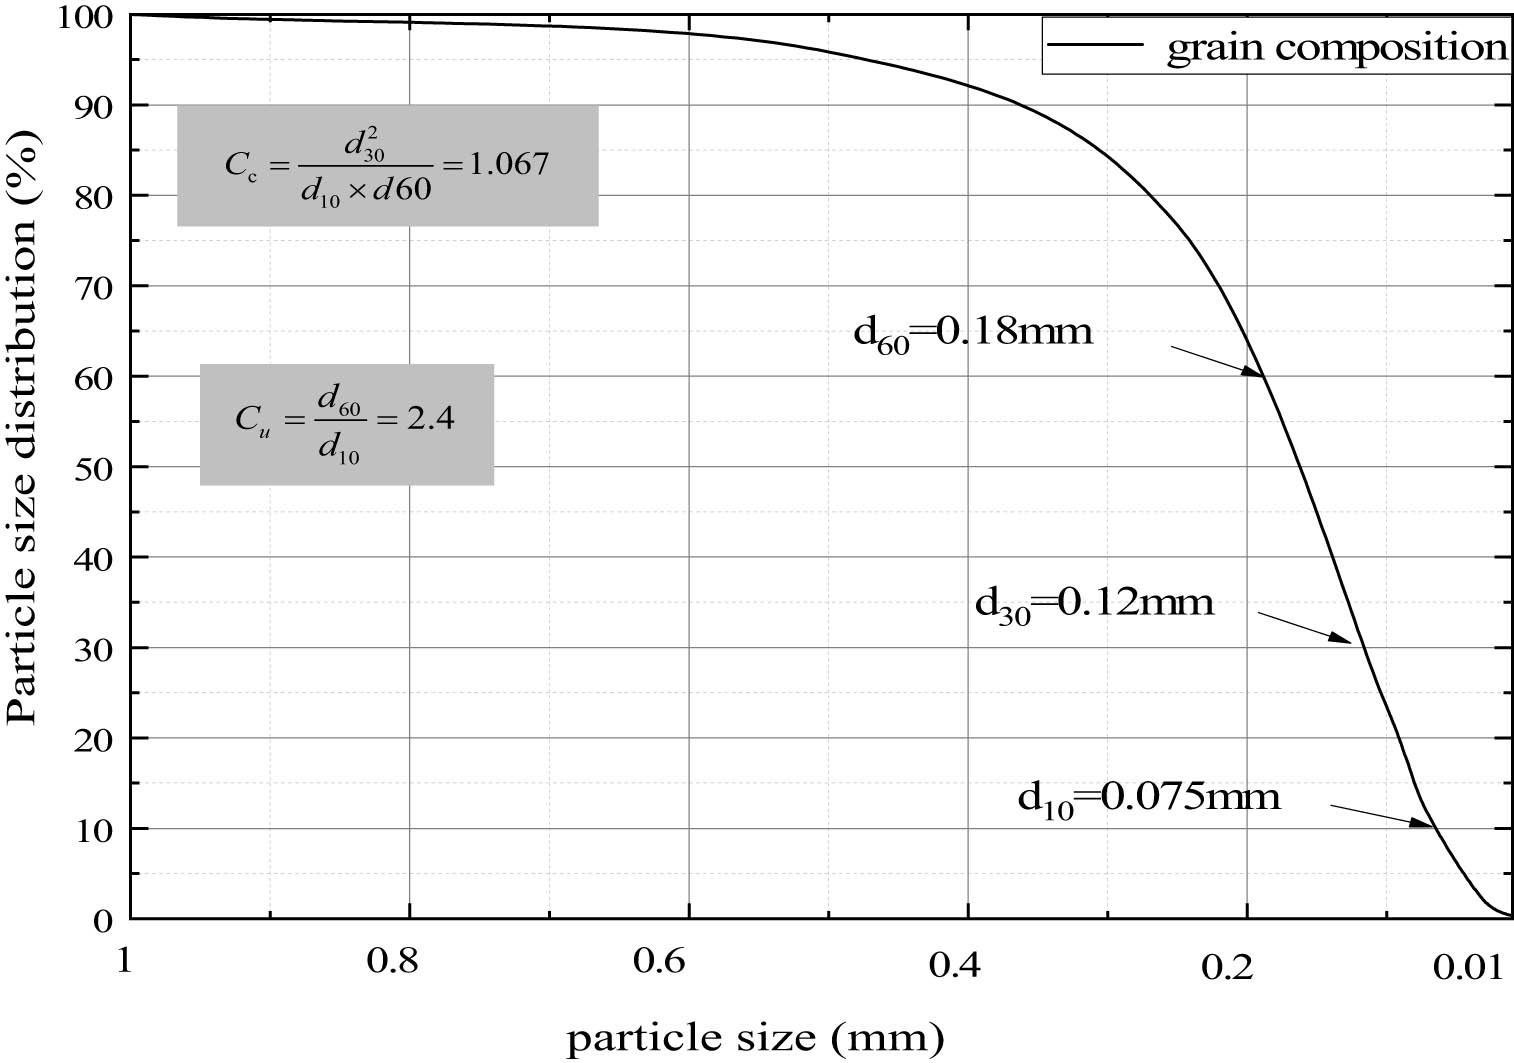
Initial grading.
2.2 PIV flume experiment
2.2.1 PIV test procedure
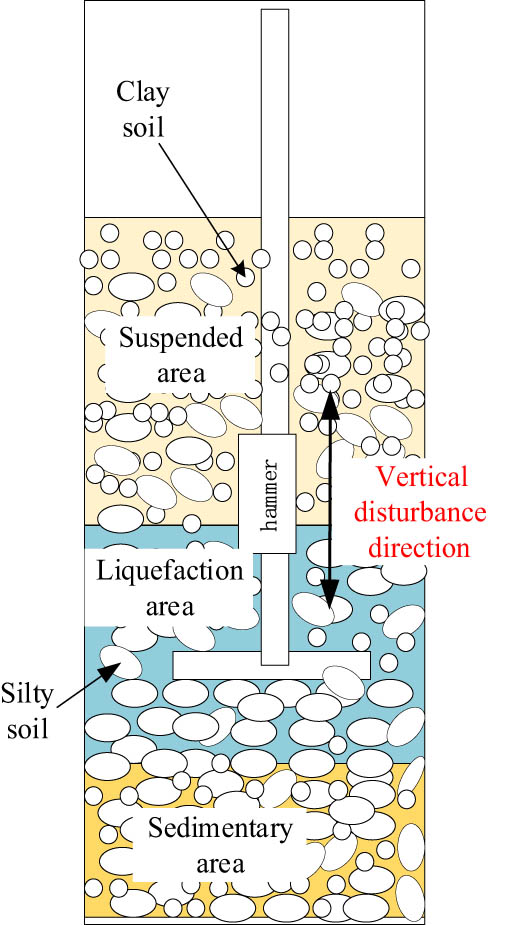
The PIV flume experiment was conducted to assess the force field and flow field structure of the liquefied soil, as illustrated in Figure 2. The silty soil layer deposited in a 0.6 m × 0.6 m × 0.6 m flume was disturbed by a 79 g hammer body (hammer height of 20 cm) and a submerged motor with a 10 mm diameter rotating wheel (20 rpm). Mechanical indices related to soil hydration were measured using vertical and horizontal pore pressure sensors and soil pressure sensors embedded at the bottom and right center of the flume. Additionally, PIV technology was applied to measure the two-dimensional flow field.

Schematic diagram of the PIV flume experiment.
The light source for the experiment was an intense light unit with a power of 500 W, located 1 m in front of the flume. Fine sandstones were used as tracer particles. The CCD camera was located 0.5 m from the observation surface of the flume and has a resolution of 1,600 × 1,200 pixels and a frame rate of 16 fps. The test area of 30 cm × 25 cm was in the middle of the flume.
The migration velocity of the tracer particles was determined by comparing two photos before and after each frame using TSI-Insight3G PIV post-processing software. Particles with the same velocity were connected to form the velocity gradient. The detailed interference pattern is displayed in Figure 2. After adding soil and leaving it for 12 h, the sedimentary strata were hammered at 10 times/min and 10 rpm for the PIV hammer test and the PIV disturbance experiment, respectively.
2.2.2 Detailed implementation of PIV post-processing and data extraction
The post-processing of PIV data was conducted using PIVlab (version X.X), a MATLAB-based open-source software for 2D PIV analysis. A multi-pass fast Fourier transform cross-correlation algorithm was used to calculate the displacement fields between consecutive image pairs.
2.2.2.1 Image preprocessing and correlation analysis
To enhance image contrast and minimize noise, histogram equalization and Gaussian filtering were applied prior to correlation analysis. The PIV processing followed a three-step iterative scheme with decreasing interrogation window sizes (64 × 64 → 32 × 32 → 16 × 16 pixels) and 50% overlap. The displacement vector
where
Sub-pixel accuracy was achieved using Gaussian peak fitting around the cross-correlation maximum. Outlier vectors were filtered using the normalized median test.
2.2.2.2 Displacement-to-strain field transformation
The displacement fields were converted to strain fields using finite difference approximations. The normal and shear strain components were computed as follows:
normal strains
shear strain:
The derivatives were estimated using a central difference scheme on a uniform grid.
2.2.2.3 Principal strain analysis
From the computed strain tensor, the principal strains
This allows the identification of zones of maximum extension and compression, which are critical for understanding crack initiation and propagation.
2.2.2.4 Data extraction and visualization
For each loading increment, the displacement and strain fields were exported as matrices from PIVlab. The evolution of deformation was tracked by extracting:
maximum principal strain values at each frame,
displacement profiles along specific lines of interest (e.g., specimen mid-height),
time-dependent strain localization zones, and
crack-tip propagation paths using strain threshold (typically where
These datasets were further processed using MATLAB scripts to generate contour maps, vector fields, and strain evolution plots, enabling quantitative comparison between different loading stages.
2.3 Comparison test of the 1.2 m high flume
Due to the small size of the PIV test flume, it was impossible to obtain enough samples to comprehensively analyze the distribution of soil particles and changes in physical properties after the disturbance. Therefore, a separation experiment was conducted in a 1.2 m high flume, as shown in Figure 3. According to the PIV test, the disturbed area was only 5 cm × 5 cm. Since the disturbance range of the soil was five times the diameter of the disturbance wheel, a 50 cm diameter disturbance wheel was used in the 1.2 m high flume. The flume was divided into four experimental compartments with clapboards (Warehouse 1, Warehouse 2, Warehouse 3, and Warehouse 4), each measuring 0.5 m × 0.5 m × 1.2 m.
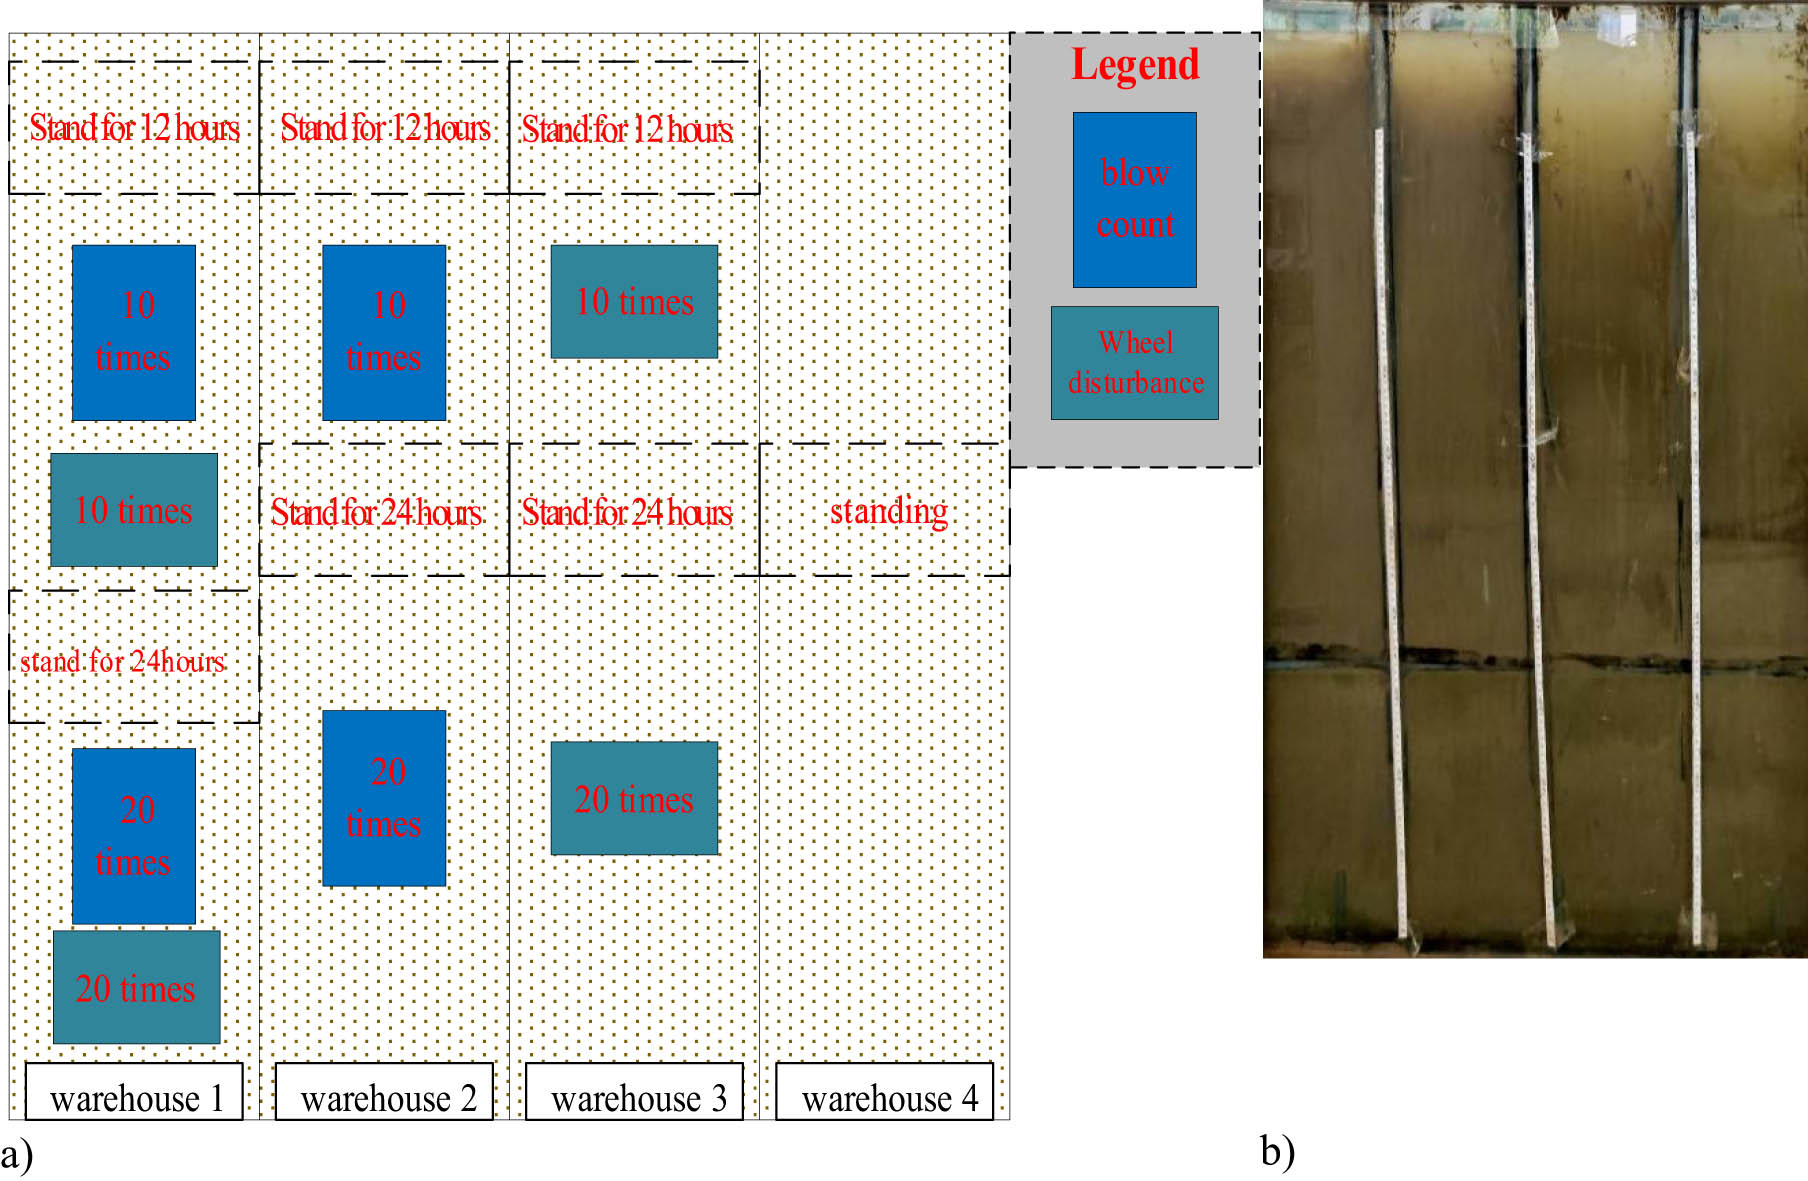
Schematic diagram of the 1.2 m flume disturbance scheme: (a) schematic diagram of the flume and (b) flume for indoor flume experiments.
In Warehouse 1, the stratum was hammered and rolled 10 times 12 h after soil addition and continuously disturbed with 20 hammer strikes and 20 rolls 24 h after soil addition. In Warehouse 2, the stratum was hammered 10 times and 20 times 12 and 24 h after soil addition, respectively. In Warehouse 3, the stratum was rolled 10 times and 20 times 10 and 24 h after soil addition, respectively. Warehouse 4 was used for static observation.
During the flume experiment, a 10 kg disturbance hammer and a 10 cm diameter grid wheel were used. The disturbance modes were joint disturbance for Warehouse 1 (hammer and wheel), hammer-promoted settlement for Warehouse 2, wheel-promoted settlement for Warehouse 3, and static state for Warehouse 4. The specific disturbance schemes are illustrated in Figure 3.
The bearing capacity of the foundation at different layers was measured at 24 and 48 h of soil settlement after the disturbance treatment. Soil samples were collected at the formation of the hard-shell layer and tested for physical parameter indices, real-time bearing capacity, and rheological property indices.
Figure 3 presents the schematic and physical setup of the 1.2 m flume used in indoor disturbance experiments. Subfigure (a) illustrates the layout and zoning of the flume system, including key dimensions and disturbance areas. Subfigure (b) shows the actual flume used in testing, designed to simulate field-like disturbance conditions. This figure provides essential context for understanding the controlled experimental environment and ensures that readers can interpret the test conditions and setup independently from the main text, thereby enhancing scientific clarity and rigor.
3 Analysis of experimental results
Through physical disturbance tests on remolded silty soil samples extracted from the Yellow River Delta, flow field structures associated with specific disturbance modes were revealed. These disturbances significantly increase the pore water pressure within the soil samples, creating a cascade of dynamic changes. Data were obtained through sensors in the experimental setup. Sensors positioned at the base of the samples recorded the interaction between the bottom soil pressure (P bottom) and the corresponding bottom pore water pressure (u bottom). Meanwhile, sensors on the lateral walls recorded the lateral soil pressure (P side) and its associated lateral pore water pressure (u side). These findings are consistent with existing studies that the pore water pressure in silty soil increases with the effect of dynamic loading. In turn, effective stress gradually decreases until a critical point is reached, leading to liquefaction of the soil samples. Notably, the horizontal pore water pressure consistently exceeds the vertical pore water pressure in the experiments. Additionally, the vertical soil pressure is consistently lower than the corresponding vertical pore soil pressure. These differences demonstrate the interactions between saturation, hydration, and structural response within the soil samples. In summary, the behavior of remolded silty soil under dynamic loads obtained through tests and analysis elucidates the interactions between pore water pressure, effective stress, and the onset of soil liquefaction, facilitating the understanding of soil mechanics in response to various disturbance regimes.
3.1 Analysis of interference force field
The effective soil pressure P and the pore water pressure u show a certain periodicity with the dynamic load during the PIV flume disturbance. Therefore, the bottom soil pressure P bottom, side soil pressure P side, bottom pore water pressure u bottom, and side pore water pressure u side were evaluated under hammering and wheel conditions. In this study, the liquefaction disturbance of mixed silty soil was recorded, and the force field changes of the liquefaction disturbance of silty soils were measured step-by-step using a pore pressure sensor and a soil pressure sensor.
In this study, the occurrence of liquefaction was identified through a combined analysis of pore pressure ratio and visible deformation patterns obtained via PIV [16]. The key indicator for pore pressure was the excess pore pressure ratio, defined as
where u is the excess pore water pressure
To complement the pore pressure analysis, PIV was used to observe deformation patterns such as sudden lateral spreading, flow-type displacements, or settlement acceleration. Specifically, we identified the onset of liquefaction when
Simultaneously, PIV revealed a rapid increase in displacement rate and a loss of inter-particle constraint (e.g., sliding or shearing bands with strain concentration >5%).
The synchronization of both indicators ensures that transient pore pressure spikes without corresponding deformation were not misclassified as liquefaction. This dual-criteria approach enhances the robustness of liquefaction detection under complex boundary conditions.
Figure 4 displays sensor-recorded responses of soil and pore water pressure under two different disturbance conditions: hammer and rotating wheel. Subfigures (a) and (b) show the variation in soil pressure, while (c) and (d) illustrate changes in pore water pressure. The data indicate that rotating wheel disturbance produces more gradual and sustained pressure responses, suggesting deeper particle rearrangement and pore water dissipation. These results are critical for understanding the mechanical behavior of silty soil under physical disturbance. The figure captions provide standalone interpretability to support scientific rigor.

Sensor records under different disturbance conditions: (a) changes in soil pressure under the hammer condition, (b) changes in soil pressure under the rotating wheel condition, (c) changes in pore water pressure under the hammer condition, and (d) changes in pore water pressure under the rotating wheel condition.
According to the soil pressure sensor data, P shows a progressive increase at the initial hammering stage. The soil pressure also gradually increases with hammering at this stage due to dense particles. The pore water pressure u increases rapidly under the hammer condition with an increase rate of 100%. In particular, the lateral pore water pressure increases slowly from the initial stage to the late stage. When P reaches about 80%, the particle pores are squeezed to the limit at two hammering per minute, leading to a significant increase in u. The u side and P side are most significantly affected by hammering. After a certain accumulation of the hammering energy, the u increases rapidly, indicating soil liquefaction. As shown in Figure 4a and c, the abrupt change in u occurs earlier than the abrupt change in P. This phenomenon indicates that the dissipation direction of pore water pressure in the silty soil layer is vertically upward under hammer action. The intense pore water pressure causes dramatic fluctuations in soil pressure, making particles susceptible to re-suspension. Furthermore, concentrated and rapidly increasing pore pressure can lead to the rupture of the soil skeleton, followed by the re-suspension and re-deposition of coarse and fine particles.
The disturbance data of the rotating wheel show that the P side fluctuates significantly with the rotation, with a variation amplitude of 0.8 Pa. Moreover, the influence on the u bottom by the rotating wheel is less due to the thick soil layer, with a float of only 0.1 Pa. According to the soil pressure analysis of the rotating wheel, the increase in the P bottom relative to the P side reaches 450 Pa after disturbance, higher than the increase under the hammer condition. When soil liquefaction occurs, the fluctuations generated by the rotating wheel are mainly in the liquefaction center, and the degree of bottom liquefaction is lower than that of hammer liquefaction. This result indicates that the degree and extent of hammer liquefaction are higher than those of rotating wheel liquefaction. As shown in Figure 4b and d, the significant change in soil pressure occurs earlier than that in pore pressure. This phenomenon suggests that wheel disturbance causes soil liquefaction by gradually increasing the soil pressure, resulting in the weakest fine soil particles vibrating out of the soil skeleton. After liquefaction, coarse soil particles are squeezed downward, promoting the upward movement of fine particles and significantly increasing the lateral pore pressure. Fine soil particles are compressed by coarse particles, creating upward pore water flow and migrating upward, further exacerbating the fluctuations in lateral soil pressure.
3.2 Field test and analysis of PIV
The PIV test system was used to analyze the velocity gradient (represented by velocity blocks in different colors) and the migration direction (represented by white arrows) of the particles. According to the analysis of the disturbance liquefaction by PIV, the hammer flow field moves up and down in the initial disturbance stage, while the rotating flow is swirling with most particles in a static state. The silt flow fields before and after liquefaction were recorded in conjunction with force field experiments.
Figures 5 and 6 present the PIV-observed flow field evolution of silty soil under two disturbance conditions: hammering and rotating wheel. Each figure captures the flow field at three stages – initial disturbance (a), pre-liquefaction (b), and post-liquefaction (c). Under hammering, the flow field remains localized with limited particle migration, while the rotating wheel generates a more uniform and extensive rearrangement of soil particles. These figures highlight the comparative effectiveness of disturbance types in promoting soil liquefaction and consolidation, with captions designed for standalone interpretation and enhanced scientific clarity.

PIV experiment of the flow field structure under the hammer condition: (a) start hammering, (b) soil layer before liquefaction, and (c) soil layer after liquefaction.

PIV experiment of the flow field structure under the rotating wheel condition: (a) start hammering, (b) soil layer before liquefaction, and (c) soil layer after liquefaction.
A comparative analysis of the PIV-derived flow fields during the initial liquefaction stage (Figures 5 and 6) reveals distinct differences between the hammer-induced and rotating wheel-induced disturbances. Under hammering disturbance, a stratified velocity field develops, with a step-change in velocity between the lower and upper blocks. The lower layer exhibits a higher velocity of approximately 1.9 mm/s, which accelerates the downward migration and deposition of particles. In contrast, the rotating wheel disturbance generates flow primarily in the middle to upper soil layers, producing numerous small-scale vortices. These vortices aggregate into vortex groups, with a maximum observed velocity of approximately 1.5 mm/s, facilitating turbulent mixing and moderate upward suspension of particles.
In the late stage of liquefaction, maximum particle velocity (vₘₐₓ) under hammering increases to 2.2 mm/s, accompanied by high-amplitude particle fluctuations and the formation of clear migration channels throughout the liquefied layer. Particle streamlines show substantial vertical movement, with both upward and downward migration, contributing to secondary suspension and redeposition cycles. Conversely, in the rotating wheel scenario, the particle flow is characterized by projectile migration near the upper disturbance region and the formation of a projectile zone at the lower part of the vortex. Fine particles tend to be carried along the disturbance path, while coarse particles remain near their original positions, leading to enhanced particle separation and stratification.
Quantitative comparisons further support these observations. The hammering disturbance caused a larger increase in pore water pressure (Δu ≈ 15.3 kPa) compared to the rotating wheel disturbance (Δu ≈ 9.7 kPa). Additionally, d 50 measurements after liquefaction indicated a more significant particle rearrangement under the hammering scenario (from 0.028 to 0.033 mm), suggesting downward segregation of coarser particles. In contrast, the rotating wheel test only showed a marginal change in d₅₀ (from 0.028 to 0.030 mm), indicative of a finer-scale redistribution. Estimated shear stress (τ) during hammering reached peak values of 3.2 kPa, compared to 2.1 kPa under wheel rotation.
These findings indicate that hammering results in a higher energy input, promoting more vigorous particle migration and deeper soil reorganization, which may be beneficial for enhancing permeability but could delay structural stabilization due to repeated suspension. In contrast, the rotating wheel produces localized disturbance and efficient particle separation, making it more suitable for controlled soil improvement where selective stratification and strength layering are desired.
3.3 Analysis of grading test results
The classification of soil samples in the late stages of the PIV test under different disturbance conditions is shown in Figure 7. The particles migrate and separate under the action of the hammer and rotating wheel, resulting in the re-migration of bottom particles with the pore water of the liquefied soil. In this experiment, the laser particle size analysis was conducted on the 0.1 m (surface layer), 0.3 m (middle layer), and 0.5 m (bottom layer) soil layers. The surface, middle, and bottom layers were disturbed by the rotating wheel, with median d 50 of 0.12, 0.18, and 0.14 mm, respectively. Under the hammering disturbance, the medians d 50 of the surface layer, middle layer, and bottom layer are 0.14, 0.15, and 0.12 mm, respectively. Compared to the bottom layer, the middle layer shows an increase in d 50 particle size of 0.04 mm, and the surface layer exhibits a decrease in median d 50 of nearly 0.05 mm. The highest clay content appears in the surface layer disturbed by the rotating wheel, accounting for 12% of particles. The fine particles are enriched, and particles in the middle layer gradually become coarser. However, the separation caused by hammering is characterized by a greater concentration of particle sizes. Despite the separation, the Cc values for the surface layer, middle, and bottom layers are 1.142, 1.512, and 1.422, respectively, indicating that the separation caused by hammering is insignificant. The reason is the excessive disturbing force of hammering, leading to the secondary lifting and deposition of particles. The Cc values for the surface, middle, and bottom layers disturbed by the rotating wheel are 2.41, 1.371, and 1.333, respectively. This result suggests that the rotating wheel disturbance exacerbates the destruction of the soil skeleton, with fine particles gradually moving toward the surface due to the settlement of coarse particles and the upward flow induced by the disturbance force. As a result, the particle coarsening effect in the disturbance area is better.

Particle distribution curves of the soil sample.
3.4 Experiment on basic physical properties of the 1.2 m high flume
The model was extended to a 1.2 m-high flume bin, and the deposited stratum in each bin was left for 24 h under different disturbance liquefaction measures. The bearing capacity stratum of the natural sedimentary soil layer is 20 cm from the bottom, as measured by a portable bearing capacity tester. Therefore, the disturbed and hammering surfaces are the strata of this layer. Moreover, the liquefaction of the disturbed stratum was analyzed. The bearing capacity and its position and size were measured at 24 and 48 h after setting the disturbance static and dynamic forces. The initial strength was the reading of the load-bearing capacity tester. After 48 h, the corresponding soils were extracted to analyze the water content and density. Physical indicators were evaluated for the upper soft soil, hard-shell, and lower soft soil layers.
The test results of the water content and density of different layers and the bearing capacity of the hard-shell foundation formed after liquefaction are shown in Figures 8–11. The hard-shell layers of Warehouses 1–4 are 5, 3, 10, and 0 cm, respectively. The initial strength and bearing capacity of the hard-shell layer in Warehouse 2 formed by hammer liquefaction are shown in Figure 8, with a maximum bearing capacity of 3.8 kN. Compared with Warehouse 4, Warehouse 2 failed to develop an initial strength within 12 h due to natural deposition, with an initial strength of only 0.8 at 48 h. In contrast, a thick shell layer is formed under the rotating wheel condition, with a load-bearing strength F of 2.8 kN and a maximum disturbance density ρ of 2.9 g/mm3.

Variation of the water content.

Variation of density.

Development law of bearing capacity.
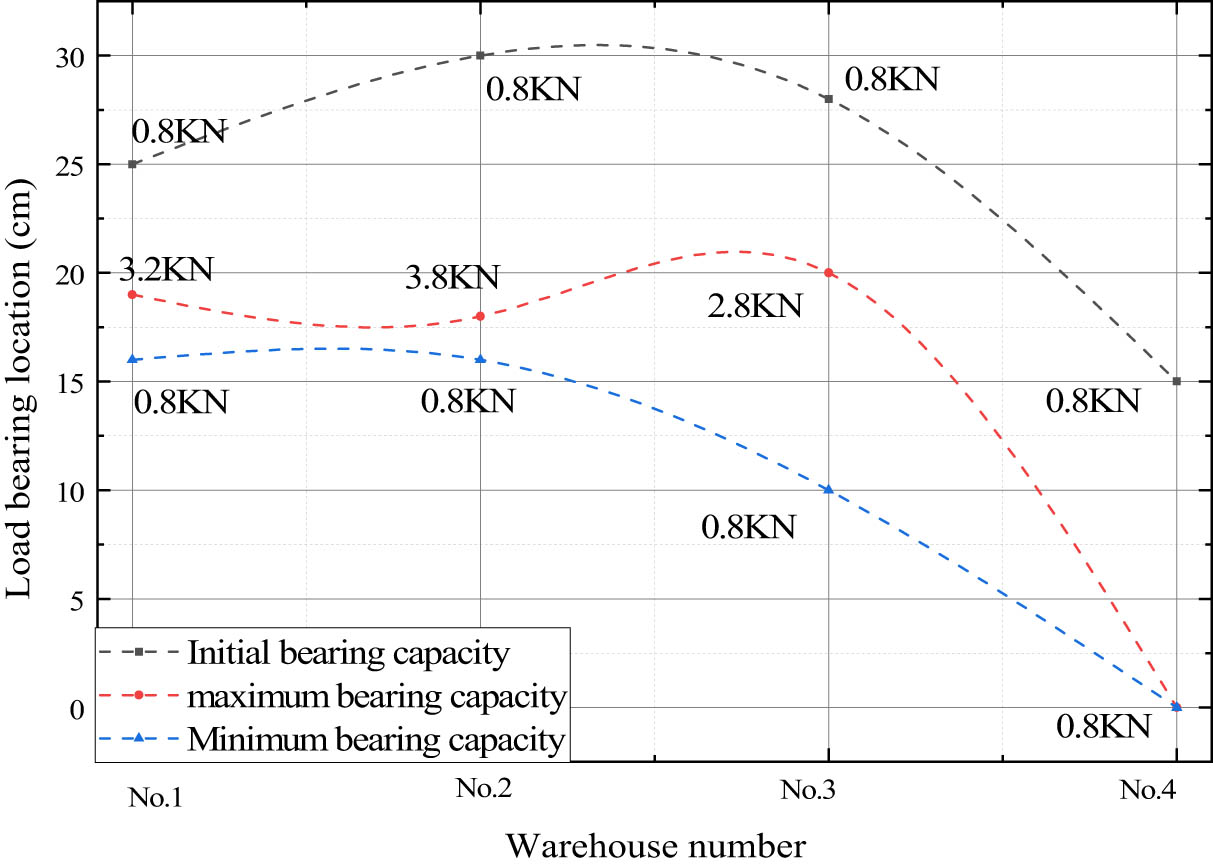
Distribution of bearing capacity.
The above results also indicate that the physical properties of the hard-shell layers formed by different disturbance modes differ significantly. The high strength of the hard-shell layer formed by hammering disturbance is due to the compaction of the strata by hammering. However, its large disturbance area leads to particle re-suspension, resulting in a relatively thin hard-shell layer. In contrast, waves generated by rotation under the rotating wheel disturbance have a limited impact area. Wave disturbance leads to the migration of fine particles and the deposition of coarse particles. Due to the wide range of pore water pressure transmission, the thicker hard-shell layer has a relatively lower water content than the 50 cm surface layer.
3.5 Rheological test analysis
To investigate the rheological behavior of disturbed soil layers, a series of controlled rheological tests were conducted on siphoned samples from the upper, middle, and lower layers of disturbed soil columns. The soil samples were extracted using a siphon device immediately following disturbance events, with minimal handling to preserve the in situ water content and microstructure.
Rheological testing was performed using a rotational rheometer (Model: Anton Paar MCR 302) equipped with a parallel plate measuring system (PP25). The test temperature was maintained at 25 ± 0.5°C. Each soil sample was loaded into the rheometer with a gap setting of 1 mm, and pre-shearing was avoided to maintain the native structure of the disturbed material. The test involved a shear rate sweep from 0.01 to 100 s⁻¹, and both stress-controlled and strain-controlled modes were used to examine the yield stress, apparent viscosity, and viscoelastic deformation behavior.
Figure 12 presents typical stress–strain response curves from the tested soil samples. The analysis shows that the soil from bin 4 exhibited extremely low resistance under shear, indicative of high fluidity and weak inter-particle bonding – resulting in a near-zero recorded shear stress.
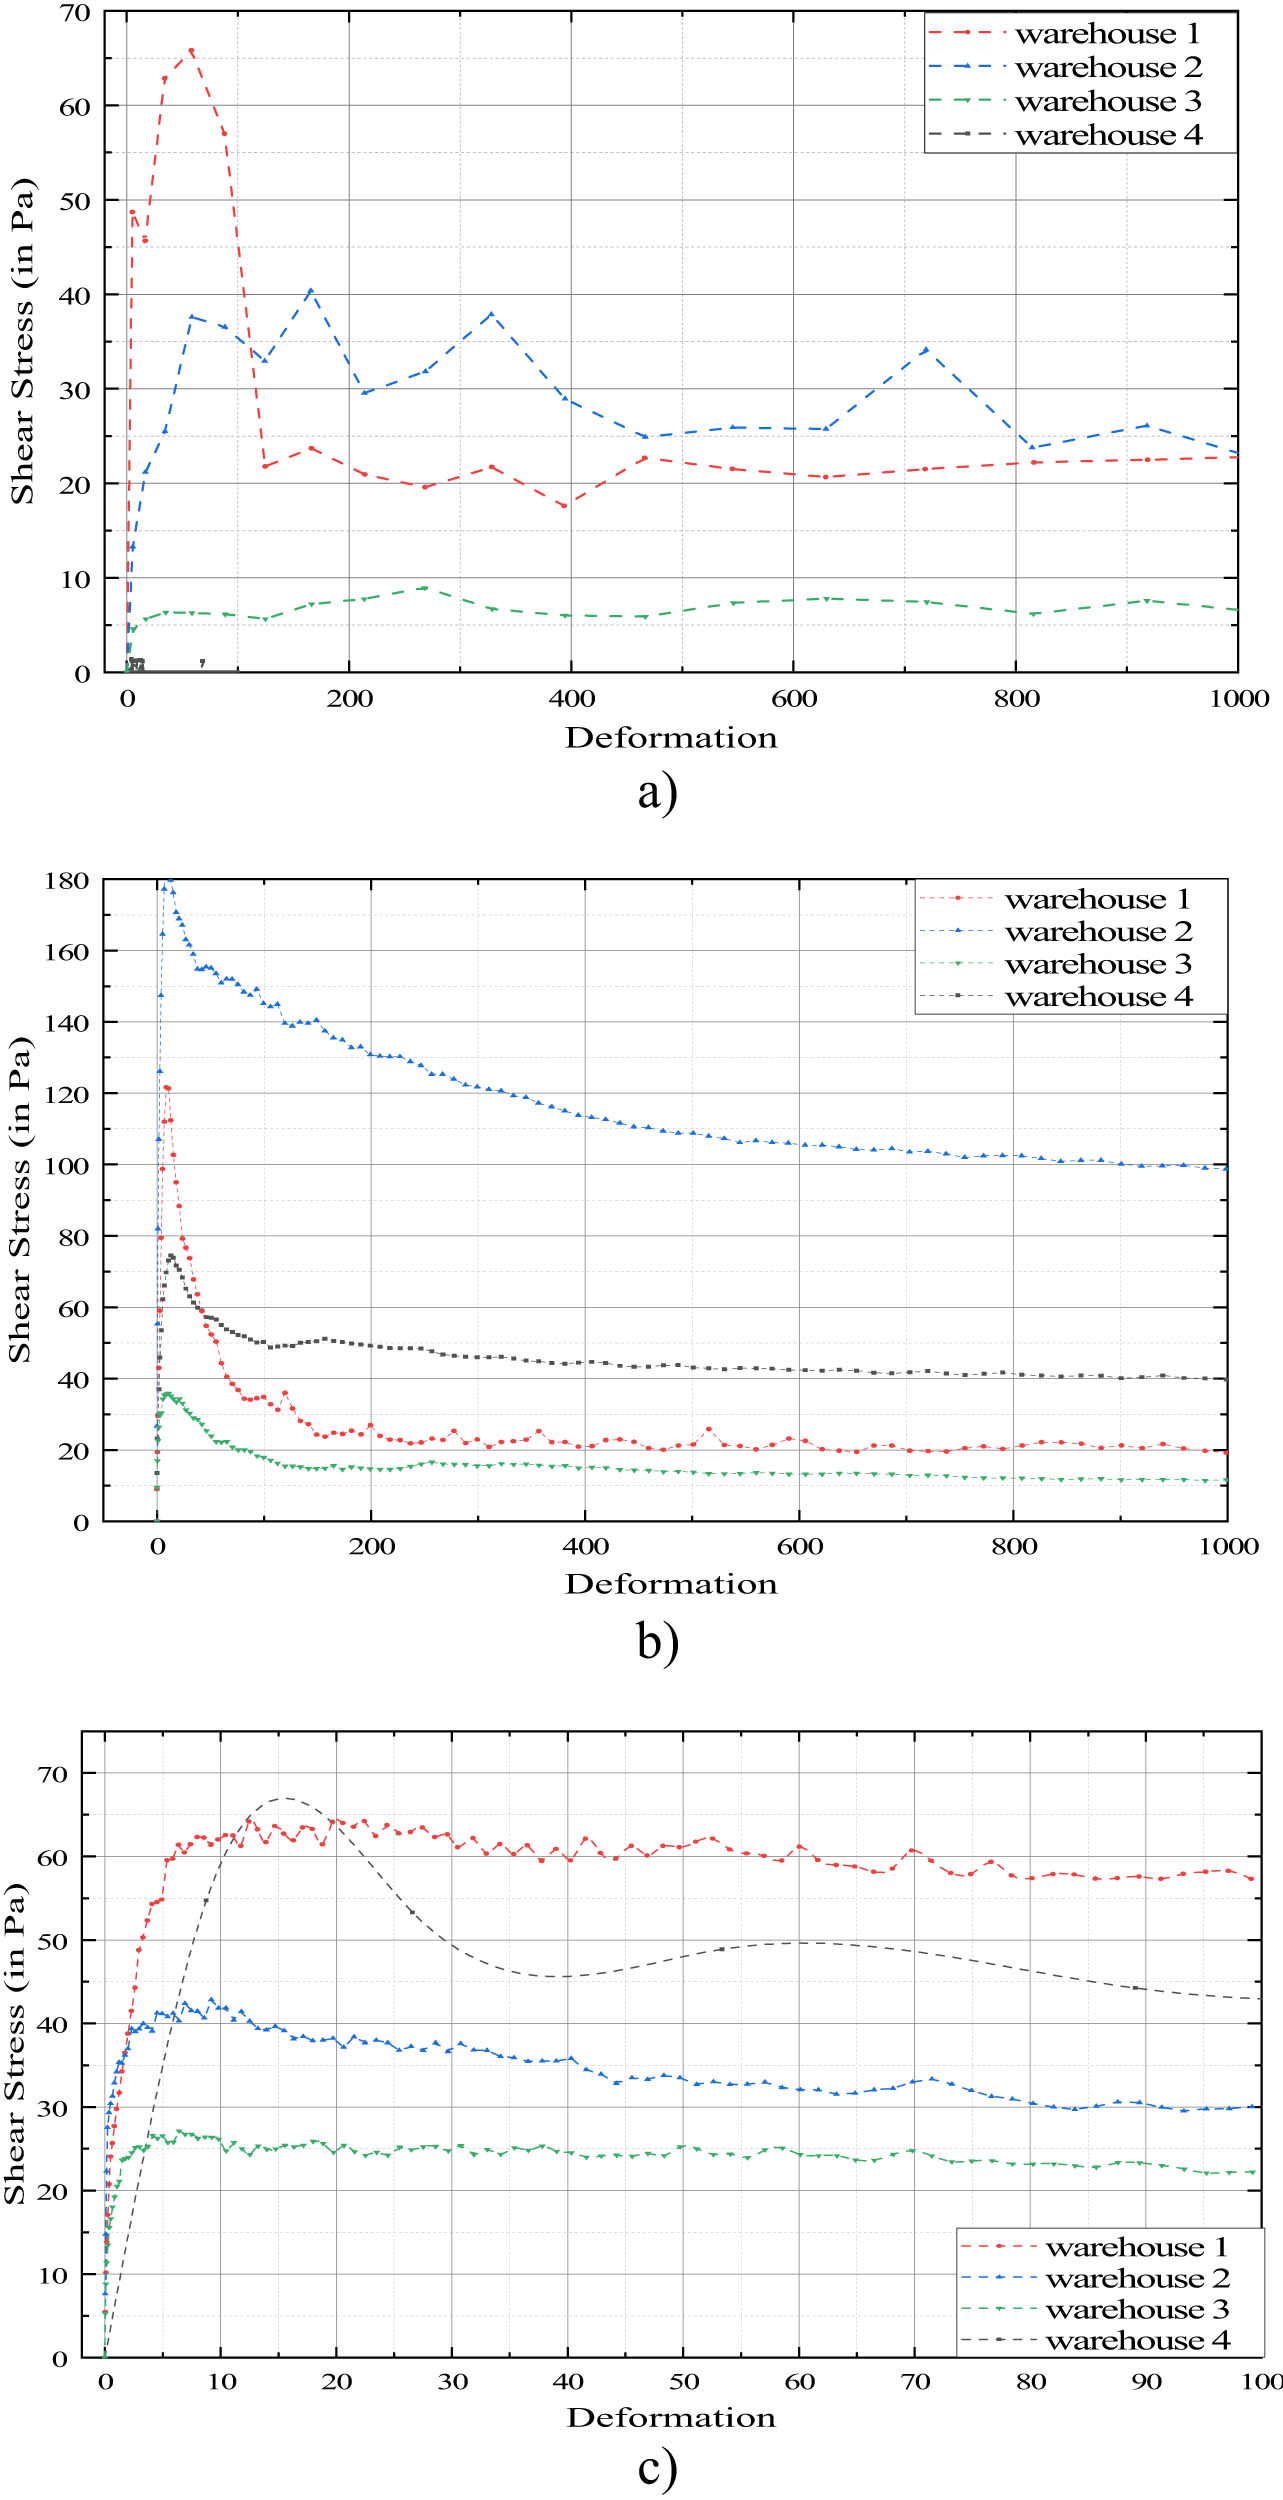
Rheological test results: (a) test results of the topsoil, (b) test results of the middle soil, and (c) test results of the subsoil change.
In the upper soil layer, disturbance led to reorganization and partial agglomeration of fine and coarse particles. The sample subjected to rotating wheel disturbance showed a maximum stress of 70 Pa, whereas hammering led to surface strength values around 10 Pa, significantly lower than that of undisturbed topsoil.
For the middle layer, the rotating wheel-induced hard-shell zone demonstrated the highest peak shear stress (approximately 40–50 Pa) and residual stiffness, indicating that micro-dynamic loading compacted soil particles effectively. In contrast, hammering-induced soil had lower residual strength due to the generation of high excess pore water pressure, which impeded structural reformation during the consolidation phase.
At the bottom layer, the soil beneath the hard-shell exhibited strength similar to that of the upper layer. However, under hammering disturbance, this layer showed approximately 50% higher residual strength than the upper soil, indicating that the higher-energy compaction from hammering led to significant soil densification.
Overall, rheological indices such as yield stress and apparent viscosity confirmed that rotational wheel disturbance led to better-structured hard-shell formation in the middle layer, while hammering caused deeper compaction with stronger underlying soil layers. These findings are consistent with previous cyclic disturbance studies.
For future work, the rheological response of disturbed soils could be further explored using cyclic triaxial compression tests. Their approach offers valuable insight into the accumulation of pore pressure and strain under repetitive dynamic loading and may provide a more comprehensive framework for understanding long-term deformation behavior in disturbed subsoils.
Figure 12 presents the rheological test results of silty soil samples collected from different depths: (a) topsoil, (b) middle soil, and (c) subsoil. The curves reflect the variation in shear stress and viscosity under applied strain, indicating differences in structural strength and consolidation behavior across layers. The topsoil exhibits lower resistance, while deeper layers show higher stiffness and yield strength. These results demonstrate how depth influences the mechanical response of disturbed silty soils. The standardized captions ensure the figure is independently interpretable and aligned with scientific reporting standards.
4 Discussion
To evaluate the effectiveness of different artificial disturbance modes in promoting silty soil liquefaction and the subsequent formation of hard-shell layers, it is essential to ground the discussion in the classical mechanical framework of soil liquefaction [1]. Under cyclic loading, the contact network between saturated silt particles begins to break down. Two key factors – pore water pressure and soil pressure – govern the evolution of inter-particle forces and soil structure [17]. In particular, clay particles play a dual role: they act either as fillers that occupy void spaces or as agents of inter-particle cementation, depending on their location within the soil skeleton and the stage of disturbance.
4.1 Mechanism of hard-shell layer formation
During the initial phase of liquefaction, silt particles are compressed under cyclic stress, and fine clay particles are gradually squeezed into the interstitial spaces of the silt matrix. This transition changes their role from passive fillers to active cementing agents [18,19]. As pore water pressure builds and approaches the effective stress threshold, both silt and clay particles become suspended, losing contact and participating in random particle migration. Once this suspended state is reached, the dissipation of excess pore pressure allows for particle rearrangement, often resulting in a denser and more stable configuration. It is in this post-liquefaction recovery phase that a hard-shell layer – defined as a zone with greater strength than the surrounding undisturbed soil – can emerge due to localized particle densification and new contact reformation.
4.2 Disturbance mode-specific behavior
4.2.1 Hammering disturbance
Experimental data (Figures 13 and 14) show that hammering disturbance rapidly increases both pore water pressure and soil pressure below the impact zone. As the duration of hammering increases, the influence range of the induced flow field expands vertically, driven by upward and rebound forces. This strong upward flow remobilizes previously settled silty particles and promotes the formation of a low-density, high-water-content suspended layer. Upon dissipation of pore pressure, this layer redeposits, and clay particles – now embedded into the lower portion of the soil skeleton – strengthen the lower part of the liquefied layer through cementation.
Schematic diagram of hammering disturbance.

Schematic diagram of rotating wheel disturbance.
However, the middle part of the profile experiences a loss of fine silt particles, leading to the formation of a thin hard-shell layer with relatively high strength due to vertical densification. The upper layer, conversely, remains loosely packed, with mixed clay and silt redeposition, reflecting reduced structural integrity.
4.2.2 Rotating wheel disturbance
Under the cyclic lateral loading caused by the rotating wheel, wave-like forces induce a periodic rise and fall of pore water pressure and lateral soil pressure. The lower soil layers tend to restrict vertical dissipation of pore pressure, which results in localized liquefaction near the rotating zone. In this case, small clay particles migrate upward through weakened inter-particle bonds, moving toward the upper soil layers [20]. As the liquefaction process completes, these particles precipitate into available pore spaces, rearranging the particle skeleton.
The result is a thick upper hard-shell layer that contains a high proportion of clay. However, due to the low density and high water content, this shell exhibits inferior mechanical strength compared to the thinner but denser layer formed under hammering. Meanwhile, the bottom of this hard-shell layer remains relatively unaffected, while the soil immediately beneath the rotating wheel exhibits high density and improved strength, benefitting from cyclic compaction and reduced pore space.
4.3 Comparative mechanistic insight
The comparative mechanisms can be summarized as follows:
Hammering produces deep, vertical particle migration, promoting a denser and thinner hard-shell layer in the middle zone. The short migration path and high-energy input contribute to rapid consolidation and local strength gain.
Rotating wheel induces horizontal, surface-proximal particle migration, leading to a thicker, clay-rich upper layer with lower mechanical strength, but more uniform compaction in the sub-layer.
Thus, while both methods can induce the formation of hard-shell structures, the hammering method is more effective for targeted deep strengthening, whereas the rotating wheel is suitable for broader, surface-level soil improvement.
5 Conclusion
This study investigated the formation mechanism of hard-shell layers in saturated silty soils subjected to two distinct artificial disturbance modes: vertical hammering and rotating wheel-induced cyclic shear. The experiments aimed to simulate post-liquefaction recovery processes relevant to estuarine and coastal environments affected by wave and seismic activity. The key conclusions are as follows.
Hard-shell layer formation is inherently linked to the fluid – plastic transition of saturated silty soils during liquefaction. In this state, vibration and disturbance allow fine clay particles to migrate into the pore spaces among silt grains. These particles act primarily as mechanical fillers rather than cementing agents, resulting in a densely packed soil skeleton dominated by silt. Upon pore pressure dissipation, this structure re-stabilizes into a rigid layer with increased density and shear resistance.
Comparative analysis reveals distinct differences in liquefaction behavior and post-liquefaction structure between hammering and rotating wheel disturbances. Hammering induces a rapid and substantial increase in pore water pressure – doubling initial values – and achieves a high degree of liquefaction. However, the high-energy impact also causes strong particle re-suspension, which may prevent complete precipitation of clay particles. This results in a thin hard-shell layer (∼2 cm) with high compaction in the underlying deposit zone. In contrast, rotating wheel disturbance produces moderate liquefaction but forms more stable vortex flow fields that facilitate selective particle separation. This leads to a thicker hard-shell layer (∼10 cm), albeit with slightly lower strength. Notably, the compression index (Cc) of liquefied soil under wheel disturbance was reduced to 1.33, suggesting improved consolidation behavior.
There is a clear trade-off between shell thickness and mechanical strength. Hammering yields a thin but highly compacted shell with a penetration strength of up to 3.6 N, offering high bearing capacity in localized zones. Meanwhile, rotating wheel disturbance forms a thicker shell that may provide broader coverage but has lower strength due to higher water content and less uniform particle packing. This trade-off suggests that hammering is more suitable for deep reinforcement applications, while rotating wheel methods may be advantageous for improving surface stability over larger areas.
Overall, this study provides mechanistic insight into liquefaction-driven soil reorganization and offers practical guidance for tailoring artificial disturbance methods to achieve targeted subsurface strengthening in coastal silty environments.
Acknowledgments
The financial support is from the National Natural Science Foundation of China (Grant Nos. 41976049, 42177346, U2243240), Henan Provincial Science and Technology Research Project (242102320001), Science and Technology Plan of Housing and Urban-Rural Development in Henan Province (K2312), and General Project of Shaanxi Provincial Key Research and Development Program: (2025SF-YBXM-292). Key scientific research projects in Higher Education Institutions in Henan Province (26B610001); Young Backbone Teachers Training Program of Henan University of Urban Construction (YCJQNGGJS202408); the Fundamental Research Funds for the Central Universities, CHD (300102265501, 300102265501); Open Research Fund Program of Henan Key Laboratory of Engineering Materials and Hydraulic Structures (HNEMHS_OF202403).
-
Author contributions: Yan-zhao Yuan: Conceived and designed the research framework; supervised the entire study process; revised the manuscript critically for important intellectual content; served as a corresponding author. Guo-qiang Yu: Co-designed the research methodology; coordinated data collection and analysis; polished the manuscript language; served as a corresponding author. Yan-jun Shen: Performed the experimental tests; collected and organized primary data; drafted the initial version of the results section. Guo-hui Xu: Analyzed the experimental data using statistical tools; visualized data results (e.g., figures, tables); verified the accuracy of data calculations. Yuzhou Sun: Conducted literature review and summarized relevant research progress; assisted in revising the introduction and discussion sections; checked the consistency of technical terms. Xiangming Zhou: Provided technical support for experimental equipment; participated in the discussion of research results; proofread the final version of the manuscript.
-
Conflict of interest: The authors declare that there are no known competing financial interests or personal relationships that influence the work reported in this article.
-
Data availability statement: The data used to support the findings of this study are included in the article.
References
[1] Jia J, Xu G, Ceng Y, Xu X, Ren Y. Simulation of immediate compaction effect of silty soil filling site. J Ocean Univ China: Nat Sci. 2020;8:252–9. (in Chinese).Suche in Google Scholar
[2] To A, Agd B, Mb C, Davda A. Measurement and prediction of bottom boundary layer hydrodynamics under modulated oscillatory flows. Coast Eng. 2021;169:103954.10.1016/j.coastaleng.2021.103954Suche in Google Scholar
[3] Zeng J, Liu H. Frictional swash hydrodynamics under the improved seaward boundary condition. Coast Eng. 2021;169:103969.10.1016/j.coastaleng.2021.103969Suche in Google Scholar
[4] Park H, Koh MJ, Cox DT, Alam MS, Shin S. Experimental study of debris transport driven by a tsunami-like wave: application for non-uniform density groups and obstacles. Coast Eng. 2021;166:103867.10.1016/j.coastaleng.2021.103867Suche in Google Scholar
[5] Ghadr S, Samadzadeh A, Bahadori H, Assadi-Langroudi A. Liquefaction resistance of fibre-reinforced silty sands under cyclic loading. Geotext Geomembr. 2020;48(6):812–27.10.1016/j.geotexmem.2020.07.002Suche in Google Scholar
[6] Wang G, Xu G, Liu Z, Liu H, Sun Z. Experimental study on changes in physical and mechanical properties of silty soil during wave-induced liquefaction. Mar Geol Quat Geol. 2017;37(165):182–9. (in Chinese).Suche in Google Scholar
[7] Liu C, Shan Y, Sun W, Yan C, Yang K. An open channel with an emergent vegetation patch: predicting the longitudinal profiles of velocities based on exponential decay. J Hydrol. 2019;582(8):124429.10.1016/j.jhydrol.2019.124429Suche in Google Scholar
[8] Hasheminezhad A, Bahadori H. Seismic response of shallow foundations over liquefiable soils improved by deep soil mixing columns. Comput Geotech. 2019;110:251–73.10.1016/j.compgeo.2019.02.019Suche in Google Scholar
[9] Xu C, Liu H, Du X, Yin Z. Application of dynamic geotechnical true triaxial apparatus in sand liquefaction research. Chin J Geotech Eng. 2013;35(10):1895–900. (in Chinese).Suche in Google Scholar
[10] Constantinescu G, Kashyap S, Tokyay T, Rennie CD, Townsend RD. Hydrodynamic processes and sediment erosion mechanisms in an open channel bend of strong curvature with deformed bathymetry. J Geophys Res Earth Surf. 2013;118(2):480–96.10.1002/jgrf.20042Suche in Google Scholar
[11] Patil VA, Liburdy JA. Flow characterization using Piv measurements in a low aspect ratio randomly packed porous bed. Exp Fluids. 2013;54(4):1–19.10.1007/s00348-013-1497-3Suche in Google Scholar
[12] Farzalizadeh R, Hasheminezhad A, Bahadori H. Shaking table tests on wall-type gravel and rubber drains as a liquefaction countermeasure in silty sand. Geotext Geomembr. 2021;49(6):1483–94.10.1016/j.geotexmem.2021.06.002Suche in Google Scholar
[13] Tzang SY, Ou SH, Hsu TW. Laboratory flume studies on monochromatic wave-fine sandy bed interactions part 2. Sediment suspensions. Coast Eng. 2009;53(3):965–82.10.1016/j.coastaleng.2006.06.003Suche in Google Scholar
[14] Xu G, Liu H, Liu J, Yu Y. Mechanism of the effect of clay content on liquefaction of silty soil. Mar Geol Quat Geol. 2012;3:31–5. (in Chinese).10.3724/SP.J.1140.2012.03031Suche in Google Scholar
[15] Sun Z, Liang S, Zhou F, Wang S. Experimental study on turbulence characteristics of vertical jet in wave environment. Chin J Theor Appl Mech. 2009;41(1):21–7. (in Chinese).Suche in Google Scholar
[16] Qi J, Liu S, Qiao L, Xu X, Li J, Li H, et al. Sediment resuspension in the Yellow River Subaqueous Delta during gale events. J Mar Sci Eng. 2025;13:914.10.3390/jmse13050914Suche in Google Scholar
[17] Barka HM, Auchterlonie LJ. The magnus or robins effect on rotating spheres. J Fluid Mech. 1971;47(3):437–47.10.1017/S0022112071001150Suche in Google Scholar
[18] Waldemar M. Wave-induced pore-pressure response on a submarine pipeline buried in seabed sediments – experiment and numerical verification. Reports of the faculty of environmental science and technology. Vol. 3, Okayama University; 1998. p. 75–95Suche in Google Scholar
[19] Dan H, Duan Z, Liu Z, Jia Y. Repeated vibration liquefaction of silty soil and its effect research. J Hydraul Eng. 2006;(1):78–84. (in Chinese).Suche in Google Scholar
[20] Li L, Xia J, Zhou M, Deng S. Calculation of bed sediment gradation adjustment process in sandy reaches of the middle Yangtze River. J Lake Sci. 2020;33(1):277. (in Chinese).Suche in Google Scholar
© 2025 the author(s), published by De Gruyter
This work is licensed under the Creative Commons Attribution 4.0 International License.
Artikel in diesem Heft
- Research Articles
- Seismic response and damage model analysis of rocky slopes with weak interlayers
- Multi-scenario simulation and eco-environmental effect analysis of “Production–Living–Ecological space” based on PLUS model: A case study of Anyang City
- Remote sensing estimation of chlorophyll content in rape leaves in Weibei dryland region of China
- GIS-based frequency ratio and Shannon entropy modeling for landslide susceptibility mapping: A case study in Kundah Taluk, Nilgiris District, India
- Natural gas origin and accumulation of the Changxing–Feixianguan Formation in the Puguang area, China
- Spatial variations of shear-wave velocity anomaly derived from Love wave ambient noise seismic tomography along Lembang Fault (West Java, Indonesia)
- Evaluation of cumulative rainfall and rainfall event–duration threshold based on triggering and non-triggering rainfalls: Northern Thailand case
- Pixel and region-oriented classification of Sentinel-2 imagery to assess LULC dynamics and their climate impact in Nowshera, Pakistan
- The use of radar-optical remote sensing data and geographic information system–analytical hierarchy process–multicriteria decision analysis techniques for revealing groundwater recharge prospective zones in arid-semi arid lands
- Effect of pore throats on the reservoir quality of tight sandstone: A case study of the Yanchang Formation in the Zhidan area, Ordos Basin
- Hydroelectric simulation of the phreatic water response of mining cracked soil based on microbial solidification
- Spatial-temporal evolution of habitat quality in tropical monsoon climate region based on “pattern–process–quality” – a case study of Cambodia
- Early Permian to Middle Triassic Formation petroleum potentials of Sydney Basin, Australia: A geochemical analysis
- Micro-mechanism analysis of Zhongchuan loess liquefaction disaster induced by Jishishan M6.2 earthquake in 2023
- Prediction method of S-wave velocities in tight sandstone reservoirs – a case study of CO2 geological storage area in Ordos Basin
- Ecological restoration in valley area of semiarid region damaged by shallow buried coal seam mining
- Hydrocarbon-generating characteristics of Xujiahe coal-bearing source rocks in the continuous sedimentary environment of the Southwest Sichuan
- Hazard analysis of future surface displacements on active faults based on the recurrence interval of strong earthquakes
- Structural characterization of the Zalm district, West Saudi Arabia, using aeromagnetic data: An approach for gold mineral exploration
- Research on the variation in the Shields curve of silt initiation
- Reuse of agricultural drainage water and wastewater for crop irrigation in southeastern Algeria
- Assessing the effectiveness of utilizing low-cost inertial measurement unit sensors for producing as-built plans
- Analysis of the formation process of a natural fertilizer in the loess area
- Machine learning methods for landslide mapping studies: A comparative study of SVM and RF algorithms in the Oued Aoulai watershed (Morocco)
- Chemical dissolution and the source of salt efflorescence in weathering of sandstone cultural relics
- Molecular simulation of methane adsorption capacity in transitional shale – a case study of Longtan Formation shale in Southern Sichuan Basin, SW China
- Evolution characteristics of extreme maximum temperature events in Central China and adaptation strategies under different future warming scenarios
- Estimating Bowen ratio in local environment based on satellite imagery
- 3D fusion modeling of multi-scale geological structures based on subdivision-NURBS surfaces and stratigraphic sequence formalization
- Comparative analysis of machine learning algorithms in Google Earth Engine for urban land use dynamics in rapidly urbanizing South Asian cities
- Study on the mechanism of plant root influence on soil properties in expansive soil areas
- Simulation of seismic hazard parameters and earthquakes source mechanisms along the Red Sea rift, western Saudi Arabia
- Tectonics vs sedimentation in foredeep basins: A tale from the Oligo-Miocene Monte Falterona Formation (Northern Apennines, Italy)
- Investigation of landslide areas in Tokat-Almus road between Bakımlı-Almus by the PS-InSAR method (Türkiye)
- Predicting coastal variations in non-storm conditions with machine learning
- Cross-dimensional adaptivity research on a 3D earth observation data cube model
- Geochronology and geochemistry of late Paleozoic volcanic rocks in eastern Inner Mongolia and their geological significance
- Spatial and temporal evolution of land use and habitat quality in arid regions – a case of Northwest China
- Ground-penetrating radar imaging of subsurface karst features controlling water leakage across Wadi Namar dam, south Riyadh, Saudi Arabia
- Rayleigh wave dispersion inversion via modified sine cosine algorithm: Application to Hangzhou, China passive surface wave data
- Fractal insights into permeability control by pore structure in tight sandstone reservoirs, Heshui area, Ordos Basin
- Debris flow hazard characteristic and mitigation in Yusitong Gully, Hengduan Mountainous Region
- Research on community characteristics of vegetation restoration in hilly power engineering based on multi temporal remote sensing technology
- Identification of radial drainage networks based on topographic and geometric features
- Trace elements and melt inclusion in zircon within the Qunji porphyry Cu deposit: Application to the metallogenic potential of the reduced magma-hydrothermal system
- Pore, fracture characteristics and diagenetic evolution of medium-maturity marine shales from the Silurian Longmaxi Formation, NE Sichuan Basin, China
- Study of the earthquakes source parameters, site response, and path attenuation using P and S-waves spectral inversion, Aswan region, south Egypt
- Source of contamination and assessment of potential health risks of potentially toxic metal(loid)s in agricultural soil from Al Lith, Saudi Arabia
- Regional spatiotemporal evolution and influencing factors of rural construction areas in the Nanxi River Basin via GIS
- An efficient network for object detection in scale-imbalanced remote sensing images
- Effect of microscopic pore–throat structure heterogeneity on waterflooding seepage characteristics of tight sandstone reservoirs
- Environmental health risk assessment of Zn, Cd, Pb, Fe, and Co in coastal sediments of the southeastern Gulf of Aqaba
- A modified Hoek–Brown model considering softening effects and its applications
- Evaluation of engineering properties of soil for sustainable urban development
- The spatio-temporal characteristics and influencing factors of sustainable development in China’s provincial areas
- Application of a mixed additive and multiplicative random error model to generate DTM products from LiDAR data
- Gold vein mineralogy and oxygen isotopes of Wadi Abu Khusheiba, Jordan
- Prediction of surface deformation time series in closed mines based on LSTM and optimization algorithms
- 2D–3D Geological features collaborative identification of surrounding rock structural planes in hydraulic adit based on OC-AINet
- Spatiotemporal patterns and drivers of Chl-a in Chinese lakes between 1986 and 2023
- Land use classification through fusion of remote sensing images and multi-source data
- Nexus between renewable energy, technological innovation, and carbon dioxide emissions in Saudi Arabia
- Analysis of the spillover effects of green organic transformation on sustainable development in ethnic regions’ agriculture and animal husbandry
- Factors impacting spatial distribution of black and odorous water bodies in Hebei
- Large-scale shaking table tests on the liquefaction and deformation responses of an ultra-deep overburden
- Impacts of climate change and sea-level rise on the coastal geological environment of Quang Nam province, Vietnam
- Reservoir characterization and exploration potential of shale reservoir near denudation area: A case study of Ordovician–Silurian marine shale, China
- Seismic prediction of Permian volcanic rock reservoirs in Southwest Sichuan Basin
- Application of CBERS-04 IRS data to land surface temperature inversion: A case study based on Minqin arid area
- Geological characteristics and prospecting direction of Sanjiaoding gold mine in Saishiteng area
- Research on the deformation prediction model of surrounding rock based on SSA-VMD-GRU
- Geochronology, geochemical characteristics, and tectonic significance of the granites, Menghewula, Southern Great Xing’an range
- Hazard classification of active faults in Yunnan base on probabilistic seismic hazard assessment
- Characteristics analysis of hydrate reservoirs with different geological structures developed by vertical well depressurization
- Estimating the travel distance of channelized rock avalanches using genetic programming method
- Landscape preferences of hikers in Three Parallel Rivers Region and its adjacent regions by content analysis of user-generated photography
- New age constraints of the LGM onset in the Bohemian Forest – Central Europe
- Characteristics of geological evolution based on the multifractal singularity theory: A case study of Heyu granite and Mesozoic tectonics
- Soil water content and longitudinal microbiota distribution in disturbed areas of tower foundations of power transmission and transformation projects
- Oil accumulation process of the Kongdian reservoir in the deep subsag zone of the Cangdong Sag, Bohai Bay Basin, China
- Investigation of velocity profile in rock–ice avalanche by particle image velocimetry measurement
- Optimizing 3D seismic survey geometries using ray tracing and illumination modeling: A case study from Penobscot field
- Sedimentology of the Phra That and Pha Daeng Formations: A preliminary evaluation of geological CO2 storage potential in the Lampang Basin, Thailand
- Improved classification algorithm for hyperspectral remote sensing images based on the hybrid spectral network model
- Map analysis of soil erodibility rates and gully erosion sites in Anambra State, South Eastern Nigeria
- Identification and driving mechanism of land use conflict in China’s South-North transition zone: A case study of Huaihe River Basin
- Evaluation of the impact of land-use change on earthquake risk distribution in different periods: An empirical analysis from Sichuan Province
- A test site case study on the long-term behavior of geotextile tubes
- An experimental investigation into carbon dioxide flooding and rock dissolution in low-permeability reservoirs of the South China Sea
- Detection and semi-quantitative analysis of naphthenic acids in coal and gangue from mining areas in China
- Comparative effects of olivine and sand on KOH-treated clayey soil
- YOLO-MC: An algorithm for early forest fire recognition based on drone image
- Earthquake building damage classification based on full suite of Sentinel-1 features
- Potential landslide detection and influencing factors analysis in the upper Yellow River based on SBAS-InSAR technology
- Assessing green area changes in Najran City, Saudi Arabia (2013–2022) using hybrid deep learning techniques
- An advanced approach integrating methods to estimate hydraulic conductivity of different soil types supported by a machine learning model
- Hybrid methods for land use and land cover classification using remote sensing and combined spectral feature extraction: A case study of Najran City, KSA
- Streamlining digital elevation model construction from historical aerial photographs: The impact of reference elevation data on spatial accuracy
- Analysis of urban expansion patterns in the Yangtze River Delta based on the fusion impervious surfaces dataset
- A metaverse-based visual analysis approach for 3D reservoir models
- Late Quaternary record of 100 ka depositional cycles on the Larache shelf (NW Morocco)
- Integrated well-seismic analysis of sedimentary facies distribution: A case study from the Mesoproterozoic, Ordos Basin, China
- Study on the spatial equilibrium of cultural and tourism resources in Macao, China
- Urban road surface condition detecting and integrating based on the mobile sensing framework with multi-modal sensors
- Application of improved sine cosine algorithm with chaotic mapping and novel updating methods for joint inversion of resistivity and surface wave data
- The synergistic use of AHP and GIS to assess factors driving forest fire potential in a peat swamp forest in Thailand
- Dynamic response analysis and comprehensive evaluation of cement-improved aeolian sand roadbed
- Rock control on evolution of Khorat Cuesta, Khorat UNESCO Geopark, Northeastern Thailand
- Gradient response mechanism of carbon storage: Spatiotemporal analysis of economic-ecological dimensions based on hybrid machine learning
- Comparison of several seismic active earth pressure calculation methods for retaining structures
- Mantle dynamics and petrogenesis of Gomer basalts in the Northwestern Ethiopia: A geochemical perspective
- Study on ground deformation monitoring in Xiong’an New Area from 2021 to 2023 based on DS-InSAR
- Paleoenvironmental characteristics of continental shale and its significance to organic matter enrichment: Taking the fifth member of Xujiahe Formation in Tianfu area of Sichuan Basin as an example
- Equipping the integral approach with generalized least squares to reconstruct relict channel profile and its usage in the Shanxi Rift, northern China
- InSAR-driven landslide hazard assessment along highways in hilly regions: A case-based validation approach
- Attribution analysis of multi-temporal scale surface streamflow changes in the Ganjiang River based on a multi-temporal Budyko framework
- Maps analysis of Najran City, Saudi Arabia to enhance agricultural development using hybrid system of ANN and multi-CNN models
- Hybrid deep learning with a random forest system for sustainable agricultural land cover classification using DEM in Najran, Saudi Arabia
- Long-term evolution patterns of groundwater depth and lagged response to precipitation in a complex aquifer system: Insights from Huaibei Region, China
- Remote sensing and machine learning for lithology and mineral detection in NW, Pakistan
- Spatial–temporal variations of NO2 pollution in Shandong Province based on Sentinel-5P satellite data and influencing factors
- Numerical modeling of geothermal energy piles with sensitivity and parameter variation analysis of a case study
- Stability analysis of valley-type upstream tailings dams using a 3D model
- Variation characteristics and attribution analysis of actual evaporation at monthly time scale from 1982 to 2019 in Jialing River Basin, China
- Investigating machine learning and statistical approaches for landslide susceptibility mapping in Minfeng County, Xinjiang
- Investigating spatiotemporal patterns for comprehensive accessibility of service facilities by location-based service data in Nanjing (2016–2022)
- A pre-treatment method for particle size analysis of fine-grained sedimentary rocks, Bohai Bay Basin, China
- Study on the formation mechanism of the hard-shell layer of liquefied silty soil
- Comprehensive analysis of agricultural CEE: Efficiency assessment, mechanism identification, and policy response – A case study of Anhui Province
- Simulation study on the damage and failure mechanism of the surrounding rock in sanded dolomite tunnels
- Towards carbon neutrality: Spatiotemporal evolution and key influences on agricultural ecological efficiency in Northwest China
- Review Articles
- Humic substances influence on the distribution of dissolved iron in seawater: A review of electrochemical methods and other techniques
- Applications of physics-informed neural networks in geosciences: From basic seismology to comprehensive environmental studies
- Ore-controlling structures of granite-related uranium deposits in South China: A review
- Shallow geological structure features in Balikpapan Bay East Kalimantan Province – Indonesia
- A review on the tectonic affinity of microcontinents and evolution of the Proto-Tethys Ocean in Northeastern Tibet
- Advancements in machine learning applications for mineral prospecting and geophysical inversion: A review
- Special Issue: Natural Resources and Environmental Risks: Towards a Sustainable Future - Part II
- Depopulation in the Visok micro-region: Toward demographic and economic revitalization
- Special Issue: Geospatial and Environmental Dynamics - Part II
- Advancing urban sustainability: Applying GIS technologies to assess SDG indicators – a case study of Podgorica (Montenegro)
- Spatiotemporal and trend analysis of common cancers in men in Central Serbia (1999–2021)
- Minerals for the green agenda, implications, stalemates, and alternatives
- Spatiotemporal water quality analysis of Vrana Lake, Croatia
- Functional transformation of settlements in coal exploitation zones: A case study of the municipality of Stanari in Republic of Srpska (Bosnia and Herzegovina)
- Hypertension in AP Vojvodina (Northern Serbia): A spatio-temporal analysis of patients at the Institute for Cardiovascular Diseases of Vojvodina
- Regional patterns in cause-specific mortality in Montenegro, 1991–2019
- Spatio-temporal analysis of flood events using GIS and remote sensing-based approach in the Ukrina River Basin, Bosnia and Herzegovina
- Flash flood susceptibility mapping using LiDAR-Derived DEM and machine learning algorithms: Ljuboviđa case study, Serbia
- Geocultural heritage as a basis for geotourism development: Banjska Monastery, Zvečan (Serbia)
- Assessment of groundwater potential zones using GIS and AHP techniques – A case study of the zone of influence of Kolubara Mining Basin
- Impact of the agri-geographical transformation of rural settlements on the geospatial dynamics of soil erosion intensity in municipalities of Central Serbia
- Where faith meets geomorphology: The cultural and religious significance of geodiversity explored through geospatial technologies
- Applications of local climate zone classification in European cities: A review of in situ and mobile monitoring methods in urban climate studies
- Complex multivariate water quality impact assessment on Krivaja River
- Ionization hotspots near waterfalls in Eastern Serbia’s Stara Planina Mountain
- Shift in landscape use strategies during the transition from the Bronze age to Iron age in Northwest Serbia
- Assessing the geotourism potential of glacial lakes in Plav, Montenegro: A multi-criteria assessment by using the M-GAM model
- Flash flood potential index at national scale: Susceptibility assessment within catchments
- SWAT modelling and MCDM for spatial valuation in small hydropower planning