Spatial and temporal evolution of land use and habitat quality in arid regions – a case of Northwest China
-
Feng Wen


Abstract
The ecological and natural conditions in arid regions are very harsh, and water scarcity and land desertification are prominent features of these regions. The land cover of these areas has a significant impact on global climate change as well as on ecological conservation and building. In order to achieve rational and sustainable use of land resources, it is crucial to quickly grasp the changes in land use and habitat quality in arid areas. Therefore, based on the land cover data from 1990 to 2022, this study explores and analyses the characteristics of land use change and habitat quality evolution in Northwest China using land use dynamics, transfer matrix, and InVEST model. The results show that the main cover types in Northwest China are grassland and barren, and that the area of impervious has changed considerably during the period 1990–2022, with an area movement of 11.69%. Over the past 33 years, there have been frequent conversions between cropland, forest, grassland, and barren, during which the habitat degradation index has shown a trend of “increasing–decreasing–increasing,” and the overall spatial distribution of habitat quality has shown a distribution of “low in the northwest and high in the central part of the country.” There is a strong link between land use change and habitat quality change over the period 1990–2022, with land use shifts and habitat quality shifts generally following the same trend over the period. Regional differences in natural and anthropogenic factors are also more pronounced, resulting in significant spatial heterogeneity in the impacts of habitat quality in Northwestern China. As an important ecological barrier and strategic resource reserve area in the northwest region, this study is of great significance for maintaining national and even global ecological and resource security.
1 Introduction
Land resources are the material basis for human survival and an important carrier for human existence and production [1,2]. Land use/cover change is closely related to changes in landscape patterns, ecosystems, biodiversity, population growth, and urban heat island effects [3,4,5,6]. Changes in the spatial and temporal patterns of land use and their habitat quality characteristics are of great value in promoting sustainable socio-economic and ecological development [7,8].
Remote sensing image data are an important basis for the study of spatial and temporal land use changes [9,10,11,12,13]. In response to this need, a large number of global medium- and high-resolution land cover products have been proposed by domestic and foreign research institutions and teams, such as GlobeLand30 [14], GLC_FCS30 [15], and FROM-GLC [16]. Owing to the progress of remote sensing technology and the development of classification algorithms, the spatial and temporal resolution and accuracy of land cover products have been continuously improved, which provides strong support for the development of multi-temporal and spatial scales related research, and therefore, the research on spatial and temporal changes in land use has attracted the attention of scholars at home and abroad [17,18,19,20,21]. Chen [22] used spatial analysis to explore the spatial and temporal changes of heat stress and to make a comparative analysis of surface temperature and land use. The comparative analyses of the expansion of high surface temperature regions and changes in land use types showed that the surface temperature in 2014 was indeed higher than that in 2008, and the results of the study can provide a reference for improving the adaptive capacity of regional heat stress in the future based on different land use patterns. Ning et al. [23] used Landsat 8 OLI and GF-2 high-resolution remote sensing images to obtain the land use change characteristics of China from 2010 to 2015 using digital interpretation methods. The results showed that the scale of construction land continued to expand and the area of arable land decreased in the eastern region, but both showed a decreasing trend, while the expansion of construction land and the shrinkage of arable land accelerated in the central region. Nnaji et al. [24] investigated the spatial and temporal impact of land use carbon stock on hydrology in watersheds of Enugu State, Nigeria, using SWAT (Soil and Water Assessment Tool). The results showed that the main reasons for the change in land use efficiency are active urbanization and increasing demand for food production to meet the needs of the growing population and conversion of range lands to residential and agricultural land. Long et al. [25] investigated the spatial and temporal changes in vegetation and its interaction with climate change in Argentina from 1982 to 2015, and the results showed a decreasing trend in NDVI in Argentina from 1982 to 2015, with a range of −1.75 to 0.69/year. NDVI decreased significantly in Patagonia (Argentina), and extreme precipitation and drought were the main causes of vegetation loss in Patagonia. Zhang et al. [26] used the Dianchi Basin as the study area and used the dynamic equivalence method to determine the ecosystem service value (ESV) and the hotspot analysis method to analyze the spatial and temporal changes of land use and ESV in the Dianchi Basin during the period 2001–2019, and explored the influencing factors. The results showed that during the 20-year period, the main land use types in the Dianchi watershed were forest land, cropland, construction land, and waters. In the land transfer, the most outflow of land was cropland, accounting for 35.50% of the total outflow. The ESV in the study area showed a trend of high in the middle and low in the periphery during the period 2001–2019, with the watershed dominated by the Dianchi Pond as the area of the highest value. Studies on spatial and temporal changes in land use have been conducted to provide practical significance and scientific decision-making for urban planning, natural resource management, environmental protection, and socio-economic development.
However, there are fewer studies on spatial and temporal analyses of land use and habitat quality in arid regions. In fact, the land use/cover changes in arid regions, which account for about 40% of the global area, have a greater impact on terrestrial vegetation carbon stocks, water resources, global climate change, and ecosystem building due to the complexity of their genesis, the variety of surface cover types, and the rapidity of the change process. However, after reviewing the relevant literature, there is no study on the spatial and temporal land use change and its habitat quality characterization in Northwest China from 1990 to 2022.
Northwest China has a complex topography, a distinct arid and semi-arid climate, and a fragile ecological environment. It includes a variety of ecosystems, including mountains, grasslands, deserts, and lakes, where water resources are scarce and ecosystems are vulnerable to human activities, while it is an important grain-producing area in China. There are serious conflicts over land use in Northwest China, especially the ecological impacts of activities such as agriculture, pastoralism, and urbanization. Therefore, it is important to keep abreast of land use changes and the status of its habitat quality characteristics in Northwest China in order to better assess the sustainability of land use, better understand the health of various ecosystems, and help the government to formulate reasonable ecological protection policies and sustainable development plans, thereby promoting the harmonious coexistence of man and nature and realizing the virtuous cycle of economic development and ecological protection. However, land use is the most intuitive expression of the regional ecological environment, its accurate spatial distribution pattern, change information, and its key.
In summary, in order to more comprehensively analyze land use and habitat quality changes in arid areas, this study considers Northwest China as the study area, with China’s 30 m resolution land cover data as the data source, and adopts the land use dynamics, type transfer trajectory model, and habitat quality model to analyze the changes in spatial and temporal patterns of land use and its habitat quality characteristics from 1990 to 2022, and discusses the influencing factors. This study is of great significance in urban planning and development, land resource allocation, ecological environmental protection, maintenance of biodiversity, and sustainable development.
2 Materials and methods
2.1 Study area
The Northwest China region includes five provinces and regions, namely Shaanxi, Gansu, Qinghai, Ningxia Hui Autonomous Region, and Xinjiang Uygur Autonomous Region, and is situated in the northwestern frontier of China, with a total area of about 2 million square kilometers. The northwest region has a complex topographical pattern of varying heights, mountains, plateaus, and basins, including the world’s lowest basin (the Turpan Basin) and the world’s highest plateau (the Qinghai-Tibetan Plateau). Located in the interior of China, the northwest region has a dry climate, dominated by low humidity, plateau climate, with annual precipitation decreasing from about 400 mm in the east to 200 mm or even less than 50 mm in the west, and drought is the main natural feature of the region. Economically, the Northwest Territories are rich in resources, with a variety of resources such as oil, natural gas, coal, iron ore, and copper ore. Agriculture is dominated by wheat, corn, cotton, etc., and the livestock industry is also very well developed. Overall, the Northwest region has unique characteristics in terms of economy and culture and is strategically important for the development of China and its world. The geographical location of the research area is shown in Figure 1.

Geographical location of the study area.
2.2 Data sources
The land use data used in this study are from the China Land Cover Dataset (CLCD) (https://doi.org/10.5281/zenodo.4417810) produced by the team of Mr. Xin Huang from Wuhan University, which contains data from 1990, 2000, 2010, and 2022, and four periods, with a spatial and the spatial resolution is 30 m. CLCD data are based on the GEE platform to obtain Landsat remote sensing images, and the classification results are obtained by constructing spatiotemporal features and combining them with a random forest classifier. Land use types in the CLCD dataset include nine categories: cropland, forest, shrub, grassland, water, snow and ice, barren, impervious, and wetland. The data are based on 5,463 visual interpretation samples to calculate the CLCD with an overall accuracy of 80%. In addition, the data producer has compared CLCD data with existing thematic products and found that CLCD shows good agreement with global forest change, global surface water, and impervious time-series datasets. Therefore, according to the existing research, the selected land use data can meet the research purpose of this study. Figure 2 shows the results of data preprocessing.


Land cover data of the study area from 1990 to 2022. (a) 1990, (b) 2000, (c) 2010, and (d) 2022.
2.3 Research method
2.3.1 Dynamic attitude of land use
Single land use dynamic attitude refers to the quantity change of a certain type of land use in a certain period of time, and the formula is as follows:
where
2.3.2 Type transfer trajectory model
Transition matrix. The transfer matrix can accurately describe the amount of mutual transformation between different land use types during the study period, which is conducive to quantitative analysis of the structural characteristics of different types in terms of quantity and the direction and amount of mutual transfer [27]. The mathematical expression is as follows:
(2)where
Transfer rates. The transfer rates of land use type describe the proportion of the transfer areas of a single type, which reflects the stability of the type during the study period. The calculation of the transfer rates is based on the transfer matrix, and the specific calculation formula is as follows:
(3)(4)where
Sankey map. Sankey map is an effective method to describe the flow of a large number of complex data, which can not only reflect the proportion of each type, but also clearly express the transfer track and quantity of different land use types [28]. Therefore, in order to identify the flow, direction, and diversity of land use change in different periods, the land use transfer matrix was visualized in the Sankey map so as to build the trajectory model of area change of each land use type.
2.3.3 Habitat quality model
Biodiversity is closely linked to the production of ecosystem services. The nature of biodiversity is spatial, so it can be calculated by analyzing the land use/land cover map and its threat to biodiversity. The InVEST model was used to assess the habitat quality and degradation levels of the landscape in this region. As a comprehensive ecosystem service function assessment model, InVEST model can assist in natural resource management and decision-making [29]. The habitat quality module is based on land use data, combined with the maximum impact distance and relative weight of stress factors on habitats, habitat suitability of different regions, and their sensitivity to stress factors to assess regional habitat quality. The calculation formula is as follows:
where
where
where
Cultivated land with serious human disturbance, construction land as artificial surface, and bare land as habitat stress factors were set. Based on the recommended parameters in the InVEST model user manual and related research [30,31,32,33], and combined with the actual situation of the study area, the required parameters are assigned (Tables 1 and 2).
Stress factors and their maximum influence distance and weight
| Stress factor | Maximum influence distance (km) | Weight | Attenuation type |
|---|---|---|---|
| Cropland | 1 | 0.5 | Linear decay |
| Impervious | 10 | 1 | Exponential decay |
| Barren | 1 | 0.4 | Linear decay |
Habitat suitability of each land use type and its sensitivity to stress factors
| Land use type | Habitat suitability | Stress factor | ||
|---|---|---|---|---|
| Cropland | Impervious | Barren | ||
| Cropland | 0.3 | 0 | 0.5 | 0.6 |
| Forest | 1.0 | 0.3 | 0.35 | 0.5 |
| Shrub | 0.8 | 0.9 | 0.7 | 0.4 |
| Grassland | 0.8 | 0.8 | 0.4 | 0.5 |
| Water | 0.7 | 0.2 | 0.3 | 0.3 |
| Barren | 0.6 | 0.5 | 0.9 | 0 |
| Impervious | 0 | 0 | 0 | 0.2 |
| Wetland | 0.3 | 1 | 0.5 | 0.3 |
| Snow/ice | 0.2 | 0 | 0 | 0.1 |
3 Result analysis
3.1 Dynamic attitude of land use
Table 3 shows the change of land use area in Northwest China from 1990 to 2022. During the period 1990–2022, grassland and bareland were the main land cover types in northwest China, and their land use dynamic attitudes changed little, with values of −0.09 and −0.06%, respectively. During the period 1990–2022, the area of cropland, forest, water, and impervious has shown an increasing trend. Impervious is the type with the largest area change during the 33-year period, with the area increasing from 2,700 km2 in 1990 to 12,800 km2 in 2022, and the area dynamic value is 11.69%. The area of wetlands in northwest China is relatively small, and the area is basically maintained in the range of 700–800 km2, and the area changed the least during 1990–2022.
Area change of different land use types from 1990 to 2022
| Land use type | Area (104 km2) | Percentage | Dynamic degree (%) | ||||||
|---|---|---|---|---|---|---|---|---|---|
| 1990 | 2000 | 2010 | 2022 | 1990 | 2000 | 2010 | 2022 | 1990–2022 | |
| Cropland | 19.52 | 20.23 | 20.77 | 21.01 | 6.48 | 6.72 | 6.90 | 6.98 | 0.24 |
| Forest | 12.89 | 13.9 | 14.87 | 16.04 | 4.28 | 4.62 | 4.94 | 5.33 | 0.76 |
| Shrub | 0.69 | 0.57 | 0.52 | 0.4 | 0.23 | 0.19 | 0.17 | 0.13 | −1.31 |
| Grassland | 109.74 | 108.28 | 109.52 | 106.68 | 36.44 | 35.96 | 36.37 | 35.43 | −0.09 |
| Water | 2.13 | 2.24 | 2.61 | 2.74 | 0.71 | 0.74 | 0.87 | 0.91 | 0.89 |
| Snow/ice | 4.29 | 4.06 | 4.94 | 4.13 | 1.43 | 1.35 | 1.64 | 1.37 | −0.12 |
| Barren | 151.53 | 151.33 | 147 | 148.77 | 50.32 | 50.25 | 48.81 | 49.41 | −0.06 |
| Impervious | 0.27 | 0.45 | 0.83 | 1.28 | 0.09 | 0.15 | 0.28 | 0.43 | 11.69 |
| Wetland | 0.07 | 0.08 | 0.07 | 0.07 | 0.02 | 0.02 | 0.02 | 0.02 | 0 |
3.2 Land use transfers
3.2.1 Transfer matrix
Tables 4–6 show the land use transfer matrix for Northwest China from 1990 to 2022. By calculating the transfer matrix, both transfers in and out of surface cover types that occurred in Northwest China during the period 1990–2022 were obtained. During the period 1990–2000, the grassland type had the largest area transferred out, with a value of 102156.46 km2, during which the grassland was mainly converted to cropland and bareland type; the area of other types converted to bareland type had the largest area, with a value of 15132509.91 km2, which mainly consisted of cropland and grassland converted to bareland, which indicated that the northwestern region of China was still relatively desert and had a poorer ecological environment in this period. The wetland type had the smallest area transferred into and out of the wetland type during the period 1990–2000, and its area was 779.33 and 709.74 km2, respectively.
Land use transfer matrix for the period 1990–2000 (km2)
| 1990 | 2000 | ||||||||
|---|---|---|---|---|---|---|---|---|---|
| 1 | 2 | 3 | 4 | 5 | 6 | 7 | 8 | 9 | |
| 1 | 163461.97 | 3914.66 | 66.04 | 26019.60 | 361.22 | 0.00 | 105.48 | 1305.79 | 0.21 |
| 2 | 3304.86 | 123065.87 | 1170.21 | 1335.00 | 2.25 | 0.00 | 0.00 | 3.11 | 0.00 |
| 3 | 183.93 | 1676.67 | 3380.67 | 1688.70 | 0.00 | 0.00 | 0.00 | 0.04 | 0.02 |
| 4 | 32270.10 | 10226.90 | 1082.14 | 995192.33 | 1218.99 | 332.00 | 56199.10 | 624.70 | 202.53 |
| 5 | 304.86 | 56.13 | 0.00 | 384.88 | 19725.00 | 6.07 | 715.10 | 82.64 | 0.01 |
| 6 | 0.03 | 25.32 | 0.00 | 747.75 | 241.21 | 36775.30 | 5098.81 | 0.00 | 0.00 |
| 7 | 2481.13 | 5.18 | 0.00 | 57147.10 | 798.10 | 3485.72 | 1451130.38 | 279.14 | 0.03 |
| 8 | 277.92 | 6.35 | 0.00 | 120.82 | 36.77 | 0.00 | 1.62 | 2214.70 | 0.00 |
| 9 | 7.00 | 0.21 | 0.00 | 120.96 | 4.24 | 0.00 | 0.80 | 0.00 | 576.54 |
Notes: 1: cropland; 2: forest; 3: shrub; 4: grassland; 5: water: 6: snow/ice; 7: bareland; 8: impervious; and 9: wetland.
Land use transfer matrix for the period 2000–2010 (km2)
| 2000 | 2010 | ||||||||
|---|---|---|---|---|---|---|---|---|---|
| 1 | 2 | 3 | 4 | 5 | 6 | 7 | 8 | 9 | |
| 1 | 171250.08 | 4401.19 | 53.51 | 24383.00 | 446.96 | 0.02 | 56.18 | 1702.10 | 1.72 |
| 2 | 1305.07 | 136847.33 | 658.60 | 176.19 | 0.57 | 0.00 | 0.00 | 2.84 | 0.00 |
| 3 | 36.78 | 1079.74 | 3496.94 | 1085.64 | 0.01 | 0.00 | 0.00 | 0.00 | 0.03 |
| 4 | 29798.80 | 6371.70 | 951.31 | 1008019.54 | 1281.12 | 908.22 | 33842.60 | 1460.79 | 132.20 |
| 5 | 275.00 | 25.12 | 0.00 | 434.10 | 20975.61 | 15.40 | 568.58 | 94.55 | 0.07 |
| 6 | 0.01 | 5.40 | 0.00 | 145.56 | 139.39 | 38673.77 | 1634.94 | 0.00 | 0.00 |
| 7 | 4988.78 | 3.66 | 0.00 | 60795.50 | 3160.21 | 9794.40 | 1433899.34 | 610.94 | 0.02 |
| 8 | 7.57 | 0.01 | 0.00 | 1.42 | 104.58 | 0.00 | 0.38 | 4396.65 | 0.00 |
| 9 | 14.40 | 3.56 | 0.00 | 115.01 | 19.32 | 0.02 | 2.57 | 0.00 | 624.46 |
Notes: 1: cropland; 2: forest; 3: shrub; 4: grassland; 5: water: 6: snow/ice; 7: bareland; 8: impervious; and 9: wetland.
Land use transfer matrix for the period 2010–2022 (km2)
| 2010 | 2022 | ||||||||
|---|---|---|---|---|---|---|---|---|---|
| 1 | 2 | 3 | 4 | 5 | 6 | 7 | 8 | 9 | |
| 1 | 165414.17 | 6213.51 | 29.59 | 32239.20 | 324.03 | 0.06 | 513.35 | 2919.43 | 13.51 |
| 2 | 3177.50 | 139832.58 | 723.18 | 4878.75 | 33.35 | 28.54 | 15.27 | 23.70 | 5.85 |
| 3 | 63.65 | 1151.89 | 2341.83 | 1602.35 | 0.10 | 0.00 | 0.09 | 0.03 | 0.07 |
| 4 | 35629.90 | 13074.80 | 917.15 | 971682.00 | 1276.41 | 1212.30 | 68948.10 | 2195.05 | 152.07 |
| 5 | 397.00 | 32.96 | 0.08 | 862.07 | 22109.72 | 135.07 | 2335.09 | 250.20 | 2.35 |
| 6 | 1.07 | 46.82 | 0.01 | 1090.16 | 483.57 | 35769.59 | 11970.00 | 3.24 | 0.75 |
| 7 | 4641.92 | 22.76 | 0.34 | 53646.80 | 3022.89 | 4176.52 | 1403633.60 | 791.31 | 5.84 |
| 8 | 761.99 | 4.78 | 0.02 | 576.99 | 115.58 | 0.09 | 189.34 | 6618.03 | 0.01 |
| 9 | 18.41 | 8.29 | 0.00 | 177.07 | 18.14 | 1.02 | 8.38 | 0.01 | 527.16 |
Notes: 1: cropland; 2: forest; 3: shrub; 4: grassland; 5: water: 6: snow/ice; 7: bareland; 8: impervious; and 9: wetland.
During the period 2000–2010, the area of each type of transfer out in Northwest China, in descending order, was bareland > grassland > cropland > forest > snow/ice > water > shrubs > impervious > wetland, and the bareland type with the largest area of diversion was mainly converted to cropland type, with an area of 29798.80 km2, which may be attributed to an increase in the cropland area as a result of the demands of economic development and population growth.
The transferred area of each type in Northwest China, in descending order, was grassland > bareland > cropland > forest > snow/ice > water > impervious > shrubs > wetlands, of which grassland was mainly converted from impervious, with a transferred area of 60795.50 km2, indicating a better recovery of the vegetation cover and a gradual reduction of ecological vulnerability in this period.
During the period 2010–2022, the areas of grassland and bareland types are transferred out of a large area, with transfer areas of 123405.78 and 66308.37 km2, respectively, in which grassland types are mainly converted into cropland, forest, and bareland, and bareland types are mainly converted into cropland and grassland.
3.2.2 Transfer in and out rates
The transfer in and out rates reflect the interconversion between different land use types (Table 7). The rate of transferring in and out of cropland types across time ranged from 15.35 to 21.27%, indicating that about 6% of the cropland areas are in an unstable state and may be subject to type switching due to various factors. Both turn-in and turn-out rates of forest types show a trend of decreasing and then increasing during the period 1990–2022, but the turn-in rate is greater than the turn-out rate, indicating better ecological restoration and improved ecological stability during this period. Shrubs have greater values of turn-in and turn-out rates for the period 1990–2022, with the highest value reaching 54.62%, indicating more frequent shrub type transitions. Impervious land has had a high rate of diversion during the last 32 years, especially from 1990 to 2000, when the diversion rate reached 50.89%, indicating that urban expansion has continued to encroach on other land cover types. Wetland types show an increasing trend in turn-out rates from 1990 to 2022, indicating frequent type transitions and poor ecological stability.
Land use transfer-in and transfer-out rates for the period 1990–2022 (%)
| Type | 1990–2000 | 2000–2010 | 2010–2022 | |||
|---|---|---|---|---|---|---|
| R in | R out | R in | R out | R in | R out | |
| Cropland | 19.19 | 16.27 | 17.54 | 15.35 | 21.27 | 20.35 |
| Forest | 11.45 | 4.51 | 7.99 | 1.54 | 12.82 | 5.98 |
| Shrub | 40.68 | 51.22 | 32.23 | 38.64 | 41.63 | 54.62 |
| Grassland | 8.09 | 9.31 | 7.96 | 6.90 | 8.91 | 11.27 |
| Water | 11.89 | 7.28 | 19.72 | 6.31 | 19.26 | 15.37 |
| Snow/ice | 9.42 | 14.25 | 21.70 | 4.74 | 13.44 | 27.54 |
| Barren | 4.11 | 4.24 | 2.46 | 5.24 | 5.65 | 4.51 |
| Impervious | 50.89 | 16.68 | 46.82 | 2.53 | 48.30 | 19.94 |
| Wetland | 26.02 | 18.77 | 17.67 | 19.87 | 25.50 | 30.50 |
3.2.3 Sankey diagram
A Sankey diagram was used to visualize the land use transfer matrix for the last 33 years in Northwest China to analyze the transfer trajectories between different types (Figures 3–5). In the period 1990–2000, the type with the largest area transferred out was grassland, which was mainly converted to bareland, cropland, and forest types; water, impervious, and wetland types transferred less area during this period. At the same time, the land categories with a high area of transferred in 1990–2000 included grassland, bareland, and cropland types, with the sources of grassland diversion consisting mainly of bareland and cropland. During the period 2000–2010, the bareland and grassland types showed a greater area of turn-out, while at the same time, grassland had a greater area of turn-in, but its area was greater than the amount of grassland turn-out. In the period 2010–2022, the area of grassland converted out remained the largest of the categories, converting mainly to forest, cropland, and bareland, and the bareland and cropland were mainly converted to grassland.

Trajectory of land use transfer matrix from 1990 to 2000.

Trajectory of land use transfer matrix from 2000 to 2010.

Trajectory of land use transfer matrix from 2010 to 2022.
Overall, the last 33 years in Northwest China have been dominated by the interconversion of cropland, forest, grassland, and bareland, and these results suggest that the policies related to ecological protection, ecological restoration, returning farmland to forests, and land resource protection that have been continuously introduced over the period of 1990–2022 have effectively driven the interconversion of these land categories.
3.3 Analysis of the spatial and temporal evolution of habitat quality
3.3.1 Evolutionary features of habitat degradation
The degree of habitat degradation obtained from the InVEST model calculation is presented as a continuous change from 0 to 1 in the raster, with larger values representing higher degradation in the corresponding raster. The spatial statistics of habitat degradation in Northwest China (Table 8) showed that the maximum value of the habitat degradation index showed a trend of “increasing–decreasing–increasing” during the period 1990–2022; however, its average value showed a trend of gradually increasing during the last 33 years, indicating that the habitat of Northwest China as a whole showed a degradation phenomenon. The standard deviation of the Habitat Degradation Degree Index (HDI) increased from 0.0715 to 0.0794 over the period 1990–2022, suggesting that the differences in the level of habitat degradation among the raster cells are gradually increasing.
Spatial statistics of habitat degradation in Northwest China
| Year | Minimum value | Maximum value | Mean value | Standard deviation |
|---|---|---|---|---|
| 1990 | 0 | 0.6345 | 0.0278 | 0.0715 |
| 2000 | 0 | 0.6474 | 0.0288 | 0.0731 |
| 2010 | 0 | 0.6399 | 0.0302 | 0.0751 |
| 2022 | 0 | 0.6659 | 0.0326 | 0.0794 |
3.3.2 Characteristics of the spatial and temporal evolution of habitat quality
The HQI takes values in the range of 0–1, with non-habitat landscapes scoring 0. The closer the value is to 1, the better the habitat quality.
In order to present the spatial and temporal evolution of habitat quality in Northwest China more intuitively, the HQI was divided into five intervals of 0–0.2, 0.2–0.4, 0.4–0.6, 0.6–0.8, 0.8–1, corresponding to the low, lower, medium, higher, and high habitat quality grades, according to the relevant studies [34,35,36,37], and the actual situation in the study area and the area and the percentage of the area of the habitat quality grades were calculated (Table 9).
Area of each grade habitat quality in Northwest China from 1990 to 2022 (104 km2)
| Grade | Habitat value | 1990 | 2000 | 2010 | 2022 | ||||
|---|---|---|---|---|---|---|---|---|---|
| Area | Percentage | Area | Percentage | Area | Percentage | Area | Percentage | ||
| Low | 0.0–0.2 | 3.91 | 1.30 | 3.65 | 1.21 | 4.44 | 1.48 | 3.69 | 1.23 |
| Lower | 0.2–0.4 | 22.64 | 7.52 | 23.87 | 7.94 | 24.89 | 8.29 | 26.04 | 8.69 |
| Medium | 0.4–0.6 | 42.45 | 14.11 | 46.47 | 15.46 | 46.99 | 15.65 | 51.09 | 17.04 |
| Higher | 0.6–0.8 | 178.38 | 59.29 | 169.93 | 56.51 | 166.44 | 55.42 | 163.67 | 54.58 |
| High | 0.8–1.0 | 53.49 | 17.78 | 56.75 | 18.88 | 57.54 | 19.16 | 55.35 | 18.46 |
The results of the time-scale statistics show that during the period 1990–2022, the percentage of the area of higher-grade habitat quality in north-west China was maintained between 54.58 and 9.29%, with an overall decreasing trend, indicating that the level of regional habitat quality is at an intermediate stage, but the overall condition is in a continuous decline.
The results of time-scale statistics show that from 1990 to 2022, the proportion of high-grade habitat quality area in Northwest China is maintained between 54.58 and 9.29%, and the overall trend is gradually decreasing, indicating that the regional habitat quality level is in a medium stage, but the overall situation is in a continuous decline.
From 1990 to 2000, the proportion of low- and middle-grade habitat quality areas increased by 1.77%, while the proportion of higher-grade habitat quality areas decreased by 2.78%. From 2000 to 2010, the total area proportion of low-grade, lower-grade, and medium-grade habitat quality increased by 0.81%, while that of higher-grade habitat quality decreased by 1.09%. During the period 2010–2022, the overall area proportion of lower- and middle-grade habitat quality increased by 1.79%, the area proportion of higher-grade habitat quality decreased by 0.84%, and the area proportion of high-grade habitat quality decreased by 0.70%. The total area proportion of higher-grade habitat quality increased by 1.38% during 1990–2010.
The results of spatial pattern distribution of habitat quality in northwest China (Figure 6) showed that the overall habitat quality in northwest China showed a distribution feature of “low in northwest China and high in southeast China,” with high- and higher-grade regions appearing in mountainous and hilly areas in inland regions, mainly in Gansu, Qinghai, and Shaanxi provinces in northwest China. The low-grade habitat quality is mainly concentrated in the western and northern regions of Northwest China, which are generally higher in elevation, ecologically fragile and arid. Low- and medium-grade habitat quality areas were concentrated in the northern and eastern parts of Northwest China, mainly in Xinjiang Uygur Autonomous Region and Shaanxi Province.

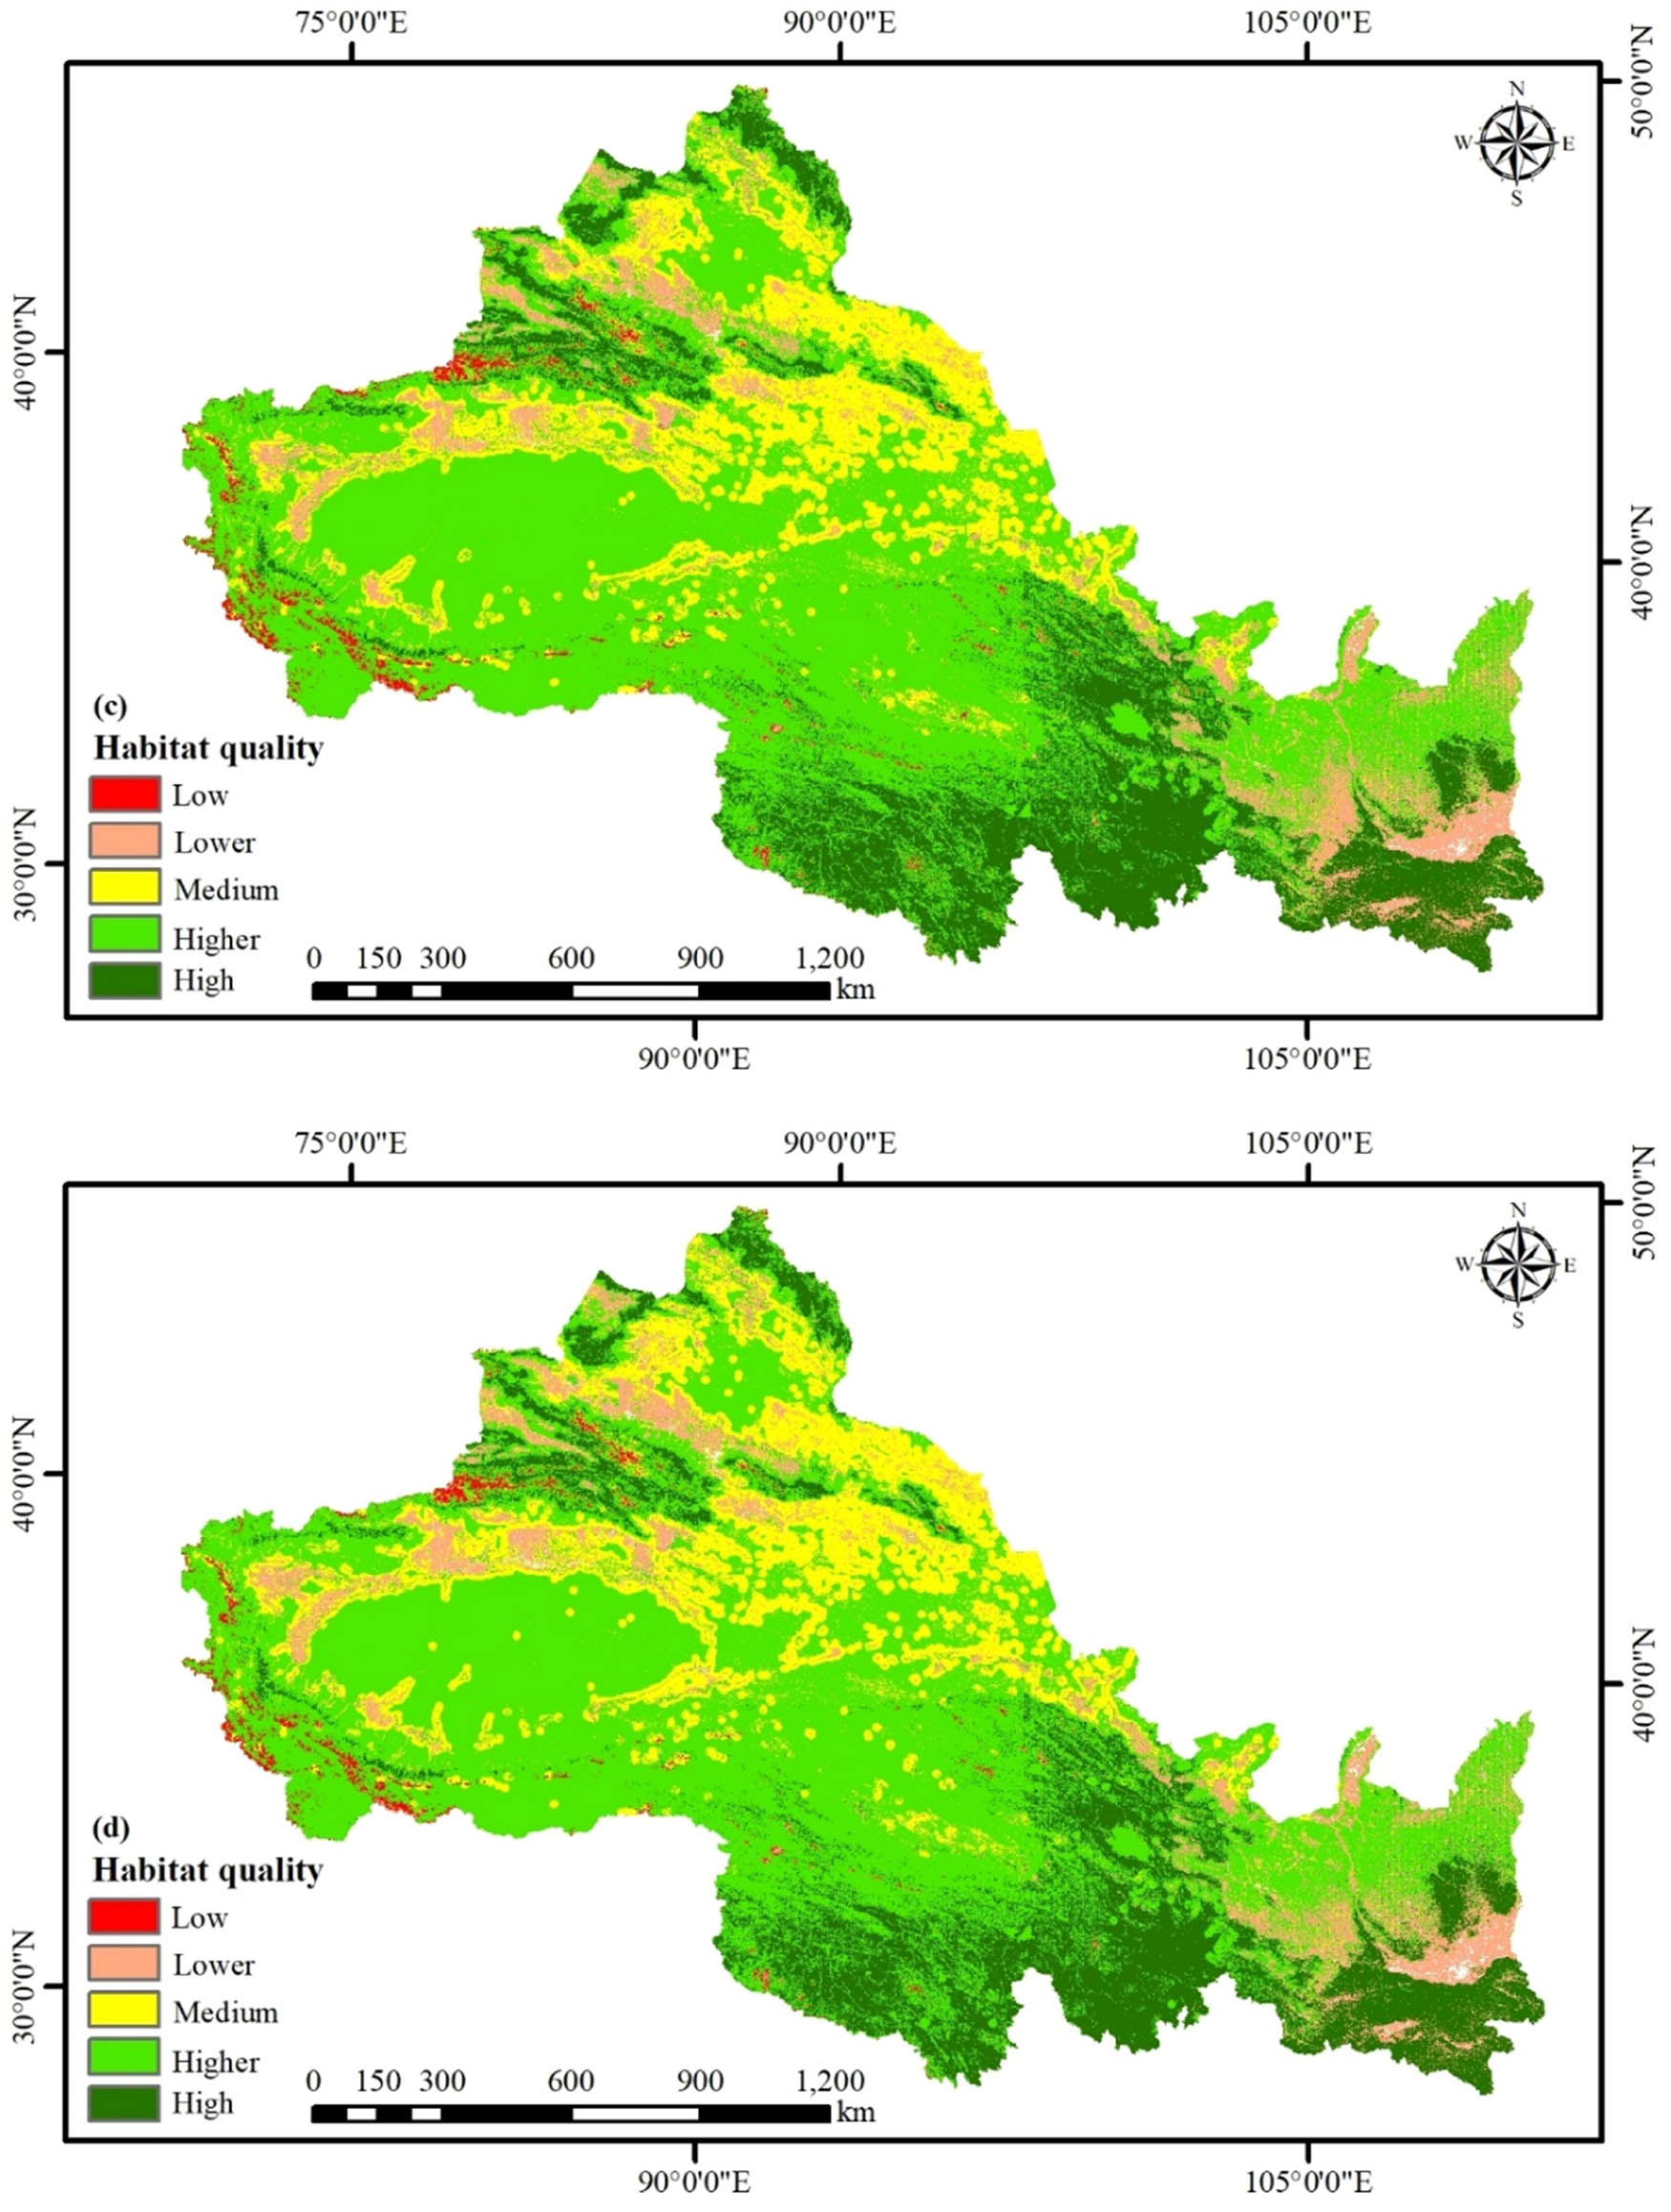
Spatial distribution of habitat quality in Northwest China from 1990 to 2022. (a) 1990, (b) 2000, (c) 2010, and (d) 2022.
3.3.3 Characteristics of habitat quality transfer
Table 10 and Figure 7 show the statistical results of habitat quality transfer at different levels in Northwest China during 1990–2022. In recent 33 years, the areas with no change in habitat quality were mainly concentrated in the central Gansu and Qinghai provinces, with an area of 2,433,600 km2, among which the area of higher-grade habitat quality was the largest in other grades, with a median value of 1,469,200 km2. The reduction of habitat quality was mainly concentrated in Xinjiang Uygur Autonomous Region in the northern part of the study area, with a decreased area of 357,100 km2. The increase of habitat quality was relatively small in the north, middle, and east of the study area, with an increased area of 207,400 km2.
Habitat quality level transfer matrix from 1990 to 2020
 |

Spatial distribution of habitat quality changes Southeast China.
4 Discussion
4.1 Relationship between temporal and spatial evolution of habitat quality and land use change
Based on the above research results, the correlation between the spatial-temporal evolution of habitat quality and land use change in northwest China was discussed based on the analysis of the formation and causes of land use pattern change.
The land use pattern and its change in the study area are influenced by the natural environment and social and economic factors [38,39,40,41]. In terms of natural conditions, the terrain of northwest China is dominated by mountains, plateaus, and basins, while the western region is interspersed with mountains and basins. Due to the arid climate, deserts and steppes are widely spread in northwest China. In the eastern region, steppes cover more and gradually transition to desert steppes and deserts. In the western basin, there are large areas of desert distribution. As a result, the special natural environment has shaped the landscape base state of bare ground and grassland types in the region. From a socio-economic point of view, the economic development of the northwest territories will maintain a steady growth trend, with the increase in gross regional product expected to remain at 5–7% [42,43]. In the past 33 years, the industrial structure of Northwest China has undergone obvious changes, which is manifested in the gradual decline of the proportion of agriculture and the gradual increase of the proportion of industry and services. However, the optimization and adjustment of industrial structure have created a large number of jobs for the society, and the regional population has increased accordingly. However, the rapid economic development and population growth have brought about an increase in the demand for construction land, such as industrial land and residential land. During the study period, the area of construction land continued to expand and occupied non-construction land mainly cropland, forest land, and grassland. Among them, cropland is the most seriously affected because of its distribution around the city and becomes the main source of the new construction land. At the same time, the expansion rate of the construction land in the later period of the study was much lower than that in the earlier period of the study, and the overall fragmentation degree of the landscape first increased and then decreased, which was in line with the trend of economic growth from fast to slow in Northwest China. The gradual change of economic development mode and the in-depth implementation of ecological civilization construction created favorable conditions for the intensive and economical utilization of regional land. In addition, policies and institutions also have a significant impact on land use, such as land policies, agricultural policies, environmental protection policies, agricultural modernization, and other social policies, which also affect the land use in Northwest China to a large extent.
There was a close relationship between the spatial and temporal pattern of habitat quality and land use change in the study area [44]. In the northwestern part of the study area, the main distribution type is bareland, and the ecological function is easily damaged. The southeast, with low elevation and flat terrain, is an important ecological functional area, mainly distributed in grassland, cropland, and impervious and is an intensive area of human activities. Therefore, the habitat quality showed a distribution pattern of “low in the northwest and high in southeast.” Economic development leads to the shift of land use types and the improvement of urbanization level, which leads to the increase of threats to habitat. On the whole, with the rapid expansion of impervious, the intensity of habitat degradation in the study area continued to increase, the quality of habitat continued to decline, and the maximum value of the habitat degradation index showed a change characteristic of “increase–decrease–increase,” which was consistent with the dynamic rate of land use change before and after the study. By comparing the transfer of land use type and habitat quality grade, we can see that the spatial pattern of habitat quality grade decline is highly consistent with the land use conversion type, which further proves that the spatial-temporal evolution of habitat quality is deeply affected by land use change.
4.2 Analysis of influencing factors of habitat quality change
In this study, the InVEST model was used to analyze and discuss the habitat degradation and habitat quality in northwest China during 1990–2022. The model used has the characteristics of few parameters and strong visualization and has been widely used [45,46], which has been relatively mature. Some studies have shown that it has certain advantages over other traditional methods in spatial expression and dynamic research [47,48]. There are many factors affecting habitat quality, among which land use is the primary driving factor affecting the habitat quality. During the period 1990–2022, the expansion of impervious use in Northwest China is significant, and the impact on habitat quality is obvious, which is closely related to regional social economy. In this study, the factors that pose threats to habitat quality include cropland, impervious, and bareland, among which cropland and bareland are frequently converted during 1990–2022, and the change of the area of these three land use types directly affects the change of habitat quality [49]. In addition, Northwest China is a relatively arid region where water resources are scarce and unevenly distributed. In order to meet the needs of economic development and population, the development and utilization of water resources have increased in the past 33 years, including the construction of reservoirs, large-scale water conservancy projects, and other activities, leading to the shrinkage of lakes and wetlands, the destruction of river ecosystems, and aggravating the problems of drought and soil erosion. It has affected the habitat quality in Northwest China recently.
Northwest China has a large area, complex and diverse terrain, and obvious regional differences between natural and human factors [50], which make the impact of habitat quality in Northwest China have obvious spatial heterogeneity. In the period from 1990 to 2022, with the increasing population, the demand for housing, infrastructure, and agricultural land has also increased, which has led to changes in land use patterns. The continuous expansion of urban land to meet the housing and employment needs of the new population has led to the conversion of agricultural land into construction land in the surrounding areas of cities. This change in land use pattern not only changes the original habitat structure but also may have a negative impact on habitat quality. Second, economic development also has an important impact on land use patterns and habitat quality. With the economic growth, industrialization and urbanization have accelerated, and a large amount of land has been used to build factories, commercial facilities, and so on. Such changes in land use patterns not only alter habitat structure and function but may also lead to habitat fragmentation and decreased connectivity. Both population growth and economic development have contributed to the degradation of habitat quality. Population growth has led to overexploitation and use of natural resources, exacerbating problems such as land degradation, water scarcity, and biodiversity loss. Industrial pollution and agricultural non-point source pollution arising from economic development have also had a negative impact on habitat quality. Together, these factors have led to an overall decline in habitat quality in Northwest China.
4.3 Limitations
This study investigated the dynamic characteristics of land use change and habitat quality in Northwest China from 1990 to 2022. The research results can help us to deeply understand the status quo of the ecological environment and its influencing factors in the arid region and provide a basis for the formulation of scientific and reasonable ecological protection and restoration measures so as to improve the quality of the ecological environment and promote the sustainable development of Northwest China. The advantage of this study is that the land use and habitat quality analysis methods adopted are universal. In addition, we compared the research results with the existing studies (Table 11) and found that the existing studies in Northwest China all showed that the land use pattern had an important impact on the habitat quality in Northwest China, and there was an obvious correlation between the two. In addition, the rapid economic development, human activities, and other influencing factors have an impact on land use patterns and habitat quality in Northwest China. These driving mechanisms and the internal correlation analysis results are basically consistent with the present study.
Comparison with existing studies
| Research area | Method | Main research result | Reference |
|---|---|---|---|
| Altay region | Different scale geomorphic types were divided based on DEM data, area comparison, transfer matrix, and InVEST model | Land use types and geomorphic types have important effects on habitat quality in the Northwest Altay region. Rapid economic development, overgrazing and mining, inappropriate tourism development, agricultural development, and other factors have an impact on land use patterns and habitat quality | Wang and Cheng [30] |
| Qinghai Lake | InVEST model | The habitat quality of Qinghai Lake Basin was quantitatively estimated using the InVEST model and “3S” technology. The change in land use in the river basin is an important reason for the change in ecological environment quality | Han et al. [51] |
| Shaanxi Province | InVEST model and landscape pattern index | There was an obvious spatial correlation between habitat quality and landscape pattern, and the spatial differentiation of clusters was obvious. The clustering effect of habitat quality and landscape pattern characteristics would weaken with the increase of urbanization degree | Gu et al. [52] |
However, there are some limitations in this study. First of all, this study evaluates habitat quality and degradation levels of landscapes in northwest China based on the InVEST model. In the calculation process, the parameters of habitat stress factors and their maximum impact distance and weight, as well as the sensitivity of habitat types to threat factors, were mainly set according to the existing research, regional characteristics, and experience. However, some parameter settings in the InVEST model adopted in this study have a certain impact on the evaluation results, and the determination of parameters may have a certain degree of subjectivity and uncertainty. Therefore, in practical application, it is necessary to fully consider the characteristics and applicable conditions of the model and select and adjust it according to specific research areas and problems. Second, this study is based on land use data to calculate regional habitat degradation degree and habitat quality, and other influencing factors have not been fully considered, so the indicators need to be further enriched and improved. Finally, due to the limitation of the research period, the spatial resolution of land cover data adopted in this study (30 m) is slightly coarse, and higher resolution land cover data (≥10 m) will be needed in the future to obtain more detailed information about land use change and habitat quality change. Future studies will gradually enrich and improve the construction system of habitat quality indicators and the spatial-temporal change characteristics of influencing factors so as to provide a better scientific basis and technical support for ecological, environmental protection, sustainable development, ecological security, and other aspects. In addition, the calculation time of the whole result is relatively long, about 5–8 h. The calculation cost depends on a number of factors, mainly including the size of the study area, the spatial resolution of the land use data, and the computer performance. The land use data used in the calculation process of this study are of medium spatial resolution (30 m). The computer configuration used in this study is the Intel i7 series CPU, 16 GB of RAM, 1 TB hard drive, and NVIDIA’s RTX series graphics card. The research area of this study is northwest China, including five provinces.
5 Conclusion
Based on the land use data of Northwest China from 1990 to 2022, this study first analyzed the transfer of land use area, dynamic attitude, and type in the past 33 years, and then analyzed the spatial-temporal characteristics and driving mechanisms of habitat quality and habitat degradation based on the InVEST model. The following conclusions were drawn:
Grassland and bareland are the main cover types in Northwest China. During the period 1990–2022, the land with the largest area change is construction land, and the area change rate is 11.69%.
During the period 1990–2022, impervious had a relatively high transfer rate in the past 33 years, especially during 1990–2000, when the transfer rate reached 50.89%, indicating that urban expansion has continuously encroachment on other land cover types. In the past 33 years, the Northwest of China has mainly been the mutual transformation of cropland, forest, grassland, and bareland, indicating that the continuous introduction of ecological protection, ecological restoration, and farmland to forest policies during the period 1990–2022 effectively drove the mutual transformation of these land types.
During the period 1990–2022, the maximum value of the habitat degradation index showed a trend of “increase–decrease–increase,” and its standard deviation increased from 0.0715 to 0.0794, indicating that the difference in habitat degradation level among grid units was gradually expanding. During the period of 1990–2022, the area proportion of higher-grade habitat quality in northwest China remained in the range of 54.58–9.29% and showed a gradually decreasing trend on the whole. The spatial pattern and distribution of habitat quality showed the distribution characteristics of “low in northwest and high in middle,” and the high- and higher-grade regions appeared in the mountainous and hilly areas of the inner land. In the recent 33 years, the areas with unchanged habitat quality were mainly concentrated in the central Gansu and Qinghai provinces, and the unchanged area was 24,33,600 km2.
There is a close relationship between land use change and habitat quality change. In the whole study area, the expansion of impervious in recent 33 years has led to the gradual enhancement of habitat degradation, and the change of land use type in the study area is basically consistent with the transfer of habitat quality. In addition, the rapid population growth and unreasonable human activities (such as overgrazing) in the past 33 years have indirectly affected the habitat quality in the northwest.
Acknowledgements
We thank the editor, the guest editors of the special issue, and anonymous reviewers who provided useful comments in improving this article.
-
Funding information: This study was supported by the Project of Philosophy and Social Science of Henan Province, Grant No. 2022BJJ026; the Project of Henan Province Science and Technology Research Program, Grant No. 242102320345; the Project of Soft Science Research Project of Henan Province, Grant No. 242400410624.
-
Author contributions: Feng Wen: conceptualization, writing original draft, data collection, and classifcation of the data and analysis. Wei Dong: analysis and writing. Fei Xu and Chunyang Lu: proofreading and project supervision.
-
Conflict of interest: The authors declare no conflicts of interest.
References
[1] Long H, Zhang Y, Tu S. Rural vitalization in China: A perspective of land consolidation. J Geographical Sci. 2019;29:517–30.10.1007/s11442-019-1599-9Suche in Google Scholar
[2] Zhou Y, Li X, Liu Y. Rural land system reforms in China: History, issues, measures and prospects. Land Use Policy. 2020;91:104330.10.1016/j.landusepol.2019.104330Suche in Google Scholar
[3] Li Y-y, Liu Y, Ranagalage M, Zhang H, Zhou R. Examining land use/land cover change and the summertime surface urban heat island effect in fast-growing greater hefei. ISPRS international journal of geo-information. 9, China: Implications for sustainable land development; 2020. p. 56810.3390/ijgi9100568Suche in Google Scholar
[4] Singh B, Venkatramanan V, Deshmukh B. Monitoring of land use land cover dynamics and prediction of urban growth using land change modeler in Delhi and its environs, India. Environ Sci Pollut Res. 2022;29:71534–54.10.1007/s11356-022-20900-zSuche in Google Scholar PubMed PubMed Central
[5] Dadashpoor H, Azizi P, Moghadasi M. Land use change, urbanization, and change in landscape pattern in a metropolitan area. Sci Total Environ. 2019;655:707–19.10.1016/j.scitotenv.2018.11.267Suche in Google Scholar PubMed
[6] Duan X, Chen Y, Wang L, Zheng G, Liang T. The impact of land use and land cover changes on the landscape pattern and ecosystem service value in Sanjiangyuan region of the Qinghai-Tibet Plateau. J Environ Manag. 2023;325:116539.10.1016/j.jenvman.2022.116539Suche in Google Scholar PubMed
[7] Kang J, Yang X, Wang Z, Huang C, Wang J. Collaborative extraction of paddy planting areas with multi-source information based on google earth engine: A case study of Cambodia. Remote Sens. 2022;14:1823.10.3390/rs14081823Suche in Google Scholar
[8] Kang J, Yang X, Wang Z, Cheng H, Wang J, Tang H, et al. Comparison of three ten meter land cover products in a Drought region: a case study in Northwestern China. Land. 2022;11:427.10.3390/land11030427Suche in Google Scholar
[9] Wang M, Wander M, Mueller S, Martin N, Dunn JB. Evaluation of survey and remote sensing data products used to estimate land use change in the United States: Evolving issues and emerging opportunities. Environ Sci Policy. 2022;129:68–78.10.1016/j.envsci.2021.12.021Suche in Google Scholar
[10] Wang J, Bretz M, Dewan MAA, Delavar MA. Machine learning in modelling land-use and land cover-change (LULCC): Current status, challenges and prospects. Sci Total Environ. 2022;822:153559.10.1016/j.scitotenv.2022.153559Suche in Google Scholar PubMed
[11] Wang J, Yang X, Wang Z, Cheng H, Kang J, Tang H, et al. Consistency analysis and accuracy assessment of three global ten-meter land cover products in rocky desertification region – a case study of Southwest China. ISPRS Int J Geo-Informat. 2022;11:202.10.3390/ijgi11030202Suche in Google Scholar
[12] Wang J, Wang Z, Cheng H, Kang J, Liu X. Land cover changing pattern in pre-and post-earthquake affected area from remote sensing data: A case Lushan County, Sichuan Province. Land. 2022;11:1205.10.3390/land11081205Suche in Google Scholar
[13] Weslati O, Bouaziz S, Sarbeji MM. Modelling and assessing the spatiotemporal changes to future land use change scenarios using remote sensing and CA-markov model in the mellegue catchment. J Indian Soc Remote Sens. 2023;51:9–29.10.1007/s12524-022-01618-4Suche in Google Scholar
[14] Chen J, Chen J, Liao A, Cao X, Chen L, Chen X, et al. Global land cover mapping at 30 m resolution: A POK-based operational approach. Isprs J Photogrammetry Remote Sens. 2015;103:7–27.10.1016/j.isprsjprs.2014.09.002Suche in Google Scholar
[15] Zhang X, Liu L, Chen X, Gao Y, Mi J. GLC_FCS30: Global land-cover product with fine classification system at 30 m using time-series Landsat imagery. Earth Syst Sci Data. 2021;13(6):2753–76.10.5194/essd-13-2753-2021Suche in Google Scholar
[16] Gong P, Liu H, Zhang MN, Li C, Wang J, Huang H, et al. Stable classification with limited sample: transferring a 30-m resolution sample set collected in 2015 to mapping 10-m resolution global land cover in 2017. Sci Bull. 2019;64(6):370–3.10.1016/j.scib.2019.03.002Suche in Google Scholar PubMed
[17] Kang J, Wang Z, Sui L, Yang X, Ma Y, Wang J. Consistency analysis of remote sensing land cover products in the tropical rainforest climate region: A case study of Indonesia. Remote Sens. 2020;12:1410.10.3390/rs12091410Suche in Google Scholar
[18] Bian Z, Zhang D, Xu J, Tang H, Bai Z, Li Y. Study on the evolution law of surface landscape pattern in earthquake-stricken areas by remote sensing: a case study of Jiuzhaigou County, Sichuan Province. Sustainability. 2022;14:13032.10.3390/su142013032Suche in Google Scholar
[19] Karimov Y, Musaev I, Mirzababayeva S, Abobakirova Z, Umarov S, Mirzaeva Z. Land use and land cover change dynamics of Uzbekistan: a review. In Proceedings of E3S Web of Conferences; p. 03007.10.1051/e3sconf/202342103007Suche in Google Scholar
[20] Habib W, Connolly J. A national-scale assessment of land use change in peatlands between 1989 and 2020 using landsat data and google earth engine—a case study of Ireland. Reg Environ Change. 2023;23:124.10.1007/s10113-023-02116-0Suche in Google Scholar PubMed PubMed Central
[21] Hussain S, Karuppannan S. Land use/land cover changes and their impact on land surface temperature using remote sensing technique in district Khanewal, Punjab Pakistan. Geol Ecol Landsc. 2023;7:46–58.10.1080/24749508.2021.1923272Suche in Google Scholar
[22] Chen T-L. Mapping temporal and spatial changes in land use and land surface temperature based on MODIS data. Environ Res. 2021;196:110424.10.1016/j.envres.2020.110424Suche in Google Scholar PubMed
[23] Ning J, Liu J, Kuang W, Xu X, Zhang S, Yan C, et al. Spatiotemporal patterns and characteristics of land-use change in China during 2010–2015. J Geograph Sci. 2018;28:547–62.10.1007/s11442-018-1490-0Suche in Google Scholar
[24] Nnaji CC, Ogarekpe NM, Nwankwo EJ. Temporal and spatial dynamics of land use and land cover changes in derived savannah hydrological basin of Enugu State, Nigeria. Environ Dev Sustainability. 2022;24(7):9598–622.10.1007/s10668-021-01840-zSuche in Google Scholar
[25] Long Q, Wang F, Ge W, Jiao F, Han J, Chen H, et al. Temporal and spatial change in vegetation and its interaction with climate change in Argentina from 1982 to 2015. Remote Sens. 2023;15:1926.10.3390/rs15071926Suche in Google Scholar
[26] Zhang Z, Li J, Lu Y, Yang L, Hu Z, Li C, et al. Temporal and spatial changes in land use and ecosystem service value based on SDGs’ reports: a case study of Dianchi Lake Basin, China. Environ Sci Pollut Res. 2023;30:31421–35.10.1007/s11356-022-24263-3Suche in Google Scholar PubMed
[27] Liu Y, Wu K, Cao H. Land-use change and its driving factors in Henan province from 1995 to 2015. Arab J Geosci. 2022;15:247.10.1007/s12517-022-09509-1Suche in Google Scholar
[28] Schmidt M. The Sankey diagram in energy and material flow management: part II: methodology and current applications. J Ind Ecol. 2008;12:173–85.10.1111/j.1530-9290.2008.00015.xSuche in Google Scholar
[29] Caro C, Marques JC, Cunha PP, Teixeira Z. Ecosystem services as a resilience descriptor in habitat risk assessment using the InVEST model. Ecol Indic. 2020;115:106426.10.1016/j.ecolind.2020.106426Suche in Google Scholar
[30] Wang B, Cheng W. Effects of land use/cover on regional habitat quality under different geomorphic types based on InVEST model. Remote Sens. 2022;14:1279.10.3390/rs14051279Suche in Google Scholar
[31] Tang F, Fu M, Wang L, Zhang P. Land-use change in Changli County, China: Predicting its spatio-temporal evolution in habitat quality. Ecol Indic. 2020;117:106719.10.1016/j.ecolind.2020.106719Suche in Google Scholar
[32] Li S, Dong B, Gao X, Xu H, Ren C, Liu Y, et al. Study on spatio-temporal evolution of habitat quality based on land-use change in Chongming Dongtan, China. Environ Earth Sci. 2022;81:220.10.1007/s12665-022-10324-wSuche in Google Scholar
[33] Ji X, Sun Y, Guo W, Zhao C, Li K. Land use and habitat quality change in the yellow river basin: A perspective with different CMIP6-based scenarios and multiple scales. J Environ Manag. 2023;345:118729.10.1016/j.jenvman.2023.118729Suche in Google Scholar PubMed
[34] Sun X, Jiang Z, Liu F, Zhang D. Monitoring spatio-temporal dynamics of habitat quality in Nansihu Lake basin, eastern China, from 1980 to 2015. Ecol Indic. 2019;102:716–23.10.1016/j.ecolind.2019.03.041Suche in Google Scholar
[35] Dai L, Li S, Lewis BJ, Wu J, Yu D, Zhou W, et al. The influence of land use change on the spatial–temporal variability of habitat quality between 1990 and 2010 in Northeast China. J Forestry Res. 2019;30:2227–36.10.1007/s11676-018-0771-xSuche in Google Scholar
[36] Wu J, Li X, Luo Y, Zhang D. Spatiotemporal effects of urban sprawl on habitat quality in the Pearl River Delta from 1990 to 2018. Sci Rep. 2021;11:13981.10.1038/s41598-021-92916-3Suche in Google Scholar PubMed PubMed Central
[37] Yang Y. Evolution of habitat quality and association with land-use changes in mountainous areas: A case study of the Taihang Mountains in Hebei Province, China. Ecol Indic. 2021;129:107967.10.1016/j.ecolind.2021.107967Suche in Google Scholar
[38] Ojima D, Galvin K, Turner B. The global impact of land-use change. BioScience. 1994;44:300–4.10.2307/1312379Suche in Google Scholar
[39] Lambin EF, Meyfroidt P. Land use transitions: Socio-ecological feedback versus socio-economic change. Land Use Policy. 2010;27:108–18.10.1016/j.landusepol.2009.09.003Suche in Google Scholar
[40] Liu J, Kuang W, Zhang Z, Xu X, Qin Y, Ning J, et al. Spatiotemporal characteristics, patterns, and causes of land-use changes in China since the late 1980s. J Geograph Sci. 2014;24:195–210.10.1007/s11442-014-1082-6Suche in Google Scholar
[41] Mustard JF, Defries RS, Fisher T, Moran E. Land-use and land-cover change pathways and impacts. Land change science: Observing, monitoring and understanding trajectories of change on the earth’s surface. Dordrecht: Springer Netherlands; 2012. p. 411–429.10.1007/978-1-4020-2562-4_24Suche in Google Scholar
[42] Feng Q, Tian Y, Yu T, Yin Z, Cao S. Combating desertification through economic development in northwestern China. Land Degrad & Dev. 2019;30:910–7.10.1002/ldr.3277Suche in Google Scholar
[43] Li J, Xu C, Chen M, Sun W. Balanced development: Nature environment and economic and social power in China. J Clean Prod. 2019;210:181–9.10.1016/j.jclepro.2018.10.293Suche in Google Scholar
[44] Li Z, Ma Z, Zhou G. Impact of land use change on habitat quality and regional biodiversity capacity: Temporal and spatial evolution and prediction analysis. Front Environ Sci. 2022;10:1041573.10.3389/fenvs.2022.1041573Suche in Google Scholar
[45] Yang L, Zhao J, Zhu J, Liu L, Zhang P. Spatial and temporal variation and prediction of ecosystem carbon storage in Xi’an based on PLUS and InVEST model. Remote Sens Nat Resour. 2022;19:16059.Suche in Google Scholar
[46] Li X, Huang C, Jin H, Han Y, Kang S, Liu J, et al. Spatio-temporal patterns of carbon storage derived using the InVEST model in Heilongjiang Province, Northeast China. Front Earth Sci. 2022;10:846456.10.3389/feart.2022.846456Suche in Google Scholar
[47] Huang M, Yue W, Feng S, Zhang J. Spatial-temporal evolution of habitat quality and analysis of landscape patterns in Dabie Mountain area of west Anhui province based on InVEST model. Acta Ecol Sin. 2020;40:2895–906.10.5846/stxb201904260858Suche in Google Scholar
[48] Gong J, Xie Y, Cao E, Huang Q, Li H. Integration of InVEST-habitat quality model with landscape pattern indexes to assess mountain plant biodiversity change: A case study of Bailongjiang watershed in Gansu Province. J Geograph Sci. 2019;29:1193–210.10.1007/s11442-019-1653-7Suche in Google Scholar
[49] Wu D, Zhu K, Zhang S, Huang C, Li J. Evolution Analysis of carbon storage in Chengdu-Chongqing economic zone based on PLUS model and InVEST model. Ecol Env Monit Three Gorges. 2022;7:1–18.Suche in Google Scholar
[50] Liu G. Formation and evolution mechanism of ecological security pattern in Southwest China. Acta Ecol Sin. 2016;36:7088–91.10.5846/stxb201611212364Suche in Google Scholar
[51] Han Y, Chen K, Yu D. Evaluation on the impact of land use change on habitat quality in Qinghai Lake Basin. Ecol Environ. 2019;28:2035.Suche in Google Scholar
[52] Gu L, Yan J, Li Y, Gong Z. Spatial–temporal evolution and correlation analysis between habitat quality and landscape patterns based on land use change in Shaanxi Province, China. Ecol Evol. 2023;13:e10657.10.1002/ece3.10657Suche in Google Scholar PubMed PubMed Central
© 2025 the author(s), published by De Gruyter
This work is licensed under the Creative Commons Attribution 4.0 International License.
Artikel in diesem Heft
- Research Articles
- Seismic response and damage model analysis of rocky slopes with weak interlayers
- Multi-scenario simulation and eco-environmental effect analysis of “Production–Living–Ecological space” based on PLUS model: A case study of Anyang City
- Remote sensing estimation of chlorophyll content in rape leaves in Weibei dryland region of China
- GIS-based frequency ratio and Shannon entropy modeling for landslide susceptibility mapping: A case study in Kundah Taluk, Nilgiris District, India
- Natural gas origin and accumulation of the Changxing–Feixianguan Formation in the Puguang area, China
- Spatial variations of shear-wave velocity anomaly derived from Love wave ambient noise seismic tomography along Lembang Fault (West Java, Indonesia)
- Evaluation of cumulative rainfall and rainfall event–duration threshold based on triggering and non-triggering rainfalls: Northern Thailand case
- Pixel and region-oriented classification of Sentinel-2 imagery to assess LULC dynamics and their climate impact in Nowshera, Pakistan
- The use of radar-optical remote sensing data and geographic information system–analytical hierarchy process–multicriteria decision analysis techniques for revealing groundwater recharge prospective zones in arid-semi arid lands
- Effect of pore throats on the reservoir quality of tight sandstone: A case study of the Yanchang Formation in the Zhidan area, Ordos Basin
- Hydroelectric simulation of the phreatic water response of mining cracked soil based on microbial solidification
- Spatial-temporal evolution of habitat quality in tropical monsoon climate region based on “pattern–process–quality” – a case study of Cambodia
- Early Permian to Middle Triassic Formation petroleum potentials of Sydney Basin, Australia: A geochemical analysis
- Micro-mechanism analysis of Zhongchuan loess liquefaction disaster induced by Jishishan M6.2 earthquake in 2023
- Prediction method of S-wave velocities in tight sandstone reservoirs – a case study of CO2 geological storage area in Ordos Basin
- Ecological restoration in valley area of semiarid region damaged by shallow buried coal seam mining
- Hydrocarbon-generating characteristics of Xujiahe coal-bearing source rocks in the continuous sedimentary environment of the Southwest Sichuan
- Hazard analysis of future surface displacements on active faults based on the recurrence interval of strong earthquakes
- Structural characterization of the Zalm district, West Saudi Arabia, using aeromagnetic data: An approach for gold mineral exploration
- Research on the variation in the Shields curve of silt initiation
- Reuse of agricultural drainage water and wastewater for crop irrigation in southeastern Algeria
- Assessing the effectiveness of utilizing low-cost inertial measurement unit sensors for producing as-built plans
- Analysis of the formation process of a natural fertilizer in the loess area
- Machine learning methods for landslide mapping studies: A comparative study of SVM and RF algorithms in the Oued Aoulai watershed (Morocco)
- Chemical dissolution and the source of salt efflorescence in weathering of sandstone cultural relics
- Molecular simulation of methane adsorption capacity in transitional shale – a case study of Longtan Formation shale in Southern Sichuan Basin, SW China
- Evolution characteristics of extreme maximum temperature events in Central China and adaptation strategies under different future warming scenarios
- Estimating Bowen ratio in local environment based on satellite imagery
- 3D fusion modeling of multi-scale geological structures based on subdivision-NURBS surfaces and stratigraphic sequence formalization
- Comparative analysis of machine learning algorithms in Google Earth Engine for urban land use dynamics in rapidly urbanizing South Asian cities
- Study on the mechanism of plant root influence on soil properties in expansive soil areas
- Simulation of seismic hazard parameters and earthquakes source mechanisms along the Red Sea rift, western Saudi Arabia
- Tectonics vs sedimentation in foredeep basins: A tale from the Oligo-Miocene Monte Falterona Formation (Northern Apennines, Italy)
- Investigation of landslide areas in Tokat-Almus road between Bakımlı-Almus by the PS-InSAR method (Türkiye)
- Predicting coastal variations in non-storm conditions with machine learning
- Cross-dimensional adaptivity research on a 3D earth observation data cube model
- Geochronology and geochemistry of late Paleozoic volcanic rocks in eastern Inner Mongolia and their geological significance
- Spatial and temporal evolution of land use and habitat quality in arid regions – a case of Northwest China
- Ground-penetrating radar imaging of subsurface karst features controlling water leakage across Wadi Namar dam, south Riyadh, Saudi Arabia
- Rayleigh wave dispersion inversion via modified sine cosine algorithm: Application to Hangzhou, China passive surface wave data
- Fractal insights into permeability control by pore structure in tight sandstone reservoirs, Heshui area, Ordos Basin
- Debris flow hazard characteristic and mitigation in Yusitong Gully, Hengduan Mountainous Region
- Research on community characteristics of vegetation restoration in hilly power engineering based on multi temporal remote sensing technology
- Identification of radial drainage networks based on topographic and geometric features
- Trace elements and melt inclusion in zircon within the Qunji porphyry Cu deposit: Application to the metallogenic potential of the reduced magma-hydrothermal system
- Pore, fracture characteristics and diagenetic evolution of medium-maturity marine shales from the Silurian Longmaxi Formation, NE Sichuan Basin, China
- Study of the earthquakes source parameters, site response, and path attenuation using P and S-waves spectral inversion, Aswan region, south Egypt
- Source of contamination and assessment of potential health risks of potentially toxic metal(loid)s in agricultural soil from Al Lith, Saudi Arabia
- Regional spatiotemporal evolution and influencing factors of rural construction areas in the Nanxi River Basin via GIS
- An efficient network for object detection in scale-imbalanced remote sensing images
- Effect of microscopic pore–throat structure heterogeneity on waterflooding seepage characteristics of tight sandstone reservoirs
- Environmental health risk assessment of Zn, Cd, Pb, Fe, and Co in coastal sediments of the southeastern Gulf of Aqaba
- A modified Hoek–Brown model considering softening effects and its applications
- Evaluation of engineering properties of soil for sustainable urban development
- The spatio-temporal characteristics and influencing factors of sustainable development in China’s provincial areas
- Application of a mixed additive and multiplicative random error model to generate DTM products from LiDAR data
- Gold vein mineralogy and oxygen isotopes of Wadi Abu Khusheiba, Jordan
- Prediction of surface deformation time series in closed mines based on LSTM and optimization algorithms
- 2D–3D Geological features collaborative identification of surrounding rock structural planes in hydraulic adit based on OC-AINet
- Spatiotemporal patterns and drivers of Chl-a in Chinese lakes between 1986 and 2023
- Land use classification through fusion of remote sensing images and multi-source data
- Nexus between renewable energy, technological innovation, and carbon dioxide emissions in Saudi Arabia
- Analysis of the spillover effects of green organic transformation on sustainable development in ethnic regions’ agriculture and animal husbandry
- Factors impacting spatial distribution of black and odorous water bodies in Hebei
- Large-scale shaking table tests on the liquefaction and deformation responses of an ultra-deep overburden
- Impacts of climate change and sea-level rise on the coastal geological environment of Quang Nam province, Vietnam
- Reservoir characterization and exploration potential of shale reservoir near denudation area: A case study of Ordovician–Silurian marine shale, China
- Seismic prediction of Permian volcanic rock reservoirs in Southwest Sichuan Basin
- Application of CBERS-04 IRS data to land surface temperature inversion: A case study based on Minqin arid area
- Geological characteristics and prospecting direction of Sanjiaoding gold mine in Saishiteng area
- Research on the deformation prediction model of surrounding rock based on SSA-VMD-GRU
- Geochronology, geochemical characteristics, and tectonic significance of the granites, Menghewula, Southern Great Xing’an range
- Hazard classification of active faults in Yunnan base on probabilistic seismic hazard assessment
- Characteristics analysis of hydrate reservoirs with different geological structures developed by vertical well depressurization
- Estimating the travel distance of channelized rock avalanches using genetic programming method
- Landscape preferences of hikers in Three Parallel Rivers Region and its adjacent regions by content analysis of user-generated photography
- New age constraints of the LGM onset in the Bohemian Forest – Central Europe
- Characteristics of geological evolution based on the multifractal singularity theory: A case study of Heyu granite and Mesozoic tectonics
- Soil water content and longitudinal microbiota distribution in disturbed areas of tower foundations of power transmission and transformation projects
- Oil accumulation process of the Kongdian reservoir in the deep subsag zone of the Cangdong Sag, Bohai Bay Basin, China
- Investigation of velocity profile in rock–ice avalanche by particle image velocimetry measurement
- Optimizing 3D seismic survey geometries using ray tracing and illumination modeling: A case study from Penobscot field
- Sedimentology of the Phra That and Pha Daeng Formations: A preliminary evaluation of geological CO2 storage potential in the Lampang Basin, Thailand
- Improved classification algorithm for hyperspectral remote sensing images based on the hybrid spectral network model
- Map analysis of soil erodibility rates and gully erosion sites in Anambra State, South Eastern Nigeria
- Identification and driving mechanism of land use conflict in China’s South-North transition zone: A case study of Huaihe River Basin
- Evaluation of the impact of land-use change on earthquake risk distribution in different periods: An empirical analysis from Sichuan Province
- A test site case study on the long-term behavior of geotextile tubes
- An experimental investigation into carbon dioxide flooding and rock dissolution in low-permeability reservoirs of the South China Sea
- Detection and semi-quantitative analysis of naphthenic acids in coal and gangue from mining areas in China
- Comparative effects of olivine and sand on KOH-treated clayey soil
- YOLO-MC: An algorithm for early forest fire recognition based on drone image
- Earthquake building damage classification based on full suite of Sentinel-1 features
- Potential landslide detection and influencing factors analysis in the upper Yellow River based on SBAS-InSAR technology
- Assessing green area changes in Najran City, Saudi Arabia (2013–2022) using hybrid deep learning techniques
- An advanced approach integrating methods to estimate hydraulic conductivity of different soil types supported by a machine learning model
- Hybrid methods for land use and land cover classification using remote sensing and combined spectral feature extraction: A case study of Najran City, KSA
- Streamlining digital elevation model construction from historical aerial photographs: The impact of reference elevation data on spatial accuracy
- Analysis of urban expansion patterns in the Yangtze River Delta based on the fusion impervious surfaces dataset
- A metaverse-based visual analysis approach for 3D reservoir models
- Late Quaternary record of 100 ka depositional cycles on the Larache shelf (NW Morocco)
- Integrated well-seismic analysis of sedimentary facies distribution: A case study from the Mesoproterozoic, Ordos Basin, China
- Study on the spatial equilibrium of cultural and tourism resources in Macao, China
- Urban road surface condition detecting and integrating based on the mobile sensing framework with multi-modal sensors
- Application of improved sine cosine algorithm with chaotic mapping and novel updating methods for joint inversion of resistivity and surface wave data
- The synergistic use of AHP and GIS to assess factors driving forest fire potential in a peat swamp forest in Thailand
- Dynamic response analysis and comprehensive evaluation of cement-improved aeolian sand roadbed
- Rock control on evolution of Khorat Cuesta, Khorat UNESCO Geopark, Northeastern Thailand
- Gradient response mechanism of carbon storage: Spatiotemporal analysis of economic-ecological dimensions based on hybrid machine learning
- Comparison of several seismic active earth pressure calculation methods for retaining structures
- Mantle dynamics and petrogenesis of Gomer basalts in the Northwestern Ethiopia: A geochemical perspective
- Study on ground deformation monitoring in Xiong’an New Area from 2021 to 2023 based on DS-InSAR
- Paleoenvironmental characteristics of continental shale and its significance to organic matter enrichment: Taking the fifth member of Xujiahe Formation in Tianfu area of Sichuan Basin as an example
- Equipping the integral approach with generalized least squares to reconstruct relict channel profile and its usage in the Shanxi Rift, northern China
- InSAR-driven landslide hazard assessment along highways in hilly regions: A case-based validation approach
- Attribution analysis of multi-temporal scale surface streamflow changes in the Ganjiang River based on a multi-temporal Budyko framework
- Maps analysis of Najran City, Saudi Arabia to enhance agricultural development using hybrid system of ANN and multi-CNN models
- Hybrid deep learning with a random forest system for sustainable agricultural land cover classification using DEM in Najran, Saudi Arabia
- Long-term evolution patterns of groundwater depth and lagged response to precipitation in a complex aquifer system: Insights from Huaibei Region, China
- Remote sensing and machine learning for lithology and mineral detection in NW, Pakistan
- Spatial–temporal variations of NO2 pollution in Shandong Province based on Sentinel-5P satellite data and influencing factors
- Numerical modeling of geothermal energy piles with sensitivity and parameter variation analysis of a case study
- Stability analysis of valley-type upstream tailings dams using a 3D model
- Variation characteristics and attribution analysis of actual evaporation at monthly time scale from 1982 to 2019 in Jialing River Basin, China
- Investigating machine learning and statistical approaches for landslide susceptibility mapping in Minfeng County, Xinjiang
- Investigating spatiotemporal patterns for comprehensive accessibility of service facilities by location-based service data in Nanjing (2016–2022)
- A pre-treatment method for particle size analysis of fine-grained sedimentary rocks, Bohai Bay Basin, China
- Study on the formation mechanism of the hard-shell layer of liquefied silty soil
- Comprehensive analysis of agricultural CEE: Efficiency assessment, mechanism identification, and policy response – A case study of Anhui Province
- Simulation study on the damage and failure mechanism of the surrounding rock in sanded dolomite tunnels
- Towards carbon neutrality: Spatiotemporal evolution and key influences on agricultural ecological efficiency in Northwest China
- High-frequency cycles drive the cyclical enrichment of oil in porous carbonate reservoirs: A case study of the Khasib Formation in E Oilfield, Mesopotamian Basin, Iraq
- Reconstruction of digital core models of granular rocks using mathematical morphology
- Spatial–temporal differentiation law of habitat quality and its driving mechanism in the typical plateau areas of the Loess Plateau in the recent 30 years
- A machine-learning-based approach to predict potential oil sites: Conceptual framework and experimental evaluation
- Effects of landscape pattern change on waterbird diversity in Xianghai Nature Reserve
- Research on intelligent classification method of highway tunnel surrounding rock classification based on parameters while drilling
- River morphology and tectono-sedimentary analysis of a shallow river delta: A case study of Putaohua oil layer in Saertu oilfield (L. Cretaceous), China
- Review Articles
- Humic substances influence on the distribution of dissolved iron in seawater: A review of electrochemical methods and other techniques
- Applications of physics-informed neural networks in geosciences: From basic seismology to comprehensive environmental studies
- Ore-controlling structures of granite-related uranium deposits in South China: A review
- Shallow geological structure features in Balikpapan Bay East Kalimantan Province – Indonesia
- A review on the tectonic affinity of microcontinents and evolution of the Proto-Tethys Ocean in Northeastern Tibet
- Advancements in machine learning applications for mineral prospecting and geophysical inversion: A review
- Special Issue: Natural Resources and Environmental Risks: Towards a Sustainable Future - Part II
- Depopulation in the Visok micro-region: Toward demographic and economic revitalization
- Special Issue: Geospatial and Environmental Dynamics - Part II
- Advancing urban sustainability: Applying GIS technologies to assess SDG indicators – a case study of Podgorica (Montenegro)
- Spatiotemporal and trend analysis of common cancers in men in Central Serbia (1999–2021)
- Minerals for the green agenda, implications, stalemates, and alternatives
- Spatiotemporal water quality analysis of Vrana Lake, Croatia
- Functional transformation of settlements in coal exploitation zones: A case study of the municipality of Stanari in Republic of Srpska (Bosnia and Herzegovina)
- Hypertension in AP Vojvodina (Northern Serbia): A spatio-temporal analysis of patients at the Institute for Cardiovascular Diseases of Vojvodina
- Regional patterns in cause-specific mortality in Montenegro, 1991–2019
- Spatio-temporal analysis of flood events using GIS and remote sensing-based approach in the Ukrina River Basin, Bosnia and Herzegovina
- Flash flood susceptibility mapping using LiDAR-Derived DEM and machine learning algorithms: Ljuboviđa case study, Serbia
- Geocultural heritage as a basis for geotourism development: Banjska Monastery, Zvečan (Serbia)
- Assessment of groundwater potential zones using GIS and AHP techniques – A case study of the zone of influence of Kolubara Mining Basin
- Impact of the agri-geographical transformation of rural settlements on the geospatial dynamics of soil erosion intensity in municipalities of Central Serbia
- Where faith meets geomorphology: The cultural and religious significance of geodiversity explored through geospatial technologies
- Applications of local climate zone classification in European cities: A review of in situ and mobile monitoring methods in urban climate studies
- Complex multivariate water quality impact assessment on Krivaja River
- Ionization hotspots near waterfalls in Eastern Serbia’s Stara Planina Mountain
- Shift in landscape use strategies during the transition from the Bronze age to Iron age in Northwest Serbia
- Assessing the geotourism potential of glacial lakes in Plav, Montenegro: A multi-criteria assessment by using the M-GAM model
- Flash flood potential index at national scale: Susceptibility assessment within catchments
- SWAT modelling and MCDM for spatial valuation in small hydropower planning
- Disaster risk perception and local resilience near the “Duboko” landfill: Challenges of governance, management, trust, and environmental communication in Serbia