Discharge coefficient and energy dissipation on stepped weir
-
Samaa H. Hantoosh
 und
Mohammed S. Shamkhi
und
Mohammed S. Shamkhi

Abstract
High volumes of kinetic energy are generated as water is transported to the dam downstream. Stepped weir are some of the best in lowering the kinetic energy of a flow traveling downstream. In stepped weirs, the steps’ design can impact how much of the flow’s kinetic energy is transferred downstream. Because these weirs could dissipate more power, recently, pooled designs have been more common than smooth ones. Therefore, this work investigated the impact of sills at the ends-edge of the steps and discharge values on flow patterns, particularly energy dissipation. Seventy-five experiments were conducted and five models were used with a slope angle of 35° with different step dimensions, different numbers of steps (14, 10, 7, 5, and 3), and other discharges. Three-step configurations were used: flat, fully pooled, and zigzag pooled steps. The results indicated that increasing the number of steps increased the energy dissipation rate. In addition, an increase in the discharge leads to an increase in the discharge coefficient and thus decreases the energy dissipation rate. A coefficient of determination
1 Introduction
According to the needs and characteristics of the area, many hydraulic structures are built in open channels [1]. One of these structures, the weir, is used to measure discharge and the depth of rising water in irrigation channels [2,3,4]. The weir channel is typically one of a dam’s most essential aspects. The weir channel offers a practical and secure method of transferring flood flows to the region downstream of the barriers [5]. Stepped weirs have become common hydraulic structures in recent years, with steps on their faces running from close to the crest to the toe [6]. The efforts substantially accelerate the rate of energy dissipation on the weir surface. Stilling basin length should be as small as possible to minimize the required downstream energy dissipation basin size. However, using a stepped weir can reduce cavitation risk by boosting self-aerated flow compared to more traditional smooth weirs [7,8,9,10]. According to the discharge and the stepped weir’s dimensions, flow over a stepped weir can be generally classified into three flow patterns: nappe, transition, and skimming. The various features of each flow pattern choose the flow pattern as an essential component in the construction of stepped spillways [11,12]. The first, a sequence of little successive falls, occurs for low discharger flow rates and/or essential step lengths. The transition flow regime, which was initially introduced, happens for various intermediate discharges when transitioning from the nappe flow to the skimming flow [13]. This regime’s most distinguishing feature is the presence of horizontal step-face stagnation and significant splashing. A skimming flow system is formed when the flowing water completely submerges the steps. Usually, horizontal-axis recirculation zones are formed between the outer edges of the step, which are created for efficient flow rates and short step lengths [14].
Since each step serves as a small stilling basin for low discharges, most of the flow energy is dissipated over the steps [15].
The research focuses on identifying the relationship between discharge coefficient, energy dissipation, and relative discharges and how the arrangement of the step affects the discharge coefficient and energy loss.
2 Theoretical study
2.1 Energy dissipation
The energy between the inlet section and the approach channel of the weir can be used to calculate and measure the energy dissipation E 0 and any area of an intriguing phase E, as shown in Figure 1.
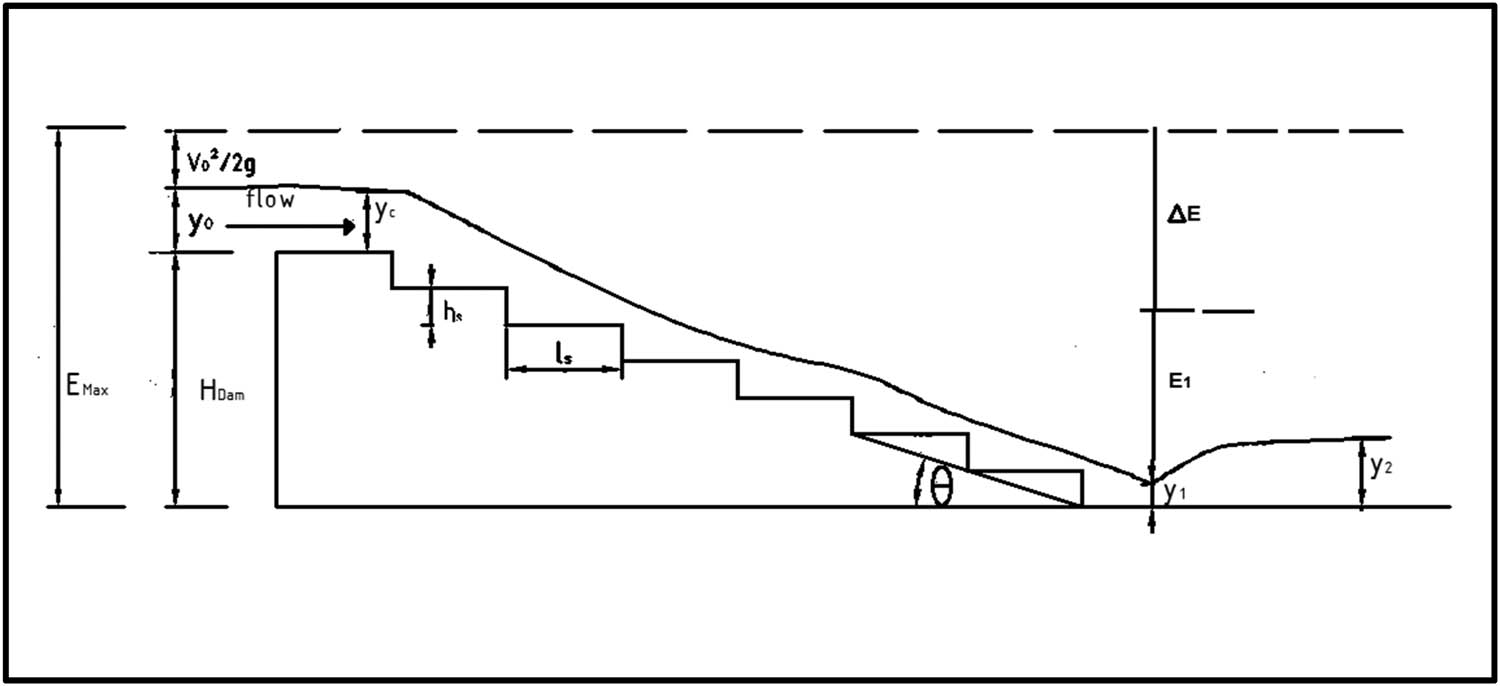
Variables used in calculating energy dissipation.
Along with the datum, the section on the significant step is also superimposed. The velocity head and depth flow, which are measured vertically from the datum, combine the energy
The energy loss
2.2 Dimensional analysis
Energy dissipation of hydraulic jump downstream stepped weir was affected by several factors, including geometric characteristics of the stepped weir (such as the width of the stepped weir [W], the height of the weir
Thus, the energy dissipation of flow is a function of these variables:
By multiplying the non-dimensional parameters according to Buckingham’s theory, the aforementioned variables can be decreased, and equation (3) can be expressed as follows:
Dimensionless characteristics are necessary for the investigation of energy dissipation in spillways.
2.3 Discharge coefficient
Horton [16] proposed that discharge coefficient,
Long-crested weir (0 <
Broad crested weir (0.1 <
Short crested weir (0.4 <
Sharp crested weir (
3 Experimental work
All experiments were performed at the hydraulic laboratory of the Middle Technical University at Kut Technical Institute in Iraq, as shown in Figure 2 [18], using a laboratory flume of 12 m long, 50 cm high, and 50 cm wide. The flume obtains water from a permanent upper tank through a 6-inch pump tube. This is located at a 90° angle at the water outlet from the upper tank. The three-point carriages in the channel are used to measure the height of the point with an accuracy of 0.5 mm [19]. The examined stepped weir models were created from foam, as seen in Figure 3. The total height, width, and length of the crest, and slope of the weir are all the same for all models and are 35, 50, 50, 10 cm, and 35°, respectively. Each model had a different length, height, and number of steps. Five discharge pumps (7, 12, 15, 20, and 25 L/s) for each model during 75 experiments were done in the free flow state, as indicated in more detail in Table 1. The study investigated three steps: flat, pooled, and zigzag. The formula gives the dimensions of the step

Experimental setup for stepped weir.

Experimental models (
Dimensions of the stepped weir models
| Model type of step | Model | No. of steps | Dimension of steps | Dimension of pooled steps | ||||
|---|---|---|---|---|---|---|---|---|
|
|
|
|
|
|
|
|||
| Flat step | A1 | 14 | 2.5 | 3.6 | 50 | — | — | — |
| B1 | 10 | 3.5 | 5 | |||||
| C1 | 7 | 5 | 7.1 | |||||
| D1 | 5 | 7 | 10 | |||||
| E1 | 3 | 11.7 | 16.6 | |||||
| Fully pooled step | A2 | 14 | 2.5 | 3.6 | 50 | 1.5 | 1 | 50 |
| B2 | 10 | 3.5 | 5 | |||||
| C2 | 7 | 5 | 7.1 | |||||
| D2 | 5 | 7 | 10 | |||||
| E2 | 3 | 11.7 | 16.6 | |||||
| Zigzag pooled step | A3 | 14 | 2.5 | 3.6 | 50 | 1.5 | 1 | 16.5 |
| B3 | 10 | 3.5 | 5 | |||||
| C3 | 7 | 5 | 7.1 | |||||
| D3 | 5 | 7 | 10 | |||||
| E3 | 3 | 11.7 | 16.6 | |||||
4 Discussions and analysis of results
The laboratory observations of the effect of step number, step geometry, step end-sill shape, and discharge on energy dissipation on the step, as well as establishing a relationship between energy dissipation and the ratio of the critical depth flow to step height

Flow patterns over the stepped weir. (a) Nappe flow (N s = 3, Q = 12 L/s); (b) transition flow (N s = 7, Q = 15 L/s); and (c) skimming flow (N s = 10, Q = 25 L/s).
Observed is the fact that the nappe flow occurred at step 3 with a significant step height and low discharge, while the transitional flow occurred at the intermediate discharge and actions (5 and 7).
As for the skimming flow, it was in steps 14 and 10 with a small step height and at all discharges.
The flow energy dispersed over a stepped weir in steps 14, 10, 7, 5, and 3 was depicted as a function of distance from critical flow depth (
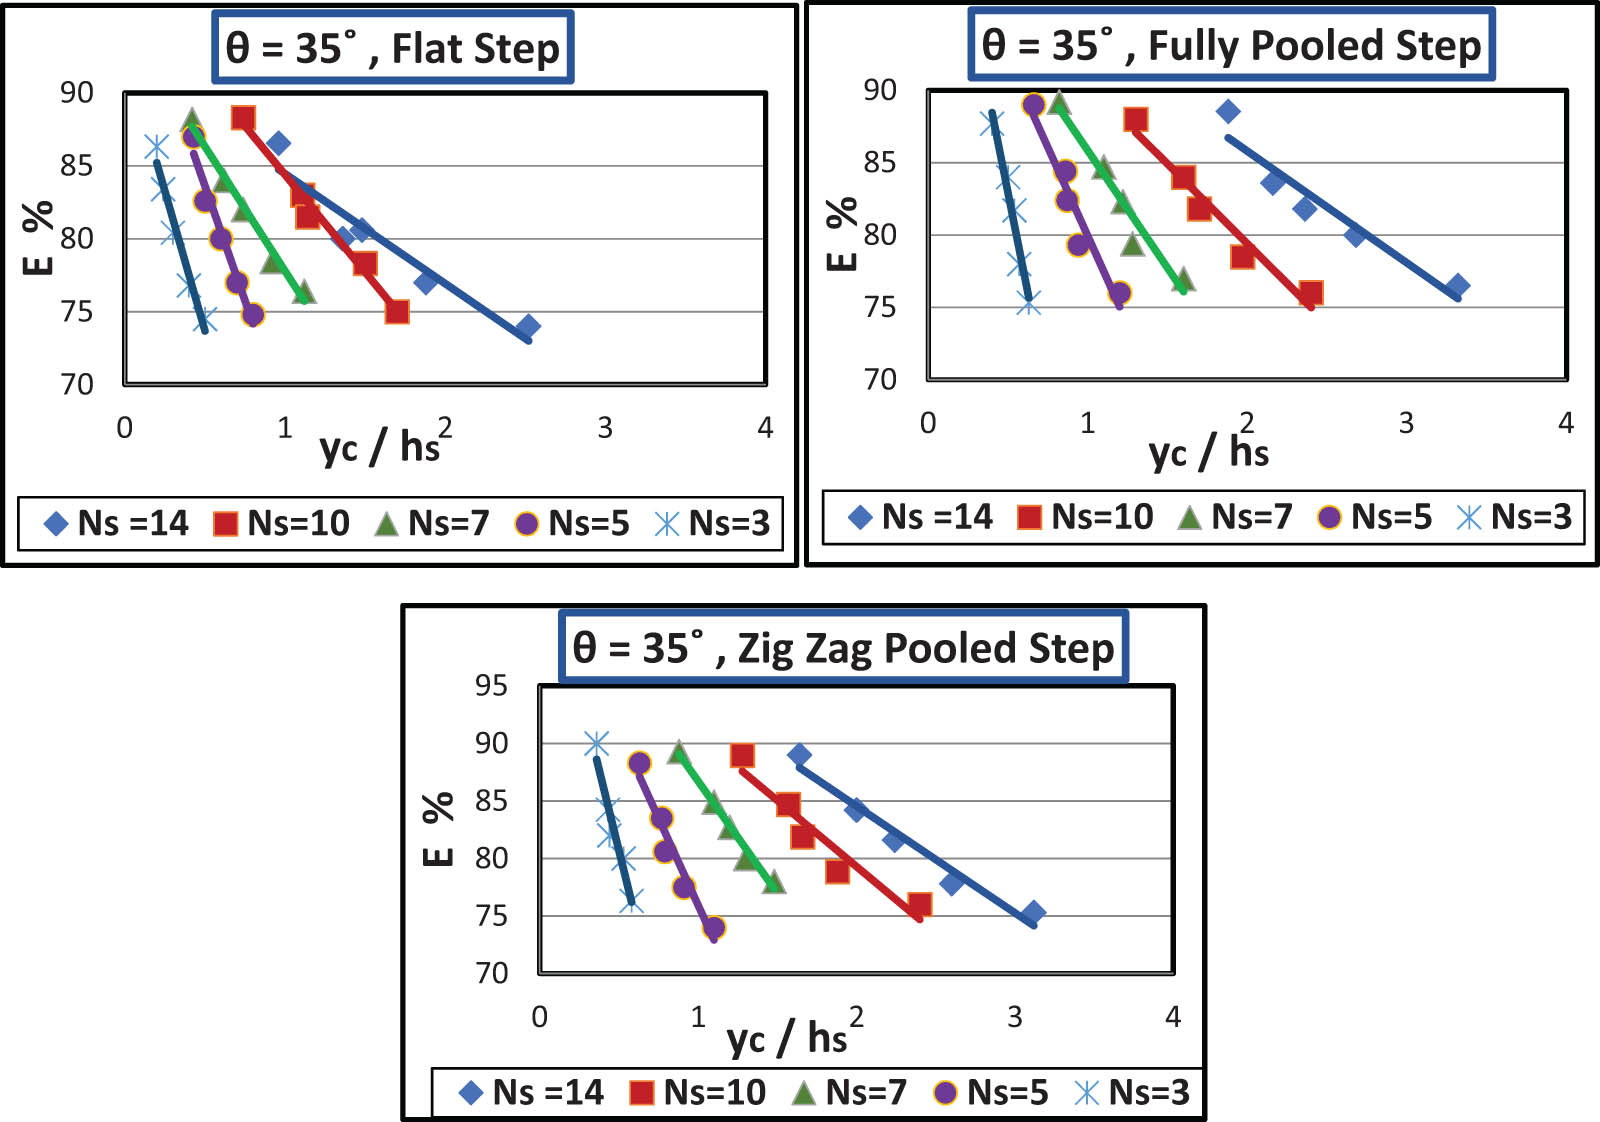
The relative energy loss with
The results additionally showed the relationship between the length step-to-the critical depth flow ratio (

The relative energy loss with
The pooled steps have dissipated energy more than flat and zigzag pooled stages. With the entire end-sill in phases, the relative energy loss rises by 5% since the characteristic height of the end-sill increases the amount of water trapped. The hydraulic jump and the impact of the jet on the step face account for the majority of energy loss in the nappe flow, so the characteristic height has less of an effect there. However, the characteristic height has a more significant influence on the transition flow than on the nappe flow, and its impact on the skimming flow is evident.
According to the ratio (
The
for 0.5 <

Relationship between discharge coefficient and

Relationship between discharge coefficient and discharge.

Energy dissipation with discharge coefficient.
5 Conclusions
These tests showed that as the number of steps increased, the relative dissipation of energy increased due to the high level of roughness of the steps, which increased friction and caused the conversion of kinetic energy into thermal energy. The flow patterns on the stepped weir are affected by the discharge flow rate, where nappe flow occurred at a few discharges. With increasing discharge, the critical flow depth increases, and the flow becomes skimming. The height of the sills at the ends-edge of the steps affects the amount of energy dissipation compared to flat steps. Fully pooled steps dissipate more energy than zigzag pooled steps. Also, more discharge leads to a larger discharge coefficient, which reduces the amount of energy dissipation.
List of symbols
| Parameters | Unit | |
|---|---|---|
|
|
Height of weir | m |
| W | Width of weir | m |
|
|
Length of crest | m |
|
|
Depth flow upstream | m |
|
|
Critical depth | m |
|
|
Depth flow before hydraulic jump | m |
|
|
Depth flow after hydraulic jump | m |
|
|
Velocity | m/s |
|
|
Local mean velocity | m/s |
|
|
Step height | m |
|
|
Step length | m |
|
|
Width of step | m |
|
|
Height of pooled | m |
|
|
Length of pooled | m |
|
|
Width of pooled | m |
|
|
Number of steps | — |
|
|
Slope of weir | — |
|
|
Acceleration gravity | m/
|
|
|
Froude number | — |
|
|
Discharge coefficient | — |
|
|
Discharge flow |
|
| E o | Head upstream of the weir | m |
|
|
Local energy head | m |
|
|
The difference between energy upstream and downstream of the weir | m |
|
|
Flow energy dissipation ratio | — |
-
Conflict of interest: The authors state no conflict of interest.
-
Data availability statement: Most datasets generated and analyzed in this study are comprised in this submitted manuscript. The other datasets are available on a reasonable request from the corresponding author with the attached information.
References
[1] Majeed HQ, Abed BS, Shamkhi MS. CFD simulation for the operation effect of gates openings of al-hay regulator on the local erosion. J Eng Sci Technol. 2021;16(2):1098–109.Suche in Google Scholar
[2] Shamkhi MS, Tuama RJ, Neama NM. Stage–discharge relationships of combined flow over broad crested weir and bottom opening utilizing incomplete self-similarly technique. J Eng Sci Technol. 2022;(Special Issue on RSAEAS):10–19.10.31185/ejuow.Vol10.Iss2.250Suche in Google Scholar
[3] Shamkhi MS, Azeez MK, Obeid ZH. Deriving rainfall intensity–duration–frequency (IDF) curves and testing the best distribution using Easy Fit software 5.5 for Kut city, Iraq. Open Eng. 2022;12(1):834–43.10.1515/eng-2022-0330Suche in Google Scholar
[4] Altalib AN. Discharge coefficient of flow over Al-Shalalat stepped weir on Al-Khusr River. Appl Water Sci. 2021;11(2):16.10.1007/s13201-020-01342-9Suche in Google Scholar
[5] Azhdary Moghaddam M. The hydraulics of ogee stepped spillway profile. Department of Civil Engineering Faculty of Engineering University of Ottawa Ottawa, Canada; 1997.Suche in Google Scholar
[6] Vischer D, Hager WH. Dam hydraulics. vol. 2, Chichester: Wiley; 1998.Suche in Google Scholar
[7] Peterka AJ. The effect of entrained air on cavitation pitting. In: Proceedings: Minnesota International Hydraulic Convention. ASCE; 1953. p. 18–50.Suche in Google Scholar
[8] Boes RM, Hager WH. Two-phase flow characteristics of stepped spillways. J Hydraulic Eng. 2003;129(9):661–700.10.1061/(ASCE)0733-9429(2003)129:9(661)Suche in Google Scholar
[9] Al-Dikheeli MR, Thaib HM, Alasadi LA. Mechanical properties and freeze-thaw resistance of lightweight aggregate concrete using artificial clay aggregate. Open Eng. 2022;12(1):323–11.10.1515/eng-2022-0019Suche in Google Scholar
[10] Felder S, Chanson H. Effects of step pool porosity upon flow aeration and energy dissipation on pooled stepped spillways. J Hydraulic Eng. 2014;140(4):04014002.10.1061/(ASCE)HY.1943-7900.0000858Suche in Google Scholar
[11] Alghazali NOS, Jasim SM. Experimental study on the limits of flow regimes for different configurations of stepped spillway. Civ Environ Res. 2014;6(6):30–40.Suche in Google Scholar
[12] Chanson H. Review of studies on stepped channel flows. Nihon Univ. 1998;1–25.Suche in Google Scholar
[13] Ohtsu I. Characteristics of flow condition on stepped channels. In: The 27th Cong. of IAHR, Water Resources Engineering. Div./ASCE; 1997. p. 583–8.Suche in Google Scholar
[14] Ali A, Yousif O. Characterizations of flow over stepped spillways with steps having transverse slopes. In: IOP Conference Series: Earth and Environmental Science. vol. 344, IOP Publishing; 2019. p. 012019.10.1088/1755-1315/344/1/012019Suche in Google Scholar
[15] Husain SM, Ahmed SS. Experimental study to evaluate the hydraulic performance of Bastora dam stepped spillway. J Duhok Univ. 2017;612–25.10.26682/sjuod.2017.20.1.54Suche in Google Scholar
[16] Horton RE. Weir experiments, coefficients, and formulas. vol. 16, US Government Printing Office; 1906.Suche in Google Scholar
[17] Singer J. Square-edged broad-crested weir as a flow measurement device. Water Water Eng. 1964;28(820):229–35.Suche in Google Scholar
[18] Shamkhi M, Hafudh A, Qais H, Amer R. Froude number data analysis and its implications on local scour. In: 2019 12th International Conference on Developments in eSystems Engineering (DeSE). IEEE; 2019. p. 315–20.10.1109/DeSE.2019.00065Suche in Google Scholar
[19] Shamkhi MS, Neama NM. Elicitation of stage discharge relationship for multi-gate controlled barrage. J Eng Sci Technol. 2021;16(1):291–304.Suche in Google Scholar
[20] Jahad UA, Al-Amery R, Chua L, Das S. Energy dissipation and geometry effects over stepped spillways. Int J Civ Eng Technol. 2016;7(4):188–98.Suche in Google Scholar
[21] Nasiralla AL-Talib A, Abd AL-Majeed Hayawi H. Laboratory study of flow energy dissipation using stepped weirs. Al-Rafidain Eng J (AREJ). 2009;17(4):42–51.10.33899/rengj.2009.43300Suche in Google Scholar
[22] Shahheydari H, Nodoshan EJ, Barati R, Moghadam MA Discharge coefficient and energy dissipation over stepped spillway under skimming flow regime. KSCE J Civ Eng. 2015;19:1174–82.10.1007/s12205-013-0749-3Suche in Google Scholar
© 2023 the author(s), published by De Gruyter
This work is licensed under the Creative Commons Attribution 4.0 International License.
Artikel in diesem Heft
- Regular Articles
- Design optimization of a 4-bar exoskeleton with natural trajectories using unique gait-based synthesis approach
- Technical review of supervised machine learning studies and potential implementation to identify herbal plant dataset
- Effect of ECAP die angle and route type on the experimental evolution, crystallographic texture, and mechanical properties of pure magnesium
- Design and characteristics of two-dimensional piezoelectric nanogenerators
- Hybrid and cognitive digital twins for the process industry
- Discharge predicted in compound channels using adaptive neuro-fuzzy inference system (ANFIS)
- Human factors in aviation: Fatigue management in ramp workers
- LLDPE matrix with LDPE and UV stabilizer additive to evaluate the interface adhesion impact on the thermal and mechanical degradation
- Dislocated time sequences – deep neural network for broken bearing diagnosis
- Estimation method of corrosion current density of RC elements
- A computational iterative design method for bend-twist deformation in composite ship propeller blades for thrusters
- Compressive forces influence on the vibrations of double beams
- Research on dynamical properties of a three-wheeled electric vehicle from the point of view of driving safety
- Risk management based on the best value approach and its application in conditions of the Czech Republic
- Effect of openings on simply supported reinforced concrete skew slabs using finite element method
- Experimental and simulation study on a rooftop vertical-axis wind turbine
- Rehabilitation of overload-damaged reinforced concrete columns using ultra-high-performance fiber-reinforced concrete
- Performance of a horizontal well in a bounded anisotropic reservoir: Part II: Performance analysis of well length and reservoir geometry
- Effect of chloride concentration on the corrosion resistance of pure Zn metal in a 0.0626 M H2SO4 solution
- Numerical and experimental analysis of the heat transfer process in a railway disc brake tested on a dynamometer stand
- Design parameters and mechanical efficiency of jet wind turbine under high wind speed conditions
- Architectural modeling of data warehouse and analytic business intelligence for Bedstead manufacturers
- Influence of nano chromium addition on the corrosion and erosion–corrosion behavior of cupronickel 70/30 alloy in seawater
- Evaluating hydraulic parameters in clays based on in situ tests
- Optimization of railway entry and exit transition curves
- Daily load curve prediction for Jordan based on statistical techniques
- Review Articles
- A review of rutting in asphalt concrete pavement
- Powered education based on Metaverse: Pre- and post-COVID comprehensive review
- A review of safety test methods for new car assessment program in Southeast Asian countries
- Communication
- StarCrete: A starch-based biocomposite for off-world construction
- Special Issue: Transport 2022 - Part I
- Analysis and assessment of the human factor as a cause of occurrence of selected railway accidents and incidents
- Testing the way of driving a vehicle in real road conditions
- Research of dynamic phenomena in a model engine stand
- Testing the relationship between the technical condition of motorcycle shock absorbers determined on the diagnostic line and their characteristics
- Retrospective analysis of the data concerning inspections of vehicles with adaptive devices
- Analysis of the operating parameters of electric, hybrid, and conventional vehicles on different types of roads
- Special Issue: 49th KKBN - Part II
- Influence of a thin dielectric layer on resonance frequencies of square SRR metasurface operating in THz band
- Influence of the presence of a nitrided layer on changes in the ultrasonic wave parameters
- Special Issue: ICRTEEC - 2021 - Part III
- Reverse droop control strategy with virtual resistance for low-voltage microgrid with multiple distributed generation sources
- Special Issue: AESMT-2 - Part II
- Waste ceramic as partial replacement for sand in integral waterproof concrete: The durability against sulfate attack of certain properties
- Assessment of Manning coefficient for Dujila Canal, Wasit/-Iraq
- Special Issue: AESMT-3 - Part I
- Modulation and performance of synchronous demodulation for speech signal detection and dialect intelligibility
- Seismic evaluation cylindrical concrete shells
- Investigating the role of different stabilizers of PVCs by using a torque rheometer
- Investigation of high-turbidity tap water problem in Najaf governorate/middle of Iraq
- Experimental and numerical evaluation of tire rubber powder effectiveness for reducing seepage rate in earth dams
- Enhancement of air conditioning system using direct evaporative cooling: Experimental and theoretical investigation
- Assessment for behavior of axially loaded reinforced concrete columns strengthened by different patterns of steel-framed jacket
- Novel graph for an appropriate cross section and length for cantilever RC beams
- Discharge coefficient and energy dissipation on stepped weir
- Numerical study of the fluid flow and heat transfer in a finned heat sink using Ansys Icepak
- Integration of numerical models to simulate 2D hydrodynamic/water quality model of contaminant concentration in Shatt Al-Arab River with WRDB calibration tools
- Study of the behavior of reactive powder concrete RC deep beams by strengthening shear using near-surface mounted CFRP bars
- The nonlinear analysis of reactive powder concrete effectiveness in shear for reinforced concrete deep beams
- Activated carbon from sugarcane as an efficient adsorbent for phenol from petroleum refinery wastewater: Equilibrium, kinetic, and thermodynamic study
- Structural behavior of concrete filled double-skin PVC tubular columns confined by plain PVC sockets
- Probabilistic derivation of droplet velocity using quadrature method of moments
- A study of characteristics of man-made lightweight aggregate and lightweight concrete made from expanded polystyrene (eps) and cement mortar
- Effect of waste materials on soil properties
- Experimental investigation of electrode wear assessment in the EDM process using image processing technique
- Punching shear of reinforced concrete slabs bonded with reactive powder after exposure to fire
- Deep learning model for intrusion detection system utilizing convolution neural network
- Improvement of CBR of gypsum subgrade soil by cement kiln dust and granulated blast-furnace slag
- Investigation of effect lengths and angles of the control devices below the hydraulic structure
- Finite element analysis for built-up steel beam with extended plate connected by bolts
- Finite element analysis and retrofit of the existing reinforced concrete columns in Iraqi schools by using CFRP as confining technique
- Performing laboratory study of the behavior of reactive powder concrete on the shear of RC deep beams by the drilling core test
- Special Issue: AESMT-4 - Part I
- Depletion zones of groundwater resources in the Southwest Desert of Iraq
- A case study of T-beams with hybrid section shear characteristics of reactive powder concrete
- Feasibility studies and their effects on the success or failure of investment projects. “Najaf governorate as a model”
- Optimizing and coordinating the location of raw material suitable for cement manufacturing in Wasit Governorate, Iraq
- Effect of the 40-PPI copper foam layer height on the solar cooker performance
- Identification and investigation of corrosion behavior of electroless composite coating on steel substrate
- Improvement in the California bearing ratio of subbase soil by recycled asphalt pavement and cement
- Some properties of thermal insulating cement mortar using Ponza aggregate
- Assessment of the impacts of land use/land cover change on water resources in the Diyala River, Iraq
- Effect of varied waste concrete ratios on the mechanical properties of polymer concrete
- Effect of adverse slope on performance of USBR II stilling basin
- Shear capacity of reinforced concrete beams with recycled steel fibers
- Extracting oil from oil shale using internal distillation (in situ retorting)
- Influence of recycling waste hardened mortar and ceramic rubbish on the properties of flowable fill material
- Rehabilitation of reinforced concrete deep beams by near-surface-mounted steel reinforcement
- Impact of waste materials (glass powder and silica fume) on features of high-strength concrete
- Studying pandemic effects and mitigation measures on management of construction projects: Najaf City as a case study
- Design and implementation of a frequency reconfigurable antenna using PIN switch for sub-6 GHz applications
- Average monthly recharge, surface runoff, and actual evapotranspiration estimation using WetSpass-M model in Low Folded Zone, Iraq
- Simple function to find base pressure under triangular and trapezoidal footing with two eccentric loads
- Assessment of ALINEA method performance at different loop detector locations using field data and micro-simulation modeling via AIMSUN
- Special Issue: AESMT-5 - Part I
- Experimental and theoretical investigation of the structural behavior of reinforced glulam wooden members by NSM steel bars and shear reinforcement CFRP sheet
- Improving the fatigue life of composite by using multiwall carbon nanotubes
- A comparative study to solve fractional initial value problems in discrete domain
- Assessing strength properties of stabilized soils using dynamic cone penetrometer test
- Investigating traffic characteristics for merging sections in Iraq
- Enhancement of flexural behavior of hybrid flat slab by using SIFCON
- The main impacts of a managed aquifer recharge using AHP-weighted overlay analysis based on GIS in the eastern Wasit province, Iraq