Numerical study of the fluid flow and heat transfer in a finned heat sink using Ansys Icepak
-
Sana J. Yaseen


Abstract
This research studies a three-dimensional fluid flow, and heat transfer in the heat sink numerically using air as a coolant. The numerical effects of the number of fins and their thickness on the performance of the heat sink are investigated using Ansys Icepak. Various fin numbers and fin thicknesses are used to check the heat sink’s optimal thermal performance. The results demonstrated that the maximum temperature, pressure drop, and thermal resistance decrease with the increase in the fin number and thickness. According to the results, the optimal thickness and number of fins for the current study are 15 and 0.25 mm, respectively. Also, it is observed that increasing the number of fins has a greater effect than increasing the thickness of the fins on the maximum temperature, pressure drop, and thermal resistance.
1 Introduction
Heat is produced by all electronic devices when they are in use [1]. Almost all industrial applications require temperature reduction, which is essential [2]. The device may fail if exposed to temperatures beyond the safe operating range. Most devices are not certified to work between 50 and 80°C. Each 10°C rise in temperature reduces the component life by 50% [3]. As electronic devices improve, cooling has become one of the most challenging and significant issues to address [4]. Electronic cooling helps reduce the heat rate of electronic equipment and extend the product life [3,5]. Heat sinks promote the spread of heat from their source to the environment by extending their surfaces (fins) [1]. Therefore, heat sinks are used to keep the electronic equipment’s temperature below the desired level [6]. To improve convective heat transfer from the heat sinks, the extended surface (fins) is used in various electrical and engineering applications [7].
In this study, the number of fins are varied to find the optimal number that gives the best cooling performance. Therefore, a heat sink without fins and with different numbers of fins and thickness were analyzed in Ansys Icepak.
2 Background study
Escher et al. [8] investigated a three-dimensional model of a very thin electronic heat sink. A 2 × 2 cm2 chip with a total thermal resistance of 0.087 cm/W was used to optimize the design. For a 65 K temperature difference between the chip temperature and the fluid inlet temperature, the maximum cooling capacity was 750 W/cm2.
The heat transport through the heat sink was examined by Kepekci and Asma numerically using computational fluid dynamic CFD software [4]. Straight, square, hexagonal, and airfoil fin shapes were also used in the investigation. They assumed that the CPU and atmosphere would be at 25 and 80°C, respectively, and that air would travel at 7.5 m/s. Each fin was measured at 0.02 m in length and 0.002 m in thickness. They concluded that fins made of silver airfoil provided the optimum cooling performance and cost.
Castelan et al. [9] analyzed heat sinks and fans analytically. During the study, they took a sink with 17 fins with thickness and height of 6.1 and 40 mm, respectively, with the chip length changing throughout. According to their results, the thermal resistance decreased by 12% when heat sink + fan optimization was based on thermal resistance.
Bondareva et al. [10] used the finite difference approach to quantitatively investigate the phase change material performance. The fins utilized were 0.33 cm wide and 5 cm tall. The effects of heat flux and fin size on the phase change material and capacitance were investigated. With a heat load of 1,600 W/m2, they discovered that the presence of transverse ribs could have decreased the source temperature by more than 1,200°C.
Silva et al. [11] numerically studied the heat sink performance using forced convection heat transfer. They discovered that a staggered preparation of pin fins with diameters of 1.5 mm and spacing of 5 mm produced the best case for pin heat sinks. Additionally, they noticed improved thermal performance due to the incorporation of holes into circular pins. They also used three types of heat sinks to show the best sink performance under the same boundary conditions, and they proved that a heat sink with a hexagon shape has the best results.
A study of water as coolant fluid for laminar forced convection in heat sinks with micro-pin fin in a heat sink has been studied numerically by Shafeie et al. [12]. Both pin fin heat sinks and pin-finned microchannel heat sinks (MCHS) were examined using the oblique or staggered distribution of the pin fins. A lower heat removal was achieved for the same pumping powers of 0.5 and 2 W compared with the best simple MCHS. Also, it can be shown that the heat sink with (500 mm) height depth has the maximum heat subtraction.
3 Problem description
In the present study, a rectangular cabinet contains one heat source and a heat sink for the investigation. The upper and the side walls of the cabinet are adiabatic. The heat sink and fins are made of aluminum with a density of 2,800 kg/m3, and the thermal conductivity is 205 W/m °C. Air is the working fluid, which flows along the x-axis, as shown in Figure 1. The dimensions of the cabinet and its components are given in Table 1.

3D computational domain for the geometry.
Dimensions of the cabinet components in cm
| Component | Height (y) | Length (z) | Width (x) |
|---|---|---|---|
| Cabinet | 30 | 20 | 8 |
| Board | 12 | 10 | 1 |
| Heat sink | 10 | 8 | 6 |
4 Governing equations
The problem under consideration concerns the flow through the heat sink and the cabinet. Heat transfer in the heat sink unit is a conjugate process, which combines the conduction heat transfer in the solid parts and convection heat transfer through the fluid.
To investigate, the following assumptions are prepared for the model to simplify the momentum and energy equations:
The 3D flow is assumed to be steady-state, incompressible, and laminar.
There will be no slip flow close to the walls.
The energy dissipation is negligible.
The radiation is negligible.
The effect of gravity is negligible.
The liquid and solid assumed has constant properties.
After applying the set of assumptions, the 3D equation system that governs the single-phase model includes the continuity, momentum, and energy equations can be summed up as follows [13]:
Momentum in x, y, and z directions, respectively, are:
Energy equation is given as follows:
where the variables “T” and “P” represent the fluid’s temperature and pressure, u, v, and w represent the components of fluid velocity in x, y, and z directions and ρ, µ, and k represent the density, viscosity, and thermal conductivity, respectively.
The energy equation for the solid walls is given as follows [14,15]:
It is possible to calculate the heat sink’s thermal resistance to know how well it works. To compute the thermal resistance, we must determine the temperature difference and the highest temperature rises in the heat sink. The maximum difference temperature can be calculated as [16]:
where T s,0 is the heat source’s highest temperature, T in is the fluid’s temperature at the inlet, equal to 20°C.
Both can be used in the following formulas to calculate the thermal resistance:
where Q is the power supplied, which is equal to 50 W.
4.1 Boundary conditions (BCs)
BC for the hydrodynamic: uniform velocity at the channel inlet. The no-slip condition was used for all the walls, u = 0, v = 0, and w = 0.
All solid region boundaries are subjected to all external walls except for the bottom wall of the heat sink, where constant heat flux is applied. q″ = constant.
The temperature at the inlet is T = T in,
5 Check grid independence
The Ansys Icepak uses a Fluent solver, and the preprocessing generates a Hexa-dominant mesh. The simulation-specific mesh profile is shown in Figure 2.

3D Meshed model with heat sink.
We investigate how grid refinement affects the numerical solutions for the heat sink without fins. The grid dependence test is first conducted using several different elements and nods. The results obtained from these meshes are summarized in Table 2.
Number of nodes, elements, and maximum block temperature
| No. | Elements no. | Nodes no. | Temperature of block (K) |
|---|---|---|---|
| 1. | 8,820 | 10,164 | 103.459 |
| 2. | 31,200 | 34,317 | 103.462 |
| 3. | 96,000 | 102,591 | 103.469 |
| 4. | 160,800 | 170,865 | 103.469 |
From Table 2, it is clear that with the increase in the number of nodes, the temperature change is very small, especially after case 3. Therefore, the type of mesh chosen for our calculations is the third type.
6 Numerical method and validation
In the present study, a finite volume method is used to resolve continuity, momentum, and energy equations. The simple algorithm is used to resolve the velocity–pressure coupling, while the equations are discretized using a second-order upwind scheme.
The results of the present study are compared with the experimental data of Adhikari et al. [17] in order to validate our numerical work. They investigated the forced convection heat transfer from a rectangular array of straight fins with incoming flow parallel to fin channels at low Re. The maximum temperatures of the current work and experiment results of the reference [17] for three different velocities 2, 4, and 6 m/s are shown in Figure 3. Figure 3 demonstrates that the current numerical work has a deviation of less than 4.2% from the reference experiment results [17].
![Figure 3
Comparison of the numerical results of the present study with that reported by Adhikari et al. [17].](/document/doi/10.1515/eng-2022-0440/asset/graphic/j_eng-2022-0440_fig_003.jpg)
Comparison of the numerical results of the present study with that reported by Adhikari et al. [17].
7 Results and discussion
The results of hydrodynamic parameters (velocity and pressure) and the thermal characteristic represented by the temperature and thermal resistance distribution in the cabinet and the heat sink will be presented. The heat sink’s performance is examined concerning the number and thickness of fins. Table 3 shows the range of values for the number and thickness of the fins used in this study.
Ranges of parameter values that are studied
| Parameter | Value |
|---|---|
| Fin count | 0, 5, 10, 15, and 20 |
| Fin thickness | 0.05, 0.1, 0.15, 0.2, and 0.25 mm |
At first, we run the program for the heat sink without fins. The results of temperature, pressure, and velocity obtained are as shown in Figures 4–6, respectively.

Temperature distribution on a plane in z direction passing through the heat sink, for n = 0.

Pressure distribution on a plane in z direction passing through the heat sink, for n = 0.

Velocity distribution on (a) heat sink and a plane in the z direction, (b) the cabinet, inlet, and outlet, for n = 0.
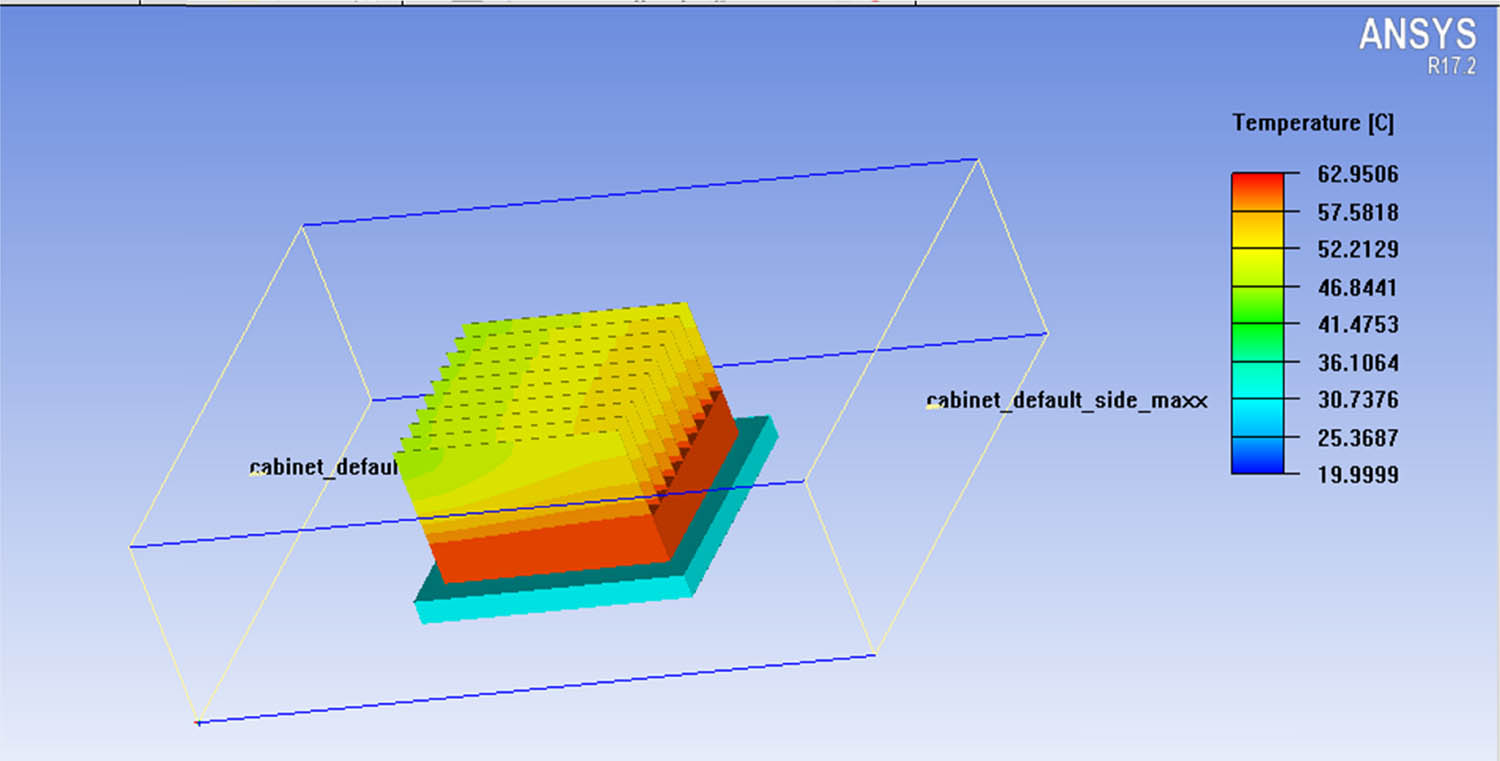
Figure 4 shows that the maximum temperature is 103.459°C when no fin exists. The heat sink has the highest temperature because it is close to the heat source. As we go up to the top, the maximum temperature drops slightly. Figure 5 represents the pressure through the plane in the yz direction, and it can be seen that the larger value of pressure is located near the inlet region and reduces along the cabinet until it reaches zero at the outlet because of the reduced velocity from the inlet to outlet as displayed in Figure 6.
The results of temperature, pressure, and velocity distribution along the heat sink, when five fins were added, are shown in Figures 7–9. It can be seen that the maximum temperature is observed in the lower part of the heat sink, which reached 89.626°C, and we note the highest speed reached by the fluid during its crossing through the heat sink is 0.726 m/s. As for the pressure, it was concentrated at the beginning of the cabinet and decreased when passing through the heat sink, where the highest pressure that can be achieved is 0.2608 N/m2 near the first edge of the heat sink that is directly above the board.

Temperature distribution on a plane in z direction across the heat sink, for n = 5.

Pressure distribution on a plane in z direction across the heat sink, for n = 5.

Velocity distribution on a plane in z direction across the heat sink, for n = 5.
Figures 10–18 show the temperature, pressure, and velocity contours for the cases of fin numbers 10, 15, and 20, respectively. From Figures 10, 13, and 16, the maximum temperature can be seen at the bottom of the heat sink, close to the heat source where the heat flux is applied. This value gradually reduces from the base to the sink top since it is far from the heat source. The optimum pressure and velocity values are located at the inlet area, which decreases gradually until it reaches the exit area of the cabinet, as can be observed in Figures 11, 12, 14, 15, 17, and 18.
Temperature distribution through the heat sink, for n = 10.

Pressure distribution on a plane in z direction across the heat sink, for n = 10.

Velocity distribution on a plane in z direction across the heat sink, for n = 10.

Temperature distribution on a plane in z direction across the heat sink, for n = 15.

Pressure distribution on a plane in z direction across the heat sink, for n = 15.

Velocity distribution on a plane in z direction across the heat sink, for n = 15.

Temperature distribution on a plane in z direction across the heat sink, for n = 20.

Pressure distribution on a plane in z direction across the heat sink, for n = 20.

Distribution of velocity on a plane in y direction across the heat sink, for n = 20.
Figure 19 draws for maximum temperature vs fin number for different fin thicknesses (t = 0.05, 0.1, 0.15, 0.2, and 0.25). This figure shows that the temperature reduces until it reaches the lowest value at n = 15, then increases again. This is because having more fins with the same thickness shortens the distance between them, which raises the temperature around the fins. Additionally, this prevents air from reaching all of the cooling fins, resulting in low heat transfer rates from the heat source to the moving fluid and an increase in temperature. The addition of more fins works as an obstacle to heat transfer. Therefore, an optimal number of fins gives the lowest maximum temperature for each specific fin thickness. Also, we note from the figure that the best fin thickness gives the lowest maximum temperature t = 0.25 mm, which means that as the thickness increases, the maximum temperature reduces.

Maximum temperature vs fin numbers at different fin thicknesses.
The thermal resistance vs fin number for various fin thicknesses is depicted in Figure 20. It can be seen from this illustration that the thermal resistance reduces till it reaches the lowest value at n = 15, then it increases again. The figure shows that the best number of fins that gives the lower thermal resistance value is n = 15, and the best thickness is t = 0.25 mm.

Thermal resistance variation with fin numbers at different fin thicknesses.
Figure 21 indicates the pressure drop change vs the number of fins at different thicknesses. It can be shown from the figure that the pressure drop through the sink reduces with the increase in the fin thickness. Also, it increases as the fin number increases, and the lowest pressure drop value occurs at t = 0.25 mm.

Pressure drop variation with fin numbers at different fin thicknesses.
Figures 19–21 indicate that the optimal number of fins for the current study is 15, and the best thickness is t = 0.25 mm.
8 Conclusion
The optimal thermal performance of the heat sink with various fin thicknesses and numbers is the subject of this investigation. The effect of number and thickness of fins on the maximum temperature, pressure drop, and thermal resistance are analyzed numerically using ANSYS ICEPAK.
The following conclusions can be drawn from the findings:
The maximum temperature with fins is less than the maximum temperature without fins.
The maximum temperature and thermal resistance decrease as the number of fins increases until n = 15; after that, the temperature rises again, so the optimal number of fins is 15.
The heat sink has the lowest temperature, pressure drop, and thermal resistance when its fin thickness is 0.25 mm.
The decrease in maximum temperature, pressure drop, and thermal resistance is 75.92, 59.775, and 75%, respectively, when 15 fins are used compared to a heat sink without fins.
The reduction in the maximum temperature, pressure drop, and thermal resistance is 42, 36.2, and 48.8%, respectively, when 0.25 mm is used compared with 0.05 mm fin thickness for the number of fins equal to 15.
It is evident that increasing the number of fins has a significantly greater impact on the maximum temperature, pressure drop, and thermal resistance than increasing the thickness of the fins.
Nomenclature
- C p
-
constant pressure specific heat
- g
-
acceleration
- p
-
pressure
- k
-
thermal conductivity
-
-
heat flux (W/m2)
- Q
-
power (W)
- R th
-
thermal resistance
- T
-
temperature
- u, v, w
-
Cartesian velocity components
- x, y, z
-
Cartesian co-ordinates
- n
-
number of fins
- t
-
fin thickness
Greek symbols
- ρ
-
density
- µ
-
dynamic viscosity
Subscript
- s
-
solid
- f
-
fluid
- max
-
maximum
- o
-
out
- i
-
in the inlet
-
Conflict of interest: The authors state no conflict of interest.
-
Data availability statement: Most datasets generated and analyzed in this study have been provided in this submitted manuscript. The other datasets are available on reasonable request from the corresponding author with the attached information.
References
[1] Dede EM, Josh SN, Zhou F. Topology optimization, additive layer manufacturing, and experimental testing of an air-cooled heat sink. Mech Des Trans ASME. 2015;137:11.10.1115/1.4030989Search in Google Scholar
[2] Choong JY, Yu KH, Abdullah MZ. Numerical study of heat transfer characteristics of laminar nanofluids flow in oblique finned microchannel heat sink. J Adv Res Fluid Mech Therm Sci. 2020;76(3):25–37.10.37934/arfmts.76.3.2537Search in Google Scholar
[3] Raja B, Praveenkumar V, Leelaprasad M, Manigandan P. Thermal Simulations of an Electronic System using Ansys Icepak. J Eng Res Appl. 2015;5(11):57–68. www.ijera.com.Search in Google Scholar
[4] Kepekci H, Asma A. Comparative analysis of heat sink performance using different materials. Am J Eng Res (AJER). 2020;9(4):204–21. www.ajer.org.Search in Google Scholar
[5] Nazzal IT, Salem TK, Al Doury RR. Theoretical investigation of a pin fin heat sink performance for electronic cooling using different alloys materials. IOP Conference Series: Materials Science and Engineering, INTCSET. 2021.10.1088/1757-899X/1094/1/012087Search in Google Scholar
[6] Kumar Y, Saxena NV. Optimization of heat transfer process parameters for heat sink using CFD. Int J Trend Sci Res Dev (IJTSRD). 2020;4(6):184–7.Search in Google Scholar
[7] Dhumne AB, Farkade HS. Heat transfer analysis of cylindrical perforated fins in staggered arrangement. Int J Innov Technol Explor Eng. 2013;2(5):225–30.Search in Google Scholar
[8] Escher W, Michel B, Poulikakos D. A novel high performance, ultrathin heat sink for electronics. Int J Heat Fluid Flow. 2010;31:586–98.10.1016/j.ijheatfluidflow.2010.03.001Search in Google Scholar
[9] Castelan A, Cougo B, Dutour S, Meynard T. Analytical modelling of sink heat distribution for fast optimisation of power converters. Electricmacs 2017, Toulouse, France; 2017. p. 296–307.Search in Google Scholar
[10] Bondareva NS, Ghalambaz M, Mikhail A. Influence of the fin shape on heat transport in phase change material heat sink with constant heat loads. Energies. 2021 March 3;14:1389.10.3390/en14051389Search in Google Scholar
[11] Silva EC, Sampaio AM, Pontes AJ. Evaluation of active heat sinks design under forced convection effect of geometric and boundary parameters. Materials. 2021;14(8):2041.10.3390/ma14082041Search in Google Scholar PubMed PubMed Central
[12] Shafeie H, Abouali O, Jafarpur K, Ahmadi G. Numerical study of heat transfer performance of single-phase heat sinks with micro pin-fin structures. Appl Therm Eng. 2013;58:68–76.10.1016/j.applthermaleng.2013.04.008Search in Google Scholar
[13] Mohammed AA, Razuqi SA. Performance of rectangular pin-fin heat sink subject to an impinging air flow. J Ther Eng. 2021 Mar;7(No 3):666–76. Istanbul, Turkey: Yildiz Technical University Press.10.18186/thermal.889174Search in Google Scholar
[14] Patil NG, Hotta TK. Role of working fluids on the cooling of discrete heated modules: a numerical approach Sådhanå. Indian Acad Sci. 2018;43:187.10.1007/s12046-018-0950-7Search in Google Scholar
[15] Yaseen SJ, Rageb AA, Alshara AK. Performance characteristics of Micro-channel heat sink with variable cross-section. Proceedings of the 2nd International Conference Southern Technical University. 2017. p. 102–9.Search in Google Scholar
[16] Shkarah AJ, Sulaima MY, Ayob MR, Togun H. A 3D numerical study of heat transfer in a single-phase micro-channel heat sink using graphene, aluminum and silicon as substrates. Int Commun Heat Mass Transf. 2013;48:108–15.10.1016/j.icheatmasstransfer.2013.08.006Search in Google Scholar
[17] Adhikari RC, Wood DH, Pahlevani M. An experimental and numerical study of forced convection heat transfer from rectangular fins at low Reynolds numbers. Int J Heat Mass Transf. 2020;63:120418.10.1016/j.ijheatmasstransfer.2020.120418Search in Google Scholar
© 2023 the author(s), published by De Gruyter
This work is licensed under the Creative Commons Attribution 4.0 International License.
Articles in the same Issue
- Regular Articles
- Design optimization of a 4-bar exoskeleton with natural trajectories using unique gait-based synthesis approach
- Technical review of supervised machine learning studies and potential implementation to identify herbal plant dataset
- Effect of ECAP die angle and route type on the experimental evolution, crystallographic texture, and mechanical properties of pure magnesium
- Design and characteristics of two-dimensional piezoelectric nanogenerators
- Hybrid and cognitive digital twins for the process industry
- Discharge predicted in compound channels using adaptive neuro-fuzzy inference system (ANFIS)
- Human factors in aviation: Fatigue management in ramp workers
- LLDPE matrix with LDPE and UV stabilizer additive to evaluate the interface adhesion impact on the thermal and mechanical degradation
- Dislocated time sequences – deep neural network for broken bearing diagnosis
- Estimation method of corrosion current density of RC elements
- A computational iterative design method for bend-twist deformation in composite ship propeller blades for thrusters
- Compressive forces influence on the vibrations of double beams
- Research on dynamical properties of a three-wheeled electric vehicle from the point of view of driving safety
- Risk management based on the best value approach and its application in conditions of the Czech Republic
- Effect of openings on simply supported reinforced concrete skew slabs using finite element method
- Experimental and simulation study on a rooftop vertical-axis wind turbine
- Rehabilitation of overload-damaged reinforced concrete columns using ultra-high-performance fiber-reinforced concrete
- Performance of a horizontal well in a bounded anisotropic reservoir: Part II: Performance analysis of well length and reservoir geometry
- Effect of chloride concentration on the corrosion resistance of pure Zn metal in a 0.0626 M H2SO4 solution
- Numerical and experimental analysis of the heat transfer process in a railway disc brake tested on a dynamometer stand
- Design parameters and mechanical efficiency of jet wind turbine under high wind speed conditions
- Architectural modeling of data warehouse and analytic business intelligence for Bedstead manufacturers
- Influence of nano chromium addition on the corrosion and erosion–corrosion behavior of cupronickel 70/30 alloy in seawater
- Evaluating hydraulic parameters in clays based on in situ tests
- Optimization of railway entry and exit transition curves
- Daily load curve prediction for Jordan based on statistical techniques
- Review Articles
- A review of rutting in asphalt concrete pavement
- Powered education based on Metaverse: Pre- and post-COVID comprehensive review
- A review of safety test methods for new car assessment program in Southeast Asian countries
- Communication
- StarCrete: A starch-based biocomposite for off-world construction
- Special Issue: Transport 2022 - Part I
- Analysis and assessment of the human factor as a cause of occurrence of selected railway accidents and incidents
- Testing the way of driving a vehicle in real road conditions
- Research of dynamic phenomena in a model engine stand
- Testing the relationship between the technical condition of motorcycle shock absorbers determined on the diagnostic line and their characteristics
- Retrospective analysis of the data concerning inspections of vehicles with adaptive devices
- Analysis of the operating parameters of electric, hybrid, and conventional vehicles on different types of roads
- Special Issue: 49th KKBN - Part II
- Influence of a thin dielectric layer on resonance frequencies of square SRR metasurface operating in THz band
- Influence of the presence of a nitrided layer on changes in the ultrasonic wave parameters
- Special Issue: ICRTEEC - 2021 - Part III
- Reverse droop control strategy with virtual resistance for low-voltage microgrid with multiple distributed generation sources
- Special Issue: AESMT-2 - Part II
- Waste ceramic as partial replacement for sand in integral waterproof concrete: The durability against sulfate attack of certain properties
- Assessment of Manning coefficient for Dujila Canal, Wasit/-Iraq
- Special Issue: AESMT-3 - Part I
- Modulation and performance of synchronous demodulation for speech signal detection and dialect intelligibility
- Seismic evaluation cylindrical concrete shells
- Investigating the role of different stabilizers of PVCs by using a torque rheometer
- Investigation of high-turbidity tap water problem in Najaf governorate/middle of Iraq
- Experimental and numerical evaluation of tire rubber powder effectiveness for reducing seepage rate in earth dams
- Enhancement of air conditioning system using direct evaporative cooling: Experimental and theoretical investigation
- Assessment for behavior of axially loaded reinforced concrete columns strengthened by different patterns of steel-framed jacket
- Novel graph for an appropriate cross section and length for cantilever RC beams
- Discharge coefficient and energy dissipation on stepped weir
- Numerical study of the fluid flow and heat transfer in a finned heat sink using Ansys Icepak
- Integration of numerical models to simulate 2D hydrodynamic/water quality model of contaminant concentration in Shatt Al-Arab River with WRDB calibration tools
- Study of the behavior of reactive powder concrete RC deep beams by strengthening shear using near-surface mounted CFRP bars
- The nonlinear analysis of reactive powder concrete effectiveness in shear for reinforced concrete deep beams
- Activated carbon from sugarcane as an efficient adsorbent for phenol from petroleum refinery wastewater: Equilibrium, kinetic, and thermodynamic study
- Structural behavior of concrete filled double-skin PVC tubular columns confined by plain PVC sockets
- Probabilistic derivation of droplet velocity using quadrature method of moments
- A study of characteristics of man-made lightweight aggregate and lightweight concrete made from expanded polystyrene (eps) and cement mortar
- Effect of waste materials on soil properties
- Experimental investigation of electrode wear assessment in the EDM process using image processing technique
- Punching shear of reinforced concrete slabs bonded with reactive powder after exposure to fire
- Deep learning model for intrusion detection system utilizing convolution neural network
- Improvement of CBR of gypsum subgrade soil by cement kiln dust and granulated blast-furnace slag
- Investigation of effect lengths and angles of the control devices below the hydraulic structure
- Finite element analysis for built-up steel beam with extended plate connected by bolts
- Finite element analysis and retrofit of the existing reinforced concrete columns in Iraqi schools by using CFRP as confining technique
- Performing laboratory study of the behavior of reactive powder concrete on the shear of RC deep beams by the drilling core test
- Special Issue: AESMT-4 - Part I
- Depletion zones of groundwater resources in the Southwest Desert of Iraq
- A case study of T-beams with hybrid section shear characteristics of reactive powder concrete
- Feasibility studies and their effects on the success or failure of investment projects. “Najaf governorate as a model”
- Optimizing and coordinating the location of raw material suitable for cement manufacturing in Wasit Governorate, Iraq
- Effect of the 40-PPI copper foam layer height on the solar cooker performance
- Identification and investigation of corrosion behavior of electroless composite coating on steel substrate
- Improvement in the California bearing ratio of subbase soil by recycled asphalt pavement and cement
- Some properties of thermal insulating cement mortar using Ponza aggregate
- Assessment of the impacts of land use/land cover change on water resources in the Diyala River, Iraq
- Effect of varied waste concrete ratios on the mechanical properties of polymer concrete
- Effect of adverse slope on performance of USBR II stilling basin
- Shear capacity of reinforced concrete beams with recycled steel fibers
- Extracting oil from oil shale using internal distillation (in situ retorting)
- Influence of recycling waste hardened mortar and ceramic rubbish on the properties of flowable fill material
- Rehabilitation of reinforced concrete deep beams by near-surface-mounted steel reinforcement
- Impact of waste materials (glass powder and silica fume) on features of high-strength concrete
- Studying pandemic effects and mitigation measures on management of construction projects: Najaf City as a case study
- Design and implementation of a frequency reconfigurable antenna using PIN switch for sub-6 GHz applications
- Average monthly recharge, surface runoff, and actual evapotranspiration estimation using WetSpass-M model in Low Folded Zone, Iraq
- Simple function to find base pressure under triangular and trapezoidal footing with two eccentric loads
- Assessment of ALINEA method performance at different loop detector locations using field data and micro-simulation modeling via AIMSUN
- Special Issue: AESMT-5 - Part I
- Experimental and theoretical investigation of the structural behavior of reinforced glulam wooden members by NSM steel bars and shear reinforcement CFRP sheet
- Improving the fatigue life of composite by using multiwall carbon nanotubes
- A comparative study to solve fractional initial value problems in discrete domain
- Assessing strength properties of stabilized soils using dynamic cone penetrometer test
- Investigating traffic characteristics for merging sections in Iraq
- Enhancement of flexural behavior of hybrid flat slab by using SIFCON
- The main impacts of a managed aquifer recharge using AHP-weighted overlay analysis based on GIS in the eastern Wasit province, Iraq