Experimental investigation of electrode wear assessment in the EDM process using image processing technique
-
Ali Abbar Khleif


Abstract
One of the widespread non-traditional and non-contact machining processes is the electrical discharge machining (EDM) process, which depends on removing material from the surface by different repeat electrical discharges between a machined workpiece and a cutting tool called the electrode. The electrode wear in the EDM process is one of the parameters of significant technological interest. This article proposed a reliable image-based system that automatically detects and computes electrode wear in EDM of rectangular steel workpiece plate of AISI 314 using a copper electrode with a rectangular shape. MATLAB environment and image processing toolbox are used to identify and manipulate the captured rectangular electrode image for rectangular electrode data extraction needed for the electrode wear identification process. The results show that the proposed image-based approach, using a non-contact measuring system and relatively inexpensive equipment, is suitable with good accuracy and efficiency for measuring and testing electrode wear.
1 Introduction
One of the most famous machining processes is electrical discharge machining (EDM), which fabricates many industrial parts such as automotive industries, packaging, surgical instruments, and surgical instruments [1]. Electrode wear investigation in the EDM process plays an important role because it greatly affects the quality of product dimensions.
Lee and Li [2] presented a computer-aided tool design program for EDM electrodes. This program uses a method that continuously divides the machining zone into regions till the electrodes are created. The tool was built and integrated into a famous computer-aided design (CAD)/computer-aided manufacturing (CAM) system. According to the performance statistics, the effectiveness of the design can be increased by 50%, with the potential to increase to 85% through improved application and additional experiments.
Khleif and Abdullah [3] studied nine cutting tools made of high-speed steel and a workpiece of 316L using three different spindle speeds and three radial depths of cut. The wear estimation process in the cutting tool was achieved using an optical microscope and vision system. The percentage of errors in the estimated wear width was found to be accepted. MATLAB software is used to predict flank wear.
Kumar et al. [4] conclude with an experimental study of a stainless steel workpiece combined with Taguchi L9 design to use EDM experimentally. The response variables, material removal rate, tool wear rate, and surface roughness are optimized using pulse-on time (Ton), current (A), and voltage (V) as independent factors. The analysis of variance and signal-to-noise ratio were used in this work to determine the best independent variables and their levels.
Khleif and Sabbar [5] enhanced many parameters computed in the EDM process using Taguchi technique. The main objectives are to increase the used material’s removal rate and decrease the tool’s wear rate.
Kumar et al. [6] studied many EDM process parameters and compared those with other EDM machining parameters and found that pulse current is the most important factor. The present work also suggests an optimum design parameter setting for obtaining acceptable dimensional accuracy and surface integrity during the EDM machining of P91 tool steel.
The experimental work of Abdulameer et al. [7] discussed the parameters of EDM on high-speed steel AISI M2 as a workpiece using copper and brass as an electrode. The input parameters used for this work are current, pulse-on time, and pulse-off time, affecting the material removal rate and electrode wear rate. The response surface method, adopting a face-centered central composite design, has been implemented in this work. The experimental results illustrate that the electrode wear rate decreases using the copper electrode.
The objective of Jia et al.’s [8] work is to control the final geometric accuracy of a slot machined using optimized electrical parameters. The main factors peak current and duty factor are influenced by the electrical tip geometry pattern. The experiments were conducted to analyze the pattern of wear corresponding to different levels of the adopted two factors. The results of this work showed the feasibility of adjusting the tip wear pattern.
Aghdeab et al. [9] studied the optimal EDM parameters using a workpiece of AISI M2 and electrodes of copper and brass. The experimental work is achieved using three different values of current, pulse duration, and pulse pause time, respectively, that affect the material removal rate and electrode wear rate. Minitab software is used to analyze the effect of the input on the EDM. The results approved that the max. value of material removal rate and the min. value of electrode wear rate given by the copper electrode.
Pradana et al.’s [10] study aims to investigate the material removal rate and surface roughness using different current and pulse-on times of newly developed Ni and Cu-free Zr-based bulk metallic glasses by sinking-EDM. After the surface roughness test and scanning electron microscopy observation on the workpiece after machining, both material removal rate and surface roughness were increased when the higher current was applied. On the other hand, the longer pulse-on time increased the surface roughness into the higher value but decreased the material removal rate value. On the contrary, the hardness of the surface was enhanced.
Lakra [11] presented a method for producing specific tools in the EDM process by changing the polarity. Changing the polarity involves altering the electron’s route from the electrode to the workpiece and from the workpiece to the electrode. This produces more accurate and simple process to manufacture complicated tools.
Liu et al. [12] have investigated the effects of controlling a servo feed air gap and the electrode in EDM. The experimental setup includes a linear movement with zero backlashes along the x-axis that can be regulated to a resolution of 0.03 mm. The proposed air gap management technique improved this mechanism in machining the used alloy.
A computer vision system is presented by Khleif [13], which includes a camera for taking images and processing using MATLAB package. The wear of electrodes is recognized according to the decrease in electrode length after the EDM process. The proposed investigation results approved the validity of the proposed image-based method compared with other ways.
In the present study, we focused on hole drilling tools. This technology is commonly used in the aerospace and automobile industries, as well as in the high-tech industries [14]. The main purpose of the present work is to investigate the feasibility of EDM electrode wear assessment process using single captured electrode image as a non-contact technique and relatively inexpensive equipment to measure copper electrode wear in EDM process. This digital environment can prevent dozens of mistakes and errors without any loss [15]. Future application areas of the proposed technique may include the dimensional measurement of many manufactured parts, and the area of reverse engineering utilizing CAD/CAM systems [16].
2 Methods and materials
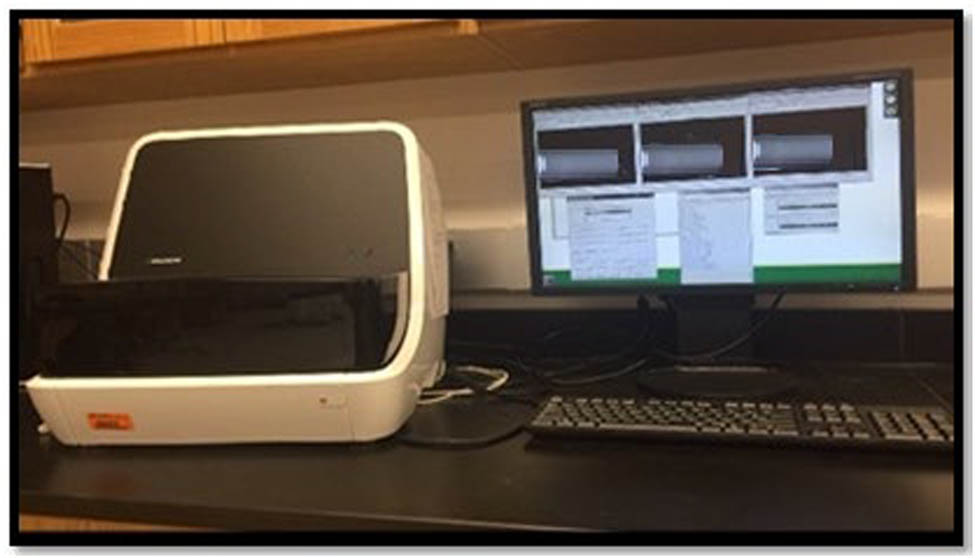
The experimental work of this investigation was conducted on CHEMER EDM type (CM 323C), as presented in Figure 1. In this investigation, rectangular copper electrodes are used with dimensions of 10 mm × 10 mm × 50 mm and dielectric solution (transformer oil) to achieve a 3 mm depth of cut in a steel workpiece of AISI 314. The parameters listed in Table 1 are used in the experimental work.

CHEMER EDM machine.
Response and control parameters
| Coded factor | Actual factor | Parameter (unit) | Actual level | |||
|---|---|---|---|---|---|---|
| 1 | 2 | 3 | 4 | |||
| A | I | Pulse current (A) | 2 | 6 | 10 | 14 |
| B | T on | Pulse time (µs) | 25 | 50 | 75 | 100 |
| C | T off | Pulse time (µs) | 18 | 37 | 50 | 75 |
2.1 Design of experiment (DOE)
Three parameters were chosen to achieve the experimental test of this work, as listed in Table 1. The Taguchi method was used to determine the number of experiments, as shown in Figure 2.

DOE using Taguchi technique.
2.2 Camera setting system
The image processing system used in this work consists of a digital camera model genx GDV fixed on a special fixture to ease the camera’s positioning relative to the tested rectangular electrode, as shown in Figure 3. The camera is linked to the computer using a USB. The acquired information is recorded in pixel units, and the computed wear along the electrode must be in mm units. Hence, the factors of scaling these units were set in mm/pixel units. The camera calibration used is published separately [3]. MATLAB package is used to identify electrode-captured images.

Camera positioning system.
3 Methodology
Sixteen samples of copper electrodes were tested, and their lengths were measured before and after the machining process by a digital caliper and then the average lengths of electrodes were recorded. After this digital caliper measurement process, each tested electrode was scanned before and after the adopted machining process using a laser Straumann scanning model, as shown in Figure 4.
Laser Straumann scanning model.
3.1 Proposed wear recognition algorithm
An image could be treated as a matrix with information, and every matrix contains information about the values of color in each pixel. The image consists of three main colors: red, green, and blue. The black pixel has a (0,0,0) value, the white pixel has (255,255,255), and every color with a range from black to white has values from 0 to 255. The image in grayscale has only one matrix. This information was the basics for preparing a mathematical algorithm for image processing techniques.
3.1.1 Image preprocessing
The colored image of the electrode is captured as shown in Figure 5. The length of EDM electrodes before and after machining is captured using a charged-coupled device camera; the captured image is then processed using the image processing toolbox in the MATLAB package. The resulting images were cropped to 200 × 200 pixel resolution and converted to grayscale and then to binary images using an image thresholding process to reduce the time of manipulation of the captured images. Figure 6 represents the grayscale and the binary images of the tested rectangular electrode, respectively.
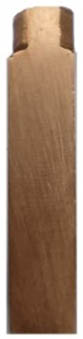
The electrode-colored image.

(a) The electrode grayscale image and (b) the electrode binary image.
Accordingly, the average length of the electrodes computed before the machining process using a digital caliper, laser Straumann scanning model, and the proposed image-based approach is listed in Table 2.
Average length of electrodes measured before machining (mm)
| Sample | Using the digital caliper | Utilizing the laser Straumann scanning model | Using the proposed image-based method |
|---|---|---|---|
| S1 | 50.07 | 50.12 | 49.95 |
| S2 | 50.10 | 49.98 | 50.11 |
| S3 | 50.05 | 50.08 | 50.12 |
| S4 | 50.13 | 50.03 | 50.08 |
| S5 | 50.10 | 50.11 | 50.03 |
| S6 | 50.11 | 50.09 | 49.99 |
| S7 | 49.90 | 50.12 | 50.13 |
| S8 | 50.11 | 50.10 | 50.05 |
| S9 | 50.12 | 50.09 | 50.12 |
| S10 | 50.08 | 50.06 | 50.11 |
| S11 | 50.13 | 50.13 | 50.14 |
| S12 | 50.15 | 50.16 | 50.16 |
| S13 | 50.03 | 50.11 | 50.09 |
| S14 | 50.14 | 50.06 | 49.89 |
| S15 | 50.19 | 50.14 | 50.12 |
| S16 | 50.16 | 50.15 | 50.06 |
3.1.2 Image postprocessing
Image overlapping process for the tested rectangular electrode before and after the machining process can give a new image. This unique image will be scanned row by row along the electrode to recognize the pixel intensity of the image.
An image of eight neighborhoods, as shown in Figure 7, is applied, where the electrode image is a pixel with intensity (0) is recorded then the scan is paused. Hence, the mask is applied to the recorded pixel, where the pixel is located in the center of the show. The cover will start scanning line-by-line to search for any pixel with the intensity of (0) to define this neighborhood as the new mask center. The scanning continues to examine all the neighborhoods with (0) intensity values.
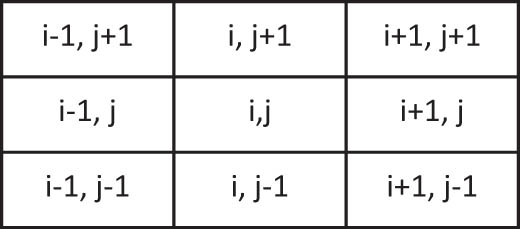
Image of eight-neighborhood mask.
The search process will be continued to cover all the interesting areas, consequently filling the detected wear region in the electrode. Figure 8 illustrates the black part representing wear in the machined rectangular electrode.

Magnified part of electrode image overlapping process.
4 Results and discussion
Although the goal of measuring electrode wear from a single captured image is a challenging problem, the suggested methodology succeeded to achieve close to real measurements. Table 3 illustrates the length values of the tested rectangular electrodes computed after machining, using a digital caliper, laser Straumann scanning model, and the approach for image-based electrode length assessment, respectively; the error absolute values were also calculated between the results of the digital caliper and laser Straumann scanning model, and between digital caliper and the image-based approach, respectively, and the experimental results present very close results with acceptable agreements.
Average lengths of the rectangular electrodes measured after machining (mm)
| Sample | Average length using a digital caliper | Average length using laser Straumann scanning model device | Error (%) | Average measurement using the image method | Error (%) |
|---|---|---|---|---|---|
| S1 | 49.82 | 49.50 | 0.64 | 49.44 | 0.77 |
| S2 | 49.67 | 49.46 | 0.42 | 49.31 | 0.73 |
| S3 | 49.65 | 49.50 | 0.30 | 49.42 | 0.46 |
| S4 | 49.73 | 49.39 | 0.68 | 49.4 | 0.67 |
| S5 | 49.62 | 49.44 | 0.36 | 49.35 | 0.55 |
| S6 | 49.67 | 49.51 | 0.32 | 49.33 | 0.69 |
| S7 | 49.71 | 49.37 | 0.68 | 49.42 | 0.59 |
| S8 | 49.75 | 49.41 | 0.68 | 49.35 | 0.81 |
| S9 | 49.70 | 49.45 | 0.50 | 49.38 | 0.65 |
| S10 | 49.73 | 49.51 | 0.44 | 49.31 | 0.85 |
| S11 | 49.84 | 49.45 | 0.78 | 49.42 | 0.85 |
| S12 | 49.73 | 49.44 | 0.58 | 49.40 | 0.67 |
| S13 | 49.68 | 49.61 | 0.14 | 49.47 | 0.42 |
| S14 | 49.75 | 49.50 | 0.50 | 49.55 | 0.40 |
| S15 | 49.80 | 49.46 | 0.68 | 49.53 | 0.54 |
| S16 | 49.71 | 49.53 | 0.36 | 49.50 | 0.42 |
| Av. | 49.72 | 49.47 | 0.50 | 49.41 | 0.63 |
| Std. dev. | 0.06 | 0.06 | 0.18 | 0.07 | 0.15 |
According to the measurement values and percentage error listed in Table 3, the laser Straumann scanning model values show that the highest percentage error value is 0.78% in sample no. 11, and the lowest value for percentage error measured is 0.14% in sample no. 13. While using the adopted image-based approach, the highest value for the percentage error measured is 0.85% in samples 10 and 11, respectively. In contrast, the lowest value for the error measured is 0.40% in sample no. 14.
These fluctuating values of percentage error are due to the image having some isolated objects with single pixel area because of the image thresholding value and some quantization errors. To overcome this problem, the image morphological opening by reconstruction is done to remove these isolated objects to find focus on the final electrode wear area.
Consequently, results represent common variation in the investigated results from both the laser Straumann scanning model and the proposed image-based method, thus illustrating that resulted values demonstrate good acceptance and present good agreement.
A comparison chart between the resulted wear values from the digital caliper, laser Straumann scanning model, and the proposed image-based approach is shown in Figure 9. According to the presented chart, one can observe a very small variation between the results obtained from the laser Straumann scanning model and the proposed image-based approach values, which approved this approach.
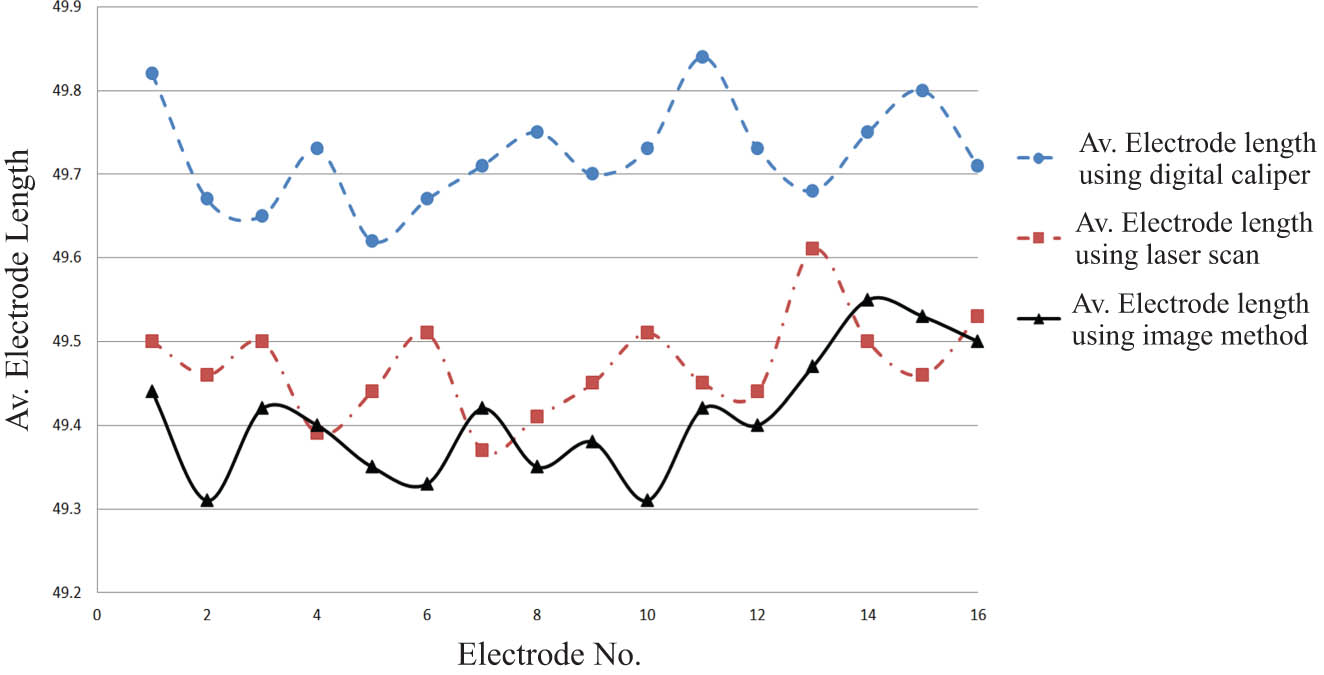
Results of average rectangular electrode lengths measured using the adopted methods (mm).
Table 4 and Figure 10 list and demonstrate the rectangular electrode wear computed and recorded using the digital caliper, the laser Straumann scanning model, and the image-based approach. The results observed that the laser Straumann scanning model values and the image-based approach values both agreed to estimate the wear values of the tested rectangular electrodes.
Experimental average values of the electrode wear (mm)
| Sample | Average wear using the digital caliper | Average wear using the laser Straumann scanning model | Average wear using an image approach |
|---|---|---|---|
| S1 | 0.23 | 0.41 | 0.45 |
| S2 | 0.21 | 0.43 | 0.50 |
| S3 | 0.27 | 0.37 | 0.46 |
| S4 | 0.24 | 0.43 | 0.49 |
| S5 | 0.30 | 0.46 | 0.53 |
| S6 | 0.25 | 0.50 | 0.59 |
| S7 | 0.26 | 0.45 | 0.60 |
| S8 | 0.26 | 0.52 | 0.62 |
| S9 | 0.20 | 0.52 | 0.54 |
| S10 | 0.27 | 0.46 | 0.57 |
| S11 | 0.24 | 0.49 | 0.60 |
| S12 | 0.28 | 0.44 | 0.58 |
| S13 | 0.26 | 0.48 | 0.63 |
| S14 | 0.23 | 0.48 | 0.55 |
| S15 | 0.22 | 0.46 | 0.52 |
| S16 | 0.25 | 0.44 | 0.52 |
| Av. | 0.25 | 0.46 | 0.55 |
| Std. dev. | 0.03 | 0.04 | 0.05 |
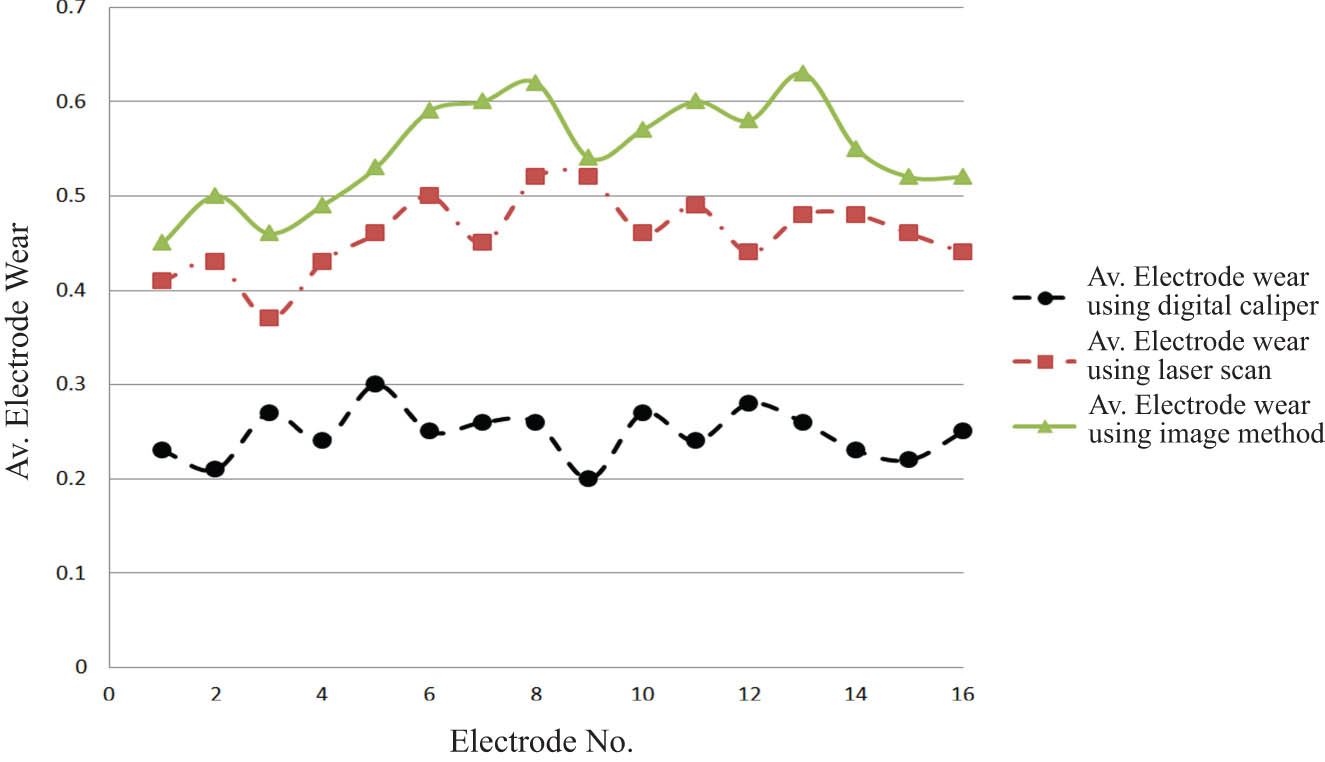
The average rectangular electrode wear measured using the adopted methods (mm).
Based on the conducted experiments, it can be observed that the electrode boundary in the captured image is more prone to false feature extraction than the pixels inside the electrode area due to the image quality and the selected value of image threshold. These erroneous pixels may have a cumulative influence on the feature attribute assignment process and therefore may affect the electrode wear measurement process.
5 Conclusions
High levels of wear will result from a considerable increase in product surface roughness and dimensional inaccuracy. In this experimental investigation, an image-based rectangular electrode wear measurement method was proposed and executed to measure the electrode wear in the EDM process.
To ensure the effectiveness of the proposed image processing technique used in the experimental work of this investigation, the results derived from this method were compared with those derived from other methods by using the digital caliper and the laser Straumann scanning model method. The obtained results indicated that the proposed image processing technique is accurate and reliable for measuring the wear in rectangular EDM electrodes using a non-contact system and inexpensive equipment and give a quite satisfactory and close agreement between the adopted measurement methods.
-
Conflict of interest: The author states no conflict of interest.
-
Data availability statement: Most datasets generated and analyzed in this study are included in this submitted manuscript. The other datasets are available on reasonable request from the corresponding author with the attached information.
References
[1] Equbal A, Dixit NK, Sood AK. Rapid prototyping application in manufacturing of EDM Electrode. Int J Sci Eng Res. 2013;4(8).Search in Google Scholar
[2] Lee YH, Li CL. Automation in the design of EDM electrodes. Comput Des. 2009;41(9):600–13.10.1016/j.cad.2009.04.004Search in Google Scholar
[3] Khleif AA, Abdullah MA. Computer aided flank wear measurement in end milling cutting tool. Eng Technol J. 2016;34(5Part (A)):959–72.10.30684/etj.34.5A.13Search in Google Scholar
[4] Kumar J, Soota T, Khan F. Optimization of EDM process parameter for stainless steel D3. Mater Today Proc. 2019;635–8.10.1016/j.matpr.2019.07.529Search in Google Scholar
[5] Khleifa AA, Sabbar OS. Electrode wear evaluation in EDM process. Eng Technol J. 2019;37(2C):252–7.10.30684/etj.37.2C.9Search in Google Scholar
[6] Kumar P, Dewangan S, Pandey C. Analysis of surface integrity and dimensional accuracy in EDM of P91 steels. Materials Today: Proceedings; 2020.10.1016/j.matpr.2020.03.119Search in Google Scholar
[7] Abdulameer AG, Aghdeab SH, Kashkool LH. Comparison of the use of two types of electrodes in the EDM process and using the surface response program. J Mech Eng Res Dev. 2020;43(6):81–93.Search in Google Scholar
[8] Jia Y, Chi G, Li W, Wang Z, Cui L. Influence of wear pattern of graphite electrode on edm geometric accuracy of slot machining. 20th CIRP Conference on Electro Physical and Chemical Machining, Science Direct Procedia; 2020. Vol. 95. p. 408–13.10.1016/j.procir.2020.02.265Search in Google Scholar
[9] Aghdeab SH, Khudhier WS, Elias RR. Experimental study on electrodes types in electrical discharge machining (EDM) of high-speed steel. International Conference on Sustainable Engineering Techniques (ICSET 2020) IOP Conf. Series: Materials Science and Engineering. IOP Publishing; 2020. 10.1088/1757-899X/881/1/012077.Search in Google Scholar
[10] Pradana YR, Ferara A, Aminnudin A, Wahono W, Jang JS. The effect of discharge current and pulse-on time on biocompatible Zr-based BMG sinking-EDM. Open Eng. May 17, 2020;10(1):401–7.10.1515/eng-2020-0049Search in Google Scholar
[11] Lakra S. A technique of tool manufacturing by changing the polarity of EDM. Int J Emerg Trends Eng Res. 2021;9(5):587–91.10.30534/ijeter/2021/09952021Search in Google Scholar
[12] Liu S, Thangaraj M, Moiduddin K, Al-Ahmari AM. Influence of adaptive gap control mechanism and tool electrodes on machining titanium (Ti-6Al-4V) alloy in EDM process. Materials. 2022;15(2):513.10.3390/ma15020513Search in Google Scholar PubMed PubMed Central
[13] Khleif AA. Computer vision aided electrode wear estimation in electrical discharge machining process. J Eng Sci Technol. 2022;17(1):197–206.Search in Google Scholar
[14] Morozow D, Barlak M, Werner Z, Pisarek M, Konarski P, Zagórski J. Wear resistance improvement of cemented tungsten carbide deep-hole drills after ion implantation. Materials. 2021;14(2):239. 10.3390/ma14020239.Search in Google Scholar PubMed PubMed Central
[15] Anczarski J, Bochen A, Głąb M, Jachowicz M, Caban J, Cechowicz R. A method of verifying the robot’s trajectory for goals with a shared workspace. Appl Comput Sci. 2022;18(1):37–44. 10.35784/acs-2022-3.Search in Google Scholar
[16] Bednarz A, Frącz W, Janowski G. The use of image analysis in evaluating the fibers orientation in Wood-polymer composites (WPC). Open Eng. 2016;6:737–41.10.1515/eng-2016-0099Search in Google Scholar
© 2023 the author(s), published by De Gruyter
This work is licensed under the Creative Commons Attribution 4.0 International License.
Articles in the same Issue
- Regular Articles
- Design optimization of a 4-bar exoskeleton with natural trajectories using unique gait-based synthesis approach
- Technical review of supervised machine learning studies and potential implementation to identify herbal plant dataset
- Effect of ECAP die angle and route type on the experimental evolution, crystallographic texture, and mechanical properties of pure magnesium
- Design and characteristics of two-dimensional piezoelectric nanogenerators
- Hybrid and cognitive digital twins for the process industry
- Discharge predicted in compound channels using adaptive neuro-fuzzy inference system (ANFIS)
- Human factors in aviation: Fatigue management in ramp workers
- LLDPE matrix with LDPE and UV stabilizer additive to evaluate the interface adhesion impact on the thermal and mechanical degradation
- Dislocated time sequences – deep neural network for broken bearing diagnosis
- Estimation method of corrosion current density of RC elements
- A computational iterative design method for bend-twist deformation in composite ship propeller blades for thrusters
- Compressive forces influence on the vibrations of double beams
- Research on dynamical properties of a three-wheeled electric vehicle from the point of view of driving safety
- Risk management based on the best value approach and its application in conditions of the Czech Republic
- Effect of openings on simply supported reinforced concrete skew slabs using finite element method
- Experimental and simulation study on a rooftop vertical-axis wind turbine
- Rehabilitation of overload-damaged reinforced concrete columns using ultra-high-performance fiber-reinforced concrete
- Performance of a horizontal well in a bounded anisotropic reservoir: Part II: Performance analysis of well length and reservoir geometry
- Effect of chloride concentration on the corrosion resistance of pure Zn metal in a 0.0626 M H2SO4 solution
- Numerical and experimental analysis of the heat transfer process in a railway disc brake tested on a dynamometer stand
- Design parameters and mechanical efficiency of jet wind turbine under high wind speed conditions
- Architectural modeling of data warehouse and analytic business intelligence for Bedstead manufacturers
- Influence of nano chromium addition on the corrosion and erosion–corrosion behavior of cupronickel 70/30 alloy in seawater
- Evaluating hydraulic parameters in clays based on in situ tests
- Optimization of railway entry and exit transition curves
- Daily load curve prediction for Jordan based on statistical techniques
- Review Articles
- A review of rutting in asphalt concrete pavement
- Powered education based on Metaverse: Pre- and post-COVID comprehensive review
- A review of safety test methods for new car assessment program in Southeast Asian countries
- Communication
- StarCrete: A starch-based biocomposite for off-world construction
- Special Issue: Transport 2022 - Part I
- Analysis and assessment of the human factor as a cause of occurrence of selected railway accidents and incidents
- Testing the way of driving a vehicle in real road conditions
- Research of dynamic phenomena in a model engine stand
- Testing the relationship between the technical condition of motorcycle shock absorbers determined on the diagnostic line and their characteristics
- Retrospective analysis of the data concerning inspections of vehicles with adaptive devices
- Analysis of the operating parameters of electric, hybrid, and conventional vehicles on different types of roads
- Special Issue: 49th KKBN - Part II
- Influence of a thin dielectric layer on resonance frequencies of square SRR metasurface operating in THz band
- Influence of the presence of a nitrided layer on changes in the ultrasonic wave parameters
- Special Issue: ICRTEEC - 2021 - Part III
- Reverse droop control strategy with virtual resistance for low-voltage microgrid with multiple distributed generation sources
- Special Issue: AESMT-2 - Part II
- Waste ceramic as partial replacement for sand in integral waterproof concrete: The durability against sulfate attack of certain properties
- Assessment of Manning coefficient for Dujila Canal, Wasit/-Iraq
- Special Issue: AESMT-3 - Part I
- Modulation and performance of synchronous demodulation for speech signal detection and dialect intelligibility
- Seismic evaluation cylindrical concrete shells
- Investigating the role of different stabilizers of PVCs by using a torque rheometer
- Investigation of high-turbidity tap water problem in Najaf governorate/middle of Iraq
- Experimental and numerical evaluation of tire rubber powder effectiveness for reducing seepage rate in earth dams
- Enhancement of air conditioning system using direct evaporative cooling: Experimental and theoretical investigation
- Assessment for behavior of axially loaded reinforced concrete columns strengthened by different patterns of steel-framed jacket
- Novel graph for an appropriate cross section and length for cantilever RC beams
- Discharge coefficient and energy dissipation on stepped weir
- Numerical study of the fluid flow and heat transfer in a finned heat sink using Ansys Icepak
- Integration of numerical models to simulate 2D hydrodynamic/water quality model of contaminant concentration in Shatt Al-Arab River with WRDB calibration tools
- Study of the behavior of reactive powder concrete RC deep beams by strengthening shear using near-surface mounted CFRP bars
- The nonlinear analysis of reactive powder concrete effectiveness in shear for reinforced concrete deep beams
- Activated carbon from sugarcane as an efficient adsorbent for phenol from petroleum refinery wastewater: Equilibrium, kinetic, and thermodynamic study
- Structural behavior of concrete filled double-skin PVC tubular columns confined by plain PVC sockets
- Probabilistic derivation of droplet velocity using quadrature method of moments
- A study of characteristics of man-made lightweight aggregate and lightweight concrete made from expanded polystyrene (eps) and cement mortar
- Effect of waste materials on soil properties
- Experimental investigation of electrode wear assessment in the EDM process using image processing technique
- Punching shear of reinforced concrete slabs bonded with reactive powder after exposure to fire
- Deep learning model for intrusion detection system utilizing convolution neural network
- Improvement of CBR of gypsum subgrade soil by cement kiln dust and granulated blast-furnace slag
- Investigation of effect lengths and angles of the control devices below the hydraulic structure
- Finite element analysis for built-up steel beam with extended plate connected by bolts
- Finite element analysis and retrofit of the existing reinforced concrete columns in Iraqi schools by using CFRP as confining technique
- Performing laboratory study of the behavior of reactive powder concrete on the shear of RC deep beams by the drilling core test
- Special Issue: AESMT-4 - Part I
- Depletion zones of groundwater resources in the Southwest Desert of Iraq
- A case study of T-beams with hybrid section shear characteristics of reactive powder concrete
- Feasibility studies and their effects on the success or failure of investment projects. “Najaf governorate as a model”
- Optimizing and coordinating the location of raw material suitable for cement manufacturing in Wasit Governorate, Iraq
- Effect of the 40-PPI copper foam layer height on the solar cooker performance
- Identification and investigation of corrosion behavior of electroless composite coating on steel substrate
- Improvement in the California bearing ratio of subbase soil by recycled asphalt pavement and cement
- Some properties of thermal insulating cement mortar using Ponza aggregate
- Assessment of the impacts of land use/land cover change on water resources in the Diyala River, Iraq
- Effect of varied waste concrete ratios on the mechanical properties of polymer concrete
- Effect of adverse slope on performance of USBR II stilling basin
- Shear capacity of reinforced concrete beams with recycled steel fibers
- Extracting oil from oil shale using internal distillation (in situ retorting)
- Influence of recycling waste hardened mortar and ceramic rubbish on the properties of flowable fill material
- Rehabilitation of reinforced concrete deep beams by near-surface-mounted steel reinforcement
- Impact of waste materials (glass powder and silica fume) on features of high-strength concrete
- Studying pandemic effects and mitigation measures on management of construction projects: Najaf City as a case study
- Design and implementation of a frequency reconfigurable antenna using PIN switch for sub-6 GHz applications
- Average monthly recharge, surface runoff, and actual evapotranspiration estimation using WetSpass-M model in Low Folded Zone, Iraq
- Simple function to find base pressure under triangular and trapezoidal footing with two eccentric loads
- Assessment of ALINEA method performance at different loop detector locations using field data and micro-simulation modeling via AIMSUN
- Special Issue: AESMT-5 - Part I
- Experimental and theoretical investigation of the structural behavior of reinforced glulam wooden members by NSM steel bars and shear reinforcement CFRP sheet
- Improving the fatigue life of composite by using multiwall carbon nanotubes
- A comparative study to solve fractional initial value problems in discrete domain
- Assessing strength properties of stabilized soils using dynamic cone penetrometer test
- Investigating traffic characteristics for merging sections in Iraq
- Enhancement of flexural behavior of hybrid flat slab by using SIFCON
- The main impacts of a managed aquifer recharge using AHP-weighted overlay analysis based on GIS in the eastern Wasit province, Iraq